characteristics and compositions of solid waste in nassiriya city
13
Al-Qadisiya Journal For Engineering Sciences Vol. 2 No. ٢ Year 2009 136 CHARACTERISTICS AND COMPOSITIONS OF SOLID WASTE IN NASSIRIYA CITY Ryidh A. Yasir Zaidun Naji Abudi Thi-Qar University Al-Mustansiryiah University Marshes Research Centre College of Engineering Abstract: The improving of living condition and increasing of population density growth assist in increase the quantity and quality of domestic solid waste in households in Nassiriya city. A samples of solid waste have been collected from households in Nassiriya city to know the quantity of solid waste generated. Households classified into three zones according to economic status (high, middle and low income levels). Samples collected for seven months, from January to July 2008. This paper explains that the generation rate of solid waste for person or capita changes from each income level to another and from month to other and we can represent 0.68 kg/cap./day as average of domestic solid waste generated in present time in city, the quantity of solid waste generated in Nassiriya city is equal to 22.15 ton/day this only for domestic waste (solid waste from commercial, industrial and medical waste not reported in this paper). Value of density was calculated is equal to 275.33 kg/m 3 , the percent of each individual component for solid waste components also calculated and for seven months for each income level. These percent shows that the most common components is organic (food) waste which is participle and its percent in range of (61.88 % to 69.95 %) and these value is similar with other results in other cities of Iraq. The compressive of results of this paper with other results shows its similar to Iraqi cities and differs to Europe united cities. Keyword: Solid Waste management, Waste composition and characteristics, Nassiriya city ا ت ات اآاص و . . ) ( .
Transcript of characteristics and compositions of solid waste in nassiriya city

Al-Qadisiya Journal For Engineering Sciences Vol. 2 No. ٢ Year 2009
136
CHARACTERISTICS AND COMPOSITIONS OF
SOLID WASTE IN NASSIRIYA CITY
Ryidh A. Yasir Zaidun Naji Abudi
Thi-Qar University Al-Mustansiryiah University
Marshes Research Centre College of Engineering
Abstract:
The improving of living condition and increasing of population density growth assist in
increase the quantity and quality of domestic solid waste in households in Nassiriya city.
A samples of solid waste have been collected from households in Nassiriya city to
know the quantity of solid waste generated. Households classified into three zones according
to economic status (high, middle and low income levels). Samples collected for seven
months, from January to July 2008.
This paper explains that the generation rate of solid waste for person or capita changes
from each income level to another and from month to other and we can represent 0.68
kg/cap./day as average of domestic solid waste generated in present time in city, the quantity
of solid waste generated in Nassiriya city is equal to 22.15 ton/day this only for domestic
waste (solid waste from commercial, industrial and medical waste not reported in this paper).
Value of density was calculated is equal to 275.33 kg/m3, the percent of each individual
component for solid waste components also calculated and for seven months for each income
level. These percent shows that the most common components is organic (food) waste which
is participle and its percent in range of (61.88 % to 69.95 %) and these value is similar with
other results in other cities of Iraq.
The compressive of results of this paper with other results shows its similar to Iraqi
cities and differs to Europe united cities.
Keyword: Solid Waste management, Waste composition and characteristics, Nassiriya city
�$ � ا� �)�$� '8 �� اص و�آ��ت ا� &�$�ت ا��.# � �� ���� *��� +���� ���� ����$
��, +- %"��� %��(� ��� %"�����
����.� &���� $��� % ����� %�!�
/! ���
�������� ����� ������ ����� ����� ����� �� ���� ������� ������ ������ ������� ����� ���� !
������� ����� �� ������� . �� #�$ %� �������� ������ �� &����� � ������� ���� ������ ���� ������ �� .
������'( ���)� *�� �����(� +���� ,-� *� ������ ��') �/����� ������ 0����� ( 2������� +����� *�
&3�� ����4 +����� ������ �/���� . �� ���� �5� � �5� ��� ���� ����� ����� ����� �5�� *� ���

Al-Qadisiya Journal For Engineering Sciences Vol. 2 No. ٢ Year 2009
137
6778 . )4�9 ����� ! �:� � ��;�� �)�� <3�� �=���� ��� ������ &��� *�! 0�39 �5� �� *�! ��39
%'� ����� ����7.>8 %;� /<3��/ ������� ����� @�� A�B� �4�)� '�� �� ������� ������� &���� %���
��ا� ����� ������� � iP ا���2زل �٢٢.١٥ /w / ت�f$�(2��24�� وا�fوا� �f$ا ا�2)�$�ت ا����ر�� �$�J�2�2 ا�$�ا���م �
�� ا������ة / ا����R)��ت Qا��Q��>ا��4��وا .
��9 %� �/� ���� ������ ����� ���' �=��$�! �$�� �5�! C���� 6DE.FF %;� /%F ����� G��) %� ���
�� � ��� &�� ���:�� ���� ������ ����5�H�� &�� ���� &���� C������ ��)�( G��) %� ��� ����
&3�� �:� � �:� &�� ��� . ���:�� G��� �� �'� ! ����� ���/� ���4�� ������ �= ������� ��:��� ����
� )��� ����61.88%) *�! 69.95 % (�� #� I���� ���� JB=� G�0�3K %� ��� �=��$�! �� ���� �'�
��'���.
L:��� � ����� �� #� ,)� B= �� �5��� &��)� %� ��� L:���� ����/� %� ���%�'�9� ���� �/��� ����� �
��$9 �� *�� 0�39 �'� +��� � �5�9%�/� JB= #� �55��� ��)�( �� �� �5�-��� � �5�-�3� ���K .
Introduction:
Solid waste is any solid material that is disposed of because it has no further use to
society in its present form. In more specific terms, the U.S. EPA has defined a solid waste as
"any discarded material, including solid, liquid, semi-solid, or contained gaseous material
resulting from industrial, commercial, mining, agricultural operations and from community
activities" ( Bishop, 2000).
Solids wastes are produced wherever man is found farms, mines, stores, offices
factories, homes, hospitals, streets, and even the primitive encampments of traditional
nomads(Rao, 1994).
Data on the amount, sources and characteristics of refuse in a city should be the basis
to the planning, designing and satisfactory operation of solid waste management (storage,
collection, transport, and disposal) systems and the application of disposal methods. Essential
data can be gathered through physical survey. The quantity and quality of solid waste
generated may be affected seriously by local conditions (climate, seasons, socioeconomic
conditions, income levels, etc.) and the type and activity of the source (Kirov, 1975).
Domestic or households Solid waste is managed by the Ministry of Municipalities and Public
Works .
It is necessary to have a detailed study about area land use in any city in order to know
the size and quantity of solid waste generated and to determine the way of collecting and
treatment it. Figure (1) shows the current and suggested use of land in all sectors of the city
according to the master plan.
It is noticed that the area of land used for residential is about 15.82 km2 and it
represents about 28% from the total area, while the area used for the commercial activities is
about 5.٦٥ km2 and it represents to 10% and it is focused in the old part of the city (old city
square).
The area of land used for industrial purpose is about (2.61 km2) and represents 4% of
the total area of the city, the major industrial activities are: Ur State Establishment for
Mechanical Industries contains three large industrial (Aluminum Processing Plant. Cable
Plant, Wood Role Plant), Nassiriyah Textile factory, Thi Qar Oil Refinery, Thermo Power
Station and The Asphalt Plant.
There is also about 2.6 km2 and represents 4% from the total area is dedicated for
industrial storage, moreover there is an industrial site about 1.3 km2 and represents 1% form

Al-Qadisiya Journal For Engineering Sciences Vol. 2 No. ٢ Year 2009
138
the total area and the most workshops of car maintenance and repairing are concentrated in
this area, the majority of waste generated in this area are un useful part of cars and scrap.
The public services cover about 9.2 km2 and represents 15% from the total area and
there is area concerned with the service sector covers 3.1 km2 which equal to 7 % of total
area. The green areas cover about 6.05 km2 and this represents 11% form the total area,
where the water surface (Euphrates River and main out fall drain) covers area of 3.07 km2
which equal to 5% of total area. The future expanding will be about 7.6 km and that will
represent 14% from the total area.
Scope Of Work:
Nassiriyah City the centre of Thi Qar Governorate and it lays on south of Iraq at about
360 km south east to Baghdad, between 30◦ 56˝ to 30
◦ 59˝ in north and on 46
◦ 15˝ in east .
According to the Central Census Organization (2008), the total population of
Nassiriyah city is about 472000 person, distributed as (423500 are in urban areas, while
48500 are in the rural areas. The total area of An Nassiriyah, according the to master plan, is
about 57 km2 and the total number of houses 48500 house (Nassiriyah municipality office).
Waste Collecting Processing In Nassiriyah City:
An Nassiryiyah Municipality office is responsible for solid waste management
(collecting, transportation and disposal) the municipality divided city to seven sector in order
to facilitate solid waste management, theses sectors are:
1. The Old City Square Sector: it includes the quarters of Tammoz, Al Sherqiya, Al
Majed, Nissan, Aledarah el mahaliya and Al Bashaer. These
quarters are among the high income and it includes the commercial
center of the city and other governmental offices.
2. Al Salihiya Sector: it includes the quarters of Al Salihiya, Al Shuhada and Al Hussien.
3. Al Sader Sector: it includes the quarters of Al Sader, Al Rafidain and Ur, this sector
covers also the main terminal and many governmental offices.
4. Sumer Sector : includes the quarters of Sumer, Al Muaalmeen and Arido.
5. Khalf El Sareea Sector: It includes the quarters of Al Zahraa, Al Tadhiya, Al Buqaa
and Al Fida’a.
6. Al Thawra Sector: it includes the quarters of Al Thawra, Al Mansoriya, Baghdad
Street. Al Mutanazah, Al Taqa and Al Eqtisadiyeen.
7. Al Shimookh Sector: it includes the quarters of Shimookh, Shuala, Iskan Qadeem,
Isakn Sinaee and Imarat el Sakaniya. The Headquarter of Thi Qar
University with some colleges and most large industrial plants in
addition to the main stadium located in this sector .
The main equipments used in solid waste collection are:
- tractor 4 ton capacity.
- Ordinary truck 2 ton capacity.
- waste collection Truck ( 4 and 8 ton capacity).
- trolley.
- Waste truck (for bulk transportation).
Methodology:
Information about the population, were collected and classified into three groups of
income: high, middle and low.
Three regions were selected to conduct the study on. Samples were taken randomly but
according to the different socio levels, Figure (2) shows the master plan (essential design) for

Al-Qadisiya Journal For Engineering Sciences Vol. 2 No. ٢ Year 2009
139
Nassiriya city including location of sampled areas for low-income, middle-income and high-
income level, major dumping / landfill areas and industrial site.
Random samples were gathered from each region and from the three different
income levels (see Table (1)) provided samples plastic bags were distributed to the selected
households to collect its waste in and number of occupants was recorded. Bags are to be
collected each the other day and replaced by another; and so on for seven months in each of
income level. Collection crews transferred the plastic bags of wastes from nominated houses,
weighed individually and labeled according to its socio-economic classification.
The monthly samples collected from the nominated houses were weighed and
randomly mixed, the basic weight was hand sorted into nine individual components making
up the two broad categories of combustible and non –combustible as follows:
(a) Combustibles
(i) Organic (putrescible): including all wastes from selling, preparation, cooking, and
serving food.
(ii) Paper: all kind of waste paper, newspapers, and cardboard.
(iii) Plastics: all varieties
(iv) Textiles and Rugs: all textiles, synthetics, wood, leather
(v) Misc. combustibles
(b) Non-combustibles
(i) Tins, cans and metal: ferrous and non-ferrous
(ii) Glass: non-returnable bottles, soft drink bottles, broken glass, ceramics, ..etc.
(iii) Cleaning waste : garden waste, dust ,etc.
The refuse density was calculated by dividing the total refuse weight by the bulk
volume of the refuse.
Results:
1 Waste Generation Rate:
Generation rate is represent quantity of wastes as a function of volume or weight.
Most studies used weight as a function of generation rate because it was not effected by
compaction in transfer process.
Generation rate is very important to design a system of solid waste management and
is effected by many local factors, including time of year, habits, education, economic status
of the people, and location. Figures (3, 4) show solid waste generation rates and density in
Nassiriya city obtained in this paper for seven months.
From Figures (5, 6) average solid waste generation rates and density were calculate
as (0.70 kg/capita/day, 293 kg/m3), (0.72 kg/capita/day, 249 kg/m
3), and (0.63 kg/capita/day,
284 kg/m3) for high, middle, and low income levels respectively. Average solid waste
generation rate and density for all city were (0.68 kg/capita/day, 275.33 kg/m3), total solid
waste generation for Nassiriya city was (221467.7 kg/day).
Quantities of solid wastes vary considerably in composition and quantity depending
on the economic status and ethnic composition. Quantities also vary with seasons,
horticultural choices, and geographical characteristics of land, rainfall, climate, and habits of
people: what they eat, drink and the packaged materials they buy. Variations also depend on
the availability of fresh fruits and vegetables. Residents of large cities and towns tend to
throw away more than residents of small towns and villages do (CEHA, 1995).
There is considerable confusion on generation rates of solid waste. This is because of
the different methods of measurement and different waste classification adopted for reporting
data. The reason for measuring generation rates is to obtain data that can be used to determine

Al-Qadisiya Journal For Engineering Sciences Vol. 2 No. ٢ Year 2009
140
the total amount of wastes to be measured. Therefore, in any solid waste management study,
extreme care must be exercised in allocating funds and deciding what actually needs to be
known.
The value of generation rate in summer season higher than it in winter season, the
reason for this summer in Iraq increasing in production food spatially Vegetables and fruits .
Different generation rates were obtained through studies carried out in some Iraqi
governorates at different time of the year. Generation rates varied from 0.35 kg/capita/day
for Faluja city (Al-Jumaily, 1998) to 0.420 kg/capita/d. for Najaf (Hamoud, 2005) to 0.7
kg/c/day for Baghdad (Qasir, 1978). Table (2) shows a clear comparison in solid waste
generation rates throughout the Iraqi governorates.
2 Density:
Knowledge of this property of waste is needed for any transportation or dumping
operation. Also of importance is the trend for the bulk density to decrease with the growing
proportion of paper and plastics in refuse. The relationship between bulk density and applied
load is of special interest to municipal authorities due to the increasing use of compaction
vehicles to collect domestic waste (Kirov, 1975).
Density (D) was measured by using a cylindrical container of 0.0185 m3 volume
(V). The container was filled by the shovel; with out compressing it, the container was rocked
back and forth for several times during filling then weighed of it (W) to find the density of
the wastes using the equation (1):
D = W / V (1)
Data of density were drawn in the Figures (4, 6) for each income level, the average
density of the different income levels varied between (232) and (335) kg/m3 for low-income
level, and between (215) and (281) kg/m3 for Middle-income level, and between (243) and
(368) kg/m3 for high-income level, while the highest average density value that is (368)
kg/m3 for high income level in January month. Table (3) show a comparison of the average
densities for cities in Iraq with values of density appears in this paper.
3 Waste Composition:
Unfortunately, information regarding the composition of the urban wastes in Iraq is
not generally available, as the municipalities do not carry out regular analysis. In fact, wastes
are very heterogeneous in composition, and the geographical, temporal, and seasonal
variations in its composition make it difficult to define a "typical waste". However, there are
some studies carried out in some governorates through out of Iraq at different time of the
year. As for example, Al-Najar (Al-Najar, 1998) indicated an organic content of 63%,
and a waste density of 469 kg/m3. Hamoud (Hamoud, 2005) indicated an organic content of
69.03% in Al-Najaf city, while Al-jumaily (Al-Jumaily, 1998) declared that the most
common category in the composition of Faluja municipal waste is the food waste (70.6) %.
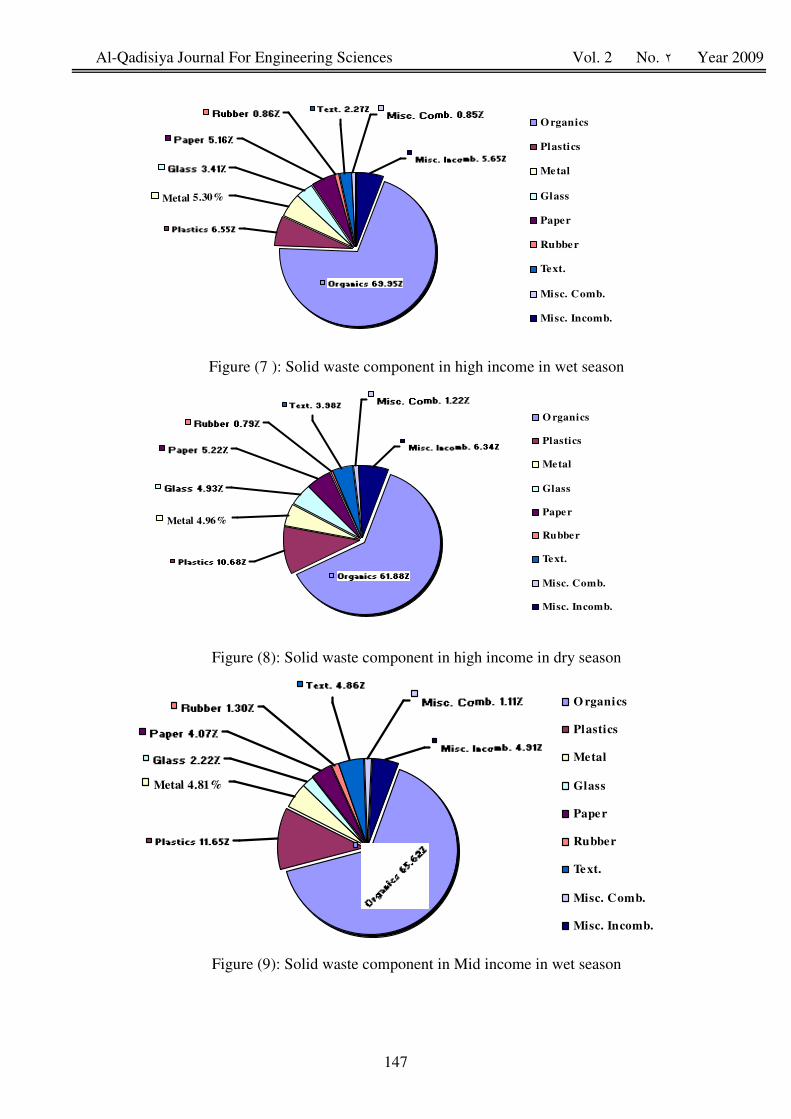
In this paper from data shown in Figures (7, 8, 9, 10, 11, and 12) concluded that the
most common category in the composition of municipal waste is the food waste the range of
it varies from (61.88%) in high income in dry season to 69.95 % in high income in wet
season also we show that the percent of organic waste in the wet season is higher than its
percent in dry season because of increasing the value of moisture content in waste in wet
season. The range of percentage of plastic waste is varies from 4.36% in low income in wet
season to 10.68 % in high income in wet season the reason of this variation in wet season
using of juice and drinking which put in the plastic material in additional to the socio and
economical condition.
Al-Qadisiya Journal For Engineering Sciences Vol. 2 No. ٢ Year 2009
141
Average value of percent for metal waste appear a few difference from season to
season for the three income level (5.3, 4.44 and 4.77) for high, middle and low income level
respectively in wet season, while in dry season its percent was (4.96, 4.76 and 4.60)
respectively the reason of this all people in different income level using matter covered with a
metal cover in both two seasons. Percentage of glass waste is (3.41, 3.81 and 5.21) in wet
season where in dry season the values of percentage are (4.93,4.75 and 5.12) for each income
level respectively. For paper waste the percent is (5.16, 3.85 and 4.57 ) in wet season, in dry
season (5.22, 5.04 and 4.27) respectively for each income level. The percent of rapper and
Combustibles waste is in range of (0.79 to 2.24), the average percent of textile waste is
varies from (2.27 %) in high income level to 3.25% in low income level in wet season, in dry
season it varies from 2.72 in low income level to 3.98 % in high income level).
Incombustible waste contains cleaning waste, garden waste, dust, etc. The percent of these
waste is (5.65, 5.01 and 4.54) in wet season, in dry season (6.34, 7.73 and 6.83 %) for each
income level, the values of these waste in dry season is more than its values in wet season
because increasing the sand storm in summer season in Nassiriya city.
Table (4) gives the composition of wastes in some governorate of Iraq and a
comparison is made with the urban solid waste from a typical European cities. As is seen in
Table (4) average paper contents in Iraq cities is about 3 to 5 percent as compared with about
27 percent for a typical European cities. It has been found that as the personal income rises,
kitchen wastes decline but the paper, metals and glass wastes increase; the total weight
generated rises but the density of the wastes decline (Rao, 1994).
Conclusions:
1. The average daily waste generated in Nassiriya city was 0.68 Kg/capita, where the
average value of density is 275.33 kg/m3 and it is similar to the other values of
densities in other Iraq cities.
2. The total yearly solid waste generated in Nassiriya is approach to 8063 ton/year.
3. The largest component of solid waste generated in Nassiriya household is the food
wastes (70.18%), plastic (6.75%), metal (3.55%), glass (3.95%), paper (3.42%),
rubber (0.24%), textile (0.89%), miscell. (2.54%), and unmiscell. (garden waste)
(3.89%).
4. The solid waste generated in Nassiriya influced with the economic statues. The
amount of solid waste generated in high income was (37.57 ton/day), while in the
low income was (79.75 ton/day).
References:
1. Al-Jumaily, Suhaib Khalid "Study and evaluation of solid waste collection and disposal
System at Fluja City and its Environmental Influences on the Area" A thesis submitted
to the college of engineering of the University of Baghdad for the Master of Science in
Environment eng., (1998).
2. Al-Najar, waleed Muhammad Selman,"A study of collection and treatment of solid waste
for Kurkuk city and its environmental impact" A thesis submitted to the college of
engineering of the University of Baghdad for the Master of science in Environment eng.,
(1998)
3. Bishop, Paual L. "Pollution Prevention: Fundamentals and Practice" McGraw-HILL
INTERNATIONAL EDITIONS, 2000.

Al-Qadisiya Journal For Engineering Sciences Vol. 2 No. ٢ Year 2009
142
4. CEHA, "Solid waste management in some countries of Eastern Mediterranean Region"
CEHA, Amman, Jordan, 1995
5. Dheyaa, etc, "Characteristics and Compositions of Solid Waste in Baghdad", Second
International Symposium on Energy from Biomass and Waste, Venice , Italy, 2008.
6. Environmental Management in Developing Countries "Waste Management" Institute for
Scientific Co-operation , Tubingen . volume 2 1995.
7. Hamoud, Hussein Abdul Muttalib, "Assessment and development of solid wastes
Management in Al-Najaf City" A thesis submitted to the college of engineering of the
University of Baghdad for the Master of science in Environment eng., (2005).
8. Kirov, Y. Nikcolas, "Principles of waste management –unit operations and process"
Kingsway Printers PTY LTD, 1975
9. Qasir, Anwar Jamil Buni, "Refuse Disposal of Baghdad City" A thesis submitted to the
college of engineering of the University of Baghdad for the Master of Science in Civil
eng., (1978).
10. Rao, C,S, "Environmental Pollution Control Engineering" Wiley Eastern Limited ,
1994.
11. Youseif, W. Fwezi "Management, and disposal of Al- Mosul solid waste" A thesis
submitted to the college of engineering of the University of Al-Mosul for the Master of
Science in Civil eng., (1988).
Table (1) Social properties of households of sampling
Low Mid High
Min. Avg Max. Min. Avg Max. Min. Avg Max.
Income level
Properties 3 6 11 3 7 16 3 7 14 Household size, person
25 25 15 Total Number of
households of sampling
135 182 100 Total person in
households of sampling

Al-Qadisiya Journal For Engineering Sciences Vol. 2 No. ٢ Year 2009
143
Table (2) Generation rates in some Iraqi governorates including
the recent study results
Gov./City
Mosul
(Youseif,
1988)
Baghdad
(Dheyaa,
2008)
Kirkuk
(Al-Najar,
1998)
Najaf
(Hamoud,
2005)
Faluja
(Al-Jumaily,
1998)
Nassiriya
Gen. rate
kg/capita/d 0.54 1.11 0.44 0.42 0.32 0.68
Year 1988 2002 1998 2004 2005 2008
Table (3) Density value of solid waste in some Iraqi governorates
City/Stat
e
Mosul
(Youseif,
1988)
Kirkuk
(Al-Najar,
1998)
Baghdad
(Qasir, 1978)
Najaf
(Hamoud
, 2005)
Faluja
(Al-Jumaily,
1998)
Nassiriya
Density
)(kg/m3
280 469 445 473 462.5 275.3
year 1988 1998 1977 2004 2005 2008
Table (4) Components of municipal solid waste as weight percent
in some governorates in Iraq and typical European city
Comp. Baghdad Mosul Kirkuk Faluja Najaf Nassiriya Typical
Europe.
Putrescible
(food) 69.6 81.0 67.5 70.6 69.03 70.18 30
Plastic 5.3 3.0 6.33 8.1 5.09 6.75 3
Metal 2.2 5.4 8.40 1.3 7.09 3.55 7
Glass 2.2 1.0 2.50 2.2 2.71 3.95 11
Paper 5.0 5.0 1.50 2.6 3.06 3.42 27
Rubber ----- ------ ------ ------ ------ 0.24
Textile 3.0 1.5 2.50 4.3 3.59 0.89 3
Miscell. ----- -------- -------- ------- ------ 2.54 ------
Un Miscell.
(garden
waste)
5.0 2.9 3.0 1 3.06 3.89 3
Inert 7.7 ---- 4.77 10 4.04 ------ 16
Leather ---- 0.2 2.50 ----- 1.50 ------

Al-Qadisiya Journal For Engineering Sciences Vol. 2 No. ٢ Year 2009
144
Water surfuse
5%
Residential
28%
Industrial site
1%
Industrial
4%
Commercial /
institutional
10%
Industrial Storage
5%
Future expansion
14%
Services sector
6%
Green zone
11%
Public services
15%
Residential
Commercial / institutional
Industrial
Industrial site
Industrial Storage
Public services
Green zone
Future expansion
Water surfuse
Services sector
Figure (1 ): Land use percentage in Nassiriya City
Figure (2): Master plan of Nassiriya City

Al-Qadisiya Journal For Engineering Sciences Vol. 2 No. ٢ Year 2009
145
0.00
0.10
0.20
0.30
0.40
0.50
0.60
0.70
0.80
0.90
Januar
y
Febru
ary
Mar
chApril
May
June
July
Months
So
lid
Wa
ste
Gen
era
tio
n R
ate
(K
g/C
ap
ita/d
ay)
0.0
5.0
10.0
15.0
20.0
25.0
30.0
35.0
40.0
Te
mp
era
ture
(C
)
High Level
Middel Level
Low Level
Temperature
Figure (3): Solid Waste Generation Rate
0
50
100
150
200
250
300
350
400
Janu
ary
Febru
ary
Mar
chApril
May
June
July
Months
Den
sit
y (
kg
/m^
3)
0.0
5.0
10.0
15.0
20.0
25.0
30.0
35.0
40.0
Te
pera
ture
(o
C)
High Level
Middel Level
Low Level
Temperature
Figure (4): Solid Waste Density

Al-Qadisiya Journal For Engineering Sciences Vol. 2 No. ٢ Year 2009
146
Janaury
feberaury
Mar
April
May
June
July
High Incom
e
Mid Inco
me
Low Incom
e
00.10.20.30.40.50.60.70.80.91
High Income
Mid Income
Low Income
Figure (5): Generation rate for each income level
Janaury
feberaury
Mar
April
May
June
July
Hig
h Inc
ome
Mid
Inc
om
e
Low
Inc
ome
200220240260280300320340360380400
High Income
Mid Income
Low Income
Figure (6): density values for each income level
Al-Qadisiya Journal For Engineering Sciences Vol. 2 No. ٢ Year 2009
147
Metal 4.81%
O rganics
Plastics
Metal
Glass
Paper
Rubber
Text.
Misc. Comb.
Misc. Incomb.
Metal 5.30%
Organics
Plastics
Metal
Glass
Paper
Rubber
Text.
Misc. Comb.
Misc. Incomb.
Metal 4.96%
O rganics
Plastics
Metal
Glass
Paper
Rubber
Text.
Misc. Comb.
Misc. Incomb.
Figure (7 ): Solid waste component in high income in wet season
Figure (8): Solid waste component in high income in dry season
Figure (9): Solid waste component in Mid income in wet season

Al-Qadisiya Journal For Engineering Sciences Vol. 2 No. ٢ Year 2009
148
Metal 4.76%
Organics
Plastics
Metal
Glass
Paper
Rubber
Text.
Misc. Comb.
Misc. Incomb.
Misc. Incomb. 4.54%
Org
anic
s 68.
96%
Glass 5.21%
Metal 4.77%
Plastics 4.36%
Paper 4.57%
Text. 3.25%
Rubber 1.85% O rganics
Plastics
Metal
Glass
Paper
Rubber
Text.
Misc. Comb.
Misc. Incomb.
Metal 4.60%
O rganics
Plastics
Metal
Glass
Paper
Rubber
Text.
Misc. Comb.
Misc. Incomb.
Figure (10): Solid waste component in Mid income in Dry season
Figure (11): Solid waste component in Low income in Wet season
Figure (12): Solid waste component in Low income in Dry season