Characterisation of porosity and root growth in a sodic ... · Characterisation of porosity and...
209
Characterisation of porosity and root growth in a sodic texture-contrast soil By Laurence Jassogne This thesis is presented for the degree of Doctor of Philosophy at The University of Western Australia, School of Plant Biology. September 2008
Transcript of Characterisation of porosity and root growth in a sodic ... · Characterisation of porosity and...

Characterisation of porosity and root growth in a sodic texture-contrast soil
By
Laurence Jassogne
This thesis is presented for the degree of Doctor of Philosophy at The University of Western Australia, School of Plant Biology.
September 2008


i
Abstract
In Australia a class of soils known as sodic duplex soils covers approximately 20% of
the continent. Their defining characteristic is a sharp texture contrast between the A (or
E) and B horizon. The upper B horizon at the point of contact with the E horizon is
often highly sodic and of such a high strength that root growth and proliferation, water
conductivity, aeration, water storage and water uptake are restricted. Roots growing in
these soils rely on channels created by previous roots or cracks arising from shrink–
swell forces associated with seasonal wetting and drying. It has been suggested that by
increasing the number of these channels in the subsoil, the structure and permeability of
the subsoil would be increased as would be the number of preferential pathways for
following generation roots. A biological approach for improving soil macroporosity
would be to use plants that can grow through that hostile layer creating new channels.
This is known as the primer plant concept. This concept is based on a better
understanding of root soil interactions. It is accepted that root growth is influenced by
the soil structure and the soil structure is influenced by root growth. However, a lot of
these dynamics are still unknown. This project aims to contribute to improving that
knowledge by investigating the use of modern techniques to study plant/root
interactions in duplex soils. First macroporosity and mesoporosity were characterized in
three dimensions using medical computer tomography and micro-tomography. Then the
imaging methodology was improved by using a local and adaptive threshold technique
based on indicator kriging instead of a global threshold. Using this new methodology,
changes in porosity were analysed in intact samples when three different plant species
were grown for 12 weeks. The plants were canola (Brassica napus); lucerne (Medicago
sativum) and saltbush (Atriplex nummularia) hypothesizing saltbush would change the
porosity more because it is a native plant species based on the primer plant concept. The
results showed that the porosity changed significantly after root growth but no

ii
differences were found between plant species. The changes could also not all be
attributed to root growth because cracks were also formed after 12 weeks. Therefore,
the living roots were visualized and characterized using a new tracing algorithm
‘rootviz’. This revealed that saltbush was growing more roots down through the profile.
Lucerne seemed to grow roots down the profile as well but to a lesser extend. Both of
these plants seemed to have more geotropic features than canola that seemed to grow
more laterals and had a more exploratory behaviour.
In a second part of this study, the chemistry and distribution of some elemets (Ca, Mn,
Fe, Zn and Cu) around mesopores in duplex soils were analysed using synchrotron
based X-ray techniques like µ-X-ray fluorescent spectrosopy, µ X-ray absoprtion fine
structure spectroscopy (XAFS) and µ-X-ray-absorption near edge specrtoscopy
(XANES). There were some major differences among elements. Ca was always present
in the studied pores while Mn and Fe were always in the soil matrix. Mn sometimes
increased around the micropore but its distribution was always well correlated with Fe.
Zinc and Cu were always less correlated with Fe and almost always, there concentration
increased around the micropore.
In conclusion, this work shows that there are strong influences in sodic duplex soils
between root growth, soil structure and distribution of elements. Little is known about
the processes involved in these root/soil interactions and this thesis contributes in
improving that knowledge.

iii
Table of contents
ABSTRACT i
TABLE OF CONTENTS iii
ACKNOWLEDGEMENTS vi
LIST OF PUBLICATIONS vii
STUDENT DECLARATION viii
CHAPTER 1:
General Introduction 1
CHAPTER 2:
3D-visualization and analysis of macro- and meso-porosity of the upper horizons of
a sodic, texture contrast soil
Abstract 10
Introduction 11
Materials and methods 13
Results and Discussion 17
Conclusions 22
Acknowledgements 22
References 23
CHAPTER 3:
Using computer tomography to visualise and quantify macropores in intact soils,
the issue of thresholding
Abstract 41
Introduction 42
Materials and methods 45
Results 51
Discussion 53
iv
Conclusions 61
Acknowledgements 62
References 62
CHAPTER 4:
Computed tomography of intact soils cores I. Spatial analysis of soil
macroporosity before and after root growth
Abstract 66
Introduction 67
Materials and methods 69
Results 73
Discussion 78
Conclusions 87
Acknowledgements 88
References 89
CHAPTER 5:
Computed tomography of intact soil cores II. Spatial and temporal visualisations
of in situ root systems.
Abstract 93
Introduction 94
Materials and methods 97
Results 100
Discussion 106
Conclusions 112
Acknowledgements 113
References 114
CHAPTER 6:
v
Distribution and speciation of nutrient elements around micropores
Acknowledgements 118
Abstract 119
Introduction 121
Materials and methods 124
Results and Discussion 129
Conclusions 148
References 149
CHAPTER 7:
Characterising the chemistry of micropores in a sodic soil with strong texture-
contrast using synchrotron X-ray techniques and LA-ICP-MS
Acknowledgements 153
Abstract 155
Introduction 157
Materials and methods 160
Results and Discussion 164
Conclusions 181
References 181
CHAPTER 8:
Summary and general discussion 184

vi
Acknowledgements
I would like to thank my supervisors David Chittleborough, Ganga Hettiarachchi and Annie McNeill for the support and help during my PhD, for giving me the opportunity to travel to several conferences and to do the synchrotron experiments in Chicago. Ganga, thanks for not loosing patience with me and continuously making me questioning things and Annie, thank you for the Scotland adventure and thanks for keeping me not loosing sight of the big picture. I would also like to thank my supervisor Hans Lambers. This thesis would not have been possible without his support. I need to thank the CRC for plant based management of dryland salinity for funding of this project and for travel funding, the Australian government and UWA for my international postgraduate research scholarship, UWA for the student travel fund. The synchrotron experiments were done at the PNC/XOR facilities at the Advanced Photon Source, and research at these facilities, are supported by the US Department of Energy – Basic Energy Sciences, a major facilities access grant from NSERC, the University of Washington, Simon Fraser University and the Advanced Photon Source. Use of the Advanced Photon Source is also supported by the U. S. Department of Energy, Office of Science, Office of Basic Energy Sciences, under Contract DE-AC02-06CH11357. This work was supported by the Australian Synchrotron Research Program (ASRP) which is funded by the Commonwealth of Australia under Major National Research Facilities Program. Some of this work was performed at GeoSoilEnviroCARS (Sector 13), Advanced Photon Source (APS), Argonne National Laboratory. GeoSoilEnviroCARS is supported by the National Science Foundation - Earth Sciences (EAR-0622171) and Department of Energy - Geosciences (DE-FG02-94ER14466). I especially want to thank Matt Newville. This work was also supported by the Australian Synchrotron Research Program (ASRP) which is funded by the commonwealth of Australia under Major National Research Facilities Program. Thanks to UWA letting me be based in Adelaide and thanks to Soil and Land Systems, UA, for letting me use their facilities. Thanks to the SLS staff, especially Colin Rivers. A special thank to Damien Adcock for helping with fieldwork and for friendship and Rob Davidson for teaching me imaging and for being there when I had computer troubles. Thanks to Peter Self and Angus Netting at Adelaide Microscopy and the radiology department at the Queen Elizabeth Hospital. Thanks to my Adelaide family, the Adelaide Frenchies and all my friends in Adelaide and in other parts of the world. You kept me sane Finally, thanks to my parents for their eternal support and my brother Nicolas for his long distance great friendship. Thank you thank you thank you!

vii
List of publications arising from this thesis Chapter 2: ‘3D-visualisation and analysis of macro- and meso-porosity of the upper horizons of a sodic, texture-contrast soil’ L. Jassogne, A. McNeill and D. Chittleborough European Journal of Soil science, 58: 589-598. The images were acquired before the start of the PhD, and the methodology was established before the PhD as well. The data analysis and the manuscript were written after the PhD started. Laurence Jassogne was then a student from the School of Plant Biology at the University of Western Australia. The Australian government, UWA and Hans Lambers should have been acknowledged for the International Postgraduate Scholarship. Chapter 3: ‘Using computer tomography to visualise and quantify macropores in intact soils, the issue of threshold’ L. Jassogne, R. Davidson, A. McNeill, G. Hettiarachchi and D. Chittleborough This paper was submitted to Geoderma. Chapter 4: ‘Computer tomographic analysis of the effect on root growth on porosity’ L.Jassogne, R. Davidson, A. McNeill, G. Hettiarachchi, D. Chittleborough This paper will be submitted to Plant and Soil. Chapter 5: ‘Visualising root growth in 4 dimensions in intact soil cores’ L.Jassogne, R. Davidson, A. McNeill, G. Hettiarachchi, D. Chittleborough This paper will be submitted to Plant and Soil. Chapter 6: ‘Distribution and speciation of nutrient elements around micropores’ L. Jassogne, G. Hettiarachchi, D. Chittleborough, A. McNeill Accepted with revisions in Soil Science Society of America Journal Chapter 7: ‘Characterising the chemistry of biopores using synchrotron based X-ray techniques and LA ICP-MS’ L. Jassogne, G. Hettiarachchi, D. Chittleborough, A. McNeill This paper will be submitted to the Soil Science Society of America Journal.

viii
Student declaration: extent of involvement of the student in the work presented in this study
The images for chapter 2 were acquired by me in case of the micro-CT and by Peter
Kolesik in case of the medical CT before the start of the PhD. The analysis of the
images of the medical CT and the micro CT was done by me at the start of my PhD.
The development of the ideas in the paper was shared between me, Ann McNeill and
David Chittleborough. I drafted the paper and Ann McNeill and David Chittleborough
commented on the paper.
The imaging method in Chapter 3 was developed by me with the help of Rob Davidson.
I tested the method and I discussed the results with mainly Rob Davidson. I drafted the
paper and Rob Davidson, Ann McNeill, Ganga Hettiarachchi and David Chittleborough
substantially commented on the paper.
The outline of the experiment in Chapter 4 and 5 was done by me. I consulted Rob
Davidson and Damien Adcock for the set-up of the experiment. The analysis of the
images was done by me. I drafted the paper in Chapter 4 and Rob Davidson, Ann
McNeill, Ganga Hettiarachchi and David Chittleborough substantially commented on
the paper.
The software used in Chapter 5 was developed by Rob Davidson. I applied the software
on the CT images and reconstructed the roots. I drafted the paper and Rob Davidson
helped writing the method section. Ann McNeill, Ganga Hettiarachchi and David
Chittleborough substantially commented on the paper.
The experiment in chapter 6 was developed by me with the help of Ganga
Hettiarachchi. She also helped me at the synchrotron. I did the analysis of the data and

ix
wrote the paper. Ganga Hettiarachchi helped with the development of ideas. Ann
McNeill and David Chittleborough substantially commented on the paper.
The experiment in chapter 7 was developed by me with the help of Ganga
Hettiarachchi. She also helped me at the synchrotron. I did the analysis of the data and
wrote the paper. Ganga Hettiarachchi helped with the development of ideas. Ann
McNeill and David Chittleborough substantially commented on the paper.

1
CHAPTER 1
General introduction
Context
Over millions of years, salts (mainly NaCl) have accumulated in Australian soils. They
have largely been imported from the oceans via wind and rainfall, but also arisen from
weathering of rocks, in particular marine sediments (Rengasamy, 2006). Many of these
salt-affected soils are used for dryland agriculture. Prior to clearing of land for
agriculture, Australian ecosystems evolved with adaptations to the prevailing climatic
and edaphic conditions. There were deep-rooted perennials that used most of the rainfall
throughout the year and ensured that saline water tables remained deep in the soil
profile. This made it possible for shallow-rooted, annual species to also grow in these
soils. When the land was cleared for agriculture by immigrant Europeans, annual crops
were introduced in the system and most native perennials were removed. This caused
the water table to rise with associated movement of salts into the rooting zone of the
annuals. When salt concentrations in the soil solution are too high, plant performance
will decrease due to toxic and osmotic salt effects. Introducing deep-rooted perennials
into the agricultural systems can lower the water table again, and reduce the salinity
problems in Australian soils (Cox et al., 1996; Pannell and Ewing, 2006).
The accumulation of Na in the subsoil has also led to the development of soils with
sodic properties, chiefly in soils with high clay content. Due to the elevated
concentrations of Na, the clay in the soil disperses, causing the soil structure to
deteriorate and the bulk density of the soil to increase (Rengasamy et al., 2003). In
southern Australia, a large percentage of the agricultural land is situated on alkaline
duplex soils (Chittleborough, 1992). These are soils with a texture contrast in the
subsoil. Mostly, the upper soil profile has a coarse texture with neutral to slightly
alkaline pH while the subsoil is of much finer texture, more extreme alkalinity, and has
saline and sodic properties. After a significant rainfall event (>20 mm) there is a

CHAPTER1
2
tendency, due to low permeability of the subsoil, for water in these soils to temporarily
accumulate or ‘pond’ in a zone immediately above the subsoil often called the E
horizon. Furthermore, when the soil dries, the subsoil and overlying E horizon can
become very hard and impenetrable. The physical and chemical characteristics
described above are suggested as key limitations to roots growing in these texture-
contrast or duplex soils (Adcock et al., 2007).
Management of duplex soils
Roots growing in the subsoil of duplex soils use channels developed by previous
vegetation as preferential pathways when they cannot penetrate or ‘drill’ through the
subsoil. These channels are also called biopores. Root proliferation in the subsoil is very
important because it facilitates access to the water that has been stored in the subsoil,
which has a higher-water holding capacity compared with the top soil (Rengasamy et
al., 2003). Access to this water is critical, especially for crops in low-rainfall areas. It
has been suggested that planting vegetation to increase the numbers of biopores in the
subsoil would improve the structure and permeability of the subsoil, and also increase
the number of preferential pathways for exploitation by roots of subsequent vegetation.
This idea of physical and chemical amelioration of hostile soil by growing roots is
known as the primer plant concept and has been suggested in previous studies. The ideal
primer plant likely evolved with the climatic conditions and soil environment, and thus
developed features to enable root growth through the hostile subsoil environment, such
as roots that are able to penetrate at high soil bulk density and modify the soil by certain
exudates. Indeed, native perennials have been described as chemical and structural
engineers of the subsoil (Yunusa and Newton, 2003; Verboom and Pate, 2006).
Root growth is influenced by soil structure and soil structure is influenced by root
growth, but the intricacies of these dynamics are still largely unknown or poorly

3
CHAPTER 1
described, especially ‘in situ’ for undisturbed situations. In particular, there is a scarcity
of quantitative and qualitative data on physical and chemical characteristics related to
soil porosity in intact soil cores, and on the morphological responses of plant roots to
this porosity. The work described in this thesis broadly aimed to develop and use state-
of-the-art technologies to address this gap in our knowledge
Interactions between roots and soil
Porosity and root growth in duplex soil
Root growth is influenced by soil structure in the subsoil of duplex soils and as
suggested in the primer plant concept, roots of certain plant species could be used as
‘biological drills’ through the subsoil of those soils. Therefore, there is a need to
characterise porosity and root growth in duplex soils. Unfortunately, soil is opaque and
it is extremely difficult to examine non-destructively. Indeed, methods that characterise
porosity and root growth in soil are often destructive and, consequently, any spatial
information is lost.
Computer tomography is a good technique to characterise porosity in three dimensions
non-destructively. The only drawback is that there is a trade off between sample size
and resolution (Pierret et al., 1999). Fine resolution at µm scale can only be achieved
with small samples like soil aggregates (Peth et al., 2008). For studies needing bigger
sample sizes, the level of detail at which processes can be analysed decreases.
Therefore, certain techniques, like medical Computer Tomography (CT) that allow big
sample sizes (for example 15 cm diameter cores by 50 cm long) have been less widely
used because the resolution obtained is at mm scale (Bastardie et al., 2005; Luo et al.,
2008). However, the size of sample used in an experiment, and hence the choice of X-
ray CT equipment, will be determined by the information being sought. To provide
knowledge about root system exploration in a soil profile, large sample sizes are needed

CHAPTER1
4
that represent the soil profile. Imaging such samples allows macroporosity and root
growth in soil to be visualised, but only at a coarse resolution. This information is
sufficient if the interest concerns primary or, in some instances, secondary roots, i.e if
the study is about the exploratory behaviour of root systems in soil. Fine roots (< 0.8
mm) are responsible for nutrient and water uptake and, thus, techniques with finer
resolution may be necessary to examine these (Pierret et al., 2005). Computer
tomography cannot always resolve that level of detail and the use of 2D imaging
techniques that allow much fine resolution has been proposed (Pierret et al., 2003). It
can be concluded that root/soil interactions happen at various scales and to fully
understand root behaviour, studies at different scales have to be integrated. The choice
of whether to use three-dimensional imaging techniques or alternative two-dimensional
visualisation techniques is dependent on the scale and the nature of the process or
feature being studied.
Chemistry of micropores in duplex soil
It is well known that a root actively growing in soil affects chemical, physical and
biological properties. The volume of soil influenced by a growing root is called the
rhizosphere (Hinsinger et al., 2006). A lot less is known about what happens to the
rhizosphere when the root dies and the rhizosphere becomes remnant. This knowledge
is very important in relation to porosity in sodic subsoils as these remnant rhizospheres
are most likely to be the channels in which the roots of subsequent plants will
preferentially grow. Studying the chemistry of pores and soil in the immediate vicinity
of pores is essential for understanding where nutrients accumulate in the overall soil
structure, and how available they may be for uptake by plant roots. Such knowledge is
very important for subsoils where zones favourable for root growth may be relatively
rare within a more ubiquitous hostile matrix. Very little research has been undertaken in
5
CHAPTER 1
this area because of the limitations of the technologies and lack of non-invasive
approaches. However, there are techniques now that allow a combination of chemical
analysis with spatially resolved information. Knowing the spatial distribution of
nutrients is important at fine scale as it is the detail at which nutrient uptake by fine
roots occurs. The distribution of micronutrients in relation to soil structure can finally
by studied and visualised by using synchrotron based X-ray techniques and other
surface analytical techniques (Amelung et al., 2002).
Hypothesis and thesis structure
The underlying hypothesis for this thesis was that native perennial plants are potentially
better primer plants because they have evolved to exhibit abilities to ‘drill’ through
highly impenetrable subsoil that may be sodic and alkaline, and subsequently
chemically modify the soil environment.
The aim of this work was to quantify root/soil interactions using non-invasive
techniques. Novel and emerging X-ray and imaging techniques were employed, and, if
necessary, improvements to them were suggested, in order to quantitatively and
qualitatively investigate root/soil interactions in intact soil environments and thus test
the underlying hypothesis by
1) using X-ray tomography to visualise and quantify macroporosity and root growth in
duplex soils
2) examining the distribution of elements around micro-and mesopores using novel X-
ray techniques.
A series of studies was undertaken and 6 manuscripts were prepared to present the main
findings. Four of these manuscripts deal with non-invasively visualising and measuring
porosity and root growth in undisturbed blocks of duplex soil, at two scales. The other
two describe the distribution and speciation of nutrients in and around soil pores.
CHAPTER1
6
In the first study (Jassogne et al. 2007, chapter 2), the macroporosity of a sodic duplex
soil was measured in intact soil cores (diameter of 15 cm and 50 cm long) using medical
CT. Also, the mesoporosity in a 4 cm layer containing 2 cm at the base of the E-horizon
and 2 cm at the top of the B-horizon (called the interface) was characterised in three
dimensions using micro-CT. In this study the issue of using different scales to describe
aspects of porosity was investigated and the changes in porosity that roots would
encounter as they penetrate or ‘drill’ through the interface between the E and the B
boundary were analysed. The limitations of this study were that the imaging techniques
were not optimal. Therefore, the second study (Jassogne et al., in review – Geoderma,
chapter 3) describe and assess a more objective methodology for imaging and analysing
porosity in 3 dimensions based on thresholding images using indicator kriging. Using
this revised methodology a third study (Jassogne et al., to be submitted to Plant and Soil
2008, chapter 4) was completed that characterised the macroporosity of a sodic duplex
soil before and after root growth of an annual crop plant, canola (Brassica napus), a
perennial pasture plant lucerne (Medicago sativa) and a native perennial shrub saltbush
(Atriplex nummularia). In this study, changes in porosity due to soil cracking could not
entirely be delineated from changes in porosity due to root growth. Therefore, a fourth
study (Jassogne et al., in preparation for Plant and Soil, chapter 5) was undertaken
where the growing exploratory roots of an annual agricultural crop (canola), a perennial
pasture plant (lucerne) and a woody perennial saltbush were imaged using a tracing
algorithm that was especially developed to visualise growing roots in intact soil cores.
The roots of canola, lucerne and saltbush were imaged at different times during a 12
week period in order to examine the ability of these different plant root systems to
change, and in particular increase, the macroporosity of the subsoil of sodic duplex soil.

7
CHAPTER 1
Complementary studies were undertaken using established and emerging techniques to
investigate the distribution of macro- and micronutrients (Ca, Cu, Zn, Mn and Fe) in
relation to soil microstructure in the E/B layers of a duplex soil. In one study (Jassogne
et al., accepted with revisions in Soil Sci Soc Am 2008; chapter 6) thin sections of
samples from the interface of a sodic duplex soil were examined. The mesostructure at
the interface of a sodic duplex soil is described using soil petrology. Synchrotron-based
X-ray fluorescence was assessed for mapping the distribution of Ca, Mn, Fe, Zn and Cu
around pores. X-ray absorption spectroscopy was used to investigate the speciation of
these elements. The results from these studies were then compared with those obtained
from scanning electron microscopy with an Energy-dispersive X-ray analyser (SEM-
EDXA). In another study (to be submitted to Soil Sci Soc Am 2008; Chapter 7) the
same synchrotron techniques are used at another beamline with finer detail of element
distribution examined and reported. The results from the two studies were compared
and the use of intact samples versus thin sections for these types of experiments is
discussed in relation to the concern that soil particles react or move when making thin
sections. Finally, nutrient distributions mapped from these synchrotron techniques are
compared with those from laser-ablation-induced couple-plasma mass spectrometry (LA
ICP-MS) measurements.

8
Characterising porosity and root growth in three dimensions using
computer tomography
Chapter two entitled
3D-visualization and analysis of macro- and meso-porosity of the upper horizons of
a sodic, texture contrast soil
Appeared as a journal article in
European Journal of Soil Science (2007) 58, 589-598
Chapter three entitled
Using computer tomography to visualise and quantify macropores in intact soils,
the issue of thresholding
Submitted as a journal article to Geoderma
Chapter four entitled
Computed tomography of intact soil cores I: Spatial analysis of soil macroporosity
before and after root growth
To be submitted as a journal article to Plant and Soil
Chapter five entitled
Computed tomography of intact soil cores II: Spatial and temporal visualisations
of in situ root systems
To be submitted as a journal article to Plant and Soil

9
CHAPTER 2
Short title: Porosity of a sodic soil
3D-visualisation and analysis of macro- and meso-porosity of the upper
horizons of a sodic, texture-contrast soil
L. JASSOGNE, A. MCNEILL & D. CHITTLEBOROUGH
University of Adelaide, School of Earth and Environmental Sciences, Waite Campus, PMB1, Glen Osmond SA 5064, Australia
Correspondence: L. Jassogne. E-mail [email protected]

CHAPTER 2
10
Summary
The lower E and upper B horizons of sodic, texture-contrast soils are a formidable
barrier to most annual and many perennial crops. The research presented here is part of
a wider study into the nature of subsoil constraints to root exploration. The aim of this
study was to characterise in three dimensions the macro- and meso-porosity across the E
horizon – Btn horizon interface of a sodic, texture-contrast soil using X-ray computed
tomography (CT). Intact soil cores of 50cm length and 15cm diameter were scanned
with a medical CT X-ray machine. The pore volume reconstructed from these scans had
a resolution of 0.3 cm x 0.3 cm x 0.4 cm (in the x, y, z dimensions respectively). This
resolution allowed visualisation and quantification of the macroporosity of the intact
cores. Undisturbed samples of 1.5cm diameter and 4cm length were carefully excised
from the interface and scanned with micro-CT X-ray equipment. The reconstructed pore
volumes had an isotropic resolution of 19 μm that allowed analysis of the mesoporosity
just on the boundary between the E and Btn horizons. Mesoporosity decreased across
the interface and increased lower in the Btn horizon. The distribution of the pores at the
macro- and mesoscales showed the importance of the smaller pores in the A and E
horizons, whereas most of the porosity in the Btn horizon was attributed to the larger
pores. Pores in this sodic, texture-contrast soil were not distributed homogeneously at
either the macro- or meso-scale. A greater proportion of the pores in the E-B interface
were horizontal than in the upper A1, upper E and lower Btn horizons. Some ‘coiling’
of the pores was also apparent in the interface. The shape of some pores (long tubular
pores) suggested formation by roots as they drilled through the soil. The orientation of
these pores was a function of physical (and possibly) chemical impedance at the
interface.

11
CHAPTER 2
Introduction
Approximately 60% of the 20 million hectares of soils used for cropping in Australia
are sodic and farming practices on these soils are mainly performed under dryland
conditions. More than 80 % of these sodic soils have dense, clay subsoils with high
sodicity (ESP >6%) and are strongly alkaline (pH > 8.5) (Rengasamy, 2002).
Worldwide there are approximately 135m hectares of such soils, formerly known as
Solonetz or Solodised Solonetz (Stace et al. 1968). In addition to their sodicity, these
soils invariably have an abrupt textural change between the A (or E) and B horizons
(Chittleborough, 1992). Textures of the A and E horizons are usually sands or loamy
sands; B horizons are clays or sandy clays. The clay horizons are very dense (bulk
densities > 2 g cm-3 are common), and present a major physical constraint for both
annual and perennial vegetation. Access by root systems to water and nutrients is
severely restricted (Clark et al., 2003). In the decades following clearing for agriculture,
these soils have been subject to either, or a combination of, waterlogging, dryland
salinity, erosion and acidification. In addition to the inherent constraints of sodicity and
texture-contrast, agricultural crops must cope with a range of supplementary chemical
and structural constraints (Cox et al., 2002; Rengasamy et al., 2003).
Previous studies have shown that few roots tend to grow in the immediate vicinity
of the E horizon – B horizon interface of these sodic soils (McNeill et al., 2004). In this
paper we will use the term E-B interface to refer to the immediate vicinity of the
boundary between the E horizon and the Btn horizon. Previous studies of relationships
between soil structure and root distribution in a texture contrast soil, using Phase
Contrast Imaging (PCI), observed that roots tended to grow more vertically than
horizontally in the topsoil and more horizontally than vertically at the interface with the
subsoil and at the top of the B horizon (Moran et al. 2000). The branching intensity also
CHAPTER 2
12
decreased with depth. Roots often exploit cracks, voids and large pores, or enlarge
smaller pores by displacing soil particles (Clark et al., 2003). Pores provide an easy
pathway through the soil matrix because of relatively little mechanical impedance and
because they improve contact with oxygen, water and nutrients. Furthermore, the
environment around soil macropores has been shown to be chemically and
microbiologically different from the bulk soil (Pankhurst et al., 2002). The size of the
macropore sheath, i.e. the zone around macropores in which 80% of the roots are
located (Stewart et al., 1999), may be an indication of the level of inhibition for root
growth exerted by the soil matrix. A small macropore sheath may indicate that the roots
are not evenly distributed throughout the soil matrix i.e. roots are clumping. One of the
implications of this type of root distribution, closely related to macropore distribution, is
that nominally available water in the subsoil is poorly accessible by plants. Plants
experience water stress even though measurements of soil water content indicate that
there is sufficient water in the subsoil to meet demand (Pierret et al., 1999).
These observations demonstrate the importance of quantifying soil structure and the
relationship between pores and roots. Many efforts have been made to characterise
porosity using two-dimensional (2D) image analysis. These include cross-sections from
soil reconstructed from tomography (Crestana et al., 1986; Phogat & Aylmore, 1989;
Warner et al., 1989) and soil thin sections (McBratney et al., 1992; Moran &
McBratney, 1992; Vogel, 1997; Li et al., 2004). However, the representation of a three-
dimensional (3D) object in a random 2D cross-section gives only a partial view of
reality. 3D-characterisation of macropores is the only way to define correctly the
continuity of the pores: an important property of pore structure because it largely
determines water movement through soil (Vogel, 1997). Tomography has been shown
to be a useful tool in this respect (Heijs et al., 1995; Moreau et al., 1999; Perret et al.,
1999; Clausnitzer & Hopmans, 2000). X-ray computed tomography (CT) is a non-
13
CHAPTER 2
invasive technique that has been used for the characterisation of pores and roots in three
dimensions in disturbed and undisturbed soils (Heeraman et al., 1997; Pierret et al.,
1999; Perret et al., 1999; Pierret et al., 2002; Gregory et al., 2003).
Few 3D studies have been undertaken at the meso-scale on intact soil cores. In this
paper, we adopt the pore-size classification of Brewer (1964) in which macroporosity
refers to pores > 75 µm in size and mesopores 30 – 75 µm. Most studies at the meso-
scale on undisturbed samples have been invasive and the analysis carried out in pseudo-
3D (e.g. Moran et al., 2000). Other 3D studies at the meso-scale were undertaken on
disturbed soil samples (Gregory et al., 2003). There is a trade-off between resolution,
large field of view and the ability to image in 3 dimensions. Images of high resolution
can only be obtained for small samples with the technology currently available. Using
this technology, we report an attempt to visualise and quantify the macro-and meso-
pore characteristics of a soil in the undisturbed state across the E-B interface that could
be of relevance for explaining root growth in those soils. We predict that these
characteristics will be major determinants of the pathway of root growth in these soils.
The objective of this study was to characterise porosity at the interface of a soil with
strong texture contrast at the macro-and meso-scale. The porosity of the A, E and upper
B-horizons of a sodic, texture-contrast soil was visualised using computed tomography
and the 3D-characteristics of pores that were assumed relevant for root growth was
calculated.
Materials and methods
Field sampling
Undisturbed soil cores (50cm depth by 15cm diameter) were taken with a drill rig from
a sodic soil with strong texture-contrast on an experimental site near Wharminda, on the
Eyre Peninsula, South Australia (33°S, 136°E). The soil is a Yellow Sodosol (Isbell,

CHAPTER 2
14
1996) or Natrixeralf (Soil Survey Staff, 1999). Relevant soil characteristics are
summarised in Table 1. The particle size was measured with the hydrometer method.
For the porosity calculations, derived from bulk density measurements, we assumed a
solid density of 2.65 g cm-3. Cores were stored at 4°C to avoid modification of the soil
structure after sampling.
CT-scanning
At the Queen Elizabeth Hospital in Adelaide, three soil cores were scanned in a medical
CT machine (Toshiba Aquilon, Tokyo, Japan) operating at 120 keV and a current of
100 mA. The pixel resolution of the reconstructed images was 0.3 mm. An image of the
cross section was taken every 0.4 mm (z-resolution) but the actual resolution was about
twice these values because of volume-averaging effects. Following the coarse CT-
scanning, three subsamples (4cm long and 1.5cm diameter) were dissected by a scalpel
from the E-B interface of one core, and scanned using a micro-CT machine (Skyscan
1072, Aartselaar, Belgium) operating at 100 keV and 98 mA. Pixel resolution of the
scan was 19 µm and the distance between two successive CT-slices was 19 µm. The
actual resolution of those images was twice the pixel resolution because of volume
averaging effects. Most biopores in soil tend to meander either horizontally or vertically
so the distance between subsequent CT-slices was taken as small as possible to reveal
detail. X-ray computed tomography of the soil provided images, i.e. maps of attenuation
coefficients, of the soil that were related to soil density.
Binary thresholding
The 2D images were segmented with a global-threshold value based on the greyscale
histogram to differentiate soil matrix and pores. The threshold value, computed using
the maximum entropy threshold algorithm in ImageJ (http://rsb.info.nih.gov/ij/), was

15
CHAPTER 2
selected at the point where the entropy (S) of the grey level histogram was maximised.
The entropy, being a measure of the uncertainty of any event, was calculated as:
S = -Σ (P x log2 (P)), (1)
where P was the probability of a pixel greyscale value in the image. When a greyscale
image was segmented, the pixels with a value smaller than the threshold value were
assigned the value 0, and were considered as pixels representing the soil matrix. These
pixels were called background. The pixels larger than the threshold value were assigned
the value 1, represented pore space and were termed foreground pixels. After
segmentation, a median filter, with a neighbourhood of two pixels, was applied to
eliminate noise (Perret et al., 1999).
A global threshold based on the greyscale histogram led to misidentification of
pixels because of finite resolution effects or noise in real 3D-images (Al-Raoush &
Willson, 2005). As a consequence, the connectivity of a number of pores in this
experiment was disrupted (Figure 1) and therefore the trends in the data will be
commented on rather than the absolute values. In further experiments, segmentation
algorithms that apply local thresholding techniques will be evaluated (Oh & Lindquist,
1999; Pierret et al., 2002).
Volumetric porosity and pore size distribution
The porosity, 3D pore-size distribution, numerical density (i.e. the number of pore
networks per volume of soil) and maximum connected volume of the three large intact
soil cores and the three subsamples were measured and calculated by loading the binary
images in the imaging software Amira 3.1 (Mercury Computer Systems, San Diego,
CA). Porosity was defined as the total number of voxels of the pore space, divided by
the total number of voxels of the sample. The 3D pore-size distribution was calculated
CHAPTER 2
16
by counting the number of disconnected volumes of pore space and separation of the
volumes according to this size (i.e. the number of voxels in the disconnected volume). A
voxel was recognised as forming part of the volume if it had adjacent voxels of the
same value. A visualisation model of the volume of the pore space was also
reconstructed using this software.
3D tortuosity and inclination
The skeleton of the pore space was reconstructed by using an algorithm run in Amira
3.0 (Kolesik et al., 2004). The algorithm was based on the 2D-derivation of the distance
map and each pixel belonging to the pore space in the binary image was replaced with a
grey value equal to that pixel's distance from the nearest background pixel. The pixels
with the largest value were connected from one cross-section to the next cross-section to
create a skeleton within which every pore was represented by a line. A segment of a
pore or a line was the length between two nodes. The nodes were the pixels on every
image that were connected to make the skeleton. The same skeleton algorithm
calculated the coordinates of every node in the pore space. Using simple geometric
theorems, the inclination and tortuosity of the pores were calculated based on the
coordinates of the nodes.
Tortuosity (τ), a dimensionless factor always >1, expresses the degree of complexity
of the sinuous pore path (Perret et al., 1999). It was defined as:
τ = Le / L, (2)
where Le was the effective average path and L the shortest distance measured along the
distance of the pore.
17
CHAPTER 2
The inclination of the pore network was calculated from the vertical. Where the
inclination from vertical was <45°, the pore was considered vertical, inclinations
between 45° and 90° were considered horizontal.
The macropore architecture in the E-horizon (of sand texture) was very complicated
because the resolution of the micro-CT scans revealed porosity that was caused by the
packing of the sand particles. McDonald et al. (1990) classified this structure as free
grain. Applied to the E horizon, the skeleton algorithm generated artefacts, the most
obvious of which were loops starting in some nodes. Therefore, the skeleton was
reconstructed only for the transition zone between E and Btn horizons and in the upper
portion of the Btn horizon. The efficacy of the skeleton, even with the artefacts, was
proven after comparing it with the volume reconstruction.
Results and discussion
In this study, the total porosity calculated on the basis of the bulk density, was greater
than the porosity measured from the CT images because measurements made from the
images were resolution-dependent. It is important to keep in mind that porosity
calculations from bulk density are also sensitive to resolution, which is defined by the
diameter of the cores and its relationship with the scale of the structure (Moran &
McBratney, 1992).
The porosity in the undisturbed large soil cores decreased drastically as a function of
depth, but slightly increased again deeper in the clay layer (Figure 1). The same trend
was found for roots growing in texture-contrast soils (McNeill et al., 2004) and
confirms that soil structure and root distribution are closely related in these soils (Moran
et al., 2000). The porosity of one of the large cores (Core 1) was more than 50 times
greater in the E-horizon than in the interface and three and four times greater in the
other two large cores (Cores 2 and 3, respectively). The greater porosity in the interface

CHAPTER 2
18
of Core 3 can be explained by further examination of the images. The CT-scans showed
relatively more root channels passing through the interface of that core. The numerical
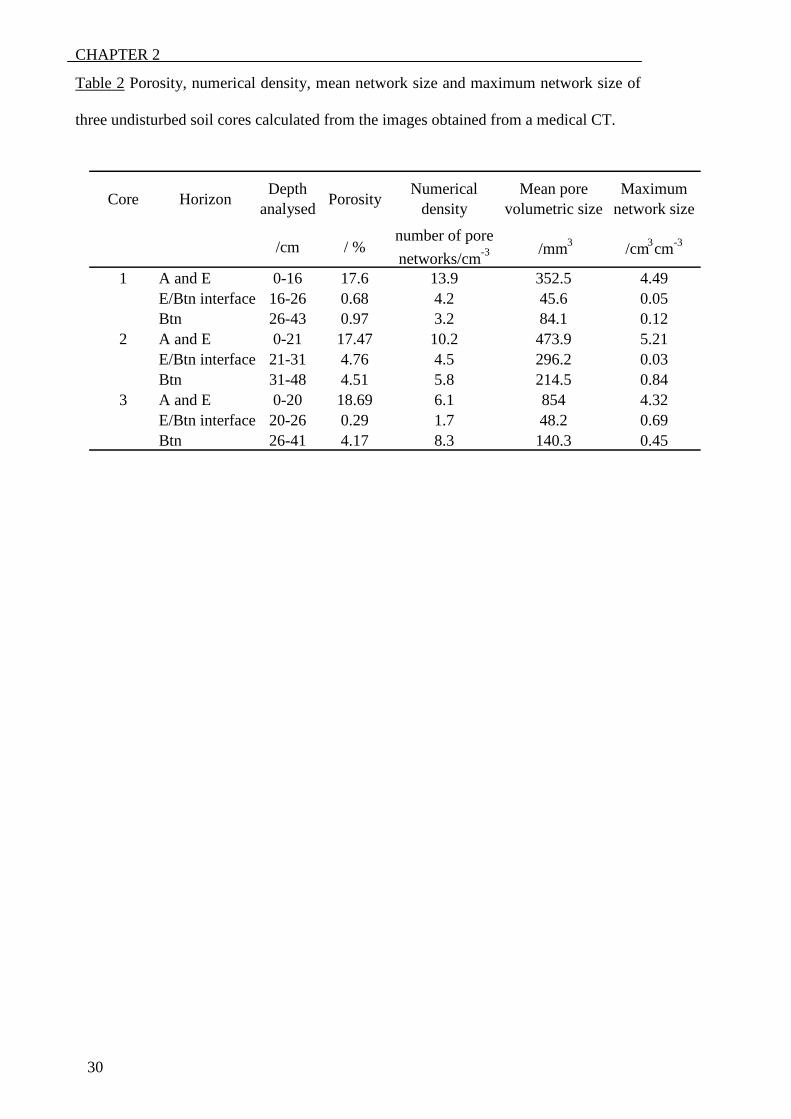
density, mean network size and maximum network size (Table 2) showed the same
trend. The numerical density was ten times more in the sand layer than in the clay layer;
similar to the variation between samples found by Perret et al. (1999) from CT of
undisturbed soil cores. Nevertheless, although they stated that numerical density could
not be used as an indication of macroporosity, this parameter could be important for the
description of root distribution in soils because pore networks provide pathways for
roots. The variability of the same parameters between different samples, together with
the visual reconstructions (Figures 2 and 3), illustrates the patchy distribution of pores
in this soil, a feature also reported by Pierret et al. (1999) and Stewart et al. (1999) for
other soil types, and explains the clumped distribution of roots in these horizons.
The volume reconstructions and skeletons of the small intact samples from the
interface revealed that the E and Btn horizons had markedly different porosities (Figures
2 and 3) at both the macro-scale and the meso-scale. The macropores (>75 μm)
visualised with the medical CT images decreased drastically from the A and E-horizons
to the E-Btn interface. The macropores in the A and E horizon are formed by layers of
dead organic material and old root channels as revealed from destructive analysis of
some cores. The macropores in the E-Btn interface and the Btn horizon are mostly
tubular in shape and are probably old root channels. As stated above, the meso-porosity
of the E horizon, visualised at a spatial resolution of 19 µm, was largely caused by the
packing of the sand particles. Any porosity caused by roots or burrow systems that may
have been present could not be visualised in this horizon. Visually, as in the study by
Pierret et al. (2002), the pores in the Btn horizon could be separated into two groups.
The first group were biopores that were tubular and were suspected to be root channels
on the basis of their morphology. This was true for both macropores and mesopores. It

19
CHAPTER 2
was impossible to make a distinction between live or dead roots by X-ray absorption
imaging. The distinction between roots, and pores created by roots, was also not clear.
The absorption of those materials was too similar for them to be separated in X-ray
absorption images of undisturbed soil samples. The second group contained pores of no
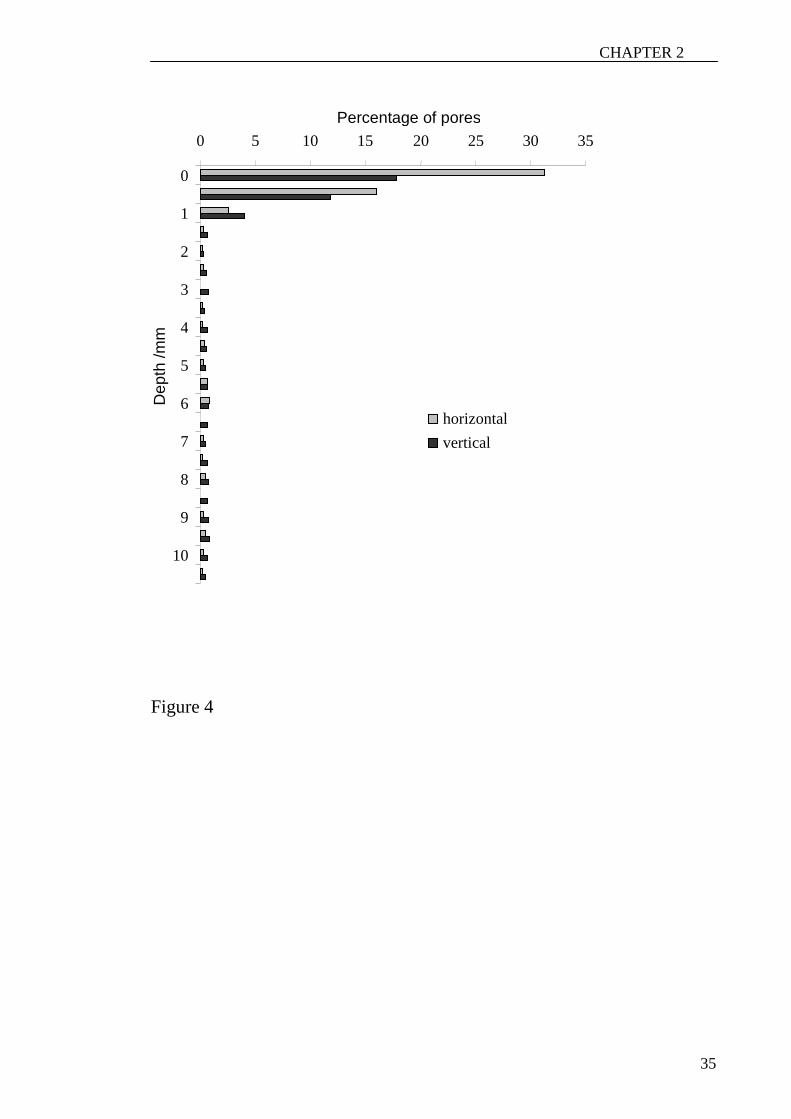
particular shape and size. The biopores in this experiment did not have a pronounced
vertical or sub-vertical orientation (Figure 4). This orientation is mostly found in soils
that contain earthworms (Pierret et al., 2002) or in soils that do not contain physical
barriers to root proliferation. The pore networks in the A and E horizons were well
connected as would be expected in a sandy soil. This is valid at both scales studied. The
connectivity of the pores at both scales in the E-Btn interface and the Btn horizon was
very small. Increasing the number of pores by root growth would be the only realisable
option to increase pore connectivity in those layers.
Structure A in subsample 3 was suspected to be an old root channel containing a
young root. The reconstructions suggested a totally different architecture in this biopore
compared with the bulk soil. In the field, roots of live crops were observed to follow
mostly old root channels. This is consistent with other studies suggesting that roots
follow paths of least resistance or paths with different chemical characteristics than the
bulk soil (Stewart et al., 1999; Yunusa et al., 2002; Clark et al., 2003).
In subsamples 1 and 3, pores near the E horizon were more horizontal than vertical
whereas the number of horizontal pores in subsample 2 tended to be greater than the
number of vertical pores in the Btn horizon (Figures 4 and 5). Horizontal pores were
more tortuous than vertical pores in all three subsamples. These findings confirmed
studies in pseudo-three dimensions by Phase Contrast Imaging (PCI) on a similar soil
type (Moran et al., 2000). The horizontality of the pores indicated that roots could not
easily traverse the interface of this texture-contrast soil. The relatively large tortuosity
of the horizontal pores suggested that some roots were searching for paths of least

CHAPTER 2
20
resistance through the Btn-horizon, perhaps cracks caused by wetting and drying or old
root channels.
Black decaying roots can be observed down the soil profile in the field to a depth of
approximately 2m (depth of the pit). The size and shape of the tubular biopores suggests
they could not have been formed by annual vegetation. Young roots continuously re-use
those old root channels (Creswell & Kirkegaard, 1995). The measurements of
inclination and tortuosity of these biopores in texture-contrast soils indicate that roots
that penetrate the subsoils have a role in facilitating root exploration and access to
nutrients and water for subsequent species, especially those having root systems limited
in penetration ability . The environment of the pores, especially the immediate surface
of pores, is very different from the bulk soil (Pierret et al., 1999; Stewart et al., 1999;
Pankhurst et al., 2002). This suggests that old root channels are recycled in the
following growing season because the environment around these pores is different from
the hostile soil matrix.
The volumetric distribution of the small pores declined exponentially across the E-B
interface (Figure 6) but the large pores had an irregular distribution. Macro-and micro-
fractures in Vertisols showed the same pattern (Moreau et al., 1999). This pattern was
also found in the samples scanned with the micro-CT showing that this distribution
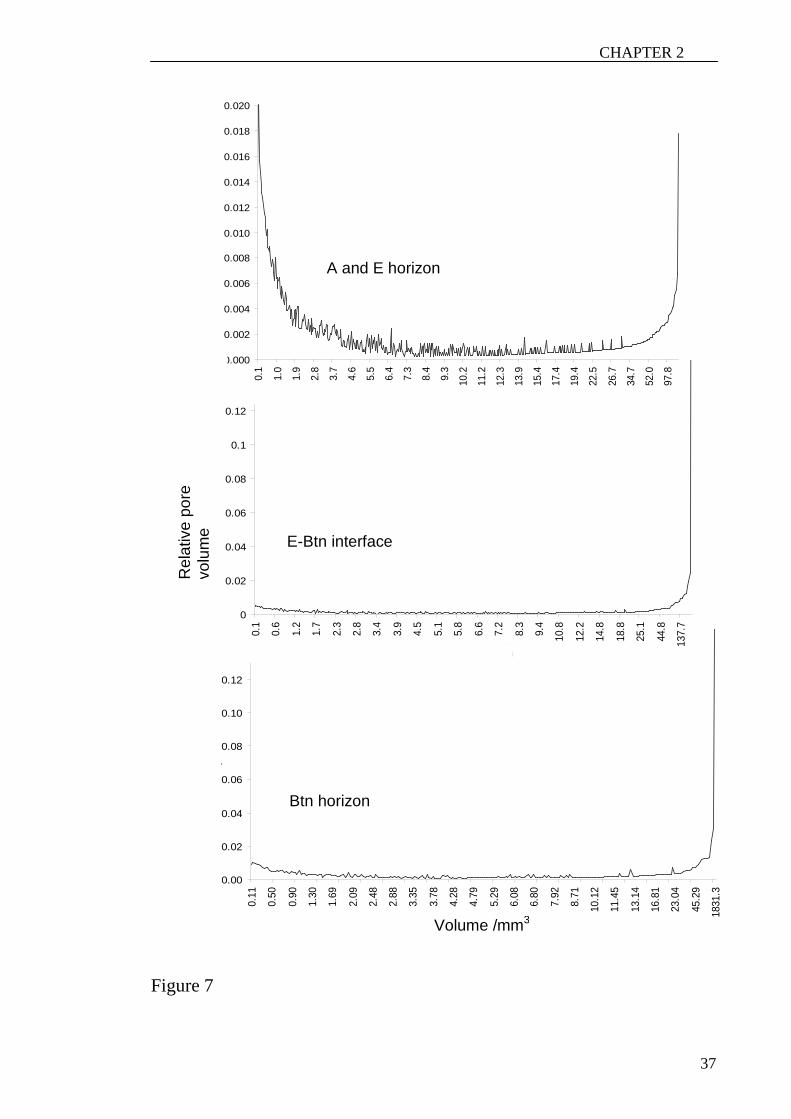
existed at different scales. The pore-size distribution in relation to pore volumes of the
macropores of the A and E horizons showed that most of the porosity was due to the
smallest and biggest pores. The distribution of the macropores in the E-Btn interface
and the Btn horizon showed that the largest pores were responsible for most of the
porosity (Figure 7). Hence, the distribution of the mesopores in the E horizon showed
that the smallest pores accounted for most of the porosity. The reason for this could be
that the packing porosity of the particles is accounted for in the porosity of the E
horizon whereas the mesopores in the Btn horizon do not represent the packing of

21
CHAPTER 2
particles (Figure 8). The length distribution in all samples did not differ for the
horizontal and the vertical pores and did not change as a function of depth (Figure 9).
Assuming that there is no overlap of the two pore types, the mean porosity of the
micro-CT images could provide an estimate of the mean mesoporosity of the medical-
CT images. The three subsamples scanned with the micro-CT were taken in the E-B
interface of Core 1. The scans of the undisturbed cores with the medical CT had to be
divided into 3 sections: the sand, the interface and the clay (Table 1). The interface was
a mixture of sand and clay because the line between the sand and the clay was not
horizontal, but depended on the domes of the Btn horizon. The macroporosity
calculated from the medical-CT binary images was 17.6% in the sand and 0.97% in the
clay. This means that the volumetric proportion of the soil matrix was 82.4% in the sand
and 99.03 % in the clay. The mesoporosity cannot be resolved with the medical-CT
images but can be with the micro-CT images. What appeared to be soil matrix in the
medical CT-images also contained mesopores resolved with the micro-CT images. So,
the soil matrix in Core 1 could be divided in a mesoporosity of 13.1% in the sand and
0.4% in the clay. Thus, the E-horizon in Core 1 has a macroporosity of 17.6% and a
mesoporosity of 13.1%, and the total porosity of 30.7% agrees with the value calculated
from the bulk density (Table 1). However, the total porosity in the clay, according to the
image analysis, was 1.37% whereas porosity calculated from the bulk density was 23%.
Thus, almost 22% of the total porosity in the clay horizon was attributed to micropores
not resolved by the micro-CT binary images. The smallest pores i.e. the pores resulting
from packing of the sand particles in the E horizon, were resolved with the micro-CT
images in accordance with the bulk density measurements.
Patterns of soil variation are the cumulative result of several physical, chemical and
biological processes acting in concert, a process at one scale having feedback to a
process at another scale (Bartoli et al., 2005). Variation is to be expected between levels
CHAPTER 2
22
of scale and resolution. This indicates the importance of quantifying porosity at all
scales. It can be argued that small samples are not representative, but there is a trade-off
between sample size and resolution.
Conclusions
The distribution of roots in a sodic, texture-contrast soil was related to pore structure.
Pores in texture-contrast soils could be separated into two groups. The first consisted of
tubular biopores, mainly caused by roots. The second group of pores did not have any
particular shape or size. There were more pores in the A and B horizons than in the E-B
interface. The size distribution of pores in all horizons was similar: exponential for
small pores and irregular for large pores. This was true at both the meso- and macro-
scale. Pores in this texture-contrast soil were not distributed homogeneously. The
distribution of macro-and meso-pores was patchy. Pores in the interface and at the top
of the B horizon were more horizontal than vertical, and horizontal pores were more
tortuous. This behaviour is a function of the impedance of the Btn horizon. Tomography
is a useful tool to analyse the architecture of pores at different scales and technological
advances in tomography will soon make it possible to quantify pore characteristics at
scales finer than those investigated here.
Acknowledgments
This work would not have been possible without the financial assistance of DEST under
the Systemic Infrastructure Initiative and the Cooperative Research Centre for Plant-
based Management of Dryland Salinity. We are grateful for the help and advice of
Damien Adcock and for laboratory assistance from Colin Rivers. We also thank Peter
Kolesik for stimulating discussions and advice.
23
CHAPTER 2
References
Al-Raoush, R.I. & Willson, C.S. 2005. Extraction of physically realistic pore network
properties from three-dimensional synchrotron X-ray microtomography images
of unconsolidated porous media systems. Journal of Hydrology, 300, 44-64.
Bartoli, F., Genevois-Gomendy, V., Royer, J.J., Niquet, S., Vivier, H. & Grayson, R.
2005. A multiscale study of silty soil structure. European Journal of Soil
Science, 56, 207-224.
Brewer, R. 1964. Fabric and mineral analysis of soils. John Wiley and Sons, New
York.
Chittleborough, D. 1992. Formation and pedology of duplex soils. Journal of
Experimental Agriculture, 32, 15-25.
Clark, I.J., Whalley, W.R. & Barraclough, P.B. 2003. How do roots penetrate strong
soil? Plant and Soil, 255, 93-104.
Clausnitzer, V. & Hopmans, J.W. 2000. Pore-scale measurements of solute
breakthrough using microfocus X-ray computed tomography. Water Resources
Research, 36, 2067-2079.
Cox, J.W., Chittleborough, D.J., Brown, H.J., Pitman, A. & Varcoe, J.C.R. 2002.
Seasonal changes in hydrochemistry along a toposequence of texture-contrast
soils. Australian Journal of Soil Research, 40, 581-604.
Crestana, S., Cesareo, R. & Mascarenhas, S. 1986. Using a computed-tomography
miniscanner in soil science. Soil Science, 142, 56-61.
Creswell, H.P. & Kirkegaard, J.A. 1995. Subsoil amelioration by plant roots - the
process and the evidence. Australian Journal of Soil Research ,33, 221-239.

CHAPTER 2
24
Gregory, P.J., Hutchison, D.J., Read, D.B., Jenneson, P.M., Gilboy, W.B. & Morton,
E.J. 2003. Non-invasive imaging of roots with high resolution X-ray micro-
tomography. Plant and Soil, 255, 351-359.
Heeraman, D.A., Hopmans, J.W. & Clausnitzer, V. 1997. Three dimensional imaging of
plant roots in situ with X-ray computed tomography. Plant and Soil, 189, 167-
179.
Heijs, A.W.J., Delange, J., Schoute, J.F.T. & Bouma, J. 1995. Computed-tomography as
a tool for non-destructive analysis of flow patterns in macroporous clay soils.
Geoderma, 64, 183-196.
Isbell, R.F. 1996. The Australian Soil Classification. CSIRO, Melbourne.
Kolesik, P., Fouard, C., Prohaska, S. & McNeill, A. 2004. Automated method for non-
destructive 3D visualisation of plant root architecture using X-ray tomography.
In: 4th International Workshop on Functional-Structural Plant Models (eds.
C.Godin, J.Hanan, W.Kurth, A.Lacointe, A.Takenaka, P.Prusinkiewics,
T.DeJong, C.Beveridge & B.Andrieu), pp. 27. UMR Cirad, Cnrs-Ephe-Inra-
Inria-Ird-Universite de Montpellier II. Montpellier, France.
Li, D.C., Velde, B. & Zhang, T.L. 2004. Observations of pores and aggregates during
aggregation in some clay-rich agricultural soils as seen in 2D image analysis.
Geoderma, 118, 191-207.
McBratney, A.B., Moran, C.J., Stewart, J.B., Cattle, S.R. & Koppi, A.J. 1992.
Modifications to a method of rapid assessment of soil macropore structure by
image analysis. Geoderma, 53, 255-274.
McDonald, R.C., Isbell, R.F., Speight, J.G., Walker, J. & Hopkins, M.S. 1990.
Australian Soil and Land Survey Book. Inkata Press, Melbourne.
McNeill A.M., Kolesik P., Wauchope K., Coventry, D.C. 2004. Root response to
localised nitrogen supply: destructive sampling and non-destructive 3D imaging.

25
CHAPTER 2
In: Abstracts of poster papers presented at The International Rhizosphere
Congress Munich September 2004 Session 8 Imaging and spatial resolution of
diversity and activities.
http://www.gsf.de/iboe/congress/Rhizosphere04_Abstracts_PP.pdf
Moran, C.J. & McBratney, A.B. 1992. Acquisition and analysis of three component
digital images of soil pore structure. I. Method. Journal of Soil Science, 43, 541-
549.
Moran, C.J., Pierret, A. & Stevenson, A.W. 2000. X-ray absorption and phase contrast
imaging to study the interplay between plant roots and soil structure. Plant and
Soil, 223, 101-117 .
Moreau, E., Velde, B. & Terribile, F. 1999. Comparison of 2D and 3D images of
fractures in a Vertisol. Geoderma, 92, 55-72.
Oh, W. & Lindquist, B. 1999. Image thresholding by Indicator Kriging. IEEE
Ttransactions on Patterns Analysis and Machine Intelligence, 21, 590-602.
Pankhurst, C.E., Pierret, A., Hawke, B.G. & Kirby, J.M. 2002. Microbiological and
chemical properties of soil associated with macropores at different depths in a
red-duplex soil in NSW Australia. Plant and Soil, 238, 11-20.
Perret, J., Prashner, S.O., Kantzas, A. & Langford, C. 1999. Three-dimensional
quantification of macropore networks in undisturbed soil cores. Soil Science
Society of America Journal, 63, 1530-1543.
Phogat, V.K. & Aylmore L.A.G. 1989. Evaluation of soil structure by using computer
assisted tomography. Australian Journal of Soil Research, 27, 313-323.
Pierret A., Capiowiez, Y., Belzunces, L. & Moran, C.J. 2002. 3D reconstruction and
quantification of macropores using X-ray computed tomography and image
analysis. Geoderma, 106, 247-271.

CHAPTER 2
26
Pierret, A., Moran, C.J. & Pankhurst, C.E. 1999. Differentiation of soil properties
related to the spatial association of wheat roots and soil macropores. Plant and
Soil, 211, 51-58.
Rengasamy, P. 2002. Transient salinity and subsoil constraints to dryland farming in
Australian sodic soils: an overview. Australian Journal of Experimental
Agriculture, 42, 351-361.
Rengasamy, P., Chittleborough, D. & Helyar, K. 2003. Root-zone constraints and plant-
based solutions for dryland salinity. Plant and Soil, 257, 249-260.
Soil Survey Staff. 1999. Soil Taxonomy: a basic system of soil classification for making
and interpreting soil surveys. United States Government Printer. Office,
Government Printer, Washington D.C.
Stace, H.C.T., Hubble, C.D., Brewer, R., Northcote, K.H., Sleeman, J.R., Mulcahy,
M.J., Hallsworth, E.G., 1968. A handbook of Australian soils. Rellim Technical
Publications: Glenside, South Australia.
Stewart, J.B., Moran C.J. & Wood J.T. 1999. Macropore sheath: quantification of plant
root and soil macropore association. Plant and Soil, 211, 59-67.
Vogel, H.J. 1997. Morphological determination of pore connectivity as a function of
pore size using serial sections. European Journal of Soil Science, 48, 365-377.
Warner, G.S., Nieber, J.L., Moore, I.D. & Geise, A. 1989. Characterising macropores in
soil by computed tomography. Soil Science Society of America Journal, 53, 653-
660.
Yunusa, I.A.M., Mele, P.M., Rab, M.A., Schefe, C.R. & Beverly, C.R. 2002. Priming of
soil structural and hydrological properties by native woody species, annual
crops, and a permanent pasture. Australian Journal of Soil Research, 40, 207-
219.

27
CHAPTER 2
Figures
Figure 1 a) 2D view of the pores > 1mm in the upper 40 cm of a sodic texture-contrast
soil and b) 3D reconstruction of the macroporosity generated with a medical CT
machine. The vertical bars indicate the approximate position of the small samples in
Figures 2 and 3.
Figure 2 Volume reconstruction of the porosity (pores > 40µm) of the interface
subsamples by means of the micro-CT images. Arrows delineate the E-Btn interface.
Figure 3 Subsample skeleton reconstruction of the porosity (pores > 40µm) of samples
from the interface samples. Object A in subsample 3 was not taken into consideration
for the inclination, tortuosity and length measurements. The skeleton represents pores
with a single line (see text).
Figure 4 Distribution of horizontal and vertical pores as a function of depth of the
interface of subsample 1 obtained by scanning with a micro-CT machine. The 0 mm
depth does not correspond to the top of the undisturbed volume analysed but is the
location of the interface of the sample.
Figure 5 Tortuosity distribution of the “designated ” horizontal and vertical pores in
subsample 1 obtained by scanning with a micro-CT machine. This is the same volume
analysed in Figure 4.
Figure 6 Volumetric pore-size distribution (as a proportion of total number of pores) in
the A and E-horizons (0 cm – 27 cm) , E-B horizon interface (27 cm – 35 cm), and Btn

CHAPTER 2
28
horizon (35 cm – 47 cm) of the undisturbed Core 1 obtained from the medical CT
images.
Figure 7 The pore-size distribution in proportions of pore volumes of the macropores in
the A, E, interface and Btn horizons derived from the medical-CT images.
Figure 8 Pore-size distributions in relation to pore volumes of the mesopores of the E
and Btn horizon from the micro-CT images.
Figure 9 Cumulative length distribution of the horizontal and vertical pores in
subsample 1 taken from the interface of an undisturbed core scanned with the micro-CT
machine.
29
CHAPTER 2
Tables
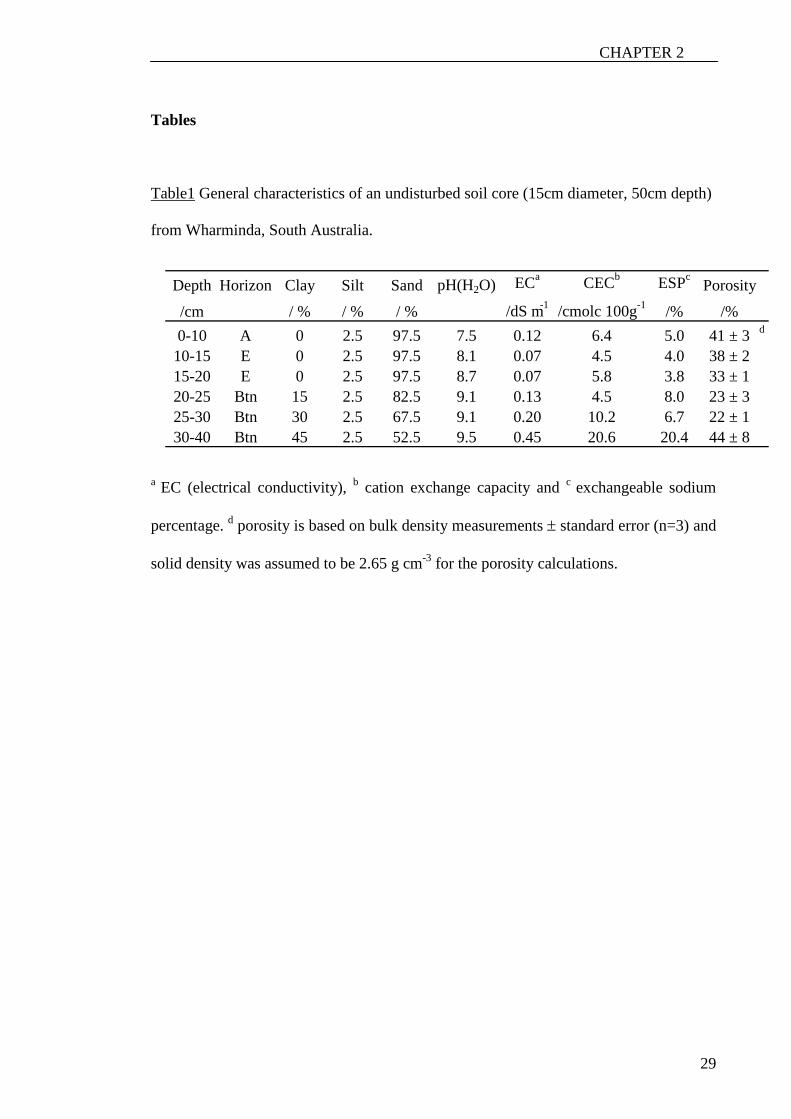
Table1 General characteristics of an undisturbed soil core (15cm diameter, 50cm depth)
from Wharminda, South Australia.
a EC (electrical conductivity), b cation exchange capacity and c exchangeable sodium
percentage. d porosity is based on bulk density measurements ± standard error (n=3) and
solid density was assumed to be 2.65 g cm-3 for the porosity calculations.
Depth Horizon Clay Silt Sand pH(H 2 O) EC a CEC b ESP c Porosity /cm / % / % / % /dS m -1 /cmolc 100g -1 /% /% 0-10 A 0 2.5 97.5 7.5 0.12 6.4 5.0 41 ± 3 d
10-15 E 0 2.5 97.5 8.1 0.07 4.5 4.0 38 ± 2 15-20 E 0 2.5 97.5 8.7 0.07 5.8 3.8 33 ± 1 20-25 Btn 15 2.5 82.5 9.1 0.13 4.5 8.0 23 ± 3 25-30 Btn 30 2.5 67.5 9.1 0.20 10.2 6.7 22 ± 1 30-40 Btn 45 2.5 52.5 9.5 0.45 20.6 20.4 44 ± 8
CHAPTER 2
30
Table 2 Porosity, numerical density, mean network size and maximum network size of
three undisturbed soil cores calculated from the images obtained from a medical CT.
Core Horizon Depth analysed Porosity Numerical
density Mean pore
volumetric size Maximum
network size
/cm / % number of pore networks/cm -3 /mm 3 /cm 3 cm -3
1 A and E 0-16 17.6 13.9 352.5 4.49 E/Btn interface 16-26 0.68 4.2 45.6 0.05 Btn 26-43 0.97 3.2 84.1 0.12
2 A and E 0-21 17.47 10.2 473.9 5.21 E/Btn interface 21-31 4.76 4.5 296.2 0.03 Btn 31-48 4.51 5.8 214.5 0.84
3 A and E 0-20 18.69 6.1 854 4.32 E/Btn interface 20-26 0.29 1.7 48.2 0.69 Btn 26-41 4.17 8.3 140.3 0.45

31
CHAPTER 2
Table 3 Porosity, numerical density, mean network size and maximum network size of
three intact interface subsamples calculated from the images obtained from a micro CT.
Interface subsample Interface Depth Porosity Numerical density Mean pore
volumetric size Maximum
network size
/mm / % number of pore networks /cm -3 / µ m 3 / mm 3 mm -3
subsample 1 E 0-9 14.8 107.4 202.4 0.531 Btn 9-18 0.5 0.6 470.1 0.001
subsample 2 E 0-9 12.7 53.3 350.2 0.152 Btn 9-19 0.2 3.8 91.3 0.042
subsample 3 E 0-10 11.7 45.5 376.9 0.121 Btn 10-19 0.5 3.8 183.7 0.021

CHAPTER 2
32
Figures Figure 1
100 mm
A
E
Btn
a) b)

33
CHAPTER 2
Figure 2
Subsample 1 Subsample 3 Subsample 2
1 cm

CHAPTER 2
34
Figure 3
A
1 cm
Subsample 1 Subsample 2 Subsample 3
35
CHAPTER 2
Figure 4
0 5 10 15 20 25 30 35
0
1
2
3
4
5
6
7
8
9
10
Dep
th /m
m
/mm
Percentage of pores
horizontal vertical

CHAPTER 2
36
Figure 6
0
5
10
15
20
25
30
35
1.5 2 2.5 3 3.5 4 4.5 5 5.5 6 6.5 7 7.5 8
Tortuosity
Perc
enta
ge o
f por
es
pore
s
horizontal vertical
37
CHAPTER 2
Figure 7
0.00
0.02
0.04
0.06
0.08
0.10
0.12
0.14
0.11
0.50
0.90
1.30
1.69
2.09
2.48
2.88
3.35
3.78
4.28
4.79
5.29
6.08
6.80
7.92
8.71
10.1
2
11.4
5
13.1
4
16.8
1
23.0
4
45.2
9
1831
.3
volume (mm3)
rela
tive
pore
vol
ume
0
0.02
0.04
0.06
0.08
0.1
0.12
0.14
0.1
0.6
1.2
1.7
2.3
2.8
3.4
3.9
4.5
5.1
5.8
6.6
7.2
8.3
9.4
10.8
12.2
14.8
18.8
25.1
44.8
137.
7
volume (mm3)
rela
tive
pore
vol
ume
0.000
0.002
0.004
0.006
0.008
0.010
0.012
0.014
0.016
0.018
0.020
0.1
1.0
1.9
2.8
3.7
4.6
5.5
6.4
7.3
8.4
9.3
10.2
11.2
12.3
13.9
15.4
17.4
19.4
22.5
26.7
34.7
52.0
97.8
volume (mm3)
rela
tive
pore
vol
ume
A and E horizon
E-Btn interface
Btn horizon
Volume /mm3
Rel
ativ
e po
re
volu
me

CHAPTER 2
38
Figure 8
0.000
0.002
0.004
0.006
0.008
0.010
0.012
0.014
0.016
0.018
0.020
0.20 7.01 13.81 20.62 27.42 34.23 41.03 47.84 54.64 61.45
Volume /μm 3 X10⁴
Rel
ativ
e po
re v
olum
e
volu
me sand
0.000
0.005
0.010
0.015
0.020
0.025
0.030
0.035
0.040
0.045
0.050
0.21 1.65 3.09 4.32 5.28 6.58 8.23 10.08 18.66 35.80 84.98 Volume /µm 3 x10⁴
Rel
ativ
e po
re v
olum
e
volu
me

39
CHAPTER 2
Figure 9
0
0.2
0.4
0.6
0.8
1
1.2
0 1000 2000 3000 4000 5000
Length /μm
vertical horizontal

CHAPTER 3
40
Using computer tomography to visualise and quantify macropores in
intact soils, the issue of thresholding
Laurence Jassognea,c*, Rob Davidsonb, Ann McNeillc, Ganga Hettiarachchid and David
Chittleboroughc
aSchool of Plant Biology, University of Western Australia, Crawley Western Australia,
6907
bDavidson’s Agricultural Research and Development, PO Box 280, Mt Pleasant, SA,
5235 Australia
cSoil and Land Systems, School of Earth and Environmental Sciences, University of
Adelaide, Waite Campus, PMB 1 Glen Osmond, SA, 5064 Australiad
dDeparment of Agronomy, 2107 Throckmorton Plant Sciences Center, Kansas State
University, Manhattan, KS 66506 USA

CHAPTER 3
41
Abstract
Soils with strong texture contrast between surface and B horizons, called duplex soils in
Australia dominate the agricultural zone of western and southern Australia. The texture
of the A and E horizons is usually coarse and the B horizon is often of much finer
texture. These horizons are inimical to root proliferation. Native perennial vegetation
has created biopores that have been observed to extend many meters through the profile.
These macropores not only provide pathways through the soil otherwise impenetrable
by many plants but also improve exposure to preferential flows of oxygen, water and
nutrients. Understanding pore distribution is fundamental to understanding how roots
proliferate in these soils more particularly whether they are utilising a pre-existing
network or creating a network ab initio. Pore characteristics required to predict root
growth in duplex soils are pore distribution, orientation, length and connectivity.
Measurements of these pore characteristics can only be made if the three dimensional
(3D) structure of the pores is known. Analysis of CT-images from soil samples allows a
3D reconstruction from the soil pore network. In this study, a thresholding method
developed by Oh and Lindquist (1999) that utilized the spatial covariance of the image
in conjunction with indicator kriging to determine object edges, was tested to determine
macroporosity in 16 bit X-ray absorption images obtained from X-ray scans of intact
cores of duplex soils. Software created by Oh and Lindquist (1999) 3DMA-rock is a
local and adaptive technique that minimises errors in segmentation of grey scale images
in soil but the output is very sensitive to the chosen threshold values. This study shows
that the method of Oh and Lindquist (1999) is improved if the segmentation values are
derived by fitting two Gaussian curves on the each stack of images. This method will
allow visualising root exploration and its relation with macroporosity in hostile subsoils
such as those in duplex soils.

CHAPTER 3
42
Keywords: texture-contrast soils, macropores, computer tomography, thresholding,
imaging
1. Introduction
Soils with strong texture contrast between surface and B horizons, called duplex soils in
Australia, dominate the agricultural zone of western and southern Australia. The texture
of the A and E horizons is usually coarse (sand, loamy sand, sandy loam) and the B
horizon is often much finer (clay, clay loam). The E and B horizons are inimical to root
proliferation. The A and E horizons have a low water holding capacity (Tennant et al.,
1992). The B horizons (especially at the E horizon contact) are non pedal and have high
strength and bulk densities in excess of 2 g.cm-3 (Chittleborough, 1992). It is not
uncommon for the texture transition to be abrupt viz. over a distance <1cm. In the B
horizons of these soils, roots of agricultural crops and pastures, both perennials and
annuals, are often in pores not of their own making (McCallum et al., 2004.)
Macropores in these duplex soils have their origin in physico-chemical reactions,
seasonal wetting and drying gives rise to high shrink/swell forces and large cracks that
extend vertically 20-100cm from the top of the B horizon. Native perennial vegetation
e.g. Acacias, Eucalypts, Proteaceae, have created biopores that have been observed to
extend many metres through the profile. The macropores not only provide pathways
through the soil otherwise impenetrable by many plants, but also improve exposure to
preferential flows of oxygen, water and nutrients. Understanding pore distribution is
fundamental to understanding how roots proliferate in these soils more particularly
whether they are utilising a pre-existing network or creating a network ab initio.

CHAPTER 3
43
Pore characteristics required to predict root growth in duplex soils are pore distribution,
orientation, length and connectivity (Gregory and Hinsinger, 1999) and measurements
of these pore characteristics can only be made if the three dimensional (3D) structure of
the pores is known. Unfortunately, this cannot be done with conventional techniques
such as soil thin sections. Although the use of thin sections can be very valuable under
certain circumstances (Mooney et al., 1998), thin sections have significant limitations:
they are time consuming to prepare, involve impregnation of the soil with resins that
lead to perturbations in structure and the 3D measurements obtained are derived from
two dimensional information (Moreau et al., 1999). Another method used in the field
involves photographing dye traces to show water flow through pores structures, but
again, the resultant spatial information is very limited (Alaoui and Helbling, 2006).
Computer tomography (CT) analysis has proven to be a powerful tool in soil science
insofar as it enables non-invasive and non-destructive analysis of the internal structure
and texture of samples by mapping the density distribution at high resolution in three
dimensions. It has been used since the 1980s to investigate soil structure (Crestana et
al., 1986) and is currently the only technique that allows visualisation and
measurements in 3D of porosity in a manner that is non-destructive and non-invasive
(Asseng at al., 2000). Scanning soil cores results in grey scale images that can be related
to the density of soil through differences in X-ray absorption thereby facilitating a 3D
representation of the inside of the sample.
The output from a CT scan is a stack of grey scale images that can be related to the
density of the samples. Regions of low density represent pores and regions of high
density the soil matrix. There is a need to identify, reconstruct and visualise the 3D
networks of macropores. Thresholding is the step that most influences the rest of the 3D
CHAPTER 3
44
measurements from the image segmentation. During this process, binary images are
constructed by assigning the pores one value and pixels representing the background or
soil matrix another value (generally these values are 0 and 1). The thresholding
operation is complicated by various factors such as non-stationary and correlated noise,
ambient illumination, variation of grey levels within the object and its background,
inadequate contrast, and object size not commensurate with the scene. The lack of
objective measures to assess the performance of various thresholding algorithms, and
the difficulty of extensive testing in a task-oriented environment are major handicaps
(Sezgin and Sankur, 2004). Thresholding can be applied globally based on the grey
level information of the whole stack of images, or locally based on only a part of the
stack. In addition to the grey-level information, spatial information in the image can be
used to segment with a greater accuracy (Oh and Lindquist, 1999).
Pierret et al. (2002) developed an algorithm for thresholding that was iterative, local and
adaptive. In their study, it was assumed that very porous regions were likely to be part
of macropores, therefore, the tracing algorithm was initiated from the brightest voxel in
the 3D volume. Once the first object was traced, the tracing resumed from the second
brightest voxel that was not included in the previous object. This process was repeated
until the grey level of the brightest remaining voxel was less than a preset grey level
threshold (Pierret et al., 2002; Capowiez et al., 2003). The disadvantage of this method
was that the mathematical morphological measurements used needed an isotropic
dataset. The anisotropic voxels had to be transformed, which led to a loss of spatial
resolution and there was a requirement for subsampling the 16 bit dicom images to 8 bit
raw images, which again led to loss of information in the image.
CHAPTER 3
45
In this study, a thresholding method developed by Oh and Lindquist (1999) that utilized
the spatial covariance of the image in conjunction with indicator kriging to determine
object edges, was tested to determine macroporosity in 16 bit X-ray absorption images
obtained from X-ray scans of intact cores of duplex soils. The method is local and here
we test the hypothesis that it guarantees smoothness in the threshold surface.
2. Materials and methods
2.1 Background
The Lambert-Beer law is applicable for a monochromatic X-ray interacting with soil:
Ι/Ι0 = exp(-µ.h)
I is the attenuated intensity, I0 is the intensity of the incoming X-rays, µ is the
attenuation coefficient and h is the thickness of the sample. Each pixel has a grey value
that represents the X-ray attenuation (µ) in that particular spot in the soil core. The
attenuation is related with the density (ρ) of the soil at that location and the atomic
number (Z) by the relationship,
µ = ρ(a + b Z3.8 / E 3.2) (1)
for energies (E) lower than 200 kV, the X-ray interaction is by the photo-electric effect
mainly. This effect depends on the atomic number of the material. For energies higher
than 200 kV, the density of the material mainly effects µ and the interaction with the

CHAPTER 3
46
material is mainly Compton scattering. The interaction between soil and X-rays has
been described in a number of studies e.g. Mori et al. (1999).
2.2 Sampling, scanning and reconstruction
Intact soil cores (50 cm long, 15 cm diameter) were taken by pressing thin-walled PVC
tubes with an hydraulic ram from an agricultural site in southern Australia (33° 54’S,
137° 47’E) near the town of Stansbury. The soil was a Red Sodosol (Isbell 1996) or a
Typic Natrixeralf (Soil Survey Staff, 1999). Cores were scanned at the Queen Elizabeth
Hospital in Adelaide with a medical CT instrument (Toshiba Aquilon, Tokyo, Japan)
operating at 120 keV and a current of 100 mA. Reconstructed images were 16 bit
DICOM attenuation maps. The value of each pixel could be related to the density of the
soil sample in that particular location. Pixel resolution (x, y-resolution) of the
reconstructed images was 0.3 mm. An image of the cross section was taken every 0.4
mm (z-resolution).
2.3 Imaging
Because cores varied considerably in their morphology the parameters necessary for
segmentation had to be assessed for each new dataset. Each dataset was divided into
different substacks that coincided with soil horizons and each of these substacks was
treated as a separate entity for segmentation (Figure 1).
The images were prepared for segmentation using ImageJ (Rasband, W.S., ImageJ, U.
S. National Institutes of Health, Bethesda, Maryland, USA, http://rsb.info.nih.gov/ij/,
1997-2007) and the following series of processes were applied. First, the interior of the
core (in the soil without the PVC tube) was selected, the outside of the selection was

CHAPTER 3
47
cleared and a particular value assigned close to the highest absorbance. In order to
enhance the contrast and increase the number of attenuation values in the transition
between pore and matrix, the grey scale images were normalised using ImageJ with an
enhance contrast plugin and limiting the ratio of saturated pixels to 0.1 %.
Normalisation of the images was based on the histogram of the stack and not on the
histogram of each separate image. A histogram of the normalised stack was created and
two Gaussian curves were fitted on this histogram representing the distribution of the
grey values in the stack. The peak of the histogram representing the distribution of
attenuation, or grey levels, of the soil matrix and the part of the histogram that contained
the darker pixels representing pores were selected for analysis by OriginPro7.5. The
segmentation method developed by Oh and Lindquist (1999) requires two threshold
values as input based on the grey scale value of macropore and soil material. The pixels
lower than the first threshold (T1) belong to the pore phase whereas pixels higher than
the second threshold (T2) belong to the soil matrix. The first threshold was selected by
subtracting the mean of the first Gaussian curve with its width. The second threshold
was calculated by adding 3000 to the first threshold. This value was chosen by
continually comparing results for different datasets when varying the two threshold
values. The entire process from selection through to segmentation was undertaken on
every dataset.

CHAPTER 3
48
37
87
137
187
237
287
337
387
437
-100 0 100 200 300 400
absorption (HU)
dept
h (m
m)
Interface
A
E
interface
B
Figure 1: Change in absorbance with depth in relation to horizons of a sodic duplex
soil. A, E and B refer to the horizons.

CHAPTER 3
49
The sensitivity of the output (i.e. porosity) was tested by changing the value of T2 and
the width between T1 and T2. The attenuation values for clay are higher than the
attenuation values for sand. If one set of cut-off values was chosen for the entire stack
of images of the soil core, the sand matrix was selected if pores in the clay were to be
targeted or none of the pores in the clay if the pores in the sand were targeted. For this
reason, the original stacks had to be divided into several substacks the boundaries of
which were the boundaries of the soil horizons (A, E, E/B interface and B) (Figure 1).
The interface is the region of soil 2 cm at either side of the E/B boundary.
Images at the interface were of sand and clay and therefore images were segmented
twice. First, pores in the sand, and then pores in the clay, were identified. This last
segmentation meant that areas in the image containing lower densities than clay, like
sand were selected as well. These areas were removed by subtracting them from the
segmented clay interface images following which the images were added to the
interface images of sand at the interface. Binary stacks of the layers were added and
these stacks used to reconstruct and visualise porosity of the intact cores.

CHAPTER 3
50
Figure 2: Attenuation through a pore of approximately 5 pixels in diameter from the
interface region. A: a pore in clay matrix B: a pore in sand matrix
A
B
-15000
-10000
-5000
0
5000
10000
15000
20000
25000
0 1 2 3 4 5
distance (pixels)
norm
alis
ed a
ttenu
atio
n A
B
A
B
-15000
-10000
-5000
0
5000
10000
15000
20000
25000
0 1 2 3 4 5
distance (pixels)
norm
alis
ed a
ttenu
atio
n B
A
CHAPTER 3
51
3. Results
The average attenuation of the XY sectional images was markedly different between
horizons (Figure 1). The surface of the A horizon had been subjected to considerable
mechanical disturbance by tillage. Coupled with a high root density this horizon had a
lower density than deeper in the A horizon and the E horizon. Because of these
differences, A and E horizon images were separated and treated as two different stacks.
Variability within the A horizon was high and was divided in smaller substacks for
processing. Images of the E and B horizons had markedly different grey values and the
images were also divided into substacks. Images located in the interface contained
regions of sand and clay and were included in a separate stack. Clays have higher X-ray
absorbance than sands. Pores of the same diameter in the E-horizon and the B-horizon
have different attenuation values (Figure 2). If threshold values are chosen to detect
pores in clay, pixels belonging to the sandy soil matrix will be selected as well. This can
be due to different materials filling the pores as explained earlier, but the pixels in pores
of the B-horizon can have attenuation values similar to soil matrix pixels in the E-
horizon. A more likely reason for misidentification lies in the reconstruction of the cross
sections from the projection images. The solution was to undertake the reconstruction
process twice. Interface images composed of both sand and clay phases were processed
twice in order to identify pores in sand and clay matrices separately.
Sensitivity analysis showed that changing T2 from 738 HU to 1044 HU increased the
porosity (Figure 3). This was not surprising because selecting a higher T2 highlighted
smaller pores having higher attenuation and expanded the edge of bigger pores.

CHAPTER 3
52
Figure 3: Change in porosity for different values of T2 when T1 is varied.
T2

CHAPTER 3
53
Increasing the difference between T1 and T2 and keeping the same value for T2
decreased the porosity. By increasing the difference, the population of voxels attributed
to pores decreased, and the number of voxels on which indicator Kriging was applied
increased. The larger the difference between T1 and T2, the smaller the porosity.
Despite the original dicom grey scale images being 16 bit images and therefore the
image having 216 different attenuation values, values for the transition from absorption
by pores to absorption by the soil matrix were in a narrow interval of approximately
3000 grey levels for the A and E horizon and 5000 grey levels for the B horizon. The
magnitude of the interval of the attenuation values, at which this transition occurs,
seems to be dependent on soil texture. The transition in attenuation values between pore
and soil matrix in clay occurs over a longer interval than in a sand matrix (Figure 4).
The Impact of changing the threshold value on porosity is much bigger in E than B
horizon: >20-fold in E horizon qnd about 4-fold in B horizon for a 20% increase in
threshold value.
4. Discussion
In soil, the material that fills up pores is mostly air, water, organic matter and roots or a
combination of this matrices. When vertical cracks in clay formed by shrink-swell
forces are infilled with quartz of silt and sand size from E horizons these infillings have
a different X-ray attenuation. The difference allows the visualisation of soil porosity
non-destructively. However, the attenuation differences between the fillings in pores
and the matrix of the clay B horizon are not large enough to allow precise separation of

CHAPTER 3
54
these structures. Scanning the cores at a lower energy would improve the contrast
between the materials but would decrease the signal to noise ratio and the image quality
(Heeraman et al., 1997).

CHAPTER 3
55
Figure 4: Variation of porosity when a single threshold value increases for the E and B
horizons.
y = 0.0002x2 - 0.4423x + 204.1R2 = 0.9965
0
1
2
3
4
5
6
7
8
800 850 900 950 1000 1050 1100 1150
Threshold
poro
sity
(%)
y = 3E-05x2 - 0.0642x + 34.607R2 = 0.9944
0
0.5
1
1.5
2
2.5
1000 1050 1100 1150 1200 1250 1300 1350
Threshold
poro
sity
(%)
E-horizon
B-horizon

CHAPTER 3
56
In this study porosity was classified by including every material that can fill pores that
is not the surrounding soil matrix (including fresh roots drilling through soil). In the
Sodosol profiles studied here, pores in the interface may contain roots, and sand from
the E horizon transported further down the profile. Scanning samples at lower energies
could improve the contrast between objects in the sample. Scanning a soil sample at low
and high energy (dual energy scanning) can make it possible to locate water in the soil
core (Rogasik et al., 1999). However this was not possible in this study because
increasing sample size at low energy offered by medical scanners can result in beam
hardening artefacts. Beam hardening occurs when low energy X-rays are preferentially
absorbed when they traverse an object.
Image segmentation or thresholding is an important step in 3D visualisation and
measurements. It involves the separation of the pixels belonging to the pore phase from
the ones belonging to the soil matrix. This process includes converting a grey scale
image to an image with only two values (binary image). The population of pixels
belonging to the porosity phase receives value 1 and the pixels belonging to the soil
matrix phase get value 0.
Different segmentation or threshold techniques exist. The simplest one, also called
global segmentation, uses one threshold value for the entire images based on the
histogram of the stack of images (Heijs et al., 1995; Capowiez et al., 1998; Li et al.,
2004; Jassogne et al., 2007). The threshold value can be chosen visually, using simple
imaging software and by comparing the segmented images with the original image but it
is uncertain whether the value chosen is truly representative of the pore values in the
grey scale images using this technique. This issue has been addressed in some studies
by constructing an artificial pore and using the value that visualised a macropore with
the same width as the artificial macropore (Li et al., 2004). Identifying pores created by

CHAPTER 3
57
roots or burrowing animals is easier in reconstructed cores than in intact cores.
Depending on the particle size to which the soil has been sieved, reconstructed cores do
not contain pores higher than a certain resolution. Intact cores can contain pores created
by plants in earlier seasons that makes the task of choosing threshold values for porosity
in intact cores even more complex. Additionally, small pores have a lower contrast and
lower attenuation than large pores and there is a trade off between the resolution of
pores identified and the overestimation of the larger pores (Pierret et al, 1999). In
theory, it is possible to identify objects in an image that are larger than twice the voxel
resolution. If the cut-off values are chosen to isolate the small pores, the larger pores
will be overestimated. This is illustrated in Figure 5, when higher values are chosen for
the second threshold value (T3 and T5), smaller pores will be selected but more soil
matrix pixels around the bigger pixels.
Oh and Lindquist (1999) have presented a segmentation method that utilises the spatial
covariance of the image in conjunction with indicator Kriging to determine object
edges. The use of indicator Kriging makes the thresholding local and guarantees
smoothness in the threshold surface. The method requires identification a priori of the
population of some percentage of the image. In practice, this is not difficult to achieve.
It is often possible to identify the population type of much of the image with negligible
identification error (e.g. voxels clearly inside pores). The majority of the problem comes
from pore-edge voxels or small, low contrast pores. A first pass over the image
produces population assignments for a fraction of the image (non-edge voxels), leaving
a remaining population unidentified, between two grey scale values (T1 and T2).
Minimum variance estimation is then utilised on these to complete the segmentation of
the image.

CHAPTER 3
58
Figure 5: The effect on porosity of increasing the width between threshold values T1-
T5).
0
1000
2000
3000
4000
5000
6000
33400 33500 33600 33700 33800 33900 34000
attenuation values
coun
ts x
103
T1 T2
T3T4T5
T1 - T2T1 – T3 T4 – T5
0
1000
2000
3000
4000
5000
6000
33400 33500 33600 33700 33800 33900 34000
attenuation values
coun
ts x
103
T1 T2
T3T4T5
T1 - T2T1 – T3 T4 – T5
14 cm

CHAPTER 3
59
This method was efficient in including objectively pixels of pore edges and pixels
belonging to small pores (high uncertainty) to the pore phase. Nevertheless, the output
seemed to be highly sensitive to which value of T1 and T2 was chosen (Figure 5).
In addition, our images always contained a certain amount of noise. Nor was our
segmentation method perfect. Some isolated elliptical volumes were segmented that,
based on visual interpretation, were not cracks and could not have been created by plant
roots or burrowing animals. Therefore, a volume filter using Amira was used to
eliminate these volumes from the assigned pore space (Figure 6).
One possibility to obtain images of better quality would be to use tubes of a different
material (e.g. Perspex). This would decrease X-ray absorption because of the container
thereby increasing quality of the original images and thus the quality of the
segmentation. The PVC tubes used to contain soil cores during the thresholding process
absorbed a lot of X-rays.
High quality, meaning maximum contrast between a feature and background is
important for the visualisation of the object. Detectability in our system depended on
system resolution, system noise, size and composition of background (soil) and size and
composition of feature (pore or root) (Sivers and Silver, 1990).
Resolution had a significant impact on the properties of the system being characterised.
The impact was controlled by two factors: the grain size/resolution ratio and the
uniformity of the system (Al-Raoush and Willson, 2005).

CHAPTER 3
60
Figure 6: Reconstruction of the macroporosity of the E-horizon of a duplex soil before
and after filtering of volumes due to noise.
14 cm

CHAPTER 3
61
Due to partial-volume artefacts, which were caused by the averaging within a voxel
between highly contrasting materials, boundaries of small objects with high density
differences were blurred and contrast was reduced in the image. Reduced contrast may
obliterate small details of low contrast, blurred boundaries may obliterate fractures, and
artefacts degrade images in general (Heijs et al., 1995).
This study has shown that image analysis of X-ray CT images to visualise 3D volumes
of macropores can be achieved for large intact soil cores. However, thresholding is
critical in order to delineate pores from the soil matrix and has an effect on quantitative
values for total porosity. Therefore, care has to be taken when comparing results from
different tomography studies, not only because resolution and scanning systems differ,
but also because the image analysis can be different and is very sensitive.
5. Conclusions
Computer tomography is a valuable method to visualise macropores in 3D in soils.
Software created by Oh and Lindquist (1999) 3DMA-rock is a local and adaptive
technique that minimises errors in segmentation of grey scale images in soil but the
output is very sensitive to the chosen threshold values. We conclude that the method of
Oh and Lindquist (1999) is improved if the segmentation values are derived by fitting
two Gaussian curves on the grey values of each stack of images. This method should
allow visualization of macroroot systems and the relationship with macroporosity in
hostile subsoils like those in texture contrast soils.

CHAPTER 3
62
Acknowledgments
The authors are grateful to Hans Lambers for support and to the CRC for Plant based
Management of Dryland Salinity for funding. Thanks to the Australian Government and
the University of Western Australia for the International Postgraduate Research
Scholarship of Laurence Jassogne. The authors would also like to thank Geoff West and
staff at the Queen Elizabeth Hospital for scanning cores.
References
Alaoui, A., Helbling, A., 2006. Evaluation of soil compaction using hydrodynamic
water content variation: Comparison between compacted and non-compacted
soil. Geoderma 134, 97-108.
Al-Raoush, R.I., Willson, C.S., 2005. Extraction of physically realistic pore network
properties from three-dimensional synchrotron X-ray microtomography images
of unconsolidated porous media systems. Journal of Hydrology 300, 44-64.
Asseng, S., Aylmore, A.G., MacFall, J.S., Hopmans, J.W., Gregory, P.J., 2000.
Computer-Assisted Tomography and Magnetic Resonance Imaging, In Smit
A.L., ed. Root Methods. Springer -Verlag Berlin Heidelberg, Berlin.
Capiowez, Y., Pierret, A., Moran, C.J., 2003. Characterisation of the three-dimensional
structure of earthworm burrow systems using image analysis and mathematical
morphology. 38, 301-310.
Capiowez, Y., Pierret ,A., Daniel, O., Monestriez, P., Kretzschmar, A., 1998. 3D
skeleton reconstructions of natural earthworm burrow systems using CAT scan
images of soil cores. Biology and Fertility of Soils 27, 51-59.
CHAPTER 3
63
Chittleborough, D., 1992. Formation and pedology of duplex soils. Journal of
Experimental Agriculture 32, 15-25.
Crestana, S., Manoel Pedro Vaz, C., 1998. Non-invasive instrumentation opportunities
for characterizing soil porous systems. Soil and Tillage Research 47, 19-26.
Crestana, S., Cesareo, R., Mascarenhas, S., 1986. Using a computed-tomography
miniscanner in soil science. Soil Science 142, 56-61.
Duliu, O.G., 1999. Computer axial tomography in geosciences: an overview. Earth-
Science Reviews 48, 265-281.
Gregory, P.J., Hinsinger, P., 1999. New approaches to studying chemical and physical
changes in the rhizosphere: an overview. Plant and Soil 211, 1-9.
Heeraman, D.A., Hopmans, J.W., Clausnitzer, V., 1997. Three dimensional imaging of
plant roots in situ with X-ray computed tomography. Plant and Soil 189, 167-
179.
Heijs, A.W.J., Delange, J., Schoute, J.F.T., Bouma, J., 1995. Computed-tomography as
a tool for non-destructive analysis of flow patterns in macroporous clay soils.
Geoderma 64, 183-196.
Isbell, R.F., 1996. The Australian Soil Classification CSIRO, Melbourne.
Jassogne, L., McNeill, A., Chittleborough, D., 2007. 3D-visualization and analysis of
macro- and meso-porosity of the upper horizons of a sodic, texture-contrast soil.
European Journal of Soil Science 58, 589-598.
Li, D.C., Velde, B., Zhang,T.L., 2004. Observations of pores and aggregates during
aggregation in some clay-rich agricultural soils as seen in 2D image analysis.
Geoderma 118, 191-207.
Mooney, S.J., N. M. Holdena, Warda M.S.,Collins J.F., 1998. The rapid preparation of
structural images from undisturbed, non-cohesive material (milled peat).
Geoderma 86, 159-168.
CHAPTER 3
64
Moreau, E., Velde, B., Terribile, F., 1999. Comparison of 2D and 3D images of
fractures in a Vertisol. Geoderma 92, 55-72.
Mori, Y., Iwama, K., Maruyama, T., Mitsuno, T., 1999. Discriminating the influence of
soil texture and management-induced changes in macropore flow using soft X-
rays. Soil Science 164, 467 - 482.
Oh, W., Lindquist, B., 1999. Image thresholding by Indicator Kriging. IEEE
transactions on patters analysis and machine intelligence 21, 590-602.
Pierret, A., Moran, C.J., Pankhurst, C.E., 1999. Differentiation of soil properties related
to the spatial association of wheat roots and soil macropores. Plant and Soil 211,
51-58.
Pierret, A., Capiowiez, Y., Belzunces, L., Moran, C.J., 2002. 3D reconstruction and
quantification of macropores using X-ray computed tomography and image
analysis. Geoderma 106, 247-271.
Rogasik, H., Crawford, J.W., Wendroth, O., Young, I.M., Joschko, M., Ritz, K., 1999.
Discrimination of soil phases by dual energy X-ray tomography. Soil Science
Society of America Journal 63, 741-751.
Sezgin, M., and Sankur, B., 2004. Survey over image thresholding techniques and
quantitative performance evaluation. Journal of Electronic Imaging 13, 146-168.
Sivers, E.A., and Silver, M.D., 1990. Performance of X-Ray Computed Tomographic
Imaging-Systems. Materials Evaluation 48, 706-713.
Soil Survey Staff, 1999. Soil taxonomy: a basic system of soil classification for making
and interpreting soil surveys, Washington.
CHAPTER 4
65
Computed tomography of intact soils cores I. Spatial analysis of soil
macroporosity before and after root growth
Laurence Jassognea,c*, Rob Davidsonb, Ann McNeillc, Ganga Hettiarachchid and David
Chittleboroughc
aSchool of Plant Biology, The University of Western Australia, Crawley, WA, 6009,
Australia
bDavidson’s Agricultural Research and Development, PO Box 280, Mt Pleasant, SA
5235, Australia
cSoil and Land Systems, School of Earth and Environmental Sciences, University of
Adelaide, Waite Campus, PMB 1 Glen Osmond, SA 5064, Australia
d CSIRO Land and Water, Waite Campus, PMB 2 Glen Osmond, SA 5064, Australia

CHAPTER 4
66
Abstract
Soils with a very strong texture contrast in the profile, called duplex soils or
texture-contrast soils, are very common in southern Australia. These soils mostly have
dense subsoils that are very hard for roots to penetrate and grow through. When roots
encounter difficulty in penetrating or ‘drilling’ through the subsoil, it has been shown
that they can use pre-existing pores, such as channels created by roots of previous plants
or cracks between peds, to proliferate through the profile and gain access to water and
nutrients. It has been suggested that deep-rooted perennials have the capacity to drill
through the E B boundary of these hostile soils, especially native plants that have
evolved with the soil environment and climate. Growing plants that drill through the
subsoil will increase the porosity of the subsoil which would lead to an increase in
subsoil permeability and enable the roots of subsequent plants to exploit water and
nutrients via these old root channels. Such knowledge of root performance and
proliferation in duplex soils is fundamental to understanding the influence of old root
channels, or relict rhizospheres, on root proliferation. Since soil is an opaque medium,
the only way to fully characterise and understand root growth and porosity for
undisturbed soils representative of the field situation is by reconstruction and
visualisation of soil porosity and root growth in 3 dimensions (3D). Techniques to do
this are still being explored and developed. In this study, medical X-ray computer
tomography (CT) CT was used to characterise in 3D the macroporosity of undisturbed
columns of duplex soils and to visualise changes in that macroporosity following new
root growth by canola (Brassica napus), lucerne (Medicago sativa) and saltbush
(Atriplex nummularia). A method using indicator kriging was adapted to the resulting
output images. It was shown that macroporosity in the duplex soils was significantly
altered after root growth, although there were no observed differences between the
changes made by an annual (B. napus) a herbaceous perennial (M. sativa) and a woody
CHAPTER 4
67
perennial (A. nummularia). The method did not seem useful on its own to measure all
wanted alterations of soil structure due to root growth.
Introduction
Soils with strong texture contrast between surface and subsoil or B horizons,
called duplex soils in Australia (Isbell 1996), dominate the agricultural zone of Western
and southern Australia. The texture of the A and E horizons is usually coarse and the B
horizon is often a dense clay that is inimical to plant root proliferation, particularly for
many exotic agricultural and horticultural crops. However, the root systems of certain
types of native Australian perennial vegetation can create biopores in these subsoils that
extend many metres through the profile (Yunusa and Newton 2003). These macropores
not only provide pathways through soil otherwise impenetrable by many plants, but are
also likely to improve root exposure to preferential flows of oxygen, water and
nutrients. The roots of introduced agricultural plants have been observed actively
growing in such remnant biopores in Australia (Passioura, 2002), suggesting that these
are preferential routes for root development of annual plants. Thus it is not surprising
that studies in the USA have also shown that corn root systems in soil previously
cropped to the perennial alfalfa had root distributions similar to that of the previous
alfalfa crop (Rasse and Smucker 1998). Perennial pasture has been shown to improve
the unfavourable structure of dense subsoils in Australia (McCallum et al. 2004), an
observation that has led to the idea of bioremediation for intractable subsoil horizons
(Stirzacker et al. 1996; Yunusa and Newton 2003). Despite the tendency of many roots
to exploit existing pores and channels, particularly deeper in the profile (Goss 1991),
they will also attempt to penetrate the matrix and, via root elongation and radial
expansion, produce new channels or biopores (Watt et al. 2006). However, information

CHAPTER 4
68
on how root systems of different species exploit subsoils, especially under undisturbed
conditions, is scarce.
Roots growing in soil change their physical, biological or chemical environment,
directly and indirectly, to improve their water and nutrient uptake and create a zone
called the rhizosphere. When a root dies, the effect of the root on the surrounding soil
continues to operate because of root decomposition. This affected zone has been called
a ‘relict’ rhizosphere and clearly will influence the growth of subsequent roots.
Understanding pore distribution is fundamental to understanding how roots proliferate
in these soils, more particularly whether they are utilising a pre-existing network or
creating a network ab initio. Plants that increase porosity in hostile soils can be of
significant importance in terms of improving nutrient and water accessibility for roots
of the next generation of plants.
Soil is an opaque medium and most conventional ways to study porosity and
root growth require the destruction of the soil, which leads to loss of spatial information
of the soil structure and its relation with root architecture and growth (Smit et al., 2000).
Computer tomography has been shown to be useful to characterise porosity and root
development in soil in 3D (Gregory et al. 1999; Pierret et al. 2002). Progress in
computer tomographic technologies now allows 3D examination of soils at very fine
resolutions (Peth et al. 2008). Computer tomography has been used recently to study the
interaction between biological and physical processes in soil (Blair et al. 2007; De
Gryze et al. 2006). It has also been used to study porosity changes at µm scale due to
heavy machinery traffic (Schaffer et al. 2007). There is a trade-off however between
sample size and resolution. The finer the resolution required, the smaller the sample
size. There is a need to integrate 3D studies at fine scales such as the root-soil- microbe
interface (ex. Feeney et al. 2006) into the increasingly bigger picture of soil aggregates,
peds, cores or blocks. Scanning with medical CT allows large soil blocks to be imaged
CHAPTER 4
69
and reconstructed in 3D although analysis is limited to features at mm scale or larger
with this technology (Pierret et al. 2002). Whilst this precludes the study of fine roots
that are clearly one major component of root systems (Pierret et al. 2005), it does enable
quantitative description of the developmental architecture of coarse roots which
necessarily preface fine root formation. Furthermore it provides a clear picture of the
tortuous pathways followed by these roots in response to soil porosity, and in hostile
subsoils in particular it can be used to investigate root behaviour in response to old root
channels or relict rhizospheres. In this study, X-ray CT was used to visualise and
characterise, in 3D, macroporosity for large intact cores of duplex soils. X-ray CT was
further used to investigate and qualitatively describe how much this macroporosity
changed when a new plant was grown in the soil core for 12 weeks. Three plant species
were used to examine whether there were differences in root system exploration of
existing soil macropores, including relict rhizospheres between an annual plant canola
(Brassica napus), a perennial herbaceous species lucerne (Medicago sativa) and a
perennial woody species saltbush (Atriplex nummularia).
Materials and methods
Soil core collection and plant growth conditions
Intact soil cores (50 cm long, 15 cm diameter) were taken by pressing thin-
walled PVC tubes with a hydraulic ram into moist soil from an agricultural site in
southern Australia (33° 54’S, 137° 47’E) near the town of Stansbury. The soil was a
Red Sodosol (Isbell 1996) or a Typic Natrixeralf (Soil Survey Staff, 1999). The bulk
density of the soil varied, it was 1.5 g cm-3 in the A horizon, 1.6 g cm-3 in the E horizon,
1.9 g cm-3 in the soil layer comprising 2 cm of the base of the E horizon and the upper 2
cm of the B horizon (hereafter called the E/B interface) and 1.8 g cm-3 in the B horizon.
The bulk density was calculated using 5 cm diameter bulk density rings. Whilst salinity

CHAPTER 4
70
in the soil cores was not an issue, with the highest electrical conductivity (EC) (1:5)
value in the core found at 45-50 cm depth with a value of 0.268 dS m-1, the
exchangeable sodium percentage (ESP) in the E/B interface was 24.2 % indicating
strong sodic properties and high strength.
The cores were carefully transported to the lab to make sure that the soil was not
disturbed. In the lab, the PVC tubes were opened longitudinally with a circular saw and
carefully slid over the intact core. The cores were then coated with liquid latex to
provide a barrier for root growth at the edges of the soil. The PVC tubes were then slid
back over the intact core, closed with cable ties and the openings of the PVC tubes were
sealed with latex. Canola, lucerne and saltbush seeds were germinated and, after 3 days
for canola and lucerne and 8 days for saltbush, one seedling was planted in each of 3
cores for each species. The plants were grown in a glasshouse in which temperature was
not controlled from July until September. An amount of water equivalent to the average
rainfall for a period of the growing season in South Australia from sowing to peak
biomass (262 mm in the period May to September) was applied to the cores over a
period of 12 weeks. The season rainfall pattern was mimicked so the plants were given
more water at early growing stages and less later. Thus the cores became drier towards
the end of the study.
X-ray CT Scanning
The cores were scanned before the seeds were planted to enable analyses of
existing porosity and again 12 weeks after planting to allow the determination of
macroporosity changes due to root growth. The cores were scanned at the Queen
Elizabeth Hospital in Adelaide, South Australia, with a medical CT instrument (Toshiba
Aquilon, Tokyo, Japan) operating at 120 keV and a current of 100 mA. Reconstructed
images were 16 bit DICOM attenuation maps that could be related to the density of the
CHAPTER 4
71
soil sample in that particular location. Pixel resolution (x, y-resolution) of the
reconstructed images was 0.3 mm. An image of the cross section was taken every 0.4
mm along the core (z-resolution).
Intact soil clods (6 cm x 6 cm) were excised, as described in Jassogne et al 2007,
Chapter 2), from the E/B interface of a separate intact core from the same site and
scanned with a microCT (Skyscan, 1076, Aartselaar, Belgium). The pixel size of these
images was 18 µm isotropically and that of the 16 bit images 1024 x 1024 pixels.
Source voltage was 100 kV and the source current 80 µA.
Determination of porosity from grey scale images
The macroporosity of the cores was determined using the images obtained by
CT-scanning and the thresholding method described in Jassogne et al. (submitted to
Geoderma, Chapter 3). Briefly, the stack of images was divided into four substacks
representing the A, E, interface and B horizons of the soil core. The interior of the core
(14 cm diameter) was selected for analysis each time and an exterior annulus (0.5 cm
thick) was excluded. This is an important analytical step because artefacts from soil
compaction can be generated at the edges of the soil core close to the PVC tube as the
tube is pushed down the soil profile while sampling. Images were normalised using the
distribution of the pixel values of the whole stack.
Gaussian curves were fitted to the histogram of each substack of images and two
threshold or cut off pixel values for delineating soil matrix and pore were chosen. The
first cut off value was calculated by subtracting the width of the first curve from the
centre. The second cut off value was calculated by adding 3000 to the first threshold in
sandy soil and 5000 in clayey soil. These numbers were chosen after thresholding the
same cores several times until suitable values were decided on which were consistent
for the sand and clay in this duplex soil. The two cut off or thresholding values obtained

CHAPTER 4
72
were then inserted in the 3D analysis program 3dma_rock (Oh and Lindquist 1999) that
employs indicator kriging, among other methods, to segment images. When the images
were thresholded, the output images were binary; one value (usually 1) was assigned to
the pixels belonging to the pore phase and another value (usually 0) to the matrix phase.
These images were imported into 3D imaging software Amira (Mercury Computer
Systems, San Diego, CA) following which volumes less than 100 pixels were removed
and macropores reconstructed and visualised. This means that all disconnected
vomumes < 3,6 mm 3 were filtered out. The connected components (connected pore
networks) were measured with a floodfill algorithm using 6 neighbours. The porosity
was calculated by dividing the area of pore pixels by the area of soil matrix pixels.
The images obtained with computer tomography show density differences in the
sample and this is the reason why pores can be differentiated from soil matrix.
However, pores in intact soil cores can be filled with air, water, living roots and organic
material including dead roots. Although, in theory, these different phases should be
detectable in the image, often the X-ray absorption of these less dense materials is very
similar to each other although quite different from the distinct soil matrix comprising
dense sand or clay particles. For this reason, porosity in this study was defined as every
phase (i.e. air, water and organic matter) that can be found in pores in soil (Pierret et al.
2002).
One way analysis of variance (ANOVA) was used to test the differences
between the porosity of each replicate core before and after root growth, and the
differences between plant species. The null hypothesis of equal means was rejected at a
probability of P < 0.05.

CHAPTER 4
73
Results
Grey scale images (CT scans)
Grey scale images of the intact soil cores, reconstructed from the medical X-ray
CT scans, showed that the E/B boundary within the interface was composed of a layer
of soil much denser than that of the B-horizon below, as defined by the very bright
pixels evident at the boundary between the sandy E and clay B horizons. Also, that the
sandy section of the E/B interface was denser (had slightly brighter grey values) than
the rest of the E horizon (Figure 1).
The images also showed cracks in the E horizon. Following destructive
sampling of one spare core after scanning it was observed that some of these cracks
were filled with air and others contained layers of organic matter, possibly old root
material. Indeed, pixel analysis of the grey scale images revealed that there were many
remnant roots in the E and the B horizons (Figure 1). Destructive sampling of the intact
soil cores also showed that the characteristics of these ‘roots’ were dependent on their
age.

CHAPTER 4
74
Figure 1: Grey image obtained from the reconstruction of a CT scan (coronal view) of
an intact sodic duplex soil core prior to root growth.
crack
new root
Biopore or remnant root
interface
crack
A
E
B

CHAPTER 4
75
Some were present as coherent pieces of organic plant material; others were
small fragments of black organic material concentrated where the root was once located.
Evidence for compaction at the edges of the visible macropores due to root growth was
absent in the grey scale images of the medical CT scans although the pixel resolution of
0.3 mm may have been too low to resolve this phenomenon. However; images of the
micro-CT also did not show evidence, in the form of lighter pixels around the edge of a
pore, of any compaction around the pores (Figure 2). The resolution of the images from
the micro-CT was much higher (18 µm pixel size) than those from the medical CT and
the porosity and roots visualised were finer, but the sample size was much smaller.
3D quantification and visualisation
Volume measurements on the 3D volume reconstructions showed that the
macroporosity in the cores increased after 12 weeks of root growth, confirming that new
macropore networks were formed. This increase in macroporosity was significant (α <
0.05) for all plant species, but there was no significant difference between them (Table
1).
The number of pores before and after root growth can indicate how many pores have
been created by new roots and how many of the existing pores have been used by new
roots. If the number decreases, it can be inferred that roots have been using existing
pore networks and probably connecting previously unconnected networks. If the
number increases, roots have been creating new networks without connecting pre-
existing pore networks. In this study, there was no significant difference in the number
of macropores between plant species (Table 1).

CHAPTER 4
76
Figure 2: 2D grey scale image from a micro-CT scan of a soil clod taken from the
interface of a sodic duplex soil. The micropores do not show any compaction at the
edges.
1.07 mm
crack pore
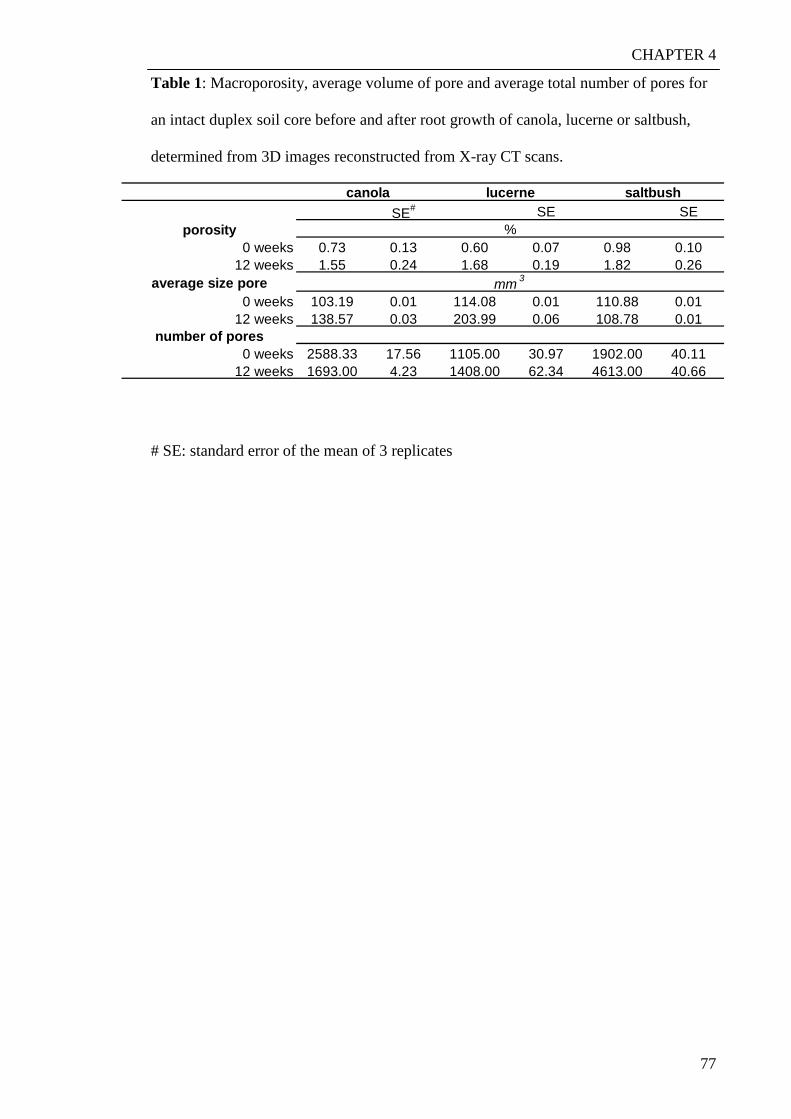
CHAPTER 4
77
SE# SE SEporosity
0 weeks 0.73 0.13 0.60 0.07 0.98 0.1012 weeks 1.55 0.24 1.68 0.19 1.82 0.26
average size pore0 weeks 103.19 0.01 114.08 0.01 110.88 0.01
12 weeks 138.57 0.03 203.99 0.06 108.78 0.01number of pores
0 weeks 2588.33 17.56 1105.00 30.97 1902.00 40.1112 weeks 1693.00 4.23 1408.00 62.34 4613.00 40.66
%
mm 3
canola lucerne saltbush
Table 1: Macroporosity, average volume of pore and average total number of pores for
an intact duplex soil core before and after root growth of canola, lucerne or saltbush,
determined from 3D images reconstructed from X-ray CT scans.
# SE: standard error of the mean of 3 replicates

CHAPTER 4
78
In two of the three replicate cores for each species macropore number increased and in
one core per plant species there was a decrease in pore number.
The average number of pores decreased for canola after 12 weeks of root growth but
increased for lucerne and saltbush, suggesting the two latter created new pores. The
average size of macropore also increased for canola and lucerne suggesting they
increased the connectivity whilst the average pore size stayed almost the same before
and after growing saltbush (Table 1).
Visual 3D reconstructions of macroporosity for each species (Figures 3, 4 and 5)
showed that in each core, cracks appeared in the E and the B horizons after 12 weeks, as
evidenced by the increase in large areas of continuous dark pixels representing less
dense material i.e. air in cracks. Despite this, it was possible to distinguish that there
were more tubular pores in the A and E horizons following root growth for all three
species.
Discussion
Macroporosity before and after root growth
Measurements from the 3D visualisations showed significant differences (α <
0.05) in macroporosity before and after root growth indicating that the macroroots of all
three species studied were penetrating soil that previously had not been explored by
macroroots, and were thus adding to the palimpsest of old pore networks from previous
roots . The visual reconstructions also showed that after 12 weeks, there were more
tubular pores in the A and E horizons because of root growth, although it is
acknowledged that these differences have to be assessed with care.

CHAPTER 4
79
Figure 3: Three views of 3D visualisation of the macroporosity in a sodic
duplex soil (a) before and (b) after root growth of canola
14 cm
A
E
Interface
B
A
E
B
a
b
canola

CHAPTER 4
80
Figure 4: Three views of 3D visualisation of the macroporosity in a sodic duplex soil
(a) before and (b) after root growth of lucerne
14 cm
A
E
B
A
E
B
a
b
lucerne

CHAPTER 4
81
Figure 5: Three views of 3D visualisation of the macroporosity in a sodic duplex soil
(a) before and (b) after root growth of saltbush.
14 cm
A
E
Interface
B
A
E
B
a
b
saltbush

CHAPTER 4
82
Cracks have arisen during the study either through drying of the cores and/or during
transportation to the medical CT. The latter is more likely for the E-horizon because the
sand was very loose but less likely for the B-horizon where drying is likely to be the
major cause of cracking in the clay. These cracks will partly be responsible for the
increase in macroporosity after 12 weeks. An attempt was made to measure the
porosity differences only in the interface and the B horizon, but because of the
aforementioned cracks, it was not possible to separate quantitatively the changes in
porosity arising from cracks or root growth. These cracks may also have connected
many networks, a process that would cause a decrease in pore number.
The location of the E/B boundary in the interface between the E and B horizons
corresponds with dense clay which is highly sodic and dispersive, and is visualised in
the CT images as a very bright thin layer in the interface region of the B horizon (Figure
1). After a rain event, water perches on the E/B boundary immediately above the B-
horizon, because of its lower permeability compared to the horizons above. Under these
circumstances, as the profile dries out the clay in suspension concentrates through a
combination of sieving and settling (Chittleborough 1992, Chapter 6, Fig1b this thesis).
This causes the formation of a very dense ‘crust’ at the E/B boundary in the interface, as
seen in this study, with densities as high as 2 g cm-3 (Jassogne et al 2007). The CT grey
scale reconstructions also showed that in the sand region above the E/B boundary of the
interface the spaces between the sand particles were filled with clay particles, hence the
slightly lighter pixels indicating higher density, while the sand particles in the E-
horizon were more loosely packed and had darker grey values (Figure 1).
The properties of the old channels or remnant roots in the duplex soil studied
and visualised with medical CT were dependent on the decomposition state of the roots.
As these roots decompose, they, and the rhizospheres, can act as sources of nutrients
(Watt et al. 2006), especially in the leached E-horizon of the duplex soil in these studies

CHAPTER 4
83
that is very low in nutrients. Old root channels can also be used by new roots because
they act as pathways of least resistance (Creswell and Kirkegaard 1995). Again, in this
duplex soil this is likely to happen predominantly in the interface which has quite a high
strength (>1 MPa, R. Murray pers comm.). Roots growing in biopores also have a
higher contact with water and oxygen, as biopores are preferential flow pathways for
fluids. The relict rhizospheres associated with old root channels could be compared to
the macropore sheath which has been defined as the area around macropores in which
80 % of the roots are located (Stewart et al. 1999). In soils with a hostile matrix not
conducive to root growth, such as the subsoil horizons of duplex soils, new roots are
likely to remain in the vicinity of the macropore created by the previous root because
that environment would be more favourable than the soil matrix. Thus the macropore
sheath would be smaller than in a more healthy soil (Pierret et al. 1999).
As explained earlier, this study showed that there was extensive root exploration
of the E horizon by all species studied (see Figures 3b, 4b and 5b).Roots growing in the
E-horizon of a duplex soil do not experience difficulties in penetration but they often
cannot access sufficient nutrients for optimal growth, not only because of the low
nutrient content and holding capacity of the soil, but also because of insufficient contact
between sand particles and roots (Passioura 2002). Low water holding capacity means
that these E horizons dry out rapidly but decomposing roots can potentially create
‘patches’ in soil that are chemically and physically favourable to the retention of water
and nutrients and thus aid the development of organisms and root growth..
Thresholding and skeletonisation
The complexity of the grey scale patterns in the CT images of the intact soil
cores precluded the use of an algorithm that selected and traced individual pores. The
best possible approach was to segment the images based on the distribution of the grey

CHAPTER 4
84
values of the pixels. Combining this technique with indicator kriging was the most
precise and objective way to threshold the images because it was both local and
adaptive (Oh and Lindquist 1999). However, when comparing the same core before and
after root growth, it was found that here again, differences had to be assessed with care.
The cores were dried out slowly, which meant that the water content, and as a
consequence, the grey level of the soil horizons, changed slightly over time. When the
cut-off values were chosen, even after normalisation, some thinner pores with grey
values close to the matrix value could be segmented in the images after 12 weeks, but
not in the initial scans. This could lead to a measured increase in porosity after 12
weeks, but would be a function of threshold methodology as opposed to an actual
increase (Jassogne et al. submitted to Geoderma, Chapter 3).
Volume 3D measurements of soil structures in situ are not the only
measurements possible from CT images. Measurements such as pore tortuosity, angle
and length can also be derived but only if the 3D network is known and a skeleton
reconstructed (see Jassogne et al 2007, Chapter 2), which is a very computationally
intensive procedure. Reconstructing the skeleton visualised in the intact cores in this
study was not possible. Cracks present in the cores caused the program to make
numerous errors. Attempts to ‘remove’ the cracks from the network were unsuccessful
because the cracks were quite large and connected with a very large proportion of the
pores. Thus, selecting the cracks for removal led to selection of these pores as well.
Some studies have reconstructed skeletons of large pores created by roots or
earthworms (Capowiez et al. 2003) but these studies were carried out on repacked soil
monoliths so that images would have been less complicated than those from an intact
soil core, and the skeleton reconstruction would have been less computationally
intensive.

CHAPTER 4
85
Micro-CT
Field observations of the duplex soil used in this study (Adcock et al 2007)
confirm that, at the end of the growing season (October to November), the E-horizon
dries out and the only available moisture is stored in the clay B horizon. The
reconstructions and pore size distributions visualised in this study show that most of the
pores were connected and that, unsurprisingly, roots had readily found pathways into
the B horizon in spite of the high density of the interface and the hard crust of the E/B
boundary. However, the channels visualised in this study were macropores > 1mm.
Under field conditions these pores will be the first to dry out and roots growing in
macropores in the B horizon will have to find other pathways, maybe via fine root
networks, to access the water stored in meso- and micro- pores. Other studies have
pointed out that roots growing in macropores can become isolated or trapped due to the
high strength of the pore walls acting as a barrier to further penetration (Stirzaker et al
1996). The pores are formed as the growing roots compact the soil around them. When
a root decomposes, the legacy is a macropore with a compact surface. New roots can
follow that macropore path as a route of least resistance when there is moisture, but
when the macropores dry out the roots cannot grow further nor can they extend laterals
to access nutrients and water in the matrix because of the pore wall resistance. In the
present study evidence for compaction at the edges of the pore was absent in the images
of the medical CT scans, although the pixel resolution of 0.3 mm may have been too
low to resolve this phenomenon. However, images of the micro-CT also did not show
evidence of any compaction around the pores, in the form of lighter pixels around the
edge of a pore (Figure 2). The resolution of the images from the micro-CT is much
higher (18 µm) than those from the medical CT and so the porosity and roots visualised
will be finer although, of course, the sample size is much smaller. It could be that
compaction of the pore walls to a point where extending lateral roots cannot penetrate is

CHAPTER 4
86
more likely to occur at the macro level where the larger diameter root has to displace
more soil particles to expand. Additionally, the transmission of the X-rays through soil
cores in the micro-CT was very low due to the relatively lower source voltage; hence
signal to noise ratio was narrow so that some detail could have been lost in the image.
Soil is very dense and the energy and amount of photons passing through the sample
need to be high enough so that the signal to noise ratio on the detector is sufficient to
give a high quality image. Although the contrast between low density materials like
water, organic material and air will be improved with low energy X-rays these may not
have sufficient penetration power and the resolution could be improved by using a
higher energy X-ray source. The technology is improving all the time, with new X-ray
CT instruments coming onto the market and becoming more readily accessible for
research. Thus, there is an emerging capacity to combine suitable X-ray energy with
detectors that provide a wide signal to noise ratio so that good contrast can be obtained
at high resolution for imaging large soil samples.
Soil has heterogeneous characteristics from the micropore to the landscape scale.
Processes occurring at the micropore scale are linked to processes at sequentially larger
scales up to the landscape scale, and vice-versa. Thus there is a need to obtain spatial
information at a range of scales in order to gain a full understanding of the interactions
between porosity and root growth, and the impacts these have on ecosystems. Studies at
both millimetre and micrometre scale are required to understand the exploration of both
individual roots as well as whole root systems in soil. Fine roots, not visualised in this
study are important for water and nutrient uptake, hence the necessity to combine
studies at different scales (Young 2001). It has been suggested that 2D analysis
techniques are still more valuable than long processing times of 3D analysis at fine
scales (Doussan et al. 2003). However, detailed information about how roots proliferate
in 3D in soil and the tortuous pathways they follow, especially in undisturbed soils

CHAPTER 4
87
where root growth is influenced by previous pores, is fundamental to a comprehensive
understanding of the architectural and morphological responses of whole root systems.
Studies to investigate this intimate interaction between soil structure and roots systems
need bigger sample sizes and medical CT experiments make this possible, even if the
resolution of the information is only at mm scale. Overall, this approach enables new
insights and understanding of the influence that relict rhizospheres have on soil porosity
and root architecture and development. This is very important in relation to the
exploitation by plants of resources such as water and nutrients, particularly in harsh soil
environments or following land use changes.
A further step in this experiment involves processing the CT scans for
reconstruction of the growing macroroots alone. These can them be superimposed on
the 3D porosity visualisations obtained in this study. This work is reported in a
subsequent companion paper (Chapter 5).
Conclusions
The pore network of soils is a palimpsest exploited by root systems of
subsequent generations and these studies using CT have been able to illustrate this for
intact cores in 3D. Macroporosity was shown to change in the A, E and B horizons of a
duplex soil after 12 weeks of root growth of an annual plant, as well as an herbaceous
perennial and a woody perennial. However careful consideration has to be taken when
interpreting scans of the same samples at different times because of the effects of
changing soil moisture content on soil structure. There were no detectable differences
between the visualised macroporosity changes incurred by 12 weeks growth of canola,
lucerne or saltbush root systems. The macropores did not show any compaction at the
edges from root growth when observed at the mm scale and micropores, observed from
micro-CT images also did not show any compaction. However, further work could

CHAPTER 4
88
investigate micro-CT images of macropores as the compaction might be observed at
that scale.
Acknowledgments
The authors thank Peter Self at Adelaide microscopy for assistance with the
micro-CT; also, Geoff West and staff at the radiography department of the Queen
Elizabeth Hospital in Adelaide for scanning the soil cores. The CRC for plant based
management of dryland salinity funded much of the work reported here. Laurence
Jassogne also thanks the Australian government and UWA for an international
postgraduate scholarship, Professor Hans Lambers for support and Kris Broos for
valuable comments on the manuscript.

CHAPTER 4
89
References
Adcock D McNeill AM McDonald GK, and R.D. Armstrong RD (2007) Subsoil
constraints to crop production on neutral and alkaline soils in south-eastern
Australia: a review of current knowledge and management strategies. Aust J Exp
Agr 47:1245-1261
Bastardie F Capowiez Y de Dreuzy JR Cluzeau D (2003) X-ray tomographic and
hydraulic characterization of burrowing by three earthworm species in repacked
soil cores. Appl Soil Ecol 24:3-16
Blair JM Falconer RE Milne AC Young IM Crawford JW (2007) Modeling three-
dimensional microstructure in heterogeneous media. Soil Sci Soc Am J 71:1807-
1812
Capowiez Y Pierret A Moran CJ (2003) Characterisation of the three-dimensional
structure of earthworm burrow systems using image analysis and mathematical
morphology. Biol Fert soils 38:301-310
De Gryze S Jassogne L Six J Bossuyt H Wevers M Merckx R (2006) Pore structure
changes during decomposition of fresh residue: X-ray tomography analyses.
Geoderma 134:82-96
Doussan CL Pages L Pierret A (2003) Soil exploration and resource acquisition by plant
roots: an architectural and modelling point of view. Agronomie 23:419-431.
Feeney DS Crawford JW Daniell T Hallett PD Nunan N Ritz K Rivers M Young IM
(2006) Three-dimensional microorganization of the soil-root-microbe system.
Microb Ecol 52:151-158
Goss MJ (1991) Consequences of the Activity of Roots on Soil in Atkinson D (ed).
Special Publications Series of the British Ecological Society, No. 10. Plant Root
Growth: An Ecological Perspective. Blackwell Scientific Publications Ltd.,
Oxford, England, UK, pp 171-186

CHAPTER 4
90
Gregory PJ Hinsinger P (1999) New approaches to studying chemical and physical
changes in the rhizosphere: an overview. Plant Soil 211:1-9.
Isbell RF (1996) The Australian Soil Classification CSIRO, Melbourne.
Jassogne L McNeill A Chittleborough D (2007) 3D-visualization and analysis of macro-
and meso-porosity of the upper horizons of a sodic, texture-contrast soil. Eur J
Soil Sci 58:589-598
McCallum MH Kirkegaard JA Green TW Creswell HP Davies SL Angus JF Peoples
MB (2004) Improved subsoil macroporosity following perennial pastures. Aust J
Exp Agr 44:299-307
Oh W Lindquist B (1999) Image thresholding by Indicator Kriging. IEEE Trans Pattern
Anal Mach Intell 21:590-602
Passioura (2002) Soil conditions and plant growth. Plant Cell Environ 25:311-318
Peth S Horn R Beckmann F Donath T Fischer J Smucker AJM (2008) Three-
dimensional quantification of intra-aggregate pore-space features using
synchrotron-radiation-based microtomography. Soil Sci Soc Am J 72:897-907.
Pierret A Moran CJ Pankhurst CE (1999) Differentiation of soil properties related to
the spatial association of wheat roots and soil macropores. Plant Soil 211:51-58
Pierret A Moran CJ Doussan C (2005) Conventional detection methodology is limiting
our ability to understand the roles and functions of the fine roots. New Phytol
166:967-980
Pierret A Capiowiez Y Belzunces L Moran CJ (2002) 3D reconstruction and
quantification of macropores using X-ray computed tomography and image
analysis. Geoderma 106:247-271
Rasse DP Smucker AJM (1998) Root recolonization of previous root channels in corn
and alfalfa rotations. Plant Soil 204:203-212
CHAPTER 4
91
Schaffer B Stauber M Muller R Schulin R (2007) Changes in the macro-pore structure
of restored soil caused by compaction beneath heavy agricultural machinery: a
morphometric study. Eur J Soil Sci 58:1062-1073
Smit AL Bengough AG Engels C van Noordwijk M Pellerin S van de Geijn SC (2000)
Root Methods: a handbook. Springer
Soil Survey Staff (1999) Soil taxonomy: a basic system of soil classification for making
and interpreting soil surveys, Washington
Stewart JB Moran CJ Wood JT (1999) Macropore sheath: quantification of plant root
and soil macropore association. Plant Soil 211:59-67
Stirzaker RJ Passioura JB Wilms Y (1996) Soil structure and plant growth: impact of
bulk density and biopores. Plant Soil 185:151-162
Watt M Kirkegaard JA Passioura JB (2006) Rhizosphere biology and crop productivity
- a review. Aust J Soil Res 44:299-317
Young IM Crawford JW Rappoldt C (2001) New methods and models for
characterising structural heterogeneity of soil. Soil Tillage Res 61:33-45
Yunusa IAM, Newton P.J. (2003) Plants for amelioration of subsoil constraints and
hydrological control: the primer-plant concept. Plant Soil 257:261-281
CHAPTER 5
92
Computed tomography of intact soil cores II. Spatial and temporal
visualisations of in situ root systems.
Laurence Jassognea,c*, Rob Davidsonb, Ann McNeillc, Ganga Hettiarachchid,e and David
Chittleboroughc
aSchool of Plant Biology, The University of Western Australia, Crawley, WA, 6009,
Australia
bDavidson’s Agricultural Research and Development, PO Box 280, Mt Pleasant, SA
5235, Australia
cSoil and Land Systems, School of Earth and Environmental Sciences, University of
Adelaide, Waite Campus, PMB 1 Glen Osmond, SA 5064, Australia
dCSIRO Land and Water, Waite Campus, PMB 2 Glen Osmond, SA 5064, Australia
eDepartment of Agronomy, 2107 Throckmorton Plant Sciences Center, Kansas State
University, Manhattan, KS 66506 USA

CHAPTER 5
93
Abstract
Medical X-ray computer tomography (CT) image analysis was used in this study
to non-invasively image macroroots of an annual crop plant, canola (Brassica napus), a
perennial pasture plant, lucerne (Medicago sativa) and a native woody shrub, saltbush
(Atriplex nummularia) in 3 dimensions (3D) in soil. Sequential images of the same
macroroot systems, in intact cores of a sodic duplex soil or texture-contrast soil, were
produced at several times during a 12-week period. The cores were 50 cm long and 15
cm diameter, and although the roots that could be reconstructed were only at the scale of
mm due to image resolution limitations, important differences could be seen in the
performance of the exploratory macroroots in response to the macrostructure of the soil.
An algorithm was developed that could trace roots in intact soil cores to visualise the
progressive macro-root growth of the three different plant species. Canola macroroots
tended to explore the soil more horizontally via proliferation of one taproot and some
relatively large diameter lateral roots in the A horizon, but did not rapidly penetrate to
depth vertically into the E or B horizons. Primary roots of lucerne largely penetrated
vertically through the A and E horizons of the profile, and some of them drilled through
the interface between the E and B horizon. Saltbush produced the largest number of
macroroots through the E horizon, with a larger proportion of these drilling through the
interface and into the B horizon. These unique results show that CT imaging, together
with the tracing algorithm developed for this study, can be used to produce
visualisations of macroroots in large intact soil cores. These visualisations identified
differences between species in the architectural development of macro-root systems,
and clear evidence was provided that saltbush was potentially the best candidate as a
primer plant (i.e. plant that ameliorates the subsoil by drilling through the E/B
boundary) for duplex soils by penetrating deeper and faster.

CHAPTER 5
94
Keywords: macroroot, 3 dimensions, computer tomography, intact soil cores, non-
invasive imaging, saltbush, lucerne, canola
Introduction
The primer plant concept has been suggested as a method to increase biopores in
hostile subsoils in order to increase access to water and nutrients for following crops
(Yunusa and Newton, 2003). Indeed, several studies have shown new roots following
networks or biopores created by decaying roots of previous crops (McCallum et al.
2004; Rasse and Smucker 1998). A good primer plant will have a root system that
proliferates through the profile to depth and has evolved and adapted to any hostile
conditions. Understanding root behaviour in these hostile soils is fundamental for
assessing the potential of different plant species to be successful primers.
Unfortunately, the soil medium is opaque and studying roots in situ is difficult.
Research into root growth generally involves invasive techniques that destroy the
integrity and structure of the soil environment in which the roots grows; for example by
excavating soil to extract root information (ex. Park et al. 2007) or by washing out roots
out of soil samples (ex. Benjamin and Nielsen 2004). Some studies have attempted root
measurements in situ using minirhizotrons (ex. Pritchard et al. 2008). Minirhizotrons
are clear plastic tubes that allow repeated, non-invasive measurements of root growth.
However, insertion of the tube in the soil changes the soil environment, and roots often
grow preferentially along the tube which is an alteration of the root growth that would
occur in undisturbed conditions.
Pierret et al. (2003) developed a non-invasive X-ray technique that imaged root growth
and water uptake in thin-slab systems. The system was easy to use and inexpensive, but
the output was restricted to two dimensions and a relatively narrow block of soil.

CHAPTER 5
95
Understanding root exploration of soil in 3D is important because the soil is a
triphasic 3D matrix comprising irregularly shaped peds or aggregates and a network of
tortuous connected and disconnected pores filled with air, water or organic material
(Jassogne et al 2007, Chapter 2 of this thesis). Current knowledge of root behaviour, in
terms of water and nutrient uptake or how roots respond to impedances like a dense
layer of soil, is based mainly on 2D information which can be used to reconstruct 3D
models of root systems. One such method is suited to studies in the field, especially for
large root networks, and involves photographs and drawings of the arrangement of the
coarse roots after careful excavation of the soil around the root system. This information
can then be digitised and a 3D model can be reconstructed (ex. Di Ioro et al. 2008).
Nevertheless, there is always a risk that the roots will be moved or damaged when
excavating the soil.
Computer tomography has recently been shown to be a valuable technique to
non-invasively visualise roots in soil in 3D. Studies have reconstructed fine roots in 3
dimensions using micro-CT (Gregory et al. 2003; Kaestner et al. 2006; Perret et al.
2007). However, these roots were grown in very simple media like sand or sieved and
repacked soil, or were grown in very small container sizes, and thus do not necessarily
represent the response of roots to undisturbed soil features. Whilst these studies
developed algorithms to trace roots in slightly artificial soils, they were not tested for
application to the heterogeneous properties of undisturbed soil with a pre-existing
porosity. There is therefore a requirement for software to be developed that is able to
visualise roots in the complex medium of an intact soil core. This ability to reconstruct
the roots whilst monitoring intact soil structure information is crucial, because of the
continuous spatial and temporal interplay between soil structure and root development
(Clark et al. 2003).
CHAPTER 5
96
It has been noted that there is a trade-off between the size of sample or region of
interest that is scanned and the resolution achievable when doing CT experiments. To
achieve resolution that enables the study of fine root dynamics (Hamza et al., 2001),
microporosity or soil-microbial interactions (Young et al., 2001) in 3D require small
sample sizes and the use of micro-CT technology. Pierret et al. (2005) have recently
reviewed various limitations and possibilities for studying and imaging fine roots in
situ. Medical CT technology allows the analysis of larger soil volumes (in the order of
50 cm long and 15 to 20 cm diameter). However, the resolution is coarser and only
items in the order of mm scale can be visualised (Pierret et al. 2002). This means that
mainly primary and only some secondary roots can be visualised. However, these
macroroots are largely responsible for the exploration of the soil volume (McCully
1999) and necessarily presage the development of fine roots. To understand how
different root systems cope with nutrient scarcity or dense soil layers, the 3D
organisation of these architectural roots is as important as the chemical and physical
changes caused by fine roots at micro scale. It is elongation and penetration of these
coarser roots that enable the fine roots to proliferate in a specific environment. Clearly,
3D root studies are important at both mm and µm scale and with emerging technologies
the opportunity exists to incorporate results found at both scales (Jassogne et al. 2007).
In this study, root growth of 3 different plant species (canola, lucerne and
saltbush) in intact cores of duplex soils was compared using medical CT scanning. A
new tracing algorithm, based on multivariate analysis and allowing visualisation of root
networks in intact soil cores, was tested. Macro-root growth of the 3 plant species was
visualised at intervals of 3 weeks over a period of 12 weeks. It was hypothesised that a
native plant such as saltbush would drill through the E – B interface and explore
relatively deeper in the subsoil compared with an annual like canola or an introduced
perennial like lucerne.
CHAPTER 5
97
Material and methods
Soil core collection and plant growth conditions
Intact soil cores (50 cm long, 15 cm diameter) of a Red Sodosol (Isbell 1996) or
a Typic Natrixeralf (Soil Survey Staff, 1999) were taken as described in Chapter 4 of
this thesis. The bulk density of the soil ranged from 1.6 g cm-3 in the E horizon to 1.9 g
cm-3 at the interface, and 1.8 g cm-3 in the B horizon. The highest electrical conductivity
(EC) 1:5 value was 0.268 dS m-1 and the exchangeable sodium percentage (ESP) at the
interface was 24.2 % revealing strong sodic properties. Further, as described in Chapter
4, the PVC encased cores were transported to the lab, removed from the PVC, coated
with liquid latex to provide a barrier for root growth at the edges of the soil, and
replaced in the PVC tubes. Canola, lucerne and saltbush seeds were germinated and one
seedling was planted in 9 cores after 3 days for canola and lucerne and 8 days for
saltbush (3 replicates per plant, 1 plant in each core). The plants were watered during
the 12 weeks with a total amount of water (262 mm) equivalent to that received as
rainfall from April to September in an average growing season in South Australia.
Scanning, image reconstruction and root visualisation
Cores were scanned at the Queen Elizabeth Hospital in Adelaide with a medical
CT instrument (Toshiba Aquilon, Tokyo, Japan) as described in Chapter 4.
New software (RootViz) was designed that enabled roots to be traced from the grey
scale images reconstructed from the CT scans. The RootViz software was based on
multivariate discrimination applied to the grey values of the images. In the stack of
cross sections from the CT scans, more than 100 pixels belonging to each of the
possible phases were manually selected using a freely available program ImageJ. The

CHAPTER 5
98
phases were soil matrix, fresh root or ‘porosity’, the latter including pores filled with
air, water or organic material that was not fresh root or soil matrix. These pixels
generally have a higher attenuation (i.e. are darker grey) than the pixels belonging to the
fresh roots or the soil matrix. The Rootviz software then calculated the similarity of the
pixel of interest to that of root material, soil matrix or other. These values were then
compared within a software routine to allocate each pixel to a living root or other
category (Figure 1). The Rootviz software also includes a ‘parameter’ file consisting of
several parameters that assist in determining whether or not a pixel should be assigned
as a living root or not. One of these assisting parameters is called circle radius and this
contributes to the classification of each pixel in the centre of a circle based on
information from all the pixels belonging to the circle. Smaller values for this parameter
allows tracing of finer roots but generates more errors (i.e wrong classifications) than
larger values. Another assisting parameter is a weighting value applied to the pixel
values around each assigned root pixel in increasing circles to establish confidence in
what pixels are designated as root. A value of 1 for this assisting parameter indicates no
weight. The value for each assisting parameter differs for images from different
experiments. The assisting parameters are initialized based on characterizing the
multivariate parameter values for the three material phases from ‘known’ pixels. The
parameters are then optimized by systematic adjustment to minimise the differences
between output from the program and hand segmentation of images at three separate
locations in the image stack. The traced root pixels are then stored in an .am extension
file that can be read in Amira (http://www.amiravis.com/) and 3D visualisations from
the traced roots can be reconstructed.

CHAPTER 5
99
Figure 1: A plot of the grey values for porosity, root and soil in the grey scale images.
The multivariate analysis and probability cloud of the algorithm are based on these
values.
CHAPTER 5
100
Results
Discrimination of phases in cores – root, pore and soil matrix
A plot of standard deviation against each mean grey value for different phases of
interest in the axial slices of an intact soil core with a growing root system (Figure 1)
illustrates the difficulties faced when using CT images to describe root growth in situ in
an intact soil core. When the data points belonging to the different phases do not
overlap then discrimination between the different phases is relatively easy. This is often
the case, for example, for soil and porosity (Figure 1). However, if the data points
overlap, the discrimination becomes harder as shown for roots and soil (Figure 1).
Observations suggest that the pixels which create this overlap are the pixels selected for
small roots that tend to have a grey value similar to soil matrix pixels.
3D visualisation of root systems
The visible roots (>0.8 mm diameter) of the first lucerne replicate appeared to
grow vertically down the profile quite rapidly in 12 weeks (Figure 2). After 3 weeks of
growth, visible roots of this replicate could only be traced in the first cm of the A
horizon (Figure 2), but after a further 3 weeks the roots were visible in the middle of the
E horizon and a third root could be seen after 6 weeks which grew much faster (4 cm in
3 weeks) than the first two roots, as shown after 9 weeks by the visualisation (Figure 2).
One root penetrated the E horizon but changed orientation and grew laterally to the edge
of the core before reaching the interface. When the 3D reconstruction of the roots was
superimposed on the grey scale images of the intact soil core it could be seen that one
root was exploiting a soil crack through the E-horizon.
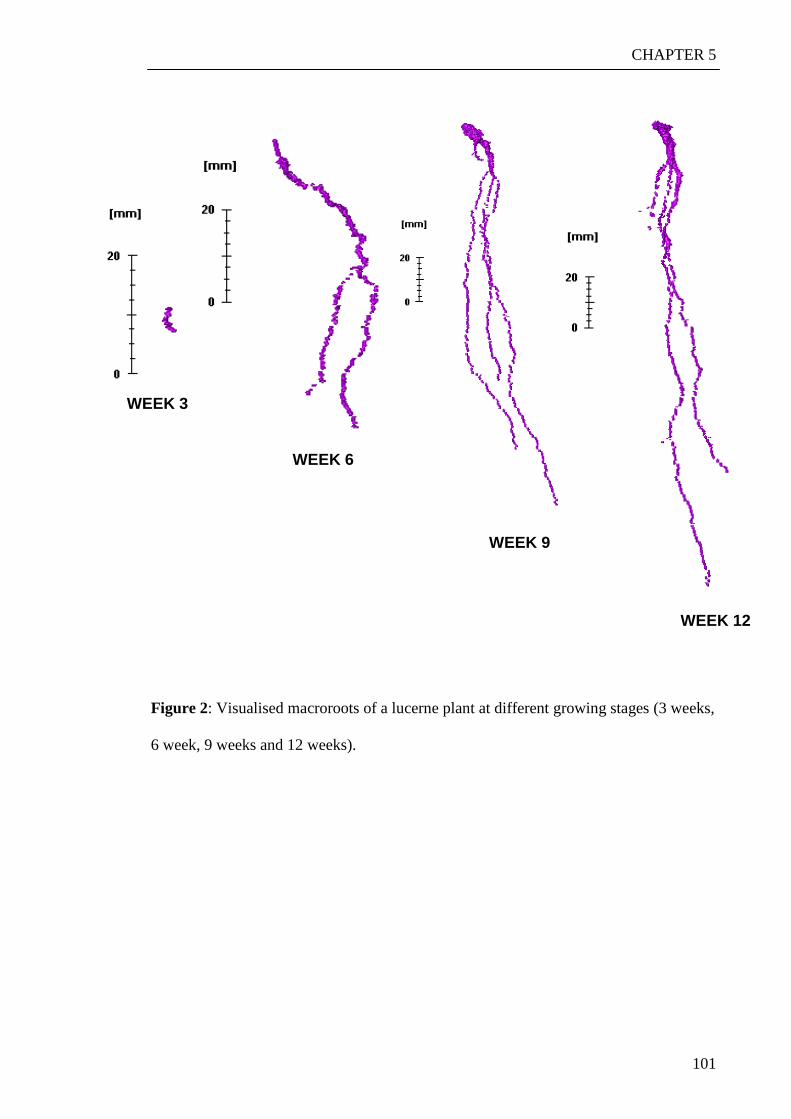
CHAPTER 5
101
Figure 2: Visualised macroroots of a lucerne plant at different growing stages (3 weeks,
6 week, 9 weeks and 12 weeks).
WEEK 3
WEEK 6
WEEK 9
WEEK 12
CHAPTER 5
102
However, the root did not follow the crack all the way to the edge of the core but
changed direction and continued growth vertically downwards in the soil profile. In a
second lucerne replicate (Figure 3B) the root system branched in the A horizon and 2 of
the roots grew laterally to the edge of the core while one root grew vertically through
the E-horizon. It was possible to trace this latter root until just above the interface with
the B horizon. The taproot of the third lucerne replicate (Figure 3C) grew diagonally
through the E horizon, penetrated through the interface and into the B horizon. Two
secondary or lateral roots of this third replicate were observed to grow through the E
horizon but found the edge of the core just above the interface. There were many cracks
present in the E horizon but none of the visualised roots in any of the lucerne replicates
appeared to follow them.
Sequential visualisations for growing canola plant roots showed that the skeletal
architecture of their root system is established at early growth. Canola subsequently
thickened roots and grew vertically down the profile (Figure 4 and 5). Canola grew
more than one taproot in the A horizon (Figure 4 and 5). Generally, the 3D
visualisations show that the canola tap roots were thicker than the lucerne roots and
grew mainly in the A horizon although some of the roots did penetrate through the
profile into the B horizon by following cracks. The root system of the first canola
replicate grew laterally to the edge of the soil core and then vertically followed the
smooth plane of the PVC to the bottom of the core. It appeared that the taproot grew
diagonally, divided in two and both of the roots gravitated to the edge of the soil core.
Two roots of the second canola replicate also went to the edge of the soil core and grew
vertically to the bottom of the core following the PVC edge.

CHAPTER 5
103
Figure 3: Macroroot systems of three different lucerne plants after 12 weeks. The scales
at the bottom of the core represent 14 cm. A/E and E/B show the transitions between
horizons.
A B C
A/E
E/B
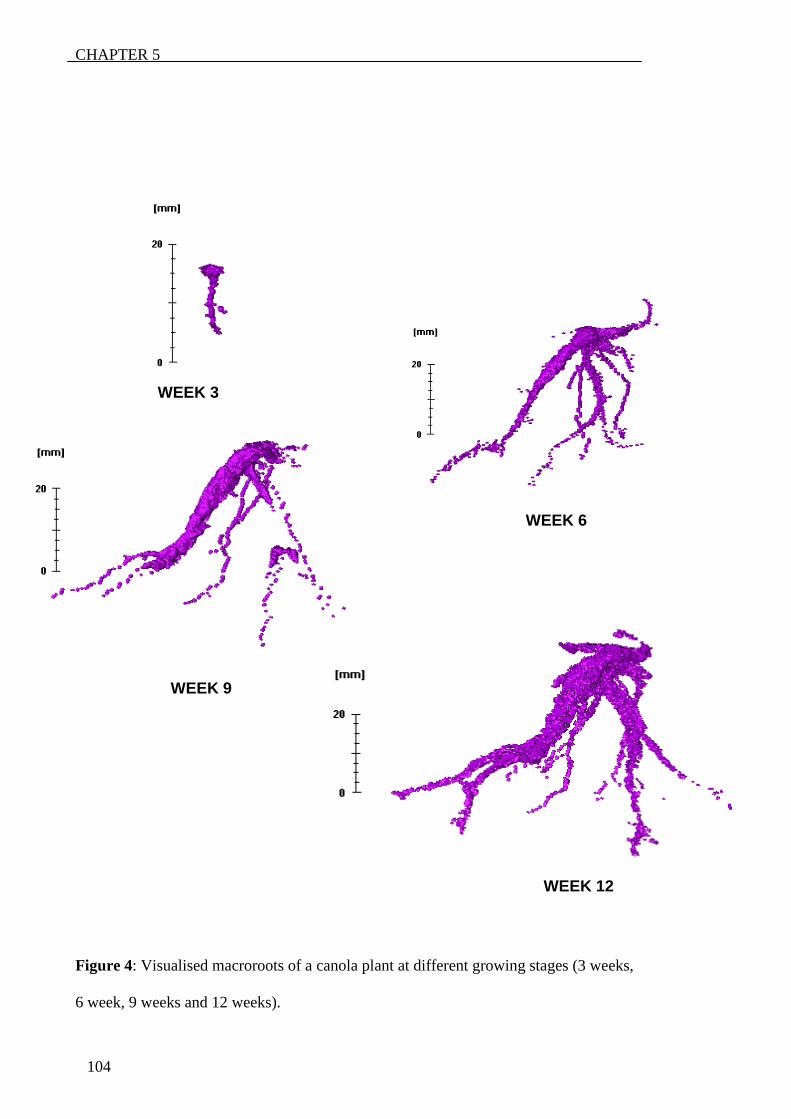
CHAPTER 5
104
Figure 4: Visualised macroroots of a canola plant at different growing stages (3 weeks,
6 week, 9 weeks and 12 weeks).
WEEK 3
WEEK 6
WEEK 9
WEEK 12
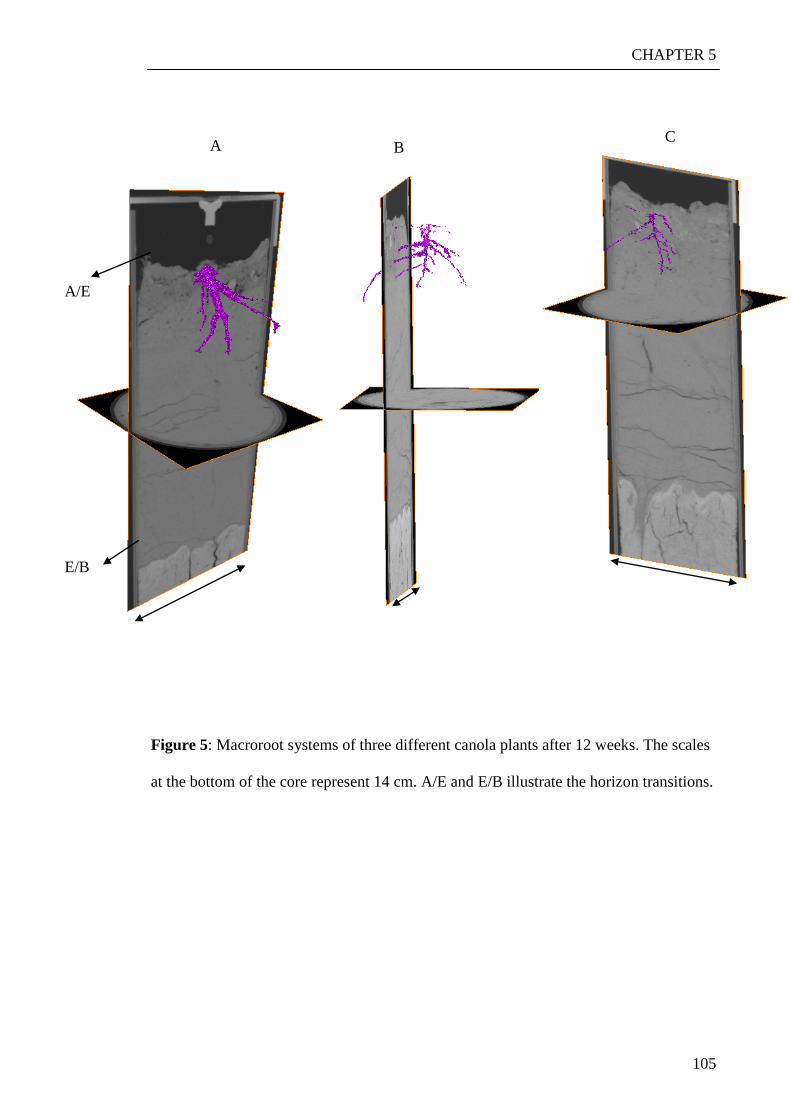
CHAPTER 5
105
Figure 5: Macroroot systems of three different canola plants after 12 weeks. The scales
at the bottom of the core represent 14 cm. A/E and E/B illustrate the horizon transitions.
A B C
A/E
E/B
CHAPTER 5
106
The grey images showed that one root reached the interface but ‘bent’ at this point of
contact suggesting a resistance to growth was present. In the third canola replicate, one
root found the edge of the soil core and grew down the edge to the bottom of the core.
No visible root grew all the way to the interface. One root could be traced till the middle
of the E horizon (Figure 5).
The root visualisations of the second saltbush replicate showed more than 1 root
growing vertically through the E horizon, through the interface and into the B horizon
(Figure 6). Some of the secondary and even tertiary lateral roots were observed at the
edge of the core. The second saltbush replicate also showed a root that penetrated
through the A and E horizon but deflected horizontally when it met the clay of the
interface and then grew vertically straight down again when it encountered a crack filled
with sand. The root could then be traced until it hit the clay of the interface again. It
could not be traced drilling through the interface. The third saltbush replicate was
observed to have a taproot that was deflected as it grew in the A horizon but then grew
vertically through the E-horizon. It could not be traced drilling through the interface.
However, a secondary root of the same plant grew horizontally in the direction of the
edge of the core in the A horizon but suddenly changed direction and grew vertically
through the E horizon and through the interface into the B horizon.
Discussion
The unique methodology used in this study visually demonstrated, in
undisturbed soil, that species differ markedly in the development of macroroot systems.
Clear evidence was provided that saltbush was potentially the best candidate as a primer
plant for duplex soils by penetrating deeper and faster.

CHAPTER 5
107
Figure 6: Macroroot systems of three different saltbush plants after 12 weeks. The
scales at the bottom of the core represent 14 cm. A/E and E/B illustrate he horizon
transitions.
A B C
A/E
E/B
CHAPTER 5
108
Canola had the largest diameter macroroots but mainly explored the A horizon.
Canola has been observed to penetrate in a sodic B horizon (McNeill et al. 2004) but the
interface in this present experiment might have been more hostile explaining why
canola would not penetrate the B horizon. Lucerne showed it had some potential in
penetrating the B horizon; this was also suggested in a field experiment (Mc Callum et
al. 2004). The three species had different root system characteristics. The roots of
canola could not be traced drilling through the interface. In contrast, one replicate of
lucerne grew through the interface. The visualisation and grey scale images of saltbush
showed that saltbush grew more roots down the profile and more of them could grow
through the interface. This suggested that lucerne, and more so saltbush could be used
to alter the physical characteristics of the interface and the B horizon of a sodic duplex
soil. This is not surprising as saltbush is a native plant species found in natural
ecosystems on these soils. It has evolved in this environment and had more chances to
develop ways to cope with the hostile conditions that these types of soils create (Yunusa
and Newton, 2003). The soil in this study was not saline at the depth sampled but had
sodic properties. As a consequence, the interface and B horizon had a degraded
structure and low permeability. During watering events, the water would have ponded
on the interface. Saltbush is not only salt tolerant but also waterlogging tolerant, more
so than lucerne. This could further explain why more roots of saltbush grew deeper in
the profile. In this study, it seemed that saltbush would be the most appropriate plant to
create biopores in the sodic B horizon in very dry conditions (Pannell and Ewing 2006).
However the root system in a soil is not only affected by soil moisture, soil temperature,
and soil structure but also by specific aspects of the plant physiology. Thus more studies
are required to identify a range of different plant species in duplex soils, at different soil
water contents, to identify the best primer plant on these types of soils.

CHAPTER 5
109
Using the techniques developed in this study it is possible to examine the
interaction between roots in intimate contact with soil structures by superimposing the
visualised roots on the 3D image reconstruction of the intact soil core. The work shows
roots growing in cracks and old root channels. Although high soil strength inhibits root
growth (Bengough et al. 2006), it has also been observed that soil should be dense
enough to allow good contact between soil particles and roots (Passioura, 2002). Roots
growing in large macropores and cracks as in the case in the soil of this study, do not
have a good soil root contact. It was shown in a study done by Stirzaker et al. (1996)
that plants grow better when there was a network available of narrow biopores. The
effect of plants growing poorly when their roots grow in large pores because of poor
soil contact can be overridden when the soil is allowed to dry because then roots can
access water stored in the subsoil (Passioura 2002; Cornish 1993). When a root grows
through dense soil, it can also find pathways that have a smaller diameter than the root
tip. The root tip then pushes through that pore and enlarges the diameter of the pre-
existing pore (Clark et al. 2003). This would only be possible if the soil at the interface
contained some moisture giving it some plasticity. The exudation of mucilage could
also alter the friction forces enabling the tip op the root to push through soil.
Field experiments testing the primer plant concept showed that wheat growing
after birdsfood trefoil (Lotus corniculatus L.) and sulla (Hedysarum coronarium L.) had
a better yield than wheat growing after lucerne. It was suggested that the two first plants
created a network of small biopores while lucerne had one taproot and fewer branching
creating less suitable size biopores for exploitation by the subsequent wheat crop
(Nutall et al. 2008). The latter study also pointed out that the primer plant concept might
be more beneficial in regions with higher rainfall as the soil water deficit remaining in
the short-term after a primer phase may limit the potential benefit of additional
macroporosity within the subsoil in semi-arid regions. Moreover, using plants that take

CHAPTER 5
110
up saline water in the soil can lead to the increase in salt concentrations in the root zone,
which would have long term consequences on root growth (Barret-Lennard 2002).
In this study, only roots larger than 1mm could be visualised. This means that
we could only resolve less than 10 % of the root system that consists mostly of
untraceable fine roots. Nevertheless, tracing the macroroots of a root system enables an
increased understanding of root exploration of soil which can vary dramatically for one
plant species depending on the type of soil/hostilities in soil but also between plant
species for the same hostile soil characteristic (Bingham and Bengough, 2003). Using
an algorithm like the one described here, that is based on the distribution of grey values
of the roots (small and large) and the distribution of other pore (porosity) and soil grey
values, together with connectivity assumptions, allows tracing of whole root systems in
the heterogeneous environment of the soil matrix with its pre-existing porosity. The
algorithm described in this study is easy to use on fresh root networks of one or two
plants growing in soil but cannot yet be used on tracing pores. At the moment, the best
method to visualise porosity in soil is to use a segmentation method, local and adaptive,
on the grey scale images followed by a filter that removes all the irrelevant, small,
unconnected volumes (Chapter 3, Jassogne et al. submitted to Geoderma; Perret et al.
2007). Pierret et al. (2002) developed an adaptive tracing algorithm for macroporosity
that also considered connectivity parameters. However, this algorithm was
computationally intensive and the grey images had to be simplified which caused
substantial loss of information in the images.
The diameter of a growing root in soil is highly variable, therefore the average
grey scale of root material in the images changes from lower absorption values for large
roots to higher values for smaller roots. If roots were separated from soil matrix in grey
images using a threshold technique based only on the grey scale distribution of the
image (global or local thresholding), some of the smaller roots would not be segmented

CHAPTER 5
111
in the image. If a threshold value is chosen that segments the smaller roots, then errors
are made on the bigger roots (Chapter 3, Jassogne et al. submitted to Geoderma).
The size of the roots that can be traced in an image is dependent on the
resolution of the image. In theory, traceable roots would be larger than three times the
pixel size; in this case, roots larger than 0.9 mm. However, tracing of a root in soil
matrix in a CT image is dependent on the quality of the image; it is the amount of noise
and the contrast detectability. Noise in an image is inversely related to the amount of
photons that hit the detector. This can be regulated by changing the current and the
energy of the photons. Increasing these parameters will increase the number of photons
hitting the detector. Contrast between objects of low density in soil will be increased
when lower energies are used. However, roots become untraceable if the images have
too much noise. Detectability also becomes smaller for smaller roots. It is also
important to keep the same CT parameters for scans made in a single experiment, as
well as the same imaging software parameters because the grey values in the cross
sections of the CT images are dependent on both sets of parameters.
In this study it was relatively simple to discriminate the pixels for porosity from pixels
for roots in the A horizon, whereas porosity in the E horizon was harder to separate.
However, this does not create a problem for tracing the macroroot because the software
uses a file with the initial or starting points of the living roots which were largely in the
A horizon in this study, so that dead roots were not traced. However, intact soil is a
complex medium and constant checking of the output from the software with the
original CT images is important.
This study illustrated the enormous potential medical CT provides for research
into soil/root interactions. Most methods for analysing root-soil interplay are
complicated and destructive. The soil environment in which roots grow needs to be
destroyed in order to study root-soil relationships. It has been pointed out in the

CHAPTER 5
112
literature that there is a need to understand root behaviour in situ as they often exploit
pre-existing soil heterogeneities. Moreover, the architecture of roots will define the
distribution of their respective rhizospheres which has been shown to be quite different
in homogenised soil compared to undisturbed soil (Hinsinger et al. 2005). Soil
exploration and nutrient uptake by roots is also very important from the point of view of
modelling plant-soil interactions (Doussan et al. 2003). So there is a need to understand
root dynamics in relation to soil at the appropriate spatial and temporal resolution.
Although medical CT only allows visualisation of architectural roots, these are most
important in initially defining to what extent the soil volume will be occupied (McCully
1999). Soil exploration of roots in the B horizon of a sodic duplex soil is dependent on
the macrostructure of the subsoil and medical CT is the only technique that enables the
study of roots in the three dimensional organisation of the heterogeneous soil
environment. Computer tomography technology is constantly improving and machines
for larger samples that can be scanned at higher resolutions are now available, although
of course very costly to buy and maintain. Although the level of detail of the images
will increase, the imaging methods will stay the same. Increasing computational power
will allow these images to be processed more easily and rapidly in the future.
Conclusions
This study highlighted the potential of medical CT for non-invasively
visualising exploratory macroroots in intact cores of a sodic duplex soil. An algorithm
was developed, tested and used to trace macroroots of canola, lucerne and saltbush in
the heterogeneous matrix of intact soil cores. The non-invasive nature of the technique
enabled sequential imaging of macroroots over a period of 12 weeks so that visual
information on the architectural development of these roots in intimate contact with
undisturbed soil was obtained. These observations confirmed that saltbush was a good

CHAPTER 5
113
primer plant with many macroroots penetrating hostile subsoils. Lucerne macroroots
showed some potential for penetrating subsoil whereas canola macroroots grew much
more laterally and were not able to penetrate deeply.
Acknowledgements
The authors thank the CRC for Plant Based Management of Dryland Salinity for
funding this work and Geoff West and the medical staff at the Queen Elizabeth Hospital
for scanning the intact soil cores. The senior author thanks the Australian Government
and the University of Western Australia for an International Postgraduate Research
Scholarship and Prof. Hans Lambers for his support and encouragement.

CHAPTER 5
114
References
Barret-Lennard EG (2002) Restoration of saline land through revegetation. Agric Water
Manag 53: 213-226
Bengough AG Bransby MF Hans J McKenna SJ Roberts TJ Valentine TA (2006) Root
responses to soil physical conditions; growth dynamics from field to cell. J Exp
Bot 57: 437-447.
Benjamin JG Nielsen DC (2004) A method to separate plant roots from soil and analyse
root surface area. Plant Soil 267: 225-234
Bingham IJ Bengough AG (2003) Morphological plasticity of wheat and barley roots in
response to spatial variation in soil strength. Plant Soil 250:273-282
Clark LJ Whalley WR Barraclough BP (2003) How do roots penetrate strong soil? Plant
Soil 255:93-104
Cornish PS (1993) Soil macrostructure and root growth of establishing seedlings. Plant
Soil 151: 119-126
Di Ioro A Lasserre B Petrozzi L Scippa GS Chiatante D (2008) Adaptive longitudinal
growth of first-order lateral roots of a woody species (Spartium junceum) to
slope and different soil conditions—upward growth of surface roots. Environ
Exp Bot 63:207-215
Doussan CL Pages L Pierret A (2003) Soil exploration and resource acquisition by plant
roots: an architectural and modelling point of view. Agronomie 23:419-431
Gregory PJ Hutchison DJ Read DB Jenneson PM Gilboy WB Morton EJ (2003) Non-
invasive imaging of roots with high resolution X-ray micro-tomography. Plant
Soil 255: 351-359
Hamza MA Anderson MH Aylmore LAG (2001) Studies of soil water drawdowns by
single radish roots at decreasing soil water content using computer-assisted
tomography. Aust J Plant Res 39: 1387-1396

CHAPTER 5
115
Hinsinger P Gobran GR Gregory PJ Wenzel WW (2005) Rhizosphere geometry and
heterogeneity arising from root mediated physical and chemical processes. New
Phytol 168: 293-303
Isbell RF (1996) The Australian Soil Classification CSIRO, Melbourne.
Jassogne L McNeill AM Chittleborough D (2007) 3D-visualization and analysis of
macro- and meso-porosity of the upper horizons of a sodic, texture-contrast soil.
Eur J Soil Sci 58: 589-598
Kaestner A Schneebeli M Graf F (2006) Visualising three-dimensional networks using
computed tomography. Geoderma 136: 459-469
McCallum MH Kirkegaard JA Green TW Creswell HP Davies SL Angus JF Peoples
MB (2004) Improved subsoil macroporosity following perennial pastures. Aust J
Exp Agr 44:299-307
McCully M E (1999) Roots in soil: unearthing the complexities of roots and their
rhizospheres. Annu Rev Plant Physiol Plant Mol Biol 50: 695-718
McNeill AM Kolesik P Wauchope K Coventry DC (2004) Root response to localised
nitrogen supply: destructive sampling and non-destructive 3D imaging. Paper
presented at The International Rhizosphere Congress, Munich
Nuttall JG Davies SL Armstrong RA Peoples MB (2008) Testing the primer-plant
concept: wheat yields can be increased on alkaline sodic soils when an effective
primer phase is used. Aust J Agr Res 59: 331-338
Pannell DJ Ewing MA (2006) Managing secondary dryland salinity: Options and
challenges. Agric Water Manage 80: 41-56
Park BB Yanai R Vadeboncoeur MA Hamburg SP (2007) Estimating root biomass in
rocky soils using pits, cores, and allometric equations. Soil Sci Soc Am J
71:206-213
Passioura (2002) Soil conditions and plant growth. Plant Cell Environ 25:311-318

CHAPTER 5
116
Perret JS Al-Belushi ME Deadman M (2007) Non-destructive visualization and
quantification of roots using computed tomography. Soil Biol Biochem 39: 391-
399
Pierret A Capiowiez Y Belzunces L Moran CJ (2002) 3D reconstruction and
quantification of macropores using X-ray computed tomography and image
analysis. Geoderma 106:247-271
Pierret A Kirby M Moran C (2003) Simultaneous X-ray imaging of plant root growth
and water uptake in thin slab systems. Plant Soil 255: 361-373
Pierret A Moran CJ Doussan C (2005) Conventional detection methodology is limiting
our ability to understand the roles and functions of the fine roots. New Phytol
166:967-980
Pritchard SG Strand AE McCormack ML Davis MA Finzi AC Jackson RB Matamala R
Rogersk HH Oren R (2008) Fine root dynamics in a loblolly pine forest are
influenced by free-air-CO2-enrichment: a six year minirhizotron study. Glob
Change Biol 14: 588-602
Rasse DP Smucker AJM (1998) Root recolonization of previous root channels in corn
and alfalfa rotations. Plant Soil 204:203-212
Soil Survey Staff (1999) Soil taxonomy: a basic system of soil classification for making
and interpreting soil surveys, Washington
Stirzaker RJ Passioura JB Wilms Y (1996) Soil structure and plant growth: impact of
bulk density and biopores. Plant Soil 185:151-162
Young IM Crawford JW Rappoldt C (2001) New methods and models for
characterising structural heterogeneity of soil. Soil Tillage Res 61:33-45
Yunusa IAM, Newton P.J. (2003) Plants for amelioration of subsoil constraints and
hydrological control: the primer-plant concept. Plant Soil 257:261-281
117
Characterising the chemistry of pores
Chapter six entitled
Distribution and speciation of nutrient elements around micropores
Accepted with revisions as a journal article in
Soil Science Society of America Journal
Chapter seven entitled
Characterising the chemistry of micropores in a sodic soil with strong texture-
contrast using synchrotron X-ray techniques and LA-ICP-MS
To be submitted to Soil Science Society of America Journal

CHAPTER 6
118
Distribution and speciation of nutrient elements around micropores
Laurence Jassogne1,3, Ganga Hettiarachchi2, 3, David Chittleborough3 and Ann McNeill3
1School of Plant Biology, University of Western Australia, Crawley, Western Australia,
6907 Australia
2Department of Agronomy, Kansas State University, Manhattan, KS 66506, USA
3Soil and Land Systems, School of Earth and Environmental Sciences, University of
Adelaide, Waite Campus, PMB 1 Glen Osmond, South Australia, 5064 Australia
*corresponding author; e-mail: [email protected]
Phone: +61 8 8303 8114
Fax: +61 8 8303 6717
Acknowledgments:
We thank Dr Kris Broos for useful comments on the manuscript, the Australian
government, the University of Western Australia and Prof. Hans Lambers for the
International Postgraduate Research Scholarship of Laurence Jassogne. PNC/XOR
facilities at the Advanced Photon Source, and research at these facilities, are supported
by the US Department of Energy – Basic Energy Sciences, a major facilities access
grant from NSERC, the University of Washington, Simon Fraser University and the
Advanced Photon Source. Use of the Advanced Photon Source is also supported by the
U. S. Department of Energy, Office of Science, Office of Basic Energy Sciences, under
Contract DE-AC02-06CH11357. This work was supported by the Australian
Synchrotron Research Program (ASRP) which is funded by the Commonwealth of
Australia under Major National Research Facilities Program. The CRC for plant based
management of dryland salinity also partly funded this research. The authors would also
like to thank Peter Self for help with SEM analysis.

CHAPTER 6
119
Distribution and speciation of nutrient elements around micropores
ABSTRACT
In Australia a class of soils known as sodic duplex soils (natrixeralfs) covers
approximately 20% of the continent. Their defining characteristic is a sharp texture
contrast between the A (or E) and B horizon. The upper B horizon at the point of
contact with the E horizon is often highly sodic and of such a high strength that root
growth and proliferation, water conductivity, aeration, water storage and water uptake
are restricted. Roots growing in these soils rely on channels created by previous roots or
cracks arising from shrink–swell forces associated with seasonal wetting and drying.
Although the characteristics of rhizospheres compared to the soil matrix are well
documented there is a paucity of knowledge about how long these changes persist after
roots decay. This knowledge is fundamental to our understanding of root growth in
duplex soils in which plants rely on pore networks formed by previous plants to
proliferate into the subsoil. In this study we investigated the heterogeneous chemistry of
micropores in situ using synchrotron-based µ-X-ray fluorescence spectroscopy (XRF),
µ-X-ray absorption near edge structure spectroscopy (XANES) and extended µ-X-ray
absorption fine structure spectroscopy (EXAFS). The distribution maps of Ca, Mn, Fe,
Cu and Zn at micrometer resolution were collected using µ-XRF. Subsequently, specific
locations with higher concentrations (hot spots) of Mn, Fe, Cu or Zn were selected and
XANES was applied to study the speciation of these elements around the micropore
compared to the soil matrix. The µ-XRF maps showed that Mn was depleted around one
studied micropore, while accumulated around another micropore. Copper and Zn
accumulated around the micropores, whereas Ca was predominantly inside the
micropores. There was no difference between matrix and micropore surface with respect
to the distribution of Fe. Mn was present in reduced form (Mn II) and Fe in its oxidized

CHAPTER 6
120
form (Fe III). Mn and Cu were present in the form of phosphates, Fe as Fe oxides, and
Zn as Zn phosphates and adsorbed Zn.
List of abbreviations:
XRF: x-ray fluorescence; XANES: x-ray absorption near edge structure; EXAFS:
extended x-ray absorption fine structure; SEM: scanning electron microscope; EDXA:
Energy Dispersive X-ray analyzer; APS: Advanced Photon Source; LCF: Linear
combination fitting

CHAPTER 6
121
INTRODUCTION
Soils with strong and abrupt textural differences between A (or E) and B horizons are
widespread in Australia. Known as duplex soils, approximately 20% of the continent is
covered by such soils (McKenzie et al., 2004). The contrast in clay content between A
and B horizons can be as high as 1:10 and can occur over a distance < 2cm. Often these
soils have high ionic strength and high pH, impoverished acid clays or bleached infertile
subsoil horizons of high bulk densities. The texture contrast in a duplex soil can be the
result of clays breaking down at the interface of the A and B horizons with the infill at
the top of the B horizon being clays either translocated from the A horizon or
synthesized in situ. As a result, pores of the subsoil are often blocked with clay
(Verboom and Pate, 2006). Duplex soils have significant restrictions to root
proliferation and water uptake in addition to low water conductivity, aeration and water
storage (Clark et al., 2003). Roots growing in these soils often follow pathways of least
resistance, such as channels previously created by roots or soil organisms, cracks or
other structural pores (Stirzaker et al., 1996). Furthermore, in these pathways of least
resistance, organic matter originating from old roots decomposes and creates nutrient
‘hotspots’ for subsequent roots to colonize the channel (Robinson, 1996).
Physical changes in soil (e.g. compaction) commence immediately when roots penetrate
whereas chemical differences between the rhizosphere and the soil matrix are created
synchronously as roots take up particular ions and release exudates. Elements such as
Ca, present as salts in high concentrations in the soil solution compared to the demand
of the plant, tend to accumulate in the rhizosphere (Hinsinger, 1998). Furthermore, the
adsorption of Ca2+, Mg2+ and Na+ from the soil solution in the rhizosphere can release K
otherwise not available for the plant (Mengel and Schubert, 1985). Springob and
Richter (1998) have also shown that non-exchangeable K release hardly occurs at bulk

CHAPTER 6
122
soil K-concentrations but at low K concentrations. Plants also weather silicate minerals
by exuding acids that release K, Ca, Mg and Si into the soil solution (Hinsinger and
Jaillard, 1993). The pH in the rhizosphere can be 1 to 2 units lower than the bulk soil, as
a consequence of the secretion of protons and organic molecules (exudates) by roots
into the rhizosphere to immobilize nutrients. Acidification of the rhizosphere can also
induce toxicity by mobilizing Al or Zn (Calba et al., 2004; Loosemore et al., 2004).
Chemical changes in the rhizosphere are well documented and are the subject of intense
research effort. Few studies have been conducted to understand how long these changes
persist in soil after roots decay. This knowledge is fundamental in those soils where
plants rely on former root growth and soil structure to proliferate.
The macropore sheath has been defined as the environment around a macropore (such
as an old root channel). In some Australian soils, Stewart et al., 1999, showed that roots
tended to grow preferentially in this soil domain. Studies on duplex soils have shown
that this macropore sheath has higher concentrations of organic C, total N, bicarbonate
extractable P, Ca, Cu, Fe and Mn. The macropore sheath also supports higher
populations of bacteria, fungi, actinomycetes (i.e. Pseudomonas spp., Bacillus spp.,
cellulolytic bacteria, cellulolytic fungi, nitrifying bacteria and the root pathogen
Pythium than the bulk soil (Pankhurst et al., 2002). In that study, the chemical
environment of macropores created by roots was studied by scraping a 3 mm annulus
around a biopore and comparing it with the bulk soil, operationally defined as > 10 mm
from the macropore. These techniques only give a broad idea about how the macropore
sheath differs from the bulk soil and do not provide spatially resolved information.
Moreover, useful information can be masked as a consequence of the “dilution effect”
arising from sample collection. The highly heterogeneous nature of soils, and the
surfaces of pores created by roots, requires investigative techniques capable of high
resolution and high surface sensitivity.
CHAPTER 6
123
Combined use of synchrotron-based micro-X-ray fluorescence spectroscopy (µ-XRF),
micro-X-ray absorption near edge spectroscopy (µ-XANES) and extended µ-X-ray
absorption fine structure spectroscopy (µ-EXAFS) provides a means to study elemental
distribution and speciation of macro- and micro-elements in the heterogeneous
environment of soil pores in a spatially resolved manner. Similar analyses have been
used to investigate the speciation of Zn in clay soils (Isaure et al., 2005; Manceau et al.,
2004) and the geochemistry of As, Se and Fe in soil developed in pyritic shale materials
(Strawn et al., 2002). Synchrotron radiation affords a superior resolution to
conventional XRF, XANES and EXAFS spectroscopy, permitting differentiation of
similar chemical species with greater certainty and superior detection limits/sensitivity.
Although other studies have shown that the environment of macropores is different
from the rest of the soil, µ-XRF, µ-XANES and µ-EXAFS should increase the detection
of elements of interest thereby facilitating an improved understanding of the distribution
and speciation of these elements around pores. Synchrotron sources currently available
allow the speciation of elements in heterogeneous systems such as soil with high spatial
resolution (Hettiarachchi et al., 2008). The X-ray beam can be focused to a size of a few
µm in diameter which is equivalent to the size of particles that are very chemically
reactive. This spatial resolution should facilitate a more accurate representation of the
soil’s inherent heterogeneity than previously achieved. It should now be possible to
study the chemistry of micropore surfaces instead of only macropores.
For the current study, we have combined optical petrology of soil thin sections with µ-
XRF µ-XANES and µ-EXAFS to investigate the distribution and the chemistry of some
selected macro and micro-nutrient elements at micropore surfaces in situ. Our objective
was to map the distribution of Ca, Mn, Fe, Cu and Zn at micrometer scale by µ-XRF. In

CHAPTER 6
124
specific locations with relatively high concentrations (hot spots) of Mn, Fe, Cu or Zn,
speciation was studied by µ-XANES and µ-EXAFS spectroscopy in the immediate
vicinity of the micropore and compared to the forms in the soil matrix.
MATERIALS AND METHODS
Intact soil cores (50 cm long, 15 cm diameter) were taken from an agricultural site near
Stansbury in South Australia (33° 54’S, 137° 47’E). The soil was a Red Sodosol (Isbell,
1996) or a Typic Natrixeralf (Soil Survey Staff, 1999). It consisted of moderately fertile
sand (A and E horizons) over sodic clay (B horizon). The boundary between the E and
B horizons was abrupt. Intact soil segments (10 cm × 10 cm × 10 cm) were excised
from the E–B boundary. These segments were impregnated with an epoxy resin,
sectioned to a thickness of 20 µm and size 75 mm × 50 mm. Some general
characteristics of the soil are presented in Table 1 (Brewer et al., 1983).
The total concentration of the major elements and some trace elements in the bulk soil
of the different horizons were measured by XRF (Table 2). Three of the thin sections
were carbon coated and the micropores and their surrounding environment studied using
a scanning electron microscope (SEM) with an EDAX DX4 Energy Dispersive X-ray
analyser (EDXA) (Philips XL 30 Scanning Electron Microscope).

CHAPTER 6
125
depth pH (H2O) EC 1:5 CECcm dS/m cmol/kg
A1 0-14 7.8 0.92 5.35E 14-42 7.2 0.3 0.97B1 42-57 8.5 1.93 18.81B2 57-100 9 2.35 21.87
Table 1: General characteristics of the Stansbury profile

CHAPTER 6
126
A boundary0 - 3 3 - 10 10 - 27 27 - 33 33 - 45 45 - 50
Si % 44.84 45.33 45.96 43.27 38.91 35.13Al % 0.59 0.28 0.23 1.93 4.04 5.14Mg % 0.06 0.06 0.06 0.15 0.38 0.58Fe % 0.26 < 0.08 < 0.08 0.95 2.16 2.78Ca % < 0.07 < 0.07 < 0.07 0.09 0.23 1.71Na % < 0.06 < 0.06 < 0.06 < 0.06 < 0.06 < 0.06K % 0.20 0.17 0.15 0.46 0.81 1.05Ti % 0.05 0.03 0.04 0.13 0.19 0.23P % < 0.01 < 0.01 < 0.01 < 0.01 < 0.01 < 0.01Mn % < 0.01 < 0.01 < 0.01 < 0.01 < 0.01 < 0.01S % 0.01 0.01 0.01 0.01 0.01 0.01Zn ppm < 14 < 14 < 14 < 14 16 21Cu ppm < 10 < 10 < 10 < 10 < 10 < 10Cl ppm 58 < 20 < 20 < 20 65 168
cm
E B
Table 2: Total concentrations of major and trace elements of the top 50 cm of the
Stansbury profile measured by X ray fluorescence spectroscopy.
CHAPTER 6
127
This allowed identification of the micro-morphological features in the thin sections.
With the aid of an optical microscope, pores with a channel morphology were selected
for study by µ-XRF, µ-XANES and µ-EXAFS at beamline PNC-CAT-20-ID (Pacific
Northwest Consortium Collaborative Access Team) at the Advanced Photon Source
(APS) at Argonne National Laboratory, Argonne, IL, USA. The distribution of Ca, Fe,
Mn, Cu and Zn and the speciation of Fe, Mn, Cu and Zn in the immediate vicinity of the
pore were analysed. The electron storage ring operated at 7 GeV with a top-up fill
status. The µ−XRF maps and µ−XANES and EXAFS data were collected at ambient
temperature in the fluorescence mode, except for the µ−XANES of the standards that
were collected in the transmission mode, with a solid state 13-element detector. The
µ−XRF microprobe at APS beamline 20-ID is capable of collecting fluorescence data
with a 2 µm beam spot size and 1 to 10 mg kg-1 sensitivity, allowing study of elements
at low concentration in complex soil samples. The distribution of Ca, Mn, Fe, Cu and
Zn were determined using µ−XRF. Because the absorption length limited the intensity
of X-ray fluorescence, the thickness of the sample was kept as small as possible (20
µm).
Thin sections were mounted on the rotation axis of an x–y–θ stepping motor stage and
fluorescence data collected for areas of 1000 µm × 600 µm (map 1), 900 µm × 960 µm
(map 2), 1100 µm × 700 µm (map 3) and 700 µm × 1600 µm (map 4). The step size was
5 µm using a solid-state energy dispersive X-ray detector that allowed simultaneous
detection of fluorescence signals from multiple elements. Aluminum foil was used to
diminish the background fluorescence from Fe. The fluorescence signal from a given
element is proportional to the integrated number of atoms of that element along the
transect of the synchrotron beam. Because the Fe content of the soil was higher than
that of the other elements, fluorescence mapping was performed at two energy levels,
11500 and 7100 eV. The map at 7100 eV provided the distribution of the elements

CHAPTER 6
128
below the Fe absorption edge. In this way the distribution of Mn was defined with
minimal interference from Fe fluorescence. Hotspots of the elements of interest were
chosen based on the XRF maps. Spots were randomly selected for each element (Mn,
Fe, Cu and Zn), some close to the pore surface, some further in the soil matrix. Three
spectra by µ−XAS were collected over the energy range of -200 to +1000 eV above the
K-edge (Mn: 6539 eV, Fe: 7112 eV, Cu: 8979 eV and Zn: 9659 eV) at each spot. The
XANES and EXAFS spectra of Fe, Mn, Cu and Zn standards were collected following
selection of standards based on knowledge of the likely mineralogy. The standards
selected for Mn were birnessite ((Na,Ca)0.5(Mn4+,Mn3+)2O4.1.5H2O, hureaulite (Mn,
Fe)5H2(PO4)4.4H2O, manganocalcite (Mn-CaCO3), Mn-carbonate (MnCO3), Mn-sulfate
(MnSO4), Mn2O3, MnO2, switzerite (Mn, Fe)3(PO4)2.7H2O and manganite (MnO(OH));
standards for Fe were fayalite (Fe2SiO4), Fe3O4, goethite (FeOOH), siderite (FeCO3),
vivianite (Fe3(PO4)2.8H2O), Fe2O3, ferrihydrite (Fe5O3(OH)9), for Cu azurite
(Cu3(CO3)2(OH)2), chalcosiderite (CuFe6(PO4)4(OH)8·4(H2O), cuprite (Cu2O),
libethenite (Cu2(PO4)(OH)), malachite (Cu2(CO3)(OH)2), nissonite
(Cu2Mg2(PO4)2(OH)2·5(H2O)), pseudomalachite (Cu5(PO4)2(OH)4), tenorite (CuO) and
CuSO4; for Zn were ferrihydrite adsorbed Zn, franklinite
((Zn,Mn2+,Fe2+)(Fe3+,Mn3+)2O4), hopeite (Zn3(PO4)2·4(H2O)), hydrozincite
(Zn5(CO3)2(OH)6), scholzite (CaZn2(PO4)2·2(H2O)), smithsonite (ZnCO3), willemite
(Zn2SiO4) and Zn-sulfate (ZnSO4).
The XANES and EXAFS spectra of the randomly chosen hotspots were averaged, the
edge energy was calibrated and the spectra were normalised. Linear combination fitting
(LCF) was applied using IFEFFIT software on the pre-processed XANES and EXAFS
spectra of the hotspots (Newville, 2001). For each selected hotspot, the combination
with the lowest χ2 was chosen as the most likely combination of compounds in that
hotspot. The accuracy of the fitting depended on how well the standards represent the

CHAPTER 6
129
data. The reduced χ2 is a parameter that estimates how well a fitting function predicts
the means of a parent distribution. A reduced χ2 smaller than 1 indicated a reliable fit.
Because of the limited number of standards, the best fit composition may not have been
the complete composition, but it gave an indication of the possible chemical
composition and could be used to understand the variation in chemistry of different
elements as affected by the distance from the micropores.
RESULTS AND DISCUSSION
Micromorphological study revealed that the E horizon was composed mainly of quartz
of sand texture and had a coarse monic distribution pattern at the base of which was a
sharp change to a thin (2–4 mm) horizon composed mainly of sand and silt grains in a
matrix of amorphous organic fine material (Figure 1a). The c/f-related distribution
pattern was mainly close porphyric but there were small patches which were chitonic.
The boundary to the B horizon was very sharp (< 2mm, Figure 1b) and the upper part of
the B horizon had a speckled B fabric. There was no obvious orientation of the clay
domains in the top portion of the B but along micro- and meso-pores there was evidence
of grey coloured coatings that indicated the deposition of organic materials (Figure 1c).
In other pores there were lighter coloured zones that appeared to be highly argillaceous
but which contained much less iron than the matrix (Figure 1d) and appeared to be
illuviation features.
The elements studied at the synchrotron facility could not provide enough information
to confirm that the features identified as pores in the XRF maps were real pores.
However, measurements with SEM–EDXA showed that the main composition of the
areas that we predicted to be pores at the synchrotron facility was carbon, originating
either from the resin or from the coating applied for this analysis or both; there was no

CHAPTER 6
130
Al, Si or Fe present, elements that we would expect if we were analyzing soil matrix.
Using this criterion we located and identified pores in the thin sections using optical
microscopy at the synchrotron facility. The SEM-EDXA measurements revealed
different Al–Si ratios near the pore wall compared to the bulk soil matrix, from which
we inferred that the pore walls had clays of different composition than the rest of the
soil. The detection limits for EDXA, however, were ≥ 1000 mg kg-1 and none, except
Fe, of the elements studied with synchrotron techniques could be observed.

CHAPTER 6
131
Figure 1: a) Thin section of Stansbury profile showing the lower portion of the E
horizon. The base of the E horizon has a thin zone high in amorphous organic matter.
b) Section of the E B horizon transition. The E horizon is composed of sand, mostly
quartz in a close porphyric distribution pattern. c) Mesopores in upper part of the B
horizon lined with a thin coating composed of organic material ~10-20 µm thick. d)
Micropore in upper part of B horizon showing argillans.
a b
c d
10 µm
quartz
Organic material clay
Organic coating

CHAPTER 6
132
For each element under study, the distribution around a micropore was different. All the
distribution maps showed a significant accumulation of Ca in the micropores (Figures 2
and 3). The concentration of Ca in the soil matrix was insignificant compared to the Ca
accumulated in the pores (Figures 2 and 3). The measurements by the SEM-EDXA
confirmed the objects recognized as pores in the thin section because the only
laboratory-based EDXA detectable element present was C from the resin and/or C
coating prior to the SEM-EDXA. The much higher resolution afforded by synchrotron
radiation revealed Ca in the pores as well. Higher concentrations of Ca have been
reported around macropores at mm scale (Pankhurst et al., 2002). The concentration of
Ca in the rhizosphere can be higher than in the atrix as a consequence of accumulation
around living roots (Hinsinger 1998) and resulting from mass-flow exceeding actual Ca
uptake by the root.
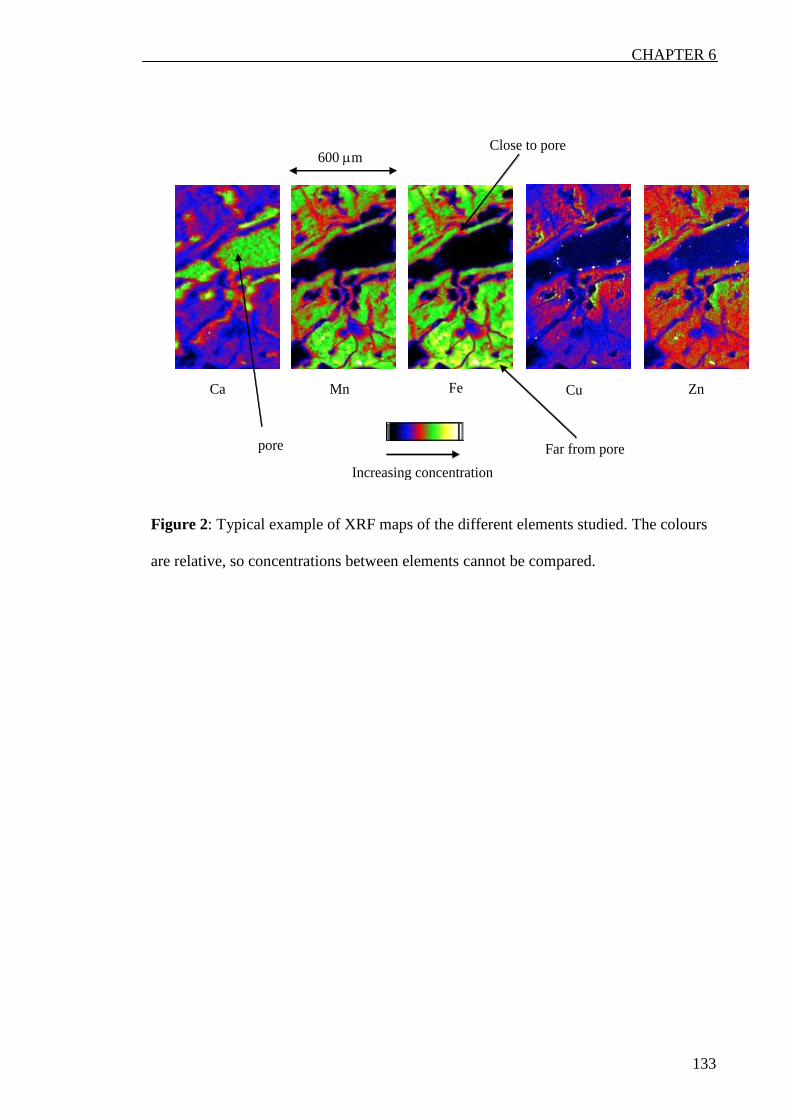
CHAPTER 6
133
Figure 2: Typical example of XRF maps of the different elements studied. The colours
are relative, so concentrations between elements cannot be compared.
Ca Mn Fe Cu Zn
Increasing concentration
600 µm
pore
Close to pore
Far from pore
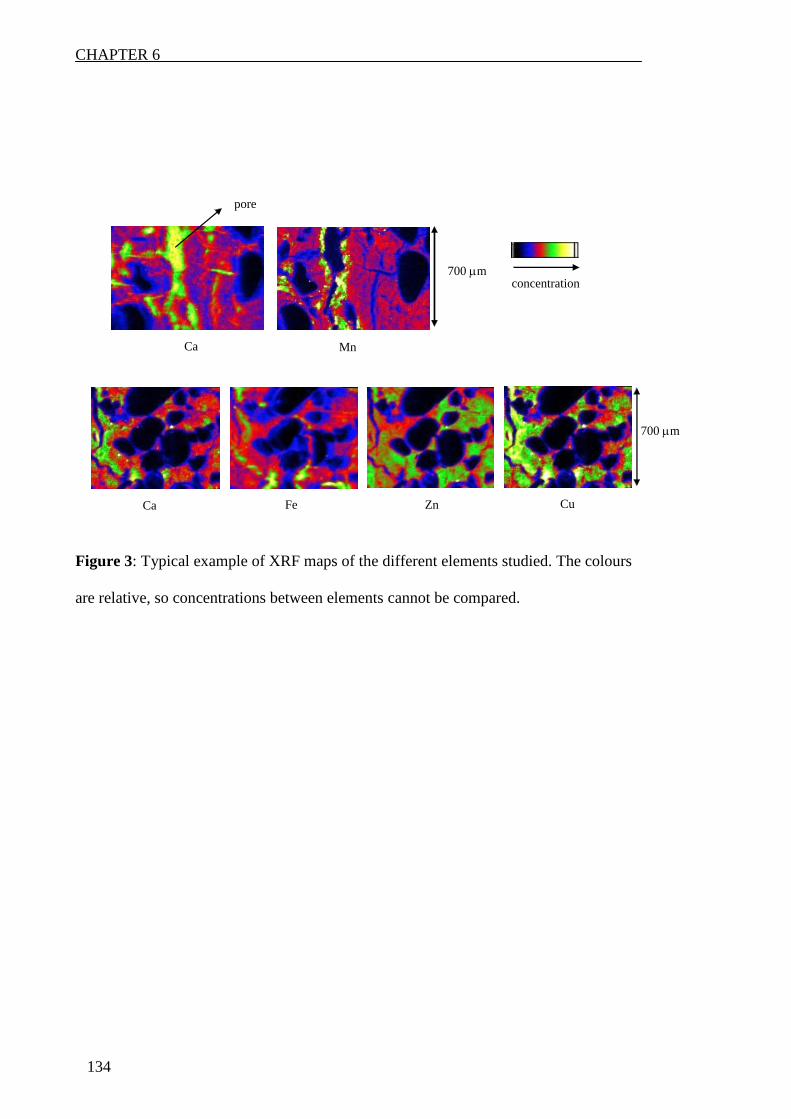
CHAPTER 6
134
Figure 3: Typical example of XRF maps of the different elements studied. The colours
are relative, so concentrations between elements cannot be compared.
concentration
Ca Mn
Ca Fe Zn Cu
700 µm
700 µm
pore

CHAPTER 6
135
It is present in higher concentrations in the soil solution compared to what the root takes
up and will naturally accumulate in the rhizosphere. The occurrence of CaCO3 in the Bk
horizon leads to high concentrations of Ca in the soil solution of upper B horizons.
When the B horizon temporarily saturates after a rain event, the carbonate in solution
may rise in the soil profile by capillarity and evapotranspiration and adsorb on to the
surrounding surfaces. The much lower abundance of Ca in the matrix indicates that
there was no significant transfer of Ca from the immediate surrounds of the pore.
Zinc and Mn were always highly associated with Fe with a coefficient of determination,
R2, ranging from 0.91 to 0.99 for Zn and 0.75 to 0.98 for Mn (Figure 4). Copper was
less correlated with Fe than the previous two elements with R2 values ranging from 0.48
to 0.79. This wide variability could be statistically insignificant given the much lower
concentration of Cu in the samples compared to Fe, Zn, Mn and Ca.
Manganese and Fe are oxidation sensitive elements. The exact position of their
absorption edges (Mn around 6539 eV and Fe around 7112 eV) can vary slightly
depending on oxidation state (Figure 4). Therefore, the XANES spectra give
information on the oxidation state of the elements whereas the EXAFS area gives
information about the coordination of the element with neighbouring atoms. For Fe and
Mn, the XANES spectra, and for Cu and Zn, the EXAFS spectra, were fitted by LCF.
The XANES of the Mn-spectra revealed that Mn occurred predominantly in the reduced
form, Mn2+. The LCF suggested that a large proportion of Mn existed as Mn-phosphate-
like forms (Table 3). There was no difference between points selected close to the pore
and further from the pore.

CHAPTER 6
136
Figure 4: Typical correlation maps with R2 of Mn, Fe, Cu and Zn of one of the areas
scanned by µXRF.
R2 = 0.9127
0.00
50.00
100.00
150.00
200.00
250.00
0.00 2.00 4.00 6.00 8.00 10.00
counts of Fe (x103)
coun
ts o
f Zn
(x10
3 )
R2 = 0.789
0.00
1.00
2.00
3.00
4.00
5.00
0.00 2.00 4.00 6.00 8.00 10.00
counts of Fe (x103)
coun
ts o
f Cu
(x10
3 )R2 = 0.9755
0.001.00
2.003.004.00
5.006.00
0.00 2.00 4.00 6.00 8.00 10.00
counts of Fe (x103)
coun
ts o
f Mn
(x10
3 )

CHAPTER 6
137
Table 3: Fractions of Mn species in selected ‘Mn-hotspots’ in the area close (at the
micropore surface) and far (> 300 µm from the micropore) from a micropore.
χ2= Σ [(fit – data)/ε]2 / (Ndata – Ncomponents) is the reduced chi-squared statistic. Here ε is
the
estimated uncertainty in the normalized XANES data (taken as 0.01 for all data). The
sum
is over Ndata points and Ncomponents is the number of components in the fit. The total
percentage was constrained to be 100% in all fits. Typical uncertainties in the
percentages listed for each standard component are 5%.
Mn birnessite hureaulite Mn-sulphate manganocalcite switzerite manganite R red-c2close
point 1 0.178 0.301 0.521 0.000 0.000 0.000 0.001 0.001point 2 0.000 0.688 0.000 0.000 0.312 0.000 0.006 0.004point 3 0.000 0.305 0.000 0.063 0.287 0.345 0.002 0.002point 4 0.000 0.184 0.000 0.000 0.132 0.684 0.003 0.003
farpoint 5 0.041 0.901 0.059 0.000 0.000 0.000 0.005 0.004point 6 0.000 0.506 0.494 0.000 0.000 0.000 0.003 0.003point 7 0.000 0.274 0.000 0.090 0.456 0.181 0.002 0.037
†
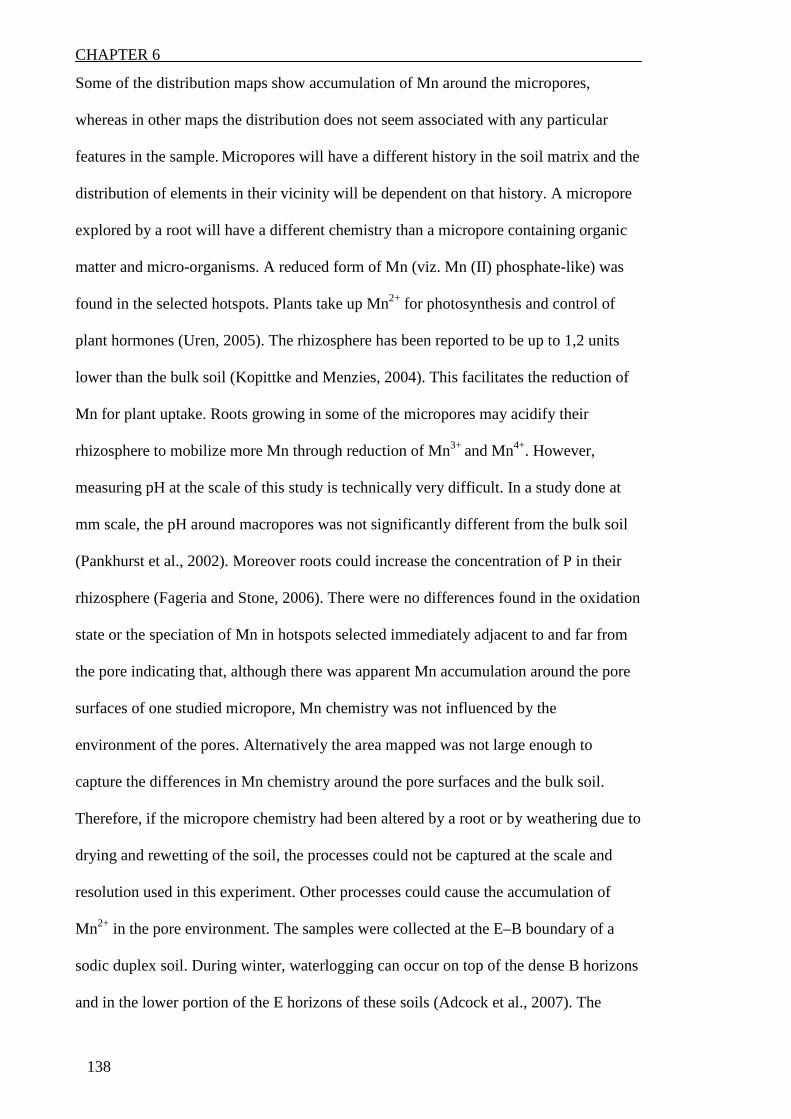
CHAPTER 6
138
Some of the distribution maps show accumulation of Mn around the micropores,
whereas in other maps the distribution does not seem associated with any particular
features in the sample. Micropores will have a different history in the soil matrix and the
distribution of elements in their vicinity will be dependent on that history. A micropore
explored by a root will have a different chemistry than a micropore containing organic
matter and micro-organisms. A reduced form of Mn (viz. Mn (II) phosphate-like) was
found in the selected hotspots. Plants take up Mn2+ for photosynthesis and control of
plant hormones (Uren, 2005). The rhizosphere has been reported to be up to 1,2 units
lower than the bulk soil (Kopittke and Menzies, 2004). This facilitates the reduction of
Mn for plant uptake. Roots growing in some of the micropores may acidify their
rhizosphere to mobilize more Mn through reduction of Mn3+ and Mn4+. However,
measuring pH at the scale of this study is technically very difficult. In a study done at
mm scale, the pH around macropores was not significantly different from the bulk soil
(Pankhurst et al., 2002). Moreover roots could increase the concentration of P in their
rhizosphere (Fageria and Stone, 2006). There were no differences found in the oxidation
state or the speciation of Mn in hotspots selected immediately adjacent to and far from
the pore indicating that, although there was apparent Mn accumulation around the pore
surfaces of one studied micropore, Mn chemistry was not influenced by the
environment of the pores. Alternatively the area mapped was not large enough to
capture the differences in Mn chemistry around the pore surfaces and the bulk soil.
Therefore, if the micropore chemistry had been altered by a root or by weathering due to
drying and rewetting of the soil, the processes could not be captured at the scale and
resolution used in this experiment. Other processes could cause the accumulation of
Mn2+ in the pore environment. The samples were collected at the E–B boundary of a
sodic duplex soil. During winter, waterlogging can occur on top of the dense B horizons
and in the lower portion of the E horizons of these soils (Adcock et al., 2007). The

CHAPTER 6
139
reduced form of Mn is more mobile than its oxidized form in the soil and it is possible
that it could have been transported from other parts of the profile to where it
accumulated around the micropore. Manganese has been found in reduced form in well
aerated Mn fertilized-calcareous soils (Hettiarachchi et al., 2008). Bulk measurements
of the soil in this study showed that some carbonates were present at the E–B boundary.
The LCF also showed that Mn was present as manganese phosphates. These Mn
bindings can be fairly soluble to extremely insoluble depending on the Mn-phosphate
species and the soil conditions (Boyle and Lindsay, 1986).
At mm scale Pankhurst et al. (2002) reported that for DTPA (Diethylene triamine
pentaacetic acid) extractable Fe accumulated at pore surfaces. The maps show that there
is slight accumulation of total Fe around the micropores studied. This accumulation
could be due to transport of Fe and Fe-containing minerals from horizons above the E–
B boundary. The petrology showed coatings of organic or argillaceous nature on the
surface of the micropores. These compounds can contain high levels of Fe. Iron was
mostly present in the oxidized form. The soil was dry when collected in the field; as a
consequence, Fe could have been mostly oxidized (Figure 5). Reduced Fe will mostly
be found in partly to fully saturated soils. The much lower hydraulic conductivity of the
B horizon compared to the E results in water perching at the top of the B horizon during
significant rain events. However, these reducing conditions are intermittent (the soil has
a xeric moisture regime) and are not intense enough to reduce Fe permanently in the
interface.

CHAPTER 6
140
0
1
2
3
4
5
6
7090 7100 7110 7120 7130 7140 7150
Energy (eV)
Abs
orpt
ion
Fe2O3
Fe3O4
goethite
Fit
Fe3+
Fe2+
close 2
far 1
far2
close 1
Figure 5: Example of XANES spectrum for an Fe hotspot selected more than 300 µm
from the pore surface. The oxidation state is mostly Fe3+ as shown by the linear
combination fitting of the standard spectra and position of the absorption edge.

CHAPTER 6
141
Nevertheless conditions may be sufficient to reduce Mn, which is in accord with
thermodynamic theory. Iron is mostly in goethite-, hematite- and magnetite-like solid
phases (Table 4). Only in one point (13) the dominated form of Fe was found to be
vivianite.Goethite is at stable form of Fe in soil and non-reactive. Iron (III) in soil is
mostly present in a form slightly less reactive than amorphous Fe3+ but more reactive
than hematite, magnetite and goethite (Lindsay, 1979). The Fe3+ measured could be a
mixture of amorphous Fe3+ and these three minerals. Strategy I plants take up Fe from
the soil solution as Fe2+. In alkaline soils, roots will acidify their rhizosphere to alleviate
the possibility of Fe-deficiency. Lowering the pH weathers Fe minerals and reduces
Fe3+ to Fe2+ (Hinsinger et al., 2003).
The concentration of Cu was very low. Nevertheless, the µ-XRF maps showed that
there was an accumulation of Cu in the soil surrounding the micropore. The same
distribution pattern was found for Zn, but the total concentration of Zn was higher than
Cu. This is in agreement with findings at mm scale (Pankhurst et al., 2002). Zinc and
Cu are micronutrients and plants induce different rhizosphere processes to mobilize
them. First, they can lower the soil pH or decrease the redox potential of the
rhizosphere. They also exude organic ligands to complex metals in soil solution and
they can take up the elements from the soil exchange complex (Fageria and Stone,
2006). Thus, living roots may accumulate Zn and Cu in the rhizosphere (Hinsinger et
al., 2006) where they remain when the root dies and the channel becomes a micropore.
Alternatively, the micropore could have been used as a pathway for fine roots. Zinc is
often added to phosphate fertilizers. From the soil solution Zn can adsorb to soil pore
surfaces.
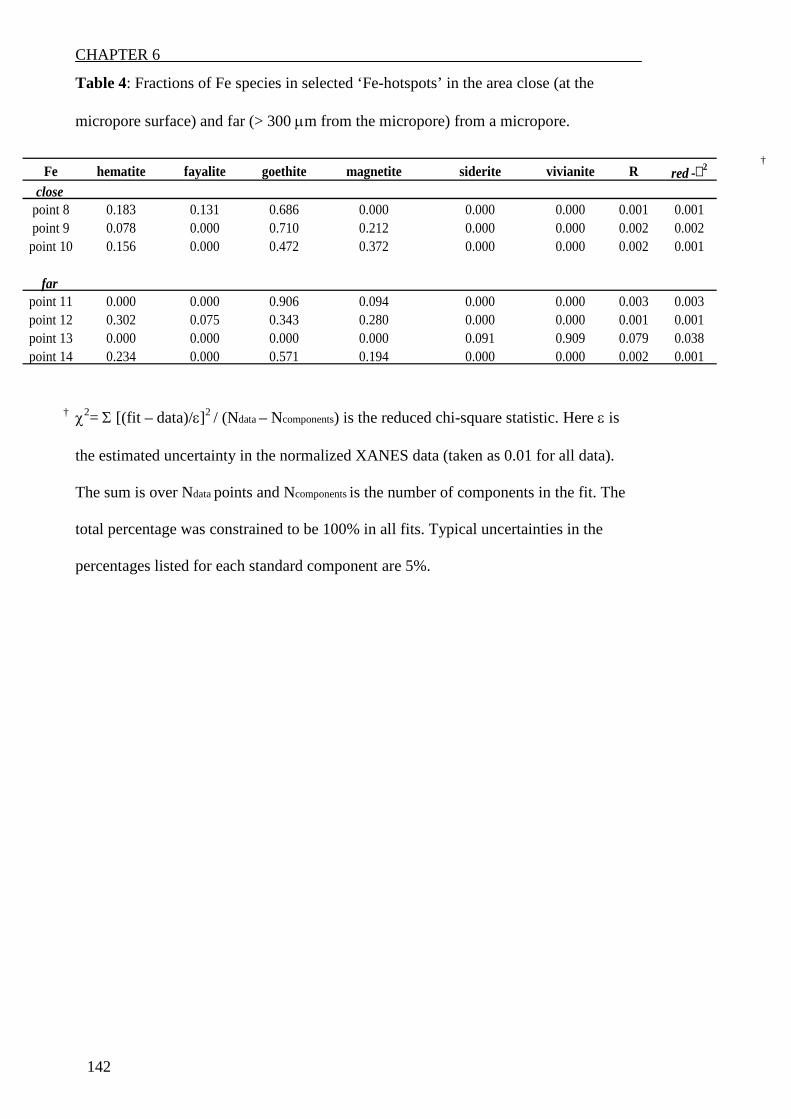
CHAPTER 6
142
Fe hematite fayalite goethite magnetite siderite vivianite R red -c2
closepoint 8 0.183 0.131 0.686 0.000 0.000 0.000 0.001 0.001point 9 0.078 0.000 0.710 0.212 0.000 0.000 0.002 0.002
point 10 0.156 0.000 0.472 0.372 0.000 0.000 0.002 0.001
farpoint 11 0.000 0.000 0.906 0.094 0.000 0.000 0.003 0.003point 12 0.302 0.075 0.343 0.280 0.000 0.000 0.001 0.001point 13 0.000 0.000 0.000 0.000 0.091 0.909 0.079 0.038point 14 0.234 0.000 0.571 0.194 0.000 0.000 0.002 0.001
Table 4: Fractions of Fe species in selected ‘Fe-hotspots’ in the area close (at the
micropore surface) and far (> 300 µm from the micropore) from a micropore.
χ2= Σ [(fit – data)/ε]2 / (Ndata – Ncomponents) is the reduced chi-square statistic. Here ε is
the estimated uncertainty in the normalized XANES data (taken as 0.01 for all data).
The sum is over Ndata points and Ncomponents is the number of components in the fit. The
total percentage was constrained to be 100% in all fits. Typical uncertainties in the
percentages listed for each standard component are 5%.
†
†
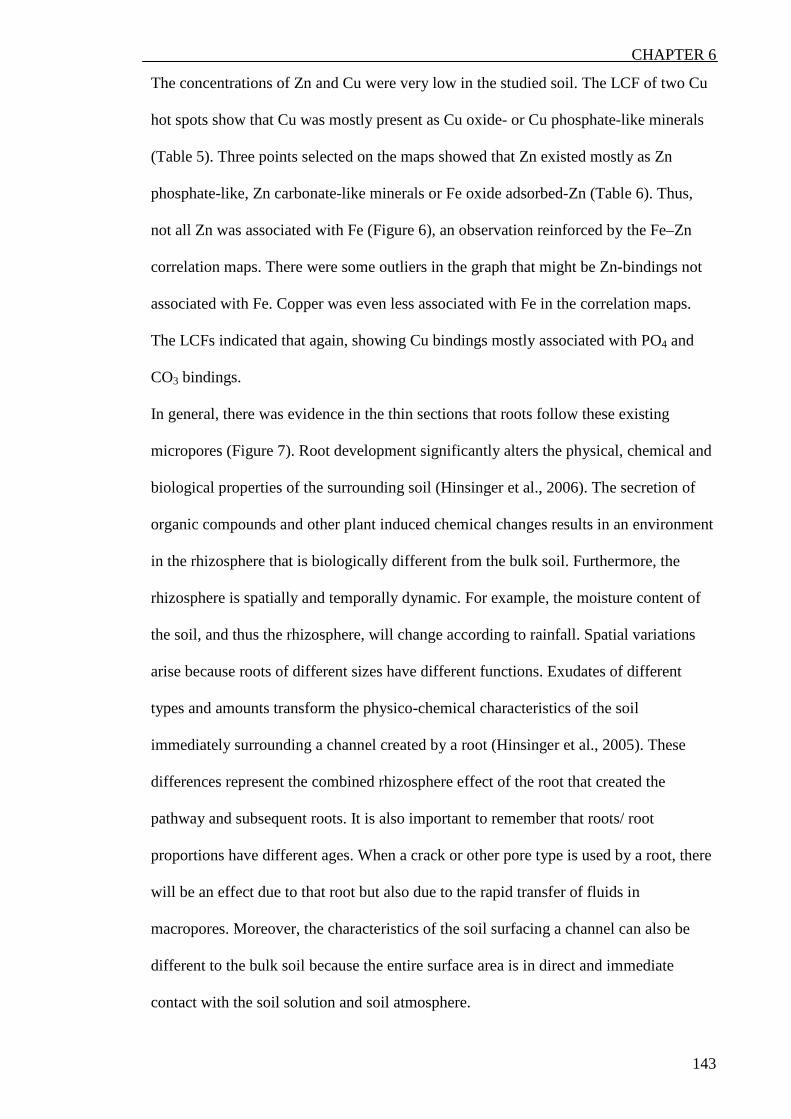
CHAPTER 6
143
The concentrations of Zn and Cu were very low in the studied soil. The LCF of two Cu
hot spots show that Cu was mostly present as Cu oxide- or Cu phosphate-like minerals
(Table 5). Three points selected on the maps showed that Zn existed mostly as Zn
phosphate-like, Zn carbonate-like minerals or Fe oxide adsorbed-Zn (Table 6). Thus,
not all Zn was associated with Fe (Figure 6), an observation reinforced by the Fe–Zn
correlation maps. There were some outliers in the graph that might be Zn-bindings not
associated with Fe. Copper was even less associated with Fe in the correlation maps.
The LCFs indicated that again, showing Cu bindings mostly associated with PO4 and
CO3 bindings.
In general, there was evidence in the thin sections that roots follow these existing
micropores (Figure 7). Root development significantly alters the physical, chemical and
biological properties of the surrounding soil (Hinsinger et al., 2006). The secretion of
organic compounds and other plant induced chemical changes results in an environment
in the rhizosphere that is biologically different from the bulk soil. Furthermore, the
rhizosphere is spatially and temporally dynamic. For example, the moisture content of
the soil, and thus the rhizosphere, will change according to rainfall. Spatial variations
arise because roots of different sizes have different functions. Exudates of different
types and amounts transform the physico-chemical characteristics of the soil
immediately surrounding a channel created by a root (Hinsinger et al., 2005). These
differences represent the combined rhizosphere effect of the root that created the
pathway and subsequent roots. It is also important to remember that roots/ root
proportions have different ages. When a crack or other pore type is used by a root, there
will be an effect due to that root but also due to the rapid transfer of fluids in
macropores. Moreover, the characteristics of the soil surfacing a channel can also be
different to the bulk soil because the entire surface area is in direct and immediate
contact with the soil solution and soil atmosphere.

CHAPTER 6
144
Table 5: Fractions of Cu species in selected ‘Cu-hotspots’ in the area close (at the
micropore surface) and far (> 300 µm from the micropore) from a micropore
determined by linear combination fitting of EXAFS spectra.
χ2= Σ [(fit – data)/ε]2 / (Ndata – Ncomponents) is the reduced chi-square statistic. The sum is
over Ndata points (161 data points between 2 to 8 k space), and Ncomponents is the number
of components in the fit (either 3 or 4 as indicated in the Table). The total percentage
was constrained to be 100% in all fits. Typical uncertainties in the percentages listed for
each standard component are 5%.
†
Cu calcosiderite malachite nissonite pseudomalachite cuprite libethenite R red-c2
Closepoint 1 0.133 0.247 0.472 0.147 0 0 0.414 2.03point 2 0 0.237 0.485 0 0.145 0.133 0.257 1.14
†

CHAPTER 6
145
Table 6: Fractions of Zn species in selected ‘Zn-hotspots’ in the area close (at the
micropore surface) and far (> 300 µm from the micropore) from the soil micropore
determined by linear combination fitting of EXAFS spectra.
χ2= Σ [(fit – data)/ε]2 / (Ndata – Ncomponents) is the chi-square statistic. The sum is over
Ndata points (161 data points between 2 to 8 k space), and Ncomponents is the number of
components in the fit (either 3 or 4 as indicated in the Table). The total percentage was
constrained to be 100% in all fits. Typical uncertainties in the percentages listed for
each standard component are 5%.
†
† Zn hydrozincite scholzite smithsonite hopeite R red-c2
Closepoint 1 0.564 0.436 0 0 0.583 20.4point 2 0.621 0 0.469 0.395 0.616 26.2
farpoint 3 0.454 0.546 0 0 0.352 6.13
0,136
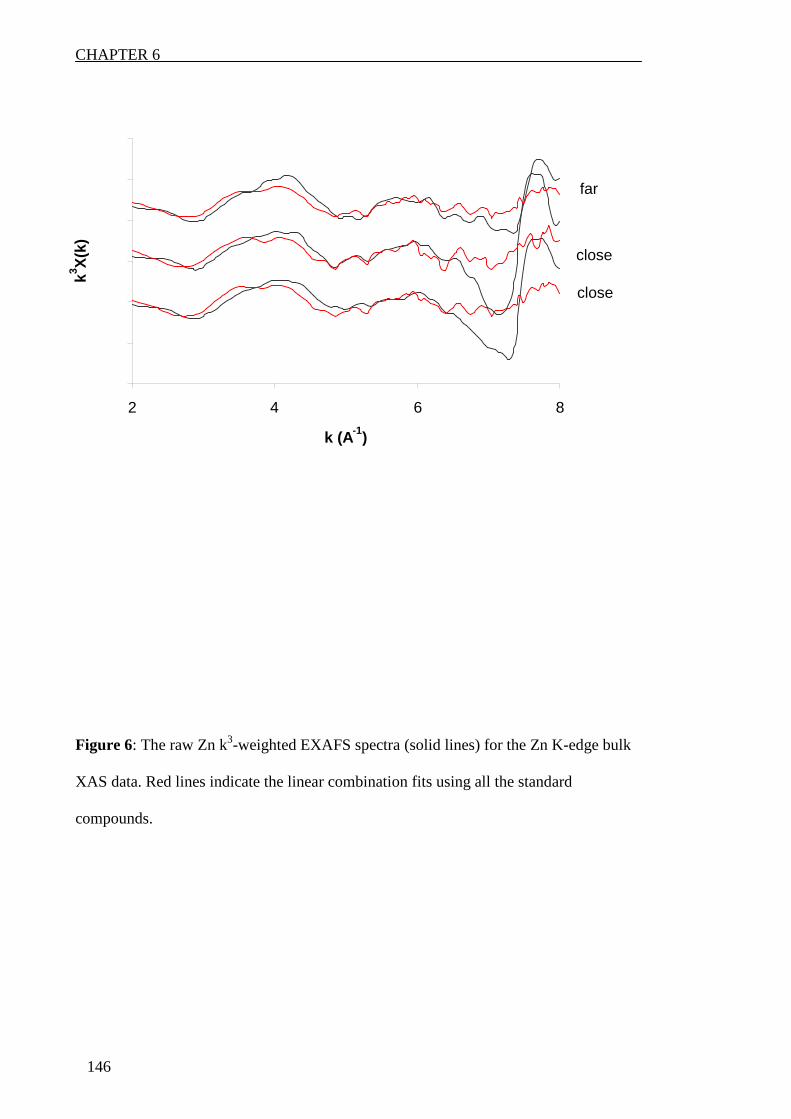
CHAPTER 6
146
Figure 6: The raw Zn k3-weighted EXAFS spectra (solid lines) for the Zn K-edge bulk
XAS data. Red lines indicate the linear combination fits using all the standard
compounds.
close
close
far
-20
-10
0
10
20
30
40
2 4 6 8
k (A-1)
k3 X(k)

CHAPTER 6
147
Figure 7: Evidence that fine roots follow micropores in the interface of sodic duplex
soils.
root
0.3 mm

CHAPTER 6
148
It should be noted that the interpretation of the results in this experiment was difficult
because soils contain a variety of minerals, water, air, organic matter and soil organisms
and these phases occur at different scales larger than the samples studied here or at
scales even finer, at a resolution not detectable with the techniques used here. The
elemental correlations show how well the studied elemental distributions were
correlated with each other (Figure 5). Also, the results of this study is limited by
combination of standards for obtaining the spectra. In later experiments, standards with
organically bound Cu and highly weathered Fe based minerals should be used.
CONCLUSIONS
Micropores at the top of the B horizon of this sodic soil with strong texture contrast
between the E and B horizons contain debris of roots but we cannot be certain that the
micropores were created by a root or just colonized by one. Of the elements studied Ca
was concentrated in the micropores. Apart from a few locations, Fe concentrations in
the immediate vicinity of the pore and the matrix were similar. Manganese, Zn and Cu
accumulate around micropores. The XANES suggested that Mn was present in reduced
form (Mn II) and Fe in its oxidized form (Fe III). Mn was in phosphate forms, Fe as Fe
oxides, Cu as Cu phosphates and Zn as Zn phosphates and adsorbed Zn. There was no
difference in chemistry of these elements at the pore surface and > 300 µm from it. We
conclude that the influence of the micropore is to concentrate Zn, Mn, Cu within and in
the immediate vicinity of it but that there is no significant influence of the micropore on
the chemical form of these elements. The chemical form of these 3 elements is similar at
the pore surface and in the matrix. A larger area around the micropore should be studied
to see whether the influence on the chemical form of these elements varies at a larger
scale.

CHAPTER 6
149
There are some major limitations for this technique. To have a clear picture, the
standards used need t match fully with the actual cominant forms of elements in the
sample. The sensitivity of the elements is limited, and thus, one tends to study spots
where elements are concentrated. The study is also only limited at the selected regions.
REFERENCES
Adcock, D., A.M. McNeill, G.K. McDonald, and R.D. Armstrong. 2007. Subsoil
constraints to crop production on neutral and alkaline soils in south-eastern
Australia: a review of current knowledge and management strategies. Aust. J.
Exp. Agr. 47:1245-1261.
Boyle, F.W., and W.L. Lindsay. 1986. Manganese Phosphate Equilibrium Relationships
in Soils. Soil Sci. Soc. Am. J. 50:588-593.
Brewer, R., J.R. Sleeman, and R.C. Foster. 1983. The fabric of Australian soils. p. 439-
476. In Soils: an Australian viewpoint. CSIRO Division of soils. Academic
Press, London.
Calba, H., P. Firdaus, C. Cazevieille, C. Thee, R. Poss, and B. Jaillard. 2004. The
dynamics of protons, aluminium, and calcium in the rhizosphere of maize
cultivated in tropical acid soils: experimental study and modelling. Plant Soil
260:33-46.
Clark, l.J., W.R. Whalley, and B. P. Barraclough. 2003. How do roots penetrate strong
soil? Plant Soil 255:93-104.
Fageria, N.K., and L.F. Stone. 2006. Physical, chemical, and biological changes in the
rhizosphere and nutrient availability. J. Plant Nutr. 29:1327-1356.
Hettiarachchi, G.M., M.J. McLaughlin, K.G. Scheckel, D.C. Chittleborough, M.
Newville, S. Sutton, and E. Lombi. 2008. Evidence for Different Reaction
CHAPTER 6
150
Pathways for Liquid and Granular Micronutrients in a Calcareous Soil. Soil Sci.
Soc. Am. J. 72: 98-110.
Hinsinger, P. , B. Jaillard, 1993. Root-induced release of interlayer potassium and
vermiculitization of phlogopite as related to potassium depletion in the
rhizosphere of ryegrass. J. Soil Sci., 44: 525-534.
Hinsinger, P. 1998. How do plant roots acquire mineral nutrients? Chemical processes
involved in the rhizosphere. Adv. Agron. 64:225-265.
Hinsinger, P., C. Plassard, C.X. Tang, and B. Jaillard. 2003. Origins of root-mediated
pH changes in the rhizosphere and their responses to environmental constraints:
A review. Plant Soil 248:43-59.
Hinsinger, P., G.R. Gobran, P.J. Gregory, and W.W. Wenzel. 2005. Rhizosphere
geometry and heterogeneity arising from root-mediated physical and chemical
processes. New Phytol. 168: 293-303.
Hinsinger, P., C. Plassard, and B. Jaillard. 2006. Rhizosphere: A new frontier for soil
biogeochemistry. J. Geochem. Explor. 88:210-213.
Isaure, M.P., A. Manceau, N. Geoffroy, A. Laboudigue, N. Tamura, and M.A. Marcus.
2005. Zinc mobility and speciation in soil covered by contaminated dredged
sediment using micrometer-scale and bulk-averaging X-ray fluorescence,
absorption and diffraction techniques. Geochim. Cosmochim. Acta 69:1173-
1198.
Isbell, R.F. 1996. The Australian Soil Classification. CSIRO Publishing, Collingwood,
Australia.
Kopittke, P.M., and N.W. Menzies. 2004. Effect of Mn deficiency and legume
inoculation on rhizosphere pH in highly alkaline soils. Plant Soil 262:13-21.
Lindsay, W.L. 1979. Chemical equilibria in soil. Wiley Interscience, New York, USA.

CHAPTER 6
151
Loosemore, N., A. Straczek, P. Hinsinger, and B. Jaillard. 2004. Zinc mobilisation from
a contaminated soil by three genotypes of tobacco as affected by soil and
rhizosphere pH. Plant Soil 260:19-32.
Manceau, A., M.A. Marcus, N. Tamura, O. Proux, N. Geoffroy, and B. Lanson. 2004.
Natural speciation of Zn at the micrometer scale in a clayey soil using X-ray
fluorescence, absorption, and diffraction. Geochim. Cosmochim. Acta 68:2467-
2483.
McKenzie, N., D. Jacquier, R. Isbell, and K. Brown. 2004. Australian soils and
landscapes, an illustrated compendium. CSIRO Publishing, Collingwood,
Australia.
Mengel, K., and S. Schubert. 1985. Active Extrusion of Protons into Deionized Water
by Roots of Intact Maize Plants. Plant Physiol. 79:344-348.
Newville, M. 2001. IFEFFIT: interactive XAFS analysis and FEFF fitting. J.
Synchrotron Radiat. 8:322-324.
Pankhurst, C.E., A. Pierret, B.G. Hawke, and J.M. Kirby. 2002. Microbiological and
chemical properties of soil associated with macropores at different depths in a
red-duplex soil in NSW, Australia. Plant Soil 238:11-20.
Robinson, D. 1996. Resource capture by localized root proliferation: why do plants
bother? Ann. Bot. 77:179-185.
Soil Survey Staff. 1999. Soil taxonomy: a basic system of soil classification for making
and interpreting soil surveys. U.S. Department of Agriculture Handbook,
Washington DC, USA.
Springob, G., J. Richter. 1998. Measuring interlayer potassium release rates from soil
materials.II. A percolation procedure to study the influence of the variable
‘solute K’ in the 1…10 µM range. Zeitschrift für Pflanzenernährung und
Bodenkunde 161:323-329.
CHAPTER 6
152
Stewart, J.B., C.J. Moran, and J.T. Wood . 1999. Macropore sheath: quantification of
plant root and soil macropore association. Plant Soil 211:59-67.
Stirzaker, R.J., J.B. Passioura, and Y. Wilms. 1996. Soil structure and plant growth:
impact of bulk density and biopores. Plant Soil 185:151-162.
Strawn, D., H. Doner, M. Zavarin, and S. McHugo. 2002. Microscale investigation into
the geochemistry of arsenic, selenium, and iron in soil developed in pyritic shale
materials. Geoderma 108:237-257.
Uren, N.C. 2005. Manganese. 287-294. Peverill, K.I, Sparrow, L.A., Reuter, D.J. Soil
Analysis: an interpretation manual. CSIRO, Collingwood, Victoria.
Verboom, W.H., and J.S. Pate. 2006. Bioengineering of soil profiles in semiarid
ecosystems: the 'phytotarium' concept. A review. Plant Soil 289:71-102.

CHAPTER 7
153
Characterising the chemistry of micropores in a sodic soil with strong
texture-contrast using synchrotron X-ray techniques and LA-ICP-MS
Laurence Jassogne1,3, Ganga Hettiarachchi2,3, Ann McNeill3, David Chittleborough3
1School of Plant Biology, University of Western Australia, Crawley Western Australia,
6907
2Department of Agronomy, Kansas State University, Manhattan, KS 66506, USA
3Soil and Land Systems, School of Earth and Environmental Sciences, University of
Adelaide, Waite Campus, PMB 1, Glen Osmond, SA, 5064 Australia
*corresponding author; e-mail: [email protected]
Phone: +61 8 8303 8114
Fax: +61 8 8303 6717
Acknowledgments:
We thank the Australian government for the International Postgraduate Research
Scholarship of Laurence Jassogne. We would also like to thank Prof. Hans Lambers for
support. This work was performed at GeoSoilEnviroCARS (Sector 13), Advanced
Photon Source (APS), Argonne National Laboratory. GeoSoilEnviroCARS is supported
by the National Science Foundation - Earth Sciences (EAR-0622171) and Department
of Energy - Geosciences (DE-FG02-94ER14466). We especially want to thank Matt
Newville for the valuable suggestions for sample setup and support for XRF/XAS data
collection. Use of the Advanced Photon Source was supported by the U. S. Department
of Energy, Office of Science, Office of Basic Energy Sciences, under Contract No. DE-
AC02-06CH11357.
This work was supported by the Australian Synchrotron Research Program (ASRP)
which is funded by the commonwealth of Australia under Major National Research
Facilities Program. The CRC for plant based management of dryland salinity also partly

CHAPTER 7
154
funded this research. The authors would also like to thank Angus Netting for the help
with LA-ICP-MS analysis at Adelaide Microscopy.

CHAPTER 7
155
ABSTRACT
Duplex soils dominate the agricultural zone of western and southern Australia. The
texture of the A and E horizons in these soils is usually coarse. The low organic matter
content of these horizons together with their texture makes them have a low nutrient
content and water holding capacity. The B horizon is often of much finer texture and
can have a bulk density as high as 2 g cm-3. When this subsoil is dry, most roots cannot
drill through it. The only way some of the roots have to proliferate in the subsoil is by
using pores that extend many meters through the profile. In a root system, the finer roots
are responsible for water and nutrient uptake. These roots will explore preferably meso-
and micropores. The highly heterogeneous nature of soils and especially pores made or
used by finer roots require investigative techniques capable of high resolution and high
sensitivity. Synchrotron radiation affords a superior resolution to conventional lab based
instruments, permitting differentiation of similar chemical species with better certainty.
In this study, synchrotron based µ-X-ray fluorescence spectroscopy (µ-XRF) was used
to investigate the distribution of calcium (Ca), manganese (Mn), iron (Fe), zinc (Zn) and
copper (Cu) and synchrotron based X-ray absorption near edge structure (XANES)
spectroscopy to investigate the speciation of Fe, Mn Zn and Cu around a mesopore.
Intact samples and thin sections were used and overall it was found that measurements
from thin section were more useful due to the smaller thickness that can be obtained
with them. The distribution maps showed that Ca was present in the pores while none of
the other elements were. The concentration of Cu and Zn mostly increased around the
mesopore. Manganese was always well correlated with Fe.
Manganese was found in reduced form and associated with phosphate bindings while Fe
in oxidised form and mostly associated with oxides. Zinc was mostly associated in
bindings with carbonates (CO3), sulfates (SO4) and silicates (SiO4). The results were

CHAPTER 7
156
then compared with measurements done with Laser Ablation Inductively Coupled
Plasma Mass Spectrometry (LA-ICP-MS) and it was found that using both methods Cu
was enriched around the micropore. All the mesopores studied with the synchrotron
were enriched with Ca while only some of the one studied with LA-ICP-MS were.

CHAPTER 7
157
INTRODUCTION
Soils with strong texture contrast between surface and B horizons, called duplex soils in
Australia, dominate the agricultural zone of western and southern Australia. The texture
of the A and E horizons is usually coarse and of low nutrient content and water holding
capacity. The B horizon has a much finer texture than the surface horizons and can have
a bulk density as high as 2 g cm-3 (Chittleborough, 1992). High soil strength causes
mechanical resistance to root penetration. Furthermore, root growth can be impeded
because of seasonal waterlogging caused by a perched watertable on the dense, high-
strength sodic B horizon (Adcock et al., 2007). Roots growing through the B-horizon of
texture-contrast soils can use pores that extend many meters through the profile
(Yunusa et al., 2002). These biopores, presumably created by native perennial
vegetation, not only provide pathways through the soil otherwise impenetrable by many
plants but also improve exposure to preferential flows of oxygen, water and nutrients
(Bouma, 1992; Eldridge and Freudenberger, 2005).
Roots change the chemical, physical and biological properties of the soil in which they
grow and the zone of soil in which these changes occur is called the rhizosphere
(Hinsinger et al., 2006). These effects can be direct, for example the exudation of
protons lowers the pH of the soil thereby facilitating access to nutrients, or indirect, for
example, the exudation of organic molecules that can be used as substrate by soil
microbes. In a root system, fine roots (< 0.8 mm) and root hairs are predominantly
responsible for water and nutrient uptake (McCully, 1999) because of their high specific
surface area. These roots will be located in the meso- and micropores of a structured
soil. Micropores also called matrix pores occur between individual mineral grains and
CHAPTER 7
158
soil particles and are not generally created by soil biota (Eldridge and Freudenberger,
2005).
The rhizosphere develops, matures and senesces in parallel with developmental changes
in adjacent regions of the subtending root and remains as a relic after root death, often
as a biopore which, in hard soils, is occupied by roots of subsequent crops (Jones et al.,
2004; McCully, 2005). Stewart et al. (1999) defined the macropore sheath as the zone
around a macropore in which 80 % of the roots in the soil are located. In hostile soils,
the macropore sheath is small and the roots are concentrated in the immediate vicinity
of the macropore. “Hostile” is a descriptor that has been used to convey the difficulty of
many introduced crop and pasture plants to cope with duplex soils having high strength
B horizons. In less hostile soils, the influence of the macropore sheath extends further
into the soil matrix and roots are more evenly distributed in the soil. Few studies have
looked at the chemistry of remnant rhizospheres in soil. Most studies have been carried
out at mm scale and on soils in which the natural structure has been destroyed. In
Stewart’s study a 3 mm annulus around the macropore was scraped and separated from
the matrix and analysed for several elements and microbiological activity. It has thereby
been shown that the environment around such a macropore has higher organic C, total
N, bicarbonate extractable P, Ca, Cu, Fe and Mn and supported higher populations of
bacteria, fungi, actinomycetes (i.e. Pseudomonas spp., Bacillus spp., cellulolytic
bacteria, cellulolytic fungi, nitrifying bacteria and the root pathogen Pythium) than the
bulk soil (Pierret et al., 1999; Pankhurst et al., 2002).
Because root growth in hostile subsoils is dependent on pore character, there is a need
to understand the distribution of nutrients in relation to pore surfaces. The distribution
of micronutrients, the highly heterogeneous nature of soils and especially their pore
surfaces, require techniques capable of high resolution and high surface sensitivity. In a
previous study Jassogne et al. (accepted with revisions in Soil Sci Soc Am J, Chapter 6)

CHAPTER 7
159
employed synchrotron based X-ray techniques to produce high resolution maps of the
distribution of Ca, Mn, Fe, Zn and Cu. Synchrotron radiation allowed differentiation of
these elements with greater certainty than normal X-ray techniques of lower resolution.
There is a paucity of information at the nano- and micro-scale of the effect of roots on
the chemistry of the pore surface and to what extent, synchrotron based X-ray
Fluorescence (XRF) and X-ray absorption near edge spectroscopy (XANES) can aid in
these investigations. The X-ray beam can be focused to a spot size of amplitude of a
couple of µm, depending on the beamline, using a combined harmonic rejection/vertical
mirror. The spot size is the average size of soil particles that are chemically reactive. A
study by Voegelin et al. (2007) used these techniques to investigate the distribution and
speciation of arsenic (As) around roots in thin sections of riparian soils. The analysis of
soil thin sections by µ-XRF and XANES has also been employed to investigate the
speciation of Zn in clay soils (Isaure et al., 2005; Manceau et al., 2004) and the
geochemistry of As, Se and Fe in soil developed in pyritic shale materials (Strawn et al.,
2002). The benefit of using thin sections is that the surface is polished and flat. Thin
sections are also easier to handle than intact samples. Nevertheless, impregnating a soil
sample with a resin is invasive and the chemistry and structure of the sample could be
altered. Drying the sample too quickly with acetone can make roots shrink and can give
a misrepresentation of the soil/root contact phase for example. However, thin sections
can be prepared in such a manner that the interface between soil and root is only
minimally perturbed (Van Noordwijk et al., 1992).
In this study we analyse aggregates of soil in which the original structure has been
maintained and thin sections of undisturbed soil at µm-scale in order to resolve the
distribution of Ca, Fe, Mn, Zn and Cu around mesopores by µ-XRF and their speciation
by XANES. The locus of our study was the E horizon-B horizon boundary, the site in
the profile of abrupt texture contrast. Because of the novelty of this study, it was

CHAPTER 7
160
important to investigate other techniques that could confirm our findings. In a previous
study by Jassogne et al. (accepted with revisions in Soil Sci Soc Am J, Chapter 6) some
observations by X-ray absorption spectroscopy were confirmed by scanning electron
microscopy fitted with an energy-dispersive X-ray analyser (SEM-EDXA) but the
instrument was not sensitive enough to study all the elements of interest. Because LA-
ICP-MS can provide spatially-resolved information at ppm detection limits for many
elements (Jimenez et al., 2007) this technique was employed. In this paper, LA-ICP-MS
was used to determine the distribution of Ca, Mn, Fe, Zn and Cu along a transect
crossing a mesopore.
MATERIALS AND METHODS
Intact soil cores (50 cm long, 15 cm diameter) were taken from an agricultural site in
southern Australia (33° 54’S, 137° 47’E). The soil was a Red Sodosol in the Australian
Soil Classification (Isbell 1996,) or a Typic Natrixeralf (Soil Survey Staff, 1999). It
consisted of A and E horizons of sand texture overlying a sodic B horizon of clay
texture at approximately 35 cm. The general characteristics of this soil are presented in
another paper (Chapter 6 or Jassogne et al., accepted in Soil Sci Soc Am J with
revisions). Intact soil segments (10 cm x 10 cm x 10 cm) were excised from the zone
around the E-B boundary (hereafter called the interface). These segments were
impregnated with an epoxy resin and sections of thickness 20 µm prepared.
Furthermore, soil clods (approx. 1.5 cm x 1.5 cm x 0.7 cm) were isolated from the
interface. A criterion for selection of the clods for analysis was that they had
distinguishable root channels on their outer surfaces. Mesopores were selected on two
of the clods. The channels selected for analysis in thin section were those containing a
decaying root identifiable by the black organic material in the channel. The pores
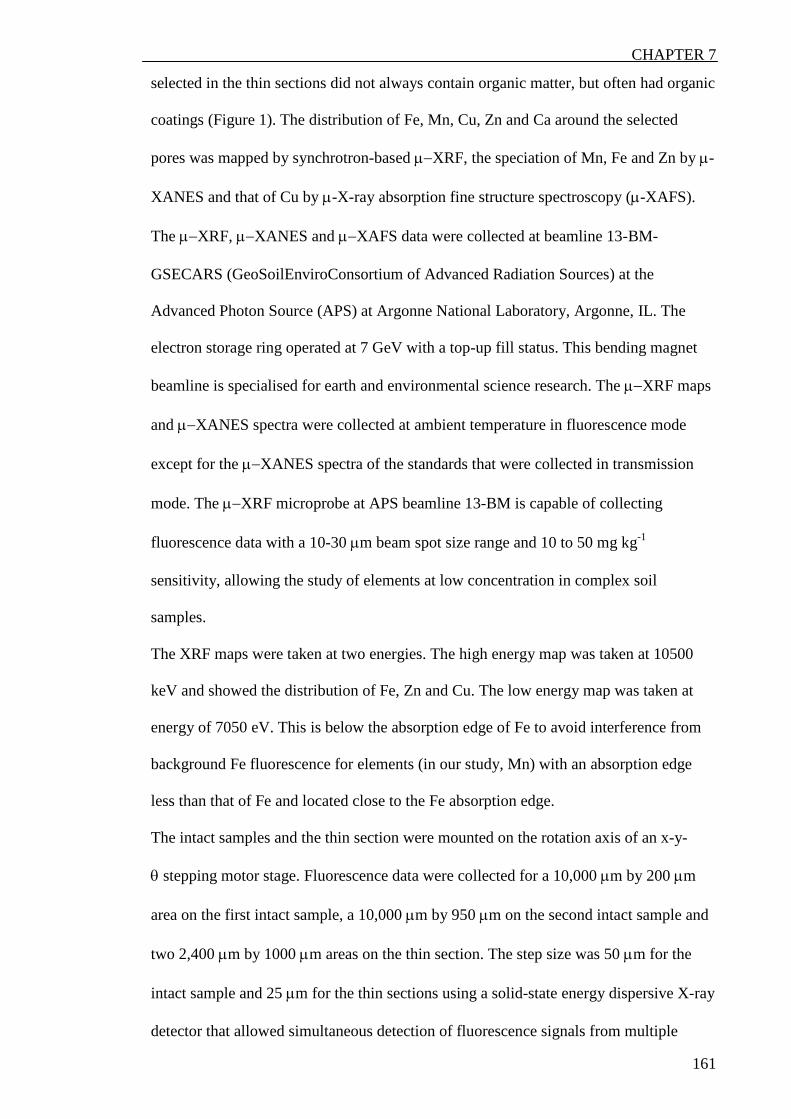
CHAPTER 7
161
selected in the thin sections did not always contain organic matter, but often had organic
coatings (Figure 1). The distribution of Fe, Mn, Cu, Zn and Ca around the selected
pores was mapped by synchrotron-based µ−XRF, the speciation of Mn, Fe and Zn by µ-
XANES and that of Cu by µ-X-ray absorption fine structure spectroscopy (µ-XAFS).
The µ−XRF, µ−XANES and µ−XAFS data were collected at beamline 13-BM-
GSECARS (GeoSoilEnviroConsortium of Advanced Radiation Sources) at the
Advanced Photon Source (APS) at Argonne National Laboratory, Argonne, IL. The
electron storage ring operated at 7 GeV with a top-up fill status. This bending magnet
beamline is specialised for earth and environmental science research. The µ−XRF maps
and µ−XANES spectra were collected at ambient temperature in fluorescence mode
except for the µ−XANES spectra of the standards that were collected in transmission
mode. The µ−XRF microprobe at APS beamline 13-BM is capable of collecting
fluorescence data with a 10-30 µm beam spot size range and 10 to 50 mg kg-1
sensitivity, allowing the study of elements at low concentration in complex soil
samples.
The XRF maps were taken at two energies. The high energy map was taken at 10500
keV and showed the distribution of Fe, Zn and Cu. The low energy map was taken at
energy of 7050 eV. This is below the absorption edge of Fe to avoid interference from
background Fe fluorescence for elements (in our study, Mn) with an absorption edge
less than that of Fe and located close to the Fe absorption edge.
The intact samples and the thin section were mounted on the rotation axis of an x-y-
θ stepping motor stage. Fluorescence data were collected for a 10,000 µm by 200 µm
area on the first intact sample, a 10,000 µm by 950 µm on the second intact sample and
two 2,400 µm by 1000 µm areas on the thin section. The step size was 50 µm for the
intact sample and 25 µm for the thin sections using a solid-state energy dispersive X-ray
detector that allowed simultaneous detection of fluorescence signals from multiple
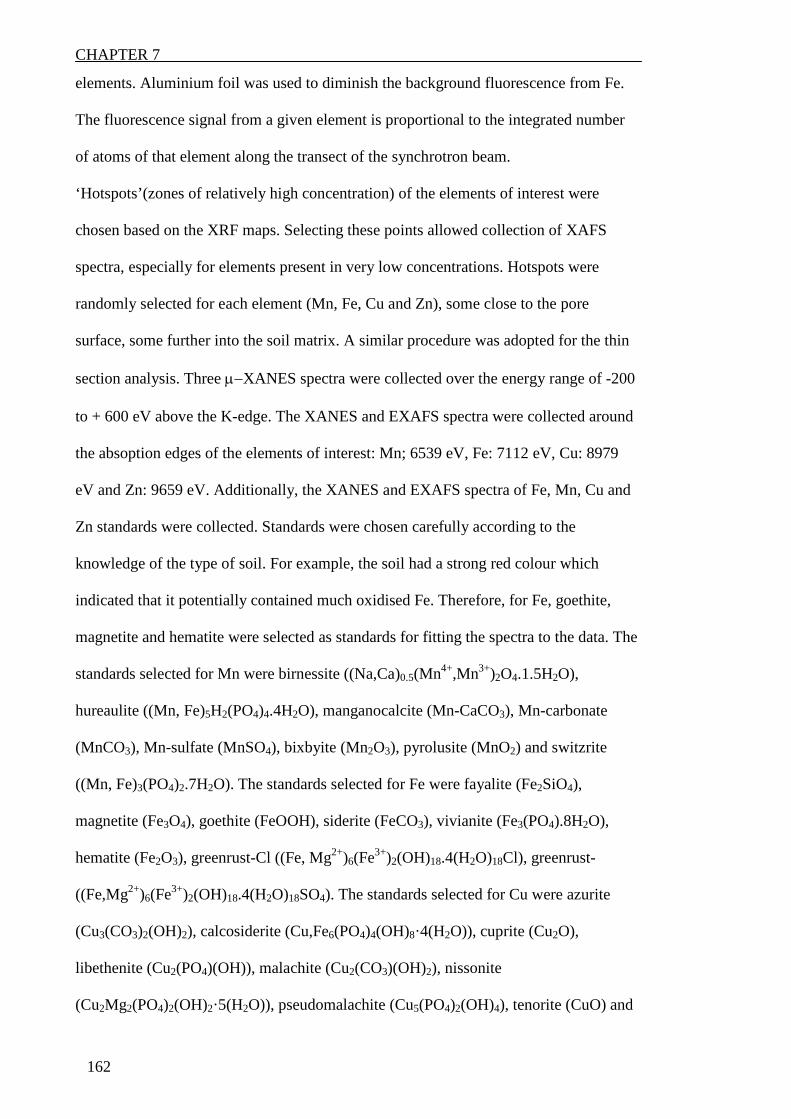
CHAPTER 7
162
elements. Aluminium foil was used to diminish the background fluorescence from Fe.
The fluorescence signal from a given element is proportional to the integrated number
of atoms of that element along the transect of the synchrotron beam.
‘Hotspots’(zones of relatively high concentration) of the elements of interest were
chosen based on the XRF maps. Selecting these points allowed collection of XAFS
spectra, especially for elements present in very low concentrations. Hotspots were
randomly selected for each element (Mn, Fe, Cu and Zn), some close to the pore
surface, some further into the soil matrix. A similar procedure was adopted for the thin
section analysis. Three µ−XANES spectra were collected over the energy range of -200
to + 600 eV above the K-edge. The XANES and EXAFS spectra were collected around
the absoption edges of the elements of interest: Mn; 6539 eV, Fe: 7112 eV, Cu: 8979
eV and Zn: 9659 eV. Additionally, the XANES and EXAFS spectra of Fe, Mn, Cu and
Zn standards were collected. Standards were chosen carefully according to the
knowledge of the type of soil. For example, the soil had a strong red colour which
indicated that it potentially contained much oxidised Fe. Therefore, for Fe, goethite,
magnetite and hematite were selected as standards for fitting the spectra to the data. The
standards selected for Mn were birnessite ((Na,Ca)0.5(Mn4+,Mn3+)2O4.1.5H2O),
hureaulite ((Mn, Fe)5H2(PO4)4.4H2O), manganocalcite (Mn-CaCO3), Mn-carbonate
(MnCO3), Mn-sulfate (MnSO4), bixbyite (Mn2O3), pyrolusite (MnO2) and switzrite
((Mn, Fe)3(PO4)2.7H2O). The standards selected for Fe were fayalite (Fe2SiO4),
magnetite (Fe3O4), goethite (FeOOH), siderite (FeCO3), vivianite (Fe3(PO4).8H2O),
hematite (Fe2O3), greenrust-Cl ((Fe, Mg2+)6(Fe3+)2(OH)18.4(H2O)18Cl), greenrust-
((Fe,Mg2+)6(Fe3+)2(OH)18.4(H2O)18SO4). The standards selected for Cu were azurite
(Cu3(CO3)2(OH)2), calcosiderite (Cu,Fe6(PO4)4(OH)8·4(H2O)), cuprite (Cu2O),
libethenite (Cu2(PO4)(OH)), malachite (Cu2(CO3)(OH)2), nissonite
(Cu2Mg2(PO4)2(OH)2·5(H2O)), pseudomalachite (Cu5(PO4)2(OH)4), tenorite (CuO) and
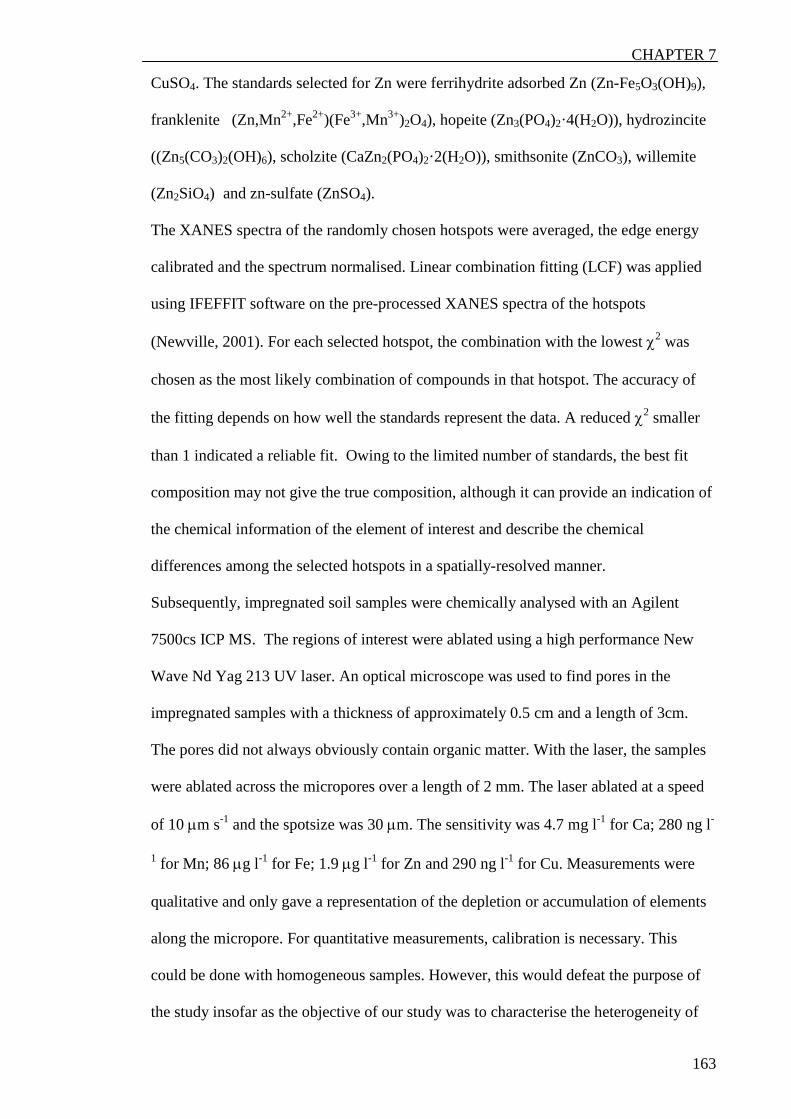
CHAPTER 7
163
CuSO4. The standards selected for Zn were ferrihydrite adsorbed Zn (Zn-Fe5O3(OH)9),
franklenite (Zn,Mn2+,Fe2+)(Fe3+,Mn3+)2O4), hopeite (Zn3(PO4)2·4(H2O)), hydrozincite
((Zn5(CO3)2(OH)6), scholzite (CaZn2(PO4)2·2(H2O)), smithsonite (ZnCO3), willemite
(Zn2SiO4) and zn-sulfate (ZnSO4).
The XANES spectra of the randomly chosen hotspots were averaged, the edge energy
calibrated and the spectrum normalised. Linear combination fitting (LCF) was applied
using IFEFFIT software on the pre-processed XANES spectra of the hotspots
(Newville, 2001). For each selected hotspot, the combination with the lowest χ2 was
chosen as the most likely combination of compounds in that hotspot. The accuracy of
the fitting depends on how well the standards represent the data. A reduced χ2 smaller
than 1 indicated a reliable fit. Owing to the limited number of standards, the best fit
composition may not give the true composition, although it can provide an indication of
the chemical information of the element of interest and describe the chemical
differences among the selected hotspots in a spatially-resolved manner.
Subsequently, impregnated soil samples were chemically analysed with an Agilent
7500cs ICP MS. The regions of interest were ablated using a high performance New
Wave Nd Yag 213 UV laser. An optical microscope was used to find pores in the
impregnated samples with a thickness of approximately 0.5 cm and a length of 3cm.
The pores did not always obviously contain organic matter. With the laser, the samples
were ablated across the micropores over a length of 2 mm. The laser ablated at a speed
of 10 µm s-1 and the spotsize was 30 µm. The sensitivity was 4.7 mg l-1 for Ca; 280 ng l-
1 for Mn; 86 µg l-1 for Fe; 1.9 µg l-1 for Zn and 290 ng l-1 for Cu. Measurements were
qualitative and only gave a representation of the depletion or accumulation of elements
along the micropore. For quantitative measurements, calibration is necessary. This
could be done with homogeneous samples. However, this would defeat the purpose of
the study insofar as the objective of our study was to characterise the heterogeneity of
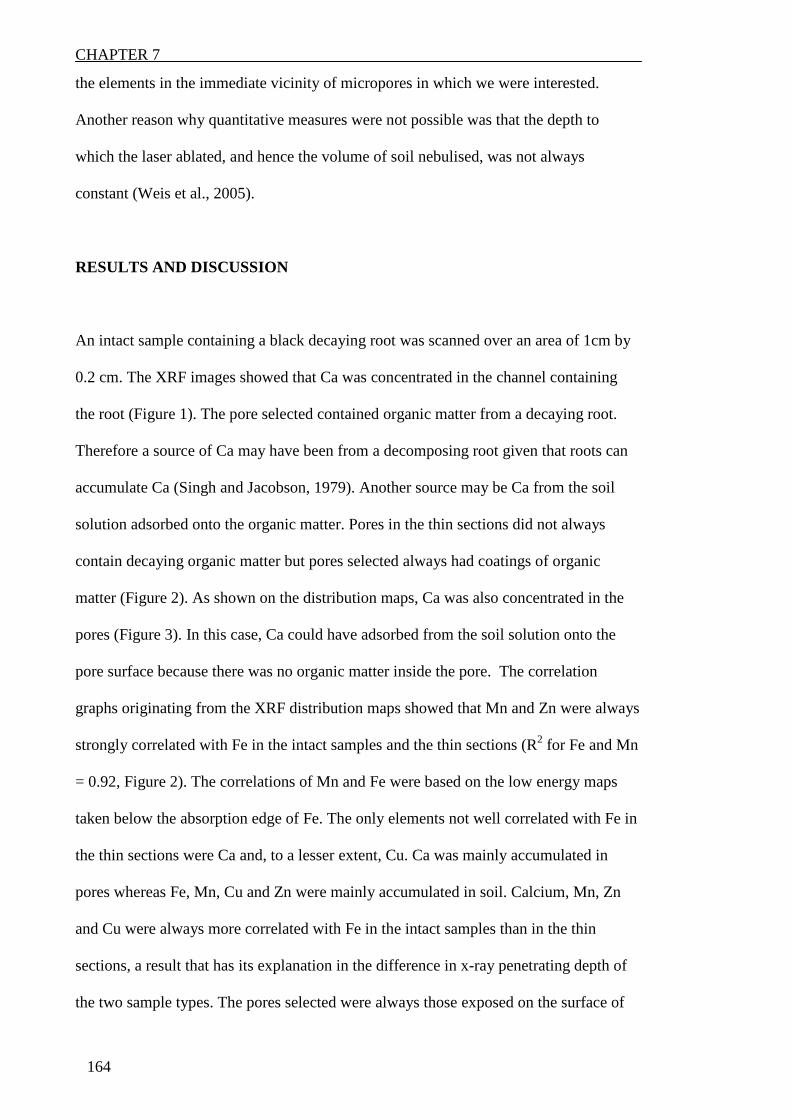
CHAPTER 7
164
the elements in the immediate vicinity of micropores in which we were interested.
Another reason why quantitative measures were not possible was that the depth to
which the laser ablated, and hence the volume of soil nebulised, was not always
constant (Weis et al., 2005).
RESULTS AND DISCUSSION
An intact sample containing a black decaying root was scanned over an area of 1cm by
0.2 cm. The XRF images showed that Ca was concentrated in the channel containing
the root (Figure 1). The pore selected contained organic matter from a decaying root.
Therefore a source of Ca may have been from a decomposing root given that roots can
accumulate Ca (Singh and Jacobson, 1979). Another source may be Ca from the soil
solution adsorbed onto the organic matter. Pores in the thin sections did not always
contain decaying organic matter but pores selected always had coatings of organic
matter (Figure 2). As shown on the distribution maps, Ca was also concentrated in the
pores (Figure 3). In this case, Ca could have adsorbed from the soil solution onto the
pore surface because there was no organic matter inside the pore. The correlation
graphs originating from the XRF distribution maps showed that Mn and Zn were always
strongly correlated with Fe in the intact samples and the thin sections (R2 for Fe and Mn
= 0.92, Figure 2). The correlations of Mn and Fe were based on the low energy maps
taken below the absorption edge of Fe. The only elements not well correlated with Fe in
the thin sections were Ca and, to a lesser extent, Cu. Ca was mainly accumulated in
pores whereas Fe, Mn, Cu and Zn were mainly accumulated in soil. Calcium, Mn, Zn
and Cu were always more correlated with Fe in the intact samples than in the thin
sections, a result that has its explanation in the difference in x-ray penetrating depth of
the two sample types. The pores selected were always those exposed on the surface of

CHAPTER 7
165
the samples. X-rays used in these experiments penetrate to a maximum depth of 50 µm.
Given that intact samples were approximately 10 mm thick spectral information will
have been gathered, not only from the pore surface but also the soil matrix. Because the
soil contains a total Fe concentration of approximately 4 %, a considerable contribution
to the Fe spectral signatures will have come from the matrix. The thickness of the thin
sections was only 20 µm; therefore, the influence of matrix Fe would have been less
significant. Data from hotspots suggested that most of the Mn existed in reduced form
(Table 1). More than 50 % of Mn was associated with phosphate-like bindings that can
also contain reduced Fe (hureaulite and switzerite).The Mn hotspots selected in the
intact samples always had a small fraction bound in oxide-like bindings.

CHAPTER 7
166
Figure 1: Distribution maps of Ca, Mn, Fe, Zn and Cu around a pore obtained by µ-
XRF in an intact sample and the correlation between these elements.
Fe
Ca Mn
Zn Cu
R=0.97 P < 0.0001
R=0.82 P < 0.0001
R=0.93 P < 0.0001
R=0.77 P < 0.0001
1 cm Decaying root
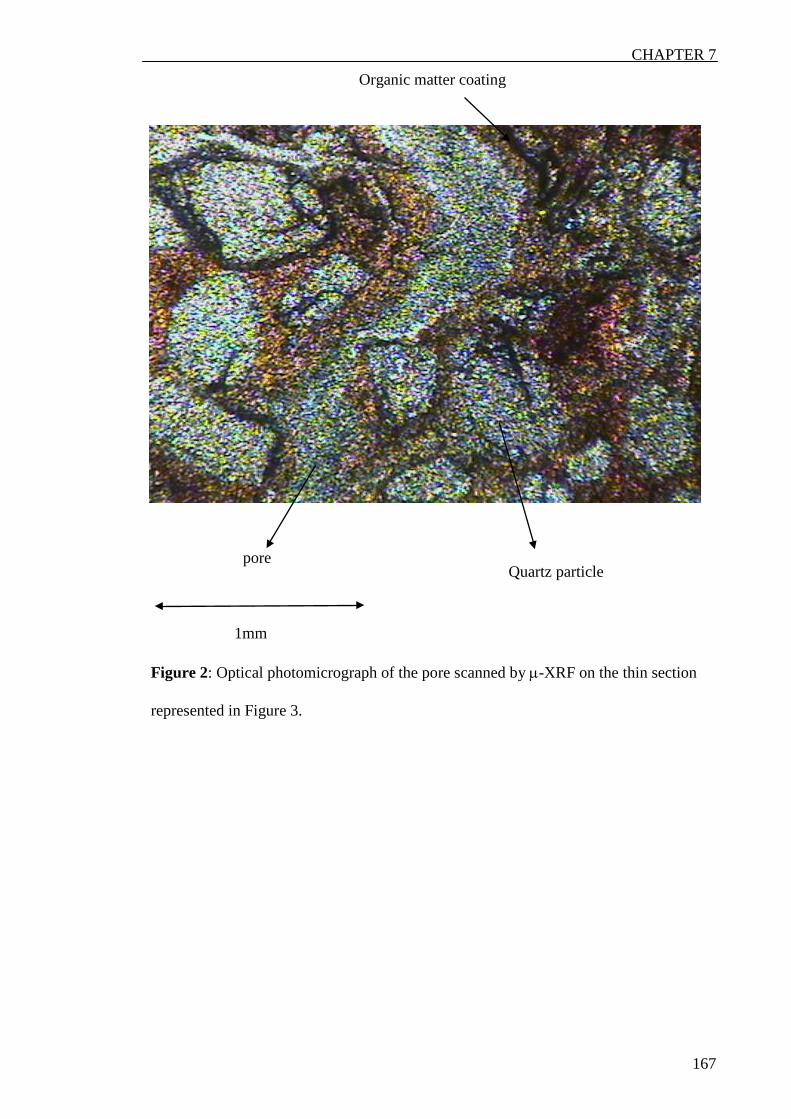
CHAPTER 7
167
Figure 2: Optical photomicrograph of the pore scanned by µ-XRF on the thin section
represented in Figure 3.
pore
Organic matter coating
Quartz particle
1mm

CHAPTER 7
168
Figure 3: Distribution maps of Ca, Mn, Fe, Zn and Cu around a pore by µ-XRF in a
thin section and the correlation of these elements.
Ca
Mn
Fe
Zn
Cu
R=0.32 P<0.0001
R=0.92 P<0.0001
R=0.91 P<0.0001
R=0.73 P<0.0001
2.4 mm
pore

CHAPTER 7
169
birnessite hureaulite switzrite Mn2O3 MnO2 red-c2
close 1 0.00 0.00 0.76 0.24 0.00 0.011
far2 0.11 0.66 0.25 0.00 0.00 0.0183 0.056 0.00 0.58 0.00 0.36 <0.010
close_ts
4 0.00 0.36 0.64 0.00 0.00 <0.010
Table 1: Fractions of Mn species in selected ‘Mn-hotspots’ in the area close and far
from the soil micropore in an intact soil sample and in a thin section.
χ2= Σ [(fit – data)/ε]2 / (Ndata – Ncomponents) is the chi-square statistic. Here ε is the
estimated uncertainty in the normalized XANES data (taken as 0.01 for all data). The
sum is over Ndata points and Ncomponents is the number of components in the fit. The total
fractions were constrained to be 100% in all fits. Typical uncertainties in the fractions
listed for each standard component are 5%.
ts: thin section

CHAPTER 7
170
This small fraction was the only difference found between the thin sections and the
intact samples for Mn. Furthermore, the measurements close to the pore surface did not
differ from the ones further in the soil matrix (Figure 4).
Only a small proportion of Fe in soil is available for plants because of the form in which
the Fe is present in these duplex soils. The three chemical processes affecting Fe
availability to plants are acidification, reduction and chelation (McFarlane, 1999). The
distribution maps showed that there was no enrichment of Fe around the selected pores
(Figure 1 and 3). Iron was distributed randomly throughout the areas chosen for
analysis. The XANES spectra suggested that Fe was mostly present in oxidised form
(Table 2). Oxide-like bindings such as those of goethite and hematite were found in the
hotspots selected in the intact samples and the thin sections. Some spots in the intact
samples seemed to contain greenrust-Cl like and greenrust-sulfate like bindings but
these forms were not found in soil thin sections. In contrast magnetite was always
found in the thin sections (except for one hotspot) but never in the intact samples.
Greenrust ((Fe, Mg2+)6(Fe3+)2(OH)18.4(H2O)18) and magnetite (Fe3O4) both are oxides
with a mixture of oxidised and reduced Fe. The only conclusion that could be made was
that in the selected hotspots, a mixture of oxidised and reduced Fe was present. The
hotspots selected in the thin sections always had a higher proportion of mixed oxidation
forms of Fe compared with hotspots selected on the intact samples. Therefore, it could
not be concluded that the Fe speciation in the intact sample was different from the ones
in the thin sections. The amount of standard used in this type of study is limited. Given
that soil is highly heterogeneous we could not state that the bindings in the hotspots
were exactly the same as the bindings of the standards.
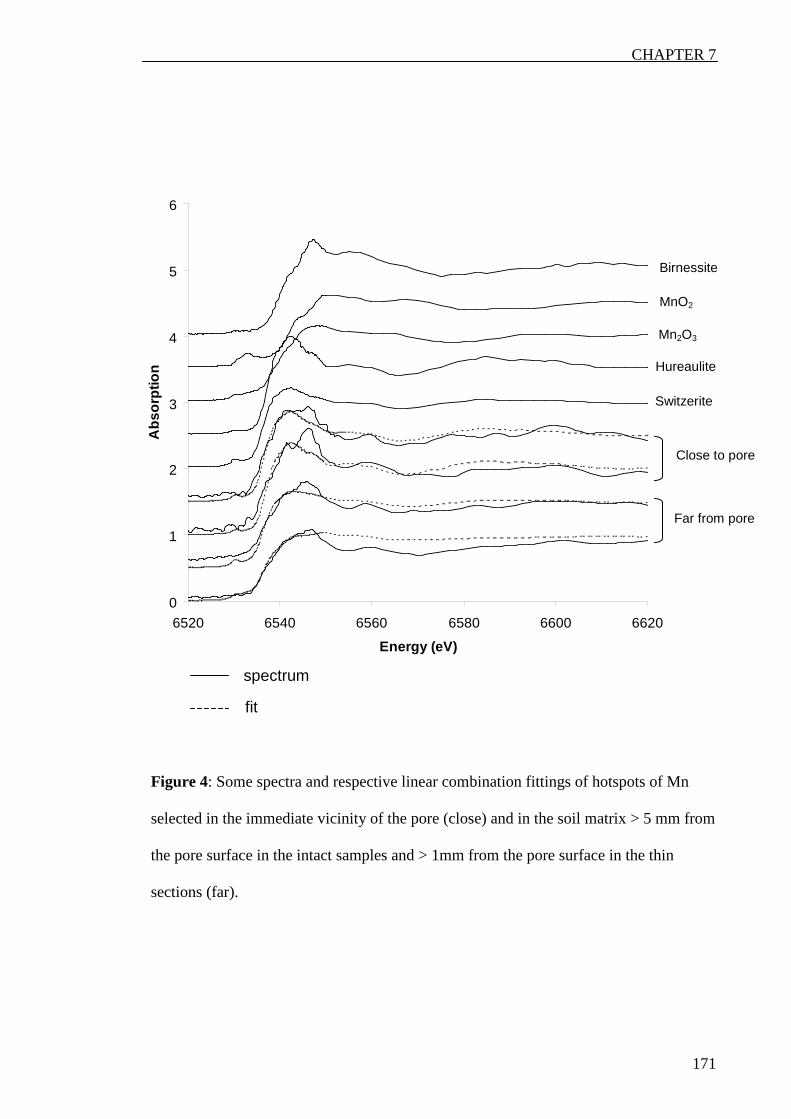
CHAPTER 7
171
Figure 4: Some spectra and respective linear combination fittings of hotspots of Mn
selected in the immediate vicinity of the pore (close) and in the soil matrix > 5 mm from
the pore surface in the intact samples and > 1mm from the pore surface in the thin
sections (far).
fit
spectrum
Far from pore
0
1
2
3
4
5
6
6520 6540 6560 6580 6600 6620
Energy (eV)
Abs
orpt
ion
Close to pore
Switzerite
Hureaulite
Mn2O3
MnO2
Birnessite

CHAPTER 7
172
franklenite hydrozincite zn-sulfate ferrihydrite adsorbed zn willemite smithsonite scholzite red-c2
close1 0.00 0.66 0.00 0.00 0.34 0.00 0.00 0.0352 0.00 0.23 0.00 0.00 0.00 0.77 0.00 0.15
far3 0.00 0.18 0.60 0.00 0.23 0.00 0.00 0.013
close_ts
4 0.00 0.49 0.12 0.00 0.39 0.00 0.00 0.005 0.00 0.34 0.22 0.00 0.44 0.00 0.00 0.006 0.29 0.39 0.17 0.15 0.00 0.00 0.00 0.007 0.00 0.00 0.38 0.10 0.52 0.00 0.00 0.008 0.29 0.00 0.40 0.00 0.00 0.31 0.00 0.00
far_ts9 0.00 0.00 0.51 0.087 0.40 0.00 0.00 0.00
10 0.00 0.49 0.00 0.00 0.16 0.00 0.35 0.01611 0.00 0.00 0.00 0.30 0.70 0.00 0.00 0.064
Table 3: Fractions of Zn species in selected ‘Zn-hotspots’ in the area close and far from
the soil micropore in an intact soil sample and in a thin section.
χ2= Σ [(fit – data)/ε]2 / (Ndata – Ncomponents) is the chi-square statistic. Here ε is the
estimated uncertainty in the normalized XANES data (taken as 0.01 for all data). The
sum is over Ndata points and Ncomponents is the number of components in the fit. The total
fractions were constrained to be 100% in all fits. Typical uncertainties in the fractions
listed for each standard component are 5%.
ts: thin section

CHAPTER 7
173
We concluded that, in all these hotspots, Fe-O like bindings were present and that these
were a mixture of Fe in oxidised and reduced form similar to the ones found in the
standards (Figure 5). In only one hotspot in the thin section was Fe found in a phosphate
binding (vivianite).
Zinc sometimes accumulated around the mesopores but was also present in higher
concentrations away from the pore (Figures 1 and 3). Linear combination fitting of the
XANES and EXAFS region of the absorption spectra showed that the speciation of Zn
for the hotspot at the edge of the pore and further in the soil matrix chosen in the intact
samples were very similar and in forms resembling hydrozincite, Zn-sulphate and
willemite. The same was found for the hotspots selected on the thin sections: zinc was
always found associated with sulphates at the pore surface. Franklenite-like forms were
found at the pore edge whereas Zn adsorbed on ferrihydrite was found in the soil
matrix. Only one instance of smithsonite-like bindings was found and this at the pore
surface. This could be due to the higher CO2 levels inside soil pores that favourise the
formation of carbonates. The one occurrence of scholzite was in the soil matrix (Figure
6). Copper was only present in small amounts in the soil (< 10 ppm in the whole soil
profile). The XRF maps of the thin sections showed that Cu was enriched at the edges
of the areas where Ca was located or in the same areas (Figure 3). These areas of
enrichment were coincident with organic matter coatings. Previous studies have found
that Cu is associated with organic matter (Jacobson et al., 2007). In this study, only two
hotspots in the thin sections could be analysed because of the low concentration of Cu
in the soil. The components resulting from the linear combination fitting were different
for both hotspots. However, both were composed of approximately 70 % carbonate and
30 % phosphate (Table 4).

CHAPTER 7
174
Figure 5: Some spectra and respective linear combination fittings of hotspots of Fe
selected in the immediate vicinity of the pore (close) and in the soil matrix > 5 mm from
the pore surface in the intact samples and > 1mm from the pore surface in the thin
sections (far).
fit
spectrum
0
1
2
3
4
5
6
7080 7100 7120 7140 7160 7180 7200
Energy (eV)
Abs
orpt
ion
Close intact
Close thin section
Far intact
Far thin section
Fe3O4
Goethite
Greenrust-Cl
Greenrust-S
Fe2O4

CHAPTER 7
175
Figure 6: Some spectra and respective linear combination fittings of hotspots of Zn
selected in the immediate vicinity of the pore (close) and in the soil matrix > 5 mm from
the pore surface in the intact samples and > 1mm from the pore surface in the thin
sections (far).
Fit
Spectrum
0
1
2
3
4
5
6
7
9650 9660 9670 9680 9690 9700
Energy (eV)
Abs
orpt
ion
Close intact
Close thin section
Far intact
Far thin section
Ferrihydrite adsorbed Zn
Franklenite
Hydrozincite
Smithsonite
Willemite
Zn-sulfate

CHAPTER 7
176
malachite nissonite azurite calcosiderite red-c2
close_ts1 0.69 0.31 0.00 0.00 19.552 0.00 0.00 0.70 0.30 121.63
Table 4: Fractions of Cu species in selected ‘Cu-hotspots’ in the area close and far from
the soil micropore in a thin section.
χ2= Σ [(fit – data)/ε]2 / (Ndata – Ncomponents) is the chi-square statistic. Here ε is the
estimated uncertainty in the normalized XANES data (taken as 0.01 for all data). The
sum is over Ndata points and Ncomponents is the number of components in the fit. The total
fractions were constrained to be 100% in all fits. Typical uncertainties in the fractions
listed for each standard component are 5%.
ts: thin section

CHAPTER 7
177
Again, this could be due to higher levels of CO2 in and in the vicinity of soil pores,
favouring the formation of carbonates.
The distribution of elements of interest across a section of a micropore in impregnated
samples were measured by LA-ICP-MS and compared with XANES and EXAFS data
of the same section. By looking at the ablating point on the sample on the screen of the
microscope and comparing it with the counts of the elements detected, it was
established that the decrease in counts of siliceum (Si) was a sensitive measure of the
location of the micropore. The point with the lowest counts was the middle of the pore.
In all of the µ-XRF maps Ca was concentrated in the micropores but Ca measured by
LA-ICP-MS was detected in only some of the micropores. The graphs also show that
wherever there was an accumulation of Ca, there was also an accumulation of Fe and
Mn (Figures 7, 8). This is in contradiction with the distribution maps by µ-XRF. The
differences are probably a result of the different volumes of soil material sampled
during measurement: sampling depth for µ-XRF was 50 µm whereas that for LA-ICP-
MS was higher. Because Fe is relatively depleted at the very surface of the micropore,
LA-ICP-MS will detect a greater proportion of Fe than µ-XRF. There was always an
accumulation of Zn and Cu in proximity of the micropore. Measurements from 0 s to 10
s at the beginning of the X-axis could not be accounted as the instrument always needed
period to adjust. Care has to be taken when interpreting results obtained by LA-ICP-
MS. Elemental fractionation depends on characteristics of the sample such as optical
absorption behaviour. In an heterogeneous medium such as soil, this will vary between
samples and therefore, overcoming this problem for matrix independent quantification
becomes a problem (Weis et al., 2005).
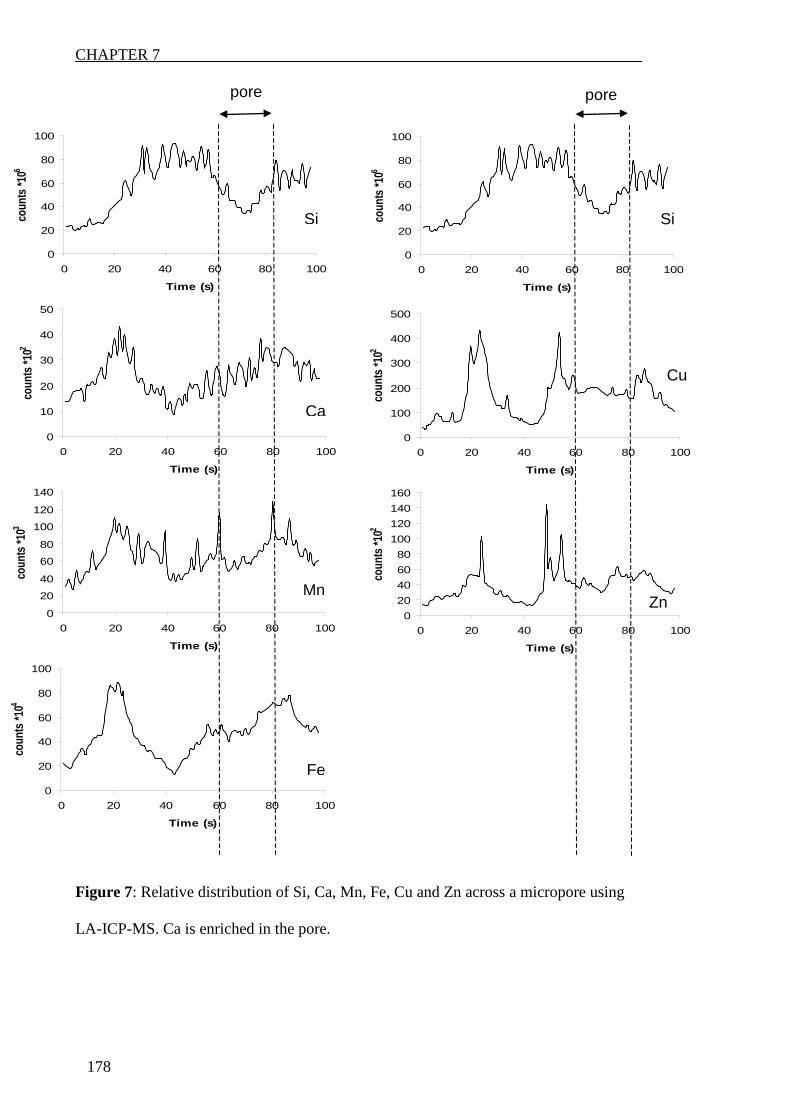
CHAPTER 7
178
0
20
40
60
80
100
0 20 40 60 80 100
Time (s)
coun
ts *1
06
0
10
20
30
40
50
0 20 40 60 80 100
Time (s)
coun
ts *1
02
0
20
40
60
80
100
120
140
0 20 40 60 80 100
Time (s)
coun
ts *1
03
0
20
40
60
80
100
0 20 40 60 80 100
Time (s)
coun
ts *1
04
0
20
40
60
80
100
0 20 40 60 80 100
Time (s)
coun
ts *1
06
0
100
200
300
400
500
0 20 40 60 80 100
Time (s)
coun
ts *1
02
020406080
100120140160
0 20 40 60 80 100
Time (s)
coun
ts *1
02
pore pore
Si Si
Ca
Cu
Mn Zn
Fe
Figure 7: Relative distribution of Si, Ca, Mn, Fe, Cu and Zn across a micropore using
LA-ICP-MS. Ca is enriched in the pore.

CHAPTER 7
179
Figure 8: Relative distribution of Si, Ca, Mn, Fe, Cu and Zn along a line across a
micropore using LA-ICP-MS. Ca is impoverished in the pore.
0
20
40
60
80
100
0 20 40 60 80 100
Time (s)
coun
ts *1
06
01020304050607080
0 20 40 60 80 100
Time (s)
coun
ts *1
02
0
50
100
150
200
250
0 20 40 60 80 100
Time (s)
coun
ts *1
03
0
20
40
60
80
100
120
140
0 20 40 60 80 100
Time (s)
coun
ts *1
04
0
20
40
60
80
100
0 20 40 60 80 100
Time (s)
coun
ts *1
06
0
200
400
600
800
1000
1200
1400
0 20 40 60 80 100
Time (s)co
unts
*102
050
100150200250300350400450
0 20 40 60 80 100
Time (s)
coun
ts *1
02
pore pore
Si
Ca
Fe
Mn
Si
Cu
Zn

CHAPTER 7
180
The high degree of heterogeneity of the elements in the samples and their
inhomogeneous distribution makes it impossible to have precise and accurate results
that allow quantification (Jimenez et al., 2007).
Each micropore created by roots and used by subsequent roots has a different history.
The inhomogeneity in elemental concentration and spatial distribution will be greater at
smaller scale than at larger scale. Rhizosphere chemistry will depend on the type of root
(e.g. root hair, mature root), state of decomposition, extent and diversity of occupancy
of pore, and types of plants. Further complexity arises from transport of particles in
suspension and solutions, a process dependent on a range of factors such as pore size
and pore continuity. Surface analytical techniques such as those employed here have a
significant role to play in refining our understanding of nutrient form, concentration and
availability and how plant roots affect these in space and time.
In this investigation we attempted to study microstructure, in as undisturbed condition
as possible, by using intact soil aggregates and thin sections prepared following vacuum
impregnation with resin. However, many surface sensitive techniques require a flat
surface. Because this chemical analysis is surface sensitive, intact samples cannot be
polished, and when surfaces are flattened, smearing occurs which alters the organisation
of soil particles that could lead to problems when the chemistry of the surface is studied.
Soils of low coherence fragment readily. We attempted to study the chemical nature of
the rhizosphere across the E horizon-B horizon boundary but the samples fragmented
and our study was confined to the upper B horizon.

CHAPTER 7
181
CONCLUSION
Calcium was always concentrated in the pores selected for analysis. There was no
enrichment or depletion of Fe and Mn around the pore surfaces. Iron was mostly
oxidised and in oxide like bindings while Mn was mostly reduced and in phosphate
bindings. Zinc was concentrated around the selected pores but was also found in the soil
matrix in the same amounts. Zinc was mostly associated in bindings with carbonate,
sulphate and silicate. Copper was always found in vicinity of highly concentrated
patches of Ca, probably in association with organic matter.
The difference in micro-spatial chemistry between the thin sections and the intact
samples was attributed to the thickness of the sample analysed. This resulted in Mn, Zn
and Cu having stronger correlations with Fe in the thin sections compared with the
intact samples.
As mentioned in the previous chapter, there are some limitations with the synchrotron
method. The LA-ICP-MS results which do not quite corroborate the other set of data,
addresses this limitation again.
REFERENCES
Adcock, D., A.M. McNeill, G.K. McDonald, and R.D. Armstrong. 2007. Subsoil
constraints to crop production on neutral and alkaline soils in south-eastern
Australia: a review of current knowledge and management strategies. Aust. J.
Exp. Agr. 47:1245-1261.
Bouma, J. 1992. Influences of soil macroporosity on environmental quality, In D. L.
Sparks, ed. Advances in Agronomy. Academic Press, New York.

CHAPTER 7
182
Chittleborough D.J. 1992. Formation and pedology of duplex soils. Aust. J. Exp. Agr.
32:15-25.
Eldridge, D.J., and D. Freudenberger. 2005. Ecosystem wicks: Woodland trees enhance
water infiltration in a fragmented agricultural landscape in eastern Australia.
Aust. J. Ecol. 30:336-347.
Hinsinger, P., C. Plassard, and B. Jaillard. 2006. Rhizosphere: A new frontier for soil
biogeochemistry. J. Geochem. Explor. 88:210-213.
Isaure, M.P., A. Manceau, N. Geoffroy, A. Laboudigue, N. Tamura, and M.A. Marcus.
2005. Zinc mobility and speciation in soil covered by contaminated dredged
sediment using micrometer-scale and bulk-averaging X-ray fluorescence,
absorption and diffraction techniques. Geochim. Cosmochim. Acta 69:1173-
1198.
Isbell, R.F. 1996. The Australian Soil Classification CSIRO, Melbourne.
Jacobson, A.R., S. Dousset, F. Andreux, and P.C. Baveye. 2007. Electron microprobe
and synchrotron X-ray fluorescence mapping of the heterogeneous distribution
of copper in high-copper vineyard soils. Environ. Sci. Technol. 41:6343-6349.
Jimenez, M.S., M.T. Gomez, and J.R. Castillo. 2007. Multi-element analysis of compost
by laser ablation-inductively coupled plasma mass spectrometry. Talanta
72:1141-1148.
Jones, D. L., A. Hodge, Y. Kuzyakov. 2004. Plant and mycorrhizal regulation of
rhizodeposition. 163:459-480.
Manceau, A., M.A. Marcus, N. Tamura, O. Proux, N. Geoffroy, and B. Lanson. 2004.
Natural speciation of Zn at the micrometer scale in a clayey soil using X-ray
fluorescence, absorption, and diffraction. Geochim. Cosmochim. Acta 68:2467-
2483.

CHAPTER 7
183
McCully, M. 2005. The rhizosphere: the key functional unit in plant/soil/microbial
interactions in the field. implications for the understanding of allelopathic
effects., In J. D. Harper, et al., eds. Proceedings of the 4th World Congress on
Allelopathy, "Establishing the Scientific Base". Centre for Rural Social
Research, Charles Sturt University, Waga Waga.
McCully, M.E. 1999. Roots in soil: unearthing the complexities of roots and their
rhizospheres. Annu. Rev. Plant Physiol. Plant Mol. Biol. 50:695-718.
McFarlane, J.D. 1999. Iron. In K.I. Peverill, L.A. Sparrow and D.J. Reuter, eds. "Soil
analysis:an interpretation manual". CSIRO publishing, Collingwood, Australia
Newville, M. 2001. IFEFFIT: interactive XAFS analysis and FEFF fitting. J.
Synchrotron Radiat 8:322-324.
Pankhurst, C.E., A. Pierret, B. Hawke, and J.M. Kirby. 2002. Microbiological and
chemical properties of soil associated with macropores at different depths in a
red-duplex soil in NSW Australia. Plant Soil 238:11-20.
Pierret, A., C.J. Moran, and C.E. Pankhurst. 1999. Differentiation of soil properties
related to the spatial association of wheat roots and soil macropores. Plant Soil
211:51-58.
Singh, C., L. Jacobson. 1979. The accumulation and transport of calcium in Barley
roots. Physiol. Plantarum 45:443-447.
Soil Survey Staff. 1999. Soil Taxonomy. Natural Resources Conservation Service,
Agriculture Handbook 436. USDA. Washington, DC.
Stewart, J.B., C.J. Moran, and J.T. Wood. 1999. Macropore sheath: quantification of
plant root and soil macropore association. Plant Soil 211:59-67.
Strawn, D., H. Doner, M. Zavarin, and S. McHugo. 2002. Microscale investigation into
the geochemistry of arsenic, selenium, and iron in soil developed in pyritic shale
materials. Geoderma 108:237-257.
CHAPTER 7
184
Vannoordwijk, M., M.J. Kooistra, F.R. Boone, B.W. Veen, and D. Schoonderbeek.
1992. Root-Soil Contact of Maize, as Measured by a Thin-Section Technique .1.
Validity of the Method. Plant Soil 139:109-118.
Voegelin, A., F.A. Weber, and R. Kretzschmar. 2007. Distribution and speciation of
arsenic around roots in a contaminated riparian floodplain soil: Micro-XRF
element mapping and EXAFS spectroscopy. Geochim. Cosmochim. Acta
71:5804-5820.
Weis, P., H.P. Beck, and D. Gunther. 2005. Characterizing ablation and aerosol
generation during elemental fractionation on absorption modified lithium
tetraborate glasses using LA-ICP-MS. Anal. Bioanal. Chem. 2005:212-224.
Yunusa, I.A.M., P.M. Mele, M.A. Rab, C.R. Schefe, and C.R. Beverly. 2002. Priming
of soil structural and hydrological properties by native woody species, annual
crops, and a permanent pasture. Aust. J. Soil Res. 40:207-219.

CHAPTER 8
185
Summary and General Discussion
Soils with an abrupt contrast in texture between A (and/orE) horizons and B horizons),
known as duplex soils in Australia, present a challenge to ecologists and agronomists
alike. Ecologically, the challenge is to understand the mechanisms that native plants
have evolved in order to penetrate and grow in the hostile environment of this soil type.
Duplex soils also create a challenge from an agronomic point of view because many
exotic species in particular, such as imported annual crops, lack the adaptations that
native plants might have and do not grow as well on these soils compared to other
places in the world with the same climate but more favourable edaphic conditions
(Rengasamy, 2003). Thus, deeper understanding of the dynamics between root growth
and the soil environment for both native and introduced species will be useful,
particularly for these duplex soils.
Until recently very little was known about the reciprocal influence that root growth and
soil structure have on each other, and about the distribution of nutrients in relation to
soil structure (Hinsinger et al., 2005). Furthermore, most of the information has been
obtained from disturbed situations, caused by invasive and destructive methodologies,
and is therefore not necessarily completely representative of the system. The aim of the
work described by this thesis was to develop and assess mainly non-invasive novel
techniques as a means of studying root-soil interactions, particularly for duplex soils,
and to analyse the information they provide. This information would be additional to
measurements possible by other, more destructive techniques.

CHAPTER 8
186
Use of novel techniques to study root-soil interactions
Non-invasive 3D imaging
First, the use of computer tomography (CT) to characterise porosity in soils in 3D was
explored. Soil is an opaque medium, and therefore, it is difficult to obtain characteristics
of undisturbed or intact pores. However, knowledge of the 3D orientation and
connectivity of pores is crucial in terms of water flow through soil and root growth
(Gregory et al., 2003; Luo et al., 2008; Mooney and Morris, 2008). Recent studies have
illustrated the beneficial use of computer tomography to understand certain processes in
soil that require 3D information (ex. Udawatta et al., 2008; Mooney and Morris, 2008;
Taina et al., 2008) but there is a trade off between the sample size that can be examined
and the resolution obtained (Pierret et al., 2002). For this PhD study, two types of CT
were available, a medical-CT and a micro-CT. The medical-CT was successfully used
to visualise and characterise the macroporosity of large intact cores of duplex soils (50
cm long, 15 cm diameter). These large samples only allowed images to be obtained in
which pores > 1 mm could be resolved. Although this resolution was quite coarse, it
enabled the study of porosity caused by cracks and root growth in unperturbed samples
at a large scale (Chapter 2). Micro-CT allows much finer resolution albeit for much
smaller samples. It has been used by others to investigate soil-microbe processes or
aggregate porosity (Nunan et al., 2006; Blair et al., 2007). In this PhD study micro-CT
was used to visualise and quantify the mesoporosity in a layer of 4 cm across the E/B
boundary of a sodic duplex soil, here called the interface (Chapter 2).
Studies that use CT often highlight the importance of the image methodology when
visualising and quantifying features in 3D, especially the image threshold step, on
which all the other image measurements are dependent (Jassogne et al., 2007; Elliott
and Heck, 2007). In the first component of this thesis (Chapter 2), a global threshold
was used. The limitations of this approach were explained, as was the importance of
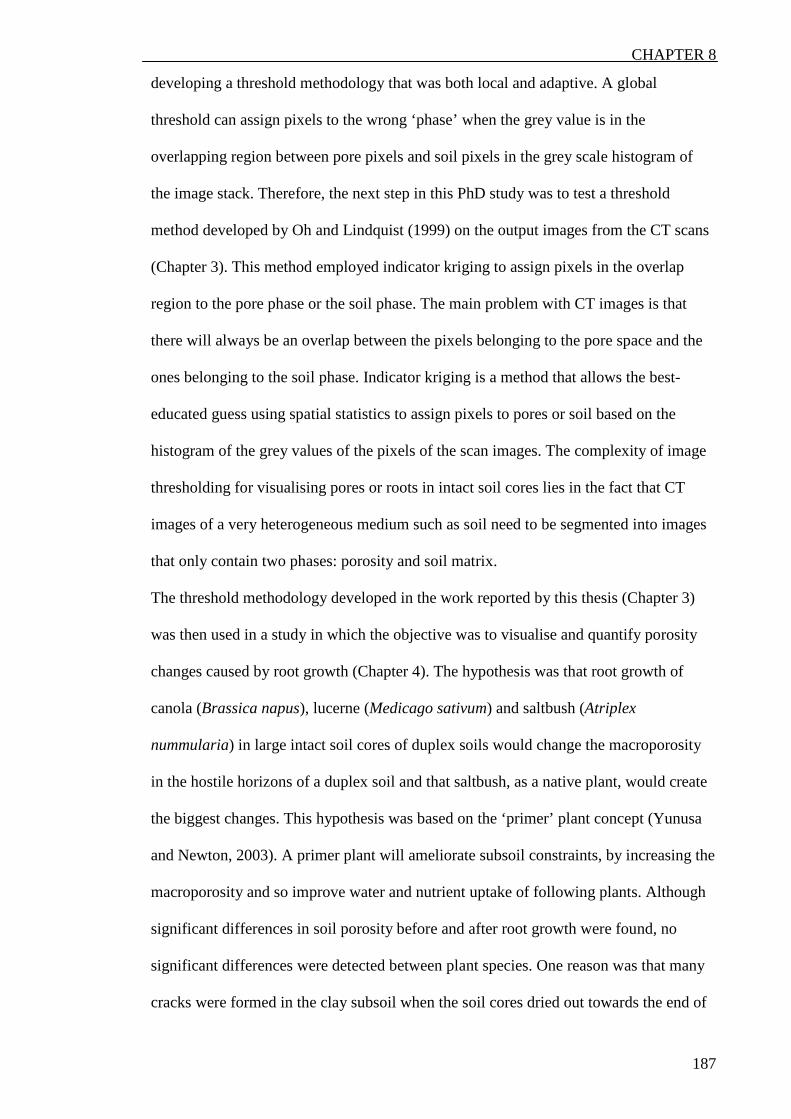
CHAPTER 8
187
developing a threshold methodology that was both local and adaptive. A global
threshold can assign pixels to the wrong ‘phase’ when the grey value is in the
overlapping region between pore pixels and soil pixels in the grey scale histogram of
the image stack. Therefore, the next step in this PhD study was to test a threshold
method developed by Oh and Lindquist (1999) on the output images from the CT scans
(Chapter 3). This method employed indicator kriging to assign pixels in the overlap
region to the pore phase or the soil phase. The main problem with CT images is that
there will always be an overlap between the pixels belonging to the pore space and the
ones belonging to the soil phase. Indicator kriging is a method that allows the best-
educated guess using spatial statistics to assign pixels to pores or soil based on the
histogram of the grey values of the pixels of the scan images. The complexity of image
thresholding for visualising pores or roots in intact soil cores lies in the fact that CT
images of a very heterogeneous medium such as soil need to be segmented into images
that only contain two phases: porosity and soil matrix.
The threshold methodology developed in the work reported by this thesis (Chapter 3)
was then used in a study in which the objective was to visualise and quantify porosity
changes caused by root growth (Chapter 4). The hypothesis was that root growth of
canola (Brassica napus), lucerne (Medicago sativum) and saltbush (Atriplex
nummularia) in large intact soil cores of duplex soils would change the macroporosity
in the hostile horizons of a duplex soil and that saltbush, as a native plant, would create
the biggest changes. This hypothesis was based on the ‘primer’ plant concept (Yunusa
and Newton, 2003). A primer plant will ameliorate subsoil constraints, by increasing the
macroporosity and so improve water and nutrient uptake of following plants. Although
significant differences in soil porosity before and after root growth were found, no
significant differences were detected between plant species. One reason was that many
cracks were formed in the clay subsoil when the soil cores dried out towards the end of
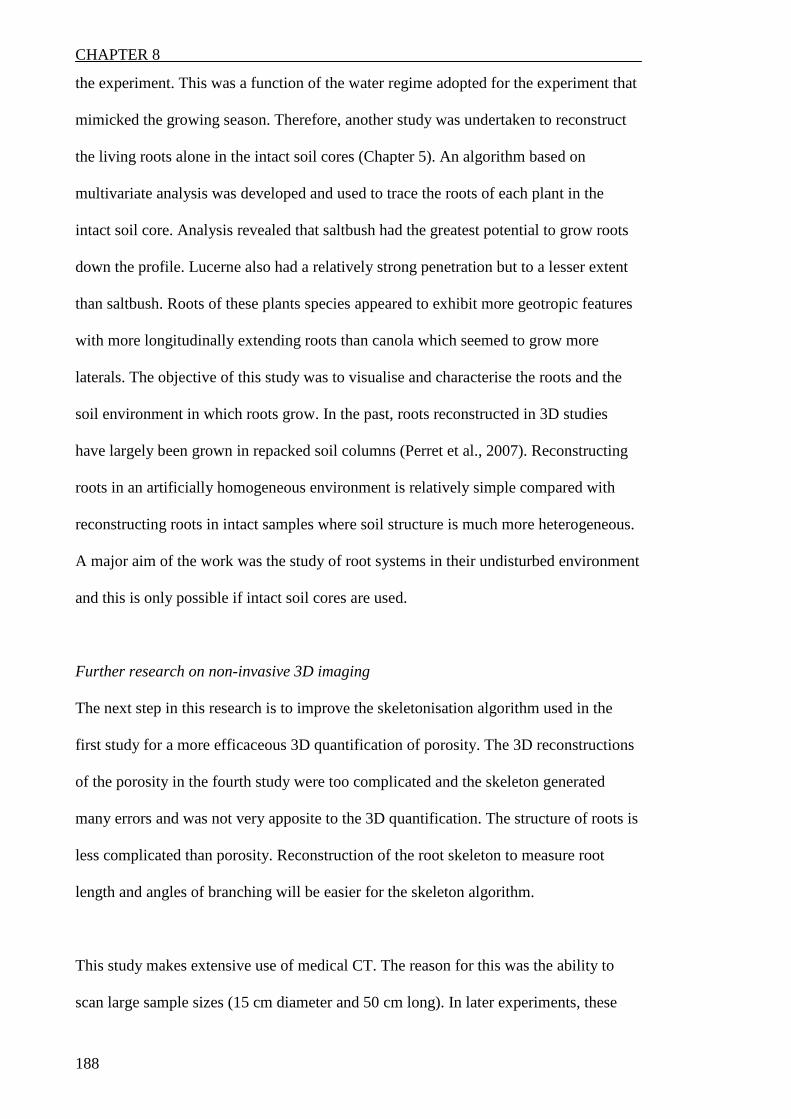
CHAPTER 8
188
the experiment. This was a function of the water regime adopted for the experiment that
mimicked the growing season. Therefore, another study was undertaken to reconstruct
the living roots alone in the intact soil cores (Chapter 5). An algorithm based on
multivariate analysis was developed and used to trace the roots of each plant in the
intact soil core. Analysis revealed that saltbush had the greatest potential to grow roots
down the profile. Lucerne also had a relatively strong penetration but to a lesser extent
than saltbush. Roots of these plants species appeared to exhibit more geotropic features
with more longitudinally extending roots than canola which seemed to grow more
laterals. The objective of this study was to visualise and characterise the roots and the
soil environment in which roots grow. In the past, roots reconstructed in 3D studies
have largely been grown in repacked soil columns (Perret et al., 2007). Reconstructing
roots in an artificially homogeneous environment is relatively simple compared with
reconstructing roots in intact samples where soil structure is much more heterogeneous.
A major aim of the work was the study of root systems in their undisturbed environment
and this is only possible if intact soil cores are used.
Further research on non-invasive 3D imaging
The next step in this research is to improve the skeletonisation algorithm used in the
first study for a more efficaceous 3D quantification of porosity. The 3D reconstructions
of the porosity in the fourth study were too complicated and the skeleton generated
many errors and was not very apposite to the 3D quantification. The structure of roots is
less complicated than porosity. Reconstruction of the root skeleton to measure root
length and angles of branching will be easier for the skeleton algorithm.
This study makes extensive use of medical CT. The reason for this was the ability to
scan large sample sizes (15 cm diameter and 50 cm long). In later experiments, these
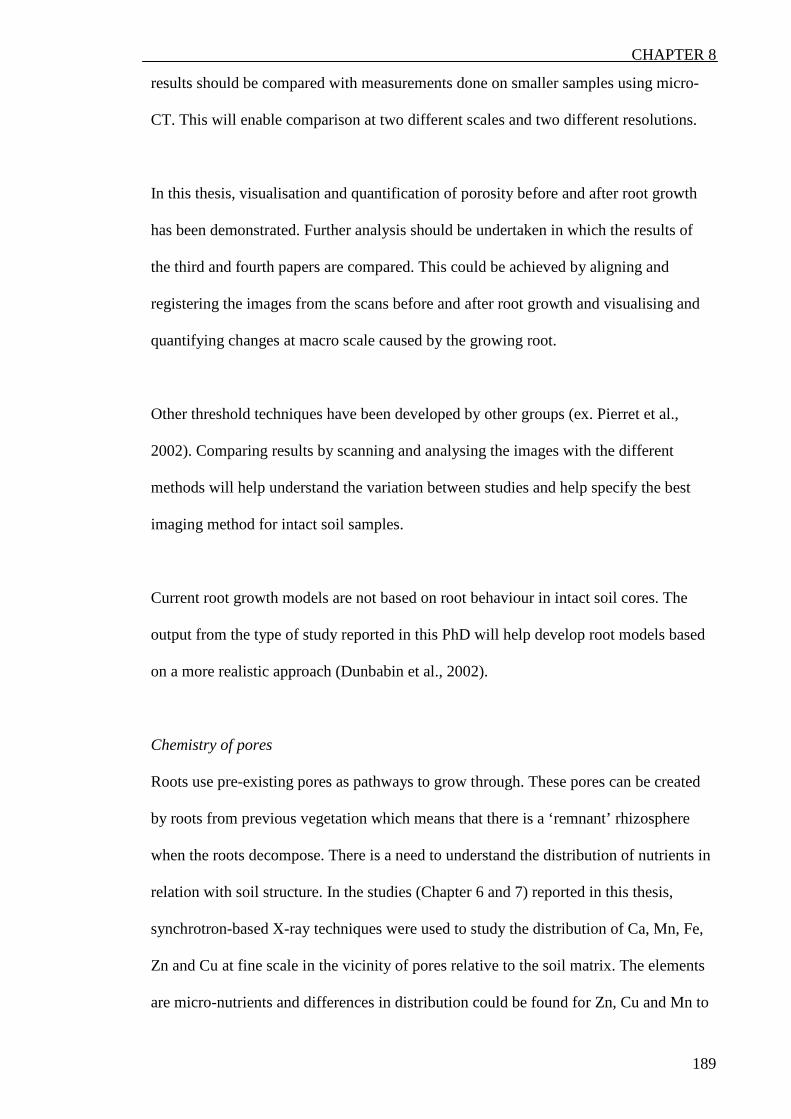
CHAPTER 8
189
results should be compared with measurements done on smaller samples using micro-
CT. This will enable comparison at two different scales and two different resolutions.
In this thesis, visualisation and quantification of porosity before and after root growth
has been demonstrated. Further analysis should be undertaken in which the results of
the third and fourth papers are compared. This could be achieved by aligning and
registering the images from the scans before and after root growth and visualising and
quantifying changes at macro scale caused by the growing root.
Other threshold techniques have been developed by other groups (ex. Pierret et al.,
2002). Comparing results by scanning and analysing the images with the different
methods will help understand the variation between studies and help specify the best
imaging method for intact soil samples.
Current root growth models are not based on root behaviour in intact soil cores. The
output from the type of study reported in this PhD will help develop root models based
on a more realistic approach (Dunbabin et al., 2002).
Chemistry of pores
Roots use pre-existing pores as pathways to grow through. These pores can be created
by roots from previous vegetation which means that there is a ‘remnant’ rhizosphere
when the roots decompose. There is a need to understand the distribution of nutrients in
relation with soil structure. In the studies (Chapter 6 and 7) reported in this thesis,
synchrotron-based X-ray techniques were used to study the distribution of Ca, Mn, Fe,
Zn and Cu at fine scale in the vicinity of pores relative to the soil matrix. The elements
are micro-nutrients and differences in distribution could be found for Zn, Cu and Mn to
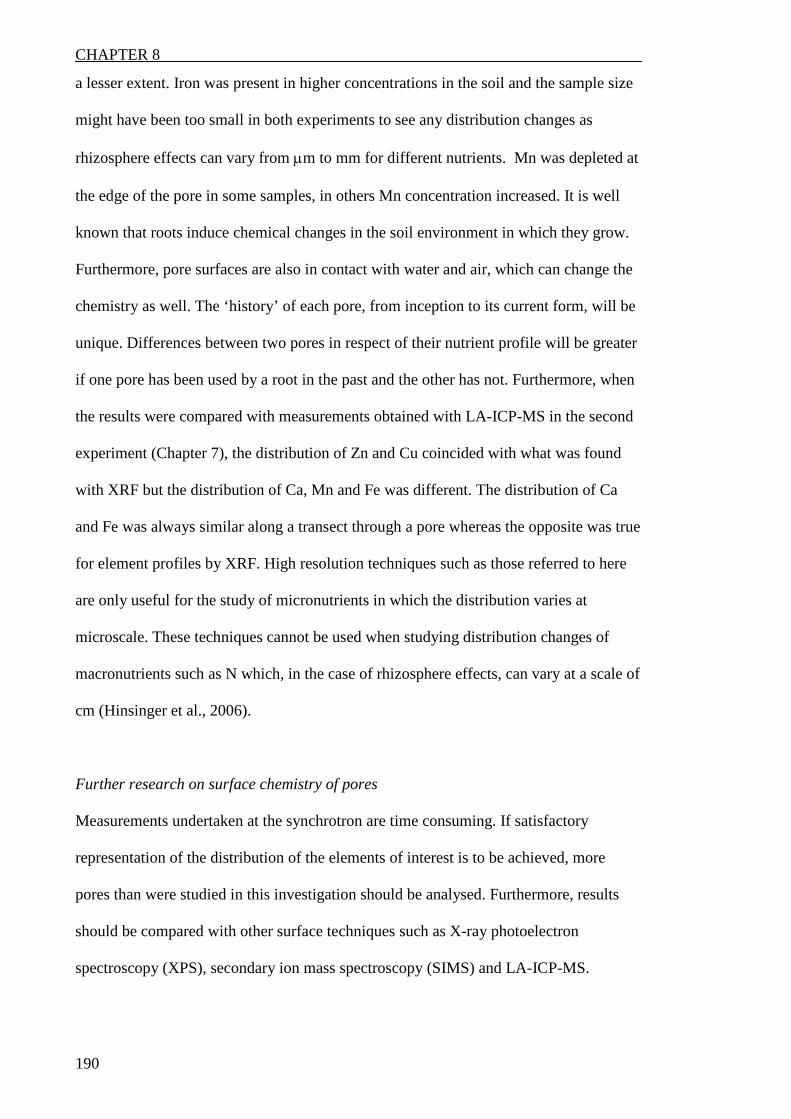
CHAPTER 8
190
a lesser extent. Iron was present in higher concentrations in the soil and the sample size
might have been too small in both experiments to see any distribution changes as
rhizosphere effects can vary from µm to mm for different nutrients. Mn was depleted at
the edge of the pore in some samples, in others Mn concentration increased. It is well
known that roots induce chemical changes in the soil environment in which they grow.
Furthermore, pore surfaces are also in contact with water and air, which can change the
chemistry as well. The ‘history’ of each pore, from inception to its current form, will be
unique. Differences between two pores in respect of their nutrient profile will be greater
if one pore has been used by a root in the past and the other has not. Furthermore, when
the results were compared with measurements obtained with LA-ICP-MS in the second
experiment (Chapter 7), the distribution of Zn and Cu coincided with what was found
with XRF but the distribution of Ca, Mn and Fe was different. The distribution of Ca
and Fe was always similar along a transect through a pore whereas the opposite was true
for element profiles by XRF. High resolution techniques such as those referred to here
are only useful for the study of micronutrients in which the distribution varies at
microscale. These techniques cannot be used when studying distribution changes of
macronutrients such as N which, in the case of rhizosphere effects, can vary at a scale of
cm (Hinsinger et al., 2006).
Further research on surface chemistry of pores
Measurements undertaken at the synchrotron are time consuming. If satisfactory
representation of the distribution of the elements of interest is to be achieved, more
pores than were studied in this investigation should be analysed. Furthermore, results
should be compared with other surface techniques such as X-ray photoelectron
spectroscopy (XPS), secondary ion mass spectroscopy (SIMS) and LA-ICP-MS.

CHAPTER 8
191
Conclusion
This work has clearly shown the efficacy of medical-CT in understanding the
exploratory behaviour of roots in soil, particularly duplex soils which have strong
texture contrast and dense, high strength subsoils. Medical-CT combined with micro-
CT allows multi-scale root dynamic studies insofar as the exploratory behaviour of both
fine and macro-roots can be investigated.
Using medical CT to compare the ability of macroroots of an annual (canola), grassy
perennial (lucerne) and woody perennial (saltbush) to ‘drill’ through the high strength
subsoil of a duplex soil the studies reported in this thesis have shown that saltbush
penetrated deeper and faster. Medical-CT can also be used to quantify macroporosity
but reliable quantification is dependent on more method development. Using high
resolution analytical techniques such as synchrotron- based X-ray methods and LA-
ICP-MS, the distribution and speciation of Ca, Mn, Fe, Cu and Zn were quantified. It
was found that Ca was concentrated in the pores. Manganese was variably depleted or
concentrated in the immediate vicinity of the pores compared to the matrix. Mn
distribution was strongly correlated with that of Fe. Cupper and Zn were accumulated
around the micropores relative to the matrix. The application of high resolution
techniques such as X ray absorption spectroscopy and surface analytical techniques
such as X ray photon spectroscopy to study the impact of root growth on soil and soil on
root growth is in its infancy. Studies such as reported here need to be expanded to
include more elements and the combination of analytical techniques. Only then will the
dynamics between root growth, soil porosity, ‘relict’ rhizospheres and nutrient
distribution be understood.

CHAPTER 8
192
Reference list of general introduction and discussion Adcock D McNeill AM McDonald GK Armstrong RD (2007) Subsoil constraints to
crop production on neutral and alkaline soils in south-eastern Australia: a review
of current knowledge and management strategies. Aust J Exp Agr 47:1245-1261
Amelung W Kaiser K Kammerer G Sauer G (2002) Organic carbon at soil particle
surfaces-Evidence from X-ray photoelectron spectroscopy and surface abrasion.
Soil Sci Soc Am J 66:1526-1530
Bastardie F Capowiez Y Cluzeau D (2005) 3D characterization of earthworm burrow
systems in natural soil cores collected from a 12-year-old pasture. Appl Soil
Ecol 30: 34-46
Blair JM Falconer RE Milne AC Young IM Crawford JW (2007) Modeling three-
dimensional microstructure in heterogeneous media. Soil Sci Soc Am J 71:1807-
1812
Chittleborough D (1992) Formation and pedology of duplex soils. Aust J Exp Agr
32:15-25
Cox JW Fritsch E Fitzpatrick RW (1996) Interpretation of soil features produced by
ancient and modern processes in degraded landscapes .7. Water duration. Aust J
Soil Res 34: 803-824
Dunbabin VM Diggle AJ Rengel Z van Hugten R (2002) Modelling the interactions
between water and nutrient uptake and root growth. Plant Soil 239:19-38
Elliot T Heck R (2007) A comparison of 2D vs. 3D thresholding of X-ray CT imagery.
Can J Soil Sci 87:405-412
Gregory PJ Hutchison DJ Read DB Jenneson PM Gilboy WB Morton EJ (2003) Non-
invasive imaging of roots with high resolution X-ray micro-tomography. Plant
Soil 255, 351-359.

CHAPTER 8
193
Hinsinger P Plassard C Jaillard B (2006) Rhizosphere: A new frontier for soil
biogeochemistry. J Geochem Explor 88:210-213
Hinsinger P Gobran GR Gregory PJ Wenzel WW (2005) Rhizosphere geometry and
heterogeneity arising from root mediated physical and chemical processes. New
Phytol 168: 293-303
Jassogne L McNeill A Chittleborough D (2007) 3D-visualization and analysis of macro-
and meso-porosity of the upper horizons of a sodic, texture-contrast soil. Eur J
Soil Sci 58:589-598
Luo L Lin H Halleck P (2008) Quantifying soil structure and preferential flow in intact
soil using X-ray computed tomography. Soil Sci Soc Am 72:1058-1069
Mooney SJ Morris C (2008) A morphological approach to understanding preferential
flow using image analysis with dye tracers and X-ray Computed Tomography.
Catena 73:204-211
Nunan N Ritz K Rivers M Feeney DS Young IM (2006) Investigating microbial micro-
habitat structure using X-ray computed tomography. Geoderma 133:398-407
Nuttall JG Davies SL Armstrong RA Peoples MB (2008) Testing the primer-plant
concept: wheat yields can be increased on alkaline sodic soils when an effective
primer phase is used. Aust J Agr Res 59: 331-338
Nuttall JG Armstrong RD Connor DJ (2005) The effect of boron tolerance, deep ripping
with gypsum, and water supply on subsoil water extraction of cereals on an
alkaline soil. Aust J Agr Res 56:113-122
Oh W Lindquist B (1999) Image thresholding by Indicator Kriging. IEEE Trans Pattern
Anal Mach Intell 21:590-602
Pannell DJ Ewing MA (2006) Managing secondary dryland salinity: Options and
challenges. Agricult Water Manag 80: 41-56

CHAPTER 8
194
Perret JS Al-Belushi ME Deadman M (2007) Non-destructive visualization and
quantification of roots using computed tomography. Soil Biol Biochem 39(2):
391-399
Peth S Horn R Beckmann F Donath T Fischer J Smucker AJM (2008) Three-
dimensional quantification of intra-aggregate pore-space features using
synchrotron-radiation-based microtomography. Soil Sci Soc Am J 72:897-907
Pierret A Moran CJ Doussan C (2005) Conventional detection methodology is limiting
our ability to understand the roles and functions of the fine roots. New Phytol
166:967-980
Pierret A Doussan C Guarrigues E Mc Kirby J (2003) Observing plant roots in their
environment: current imaging options and specific contribution of two-
dimensional approaches. Agronomie 23:471-479
Pierret A Capiowiez Y Belzunces L Moran CJ (2002) 3D reconstruction and
quantification of macropores using X-ray computed tomography and image
analysis. Geoderma 106:247-271
Rengasamy P (2006) World salinization with emphasis on Australia. J Exp Bot 57:
1017-1023
Rengasamy P Chittleborough D Helyar K (2003) Root-zone constraints and plant-based
solutions for dryland salinity. Plant Soil 257:249-260
Taina IA Heck RJ Elliot TR (2008) Application of X-ray computed tomography to soil
science: A literature review. Can J Soil Sci 88:1-20
Udawatta RP Gantzer CJ Anderson SH Garrett HE (2008) Agroforestry and grass buffer
effects on pore characteristics measured by high-resolution x-ray computed
tomography. Soil Sci Soc Am J 72:295-304
Verboom WH Pate JS (2006) Bioengineering of soil profiles in semiarid ecosystems:
the ‘phytotarium’ concept. A review. Plant Soil 289:71-102

CHAPTER 8
195
Yunusa IAM, Newton P.J. (2003) Plants for amelioration of subsoil constraints and
hydrological control: the primer-plant concept. Plant Soil 257:261-281