SPE-191275-MS Calculating Asphaltenes Precipitation Onset ...
1
Characterisation of Deposited Foulants
and Asphaltenes using Advanced
Vibrational Spectroscopy
Feng Huai Tay
September 2009
Department of Chemical Engineering and Chemical Technology Imperial College London
South Kensington Campus London SW7 2AZ
A thesis submitted to Imperial College London in partial fulfilment of the requirements of the degree of Doctor of Philosophy

2
I would like to dedicate this Thesis to my Parents and also to the rest of my family
who have supported me unconditionally throughout my time during the
undergraduate and PhD study in Imperial College.
“When we long for life without difficulties, remind us that
oaks grow strong in contrary winds and
diamonds are made under pressure.”
-Peter Marshal

PREFACE
- 3 -
PREFACE
This thesis is a description of the work carried out in the Department of Chemical
Engineering, Imperial College London, between October 2006 and September 2009,
under the supervision of Professor Sergei G. Kazarian. Except where acknowledged,
the material is the original work of the author and no part of it has been submitted for
a degree at any other university.
ABSTRACT
- 4 -
ABSTRACT
The magnitude and significance of crude oil fouling have led to a number of studies;
however, the fundamentals of the complex fouling process are not fully understood.
This thesis describes the use of the high chemical specificity, imaging capabilities and
fast acquisition times offered by advanced vibrational spectroscopic techniques to
characterise and understand the physicochemical behaviour of these complex
materials. Rapid and reliable methodologies are developed to provide an important
chemical characterisation tool which will advance research into crude oil fouling.
An emerging and powerful imaging technique based on Fourier transform
infrared (FTIR) spectroscopy is applied for the first time to the characterisation of
deposited foulants and asphaltenes. Attenuated total reflection (ATR)-FTIR
spectroscopic imaging has the advantage of being a non-destructive analytical
technique and most importantly, is able to provide both chemical and spatial
information about a sample. The novel application, of combining macro and micro
ATR modes in FTIR imaging, yields important information about the spatial
distribution of different components in deposited foulants and laboratory-extracted
asphaltenes. Clusters of chemically different compounds in crude oil deposits from
the refinery, such as asphaltenes, carbonates, sulphates, sulfoxides, oxalates and even
“coke-like” materials, were identified and analysed. A lab-made aperture is utilised in
the macro ATR diamond accessory to correct spectral distortions that occur for high
refractive index materials. This approach has been extended to monitor the heating of
crude oil in situ and the onset of asphaltene deposition was determined. Micro ATR-
FTIR imaging of the particulates formed in the crude oil after heating has identified
seven chemically different species, namely, silicates, amides, sulphates, carbonates,
sulfoxides, vitrinite compounds and “coke-like” materials which are products of
different reactions in fouling.
The complementary use of Raman and FTIR spectroscopy has been
demonstrated to characterise the carbon structures in asphaltenes. The ID/IG and IV/IG
parameters derived from the Raman spectra on real deposits showed that it has more
ordered structures compared to petroleum asphaltenes which may be linked to the
ageing effects of the deposit in heat exchangers. The ATR-FTIR spectra of petroleum
asphaltenes suggest that the shape of an average asphaltene is more similar to a wide
continental model than the archipelago model.

ACKNOWLEDGEMENT
- 5 -
ACKNOWLEDGEMENT
This thesis would not have been possible with the support of many. Most importantly, I would like to express my deepest gratitude to Prof. Sergei Kazarian for his guidance and generous support. I particularly appreciate the many opportunities he has given me to nurture my career in the field of research. Without him, my PhD journey would not have been so fruitful and enjoyable. I am indebted to him for being my supervisor, mentor and friend. I would like to thank my collaborating academic, Prof. Geoffery Maitland for the invaluable advice and support he has given me. I am grateful for the colleagues in my research group, especially, Dr. Jean-Michel Andanson, Dr. Andrew Chan, Patrick Wray and James Kimber for the many zealous scientific discussions and the encouragement which have inspired me to strive to the finishing line. Thanks are also due to close friends met in the department: Dr. Lawrence Lau, Dr. Lay Tiong Lim, Dr. Shanning Dong, Dr. Severine Toson, Dr. Francesca Palombo, Dr. Torsten Frosch, Ivan Zadrazil and Roman Zhvansky who have helped me in more ways than one in the last three years. I would like to thank EPSRC, all the academic staff, research associates, PhD students and industrial partners of the CROF project for the support and the exciting involvement in such a large scale project. I would like to acknowledge Prof. Rafael Kandiyoti, Dr. Alan Herod, Dr. Marcos Millan-Agorio, Dr. Trevor Morgan, Dr. Cesar Burrueco, Dr. Patricia Alvarez and Ms. Silvia Venditti for their invaluable guidance and provision of samples. I would like to give my sincere appreciation to Mrs Susi Underwood and her husband John for all their help and support on so many occasions. There are the supporting staff in the department who I am thankful for they have facilitated the smooth progress of my PhD; Anusha Sri-Pathmanathan, Pim Amrit, Keith Walker, Tawanda Nyabango, Chin Lang and Nam Ly. I would like to thank Dr. Paul Turner, Dr. Mustafa Kansiz, Dr Graham Poulter and Keith Jewkes for their technical help and support during my research. Special thanks to my wardening team: Anthony, Lynn, Zara, Joanna, Vannesa, Darryl and Marcus who have been an important part of my life in the last few years. I am grateful for Tiffany, Cintia and Cyrus whose encouragement and excellent culinary skill have nourished me to complete this task. I am also obliged to all my other friends who I am unable to list here for all the good times we shared and the encouragement they have given me. Finally, deepest thanks and gratitude are given to my parents, Tay Kim Chong and Tan Chong Lian, whose unconditional love and constant support have enabled me to persevere towards my goal. I am also highly appreciative of my siblings and their family: High Wide, Chiew Huai and Yan Huai for taking care of the family, their tolerance and most importantly, their belief in me.

TABLE OF CONTENT
- 6 -
TABLE OF CONTENT
PREFACE ................................................................................................................. - 3 - ABSTRACT .............................................................................................................. - 4 - ACKNOWLEDGEMENT ........................................................................................ - 5 - TABLE OF CONTENT ............................................................................................ - 6 - LIST OF FIGURES ................................................................................................ - 10 - LIST OF TABLES .................................................................................................. - 15 - LISTS OF PUBLICATIONS AND CONFERENCES ........................................... - 16 - LIST OF SYMBOLS .............................................................................................. - 18 - LIST OF ABBREVIATIONS ................................................................................. - 19 - 1. General information ........................................................................................ - 21 -
1.1 Background ............................................................................................. - 21 - 1.2 Objectives ............................................................................................... - 24 - 1.3 Outline of thesis ...................................................................................... - 25 -
2 Literature review ............................................................................................. - 28 -
2.1 Mechanisms of fouling ........................................................................... - 28 - 2.2 Fouling and relevance of asphaltenes ..................................................... - 31 -
2.2.1 General chemical structure ............................................................. - 31 - 2.2.2 Molecular weight ............................................................................ - 32 - 2.2.3 Aggregation of asphaltenes ............................................................. - 33 - 2.2.4 Temperature effect .......................................................................... - 35 - 2.2.5 Industrial implications of asphaltene precipitation ......................... - 35 -
2.3 Extraction methods of asphaltenes .......................................................... - 37 - 2.4 Characterisation techniques of asphaltenes and deposited foulants ....... - 39 -
2.4.1 Small angle scattering ..................................................................... - 39 - 2.4.2 Atomic force microscopy ................................................................ - 40 - 2.4.3 Vapour pressure osmometry ........................................................... - 41 - 2.4.4 Size exclusion chromatography ...................................................... - 41 - 2.4.5 Mass spectrometry .......................................................................... - 42 - 2.4.6 Nuclear magnetic resonance ........................................................... - 43 - 2.4.7 Ultraviolet fluorescence spectroscopy ............................................ - 44 - 2.4.8 Fourier transform infrared spectroscopy ......................................... - 45 -
2.5 Introduction to vibrational spectroscopy ................................................ - 48 - 2.5.1 Principles of FTIR spectroscopy ..................................................... - 49 - 2.5.2 Quantitative analysis ....................................................................... - 52 - 2.5.3 Methods of acquisition .................................................................... - 52 -
2.6 FTIR spectroscopic imaging ................................................................... - 56 - 2.6.1 ATR-FTIR imaging ........................................................................ - 56 - 2.6.2 Applications of FTIR imaging in ATR and transmission modes ... - 58 - 2.6.3 Approaches to acquire ATR-FTIR images ..................................... - 59 - 2.6.4 Spatial resolution ............................................................................ - 62 - 2.6.5 Quantitative ATR-FTIR Imaging ................................................... - 64 - 2.6.6 Micro ATR-FTIR imaging .............................................................. - 66 -

TABLE OF CONTENT
- 7 -
2.6.7 Macro ATR-FTIR imaging with a diamond accessory ................... - 67 - 2.6.8 New versus old diamond ATR accessory ....................................... - 68 - 2.6.9 Image processing: univariate and multivariate analysis ................. - 70 -
2.7 Introduction to Raman spectroscopy ...................................................... - 74 - 2.7.1 Raman microscopy.......................................................................... - 75 - 2.7.2 Confocal Raman microscopy .......................................................... - 76 - 2.7.3 Fluorescence ................................................................................... - 77 - 2.7.4 Raman spectroscopy of carbonaceous materials ............................. - 78 -
3 Experimental apparatus and instrumentation .................................................. - 82 -
3.1 FTIR imaging system .............................................................................. - 82 - 3.1.1 Infrared microscope ........................................................................ - 82 - 3.1.2 Large sample compartment ............................................................. - 83 -
3.2 Sampling procedure ................................................................................ - 84 - 3.2.1 Macro ATR approach ..................................................................... - 84 - 3.2.2 Micro ATR approach ...................................................................... - 85 - 3.2.3 Checking contact with “live” IR image .......................................... - 86 -
4 Development of ATR-FTIR imaging approach on carbonaceous materials .. - 88 -
4.1 A variable angle diamond ATR accessory .............................................. - 88 - 4.1.1 Experimental ................................................................................... - 90 -
4.1.1.1 ATR-FTIR imaging...................................................................... - 90 - 4.1.1.2 Lab-made apertures .................................................................... - 91 - 4.1.1.3 Calibration for the angle of incidence ........................................ - 91 - 4.1.1.4 Preparation of samples ............................................................... - 92 -
4.1.2 Results and discussion .................................................................... - 92 - 4.1.3 Conclusion ...................................................................................... - 99 -
4.2 Study of high refractive index petroleum heat-exchanger deposits with ATR-FTIR spectroscopic imaging ........................................................ - 100 -
4.2.1 Introduction ................................................................................... - 100 - 4.2.2 Experimental ................................................................................. - 101 -
4.2.2.1 Samples ..................................................................................... - 101 - 4.2.2.2 ATR-FTIR spectroscopic imaging............................................. - 101 - 4.2.2.3 Sampling technique ................................................................... - 101 -
4.2.3 Results and discussion .................................................................. - 102 - 4.2.3.1 FTIR spectroscopic measurements with a single-element detector ..... ................................................................................................... - 102 - 4.2.3.2 Macro ATR-FTIR imaging ........................................................ - 106 - 4.2.3.3 Micro ATR-FTIR imaging ......................................................... - 111 -
4.2.4 Conclusion .................................................................................... - 114 - 4.3 Comparing crude oil deposits from refinery to laboratory-extracted asphaltenes using ATR-FTIR spectroscopic imaging........................... - 116 -
4.3.1 Introduction ................................................................................... - 116 - 4.3.2 Experimental ................................................................................. - 116 -
4.3.2.1 Samples ..................................................................................... - 116 - 4.3.2.2 ATR-FTIR spectroscopic imaging............................................. - 116 -
4.3.3 Results and discussion .................................................................. - 117 - 4.3.3.1 ATR-FTIR imaging of deposited foulants ................................. - 117 -

TABLE OF CONTENT
- 8 -
4.3.3.2 ATR-FTIR imaging of extracted asphaltenes ............................ - 123 - 4.3.4 Conclusion .................................................................................... - 131 -
4.4 Developing a statistical and particle analysis approach to ATR-FTIR images of crude oil deposits .............................................................................. - 133 -
4.4.1 Introduction ................................................................................... - 133 - 4.4.2 Experimental ................................................................................. - 133 -
4.4.2.1 ATR-FTIR spectroscopic imaging............................................. - 133 - 4.4.2.2 Samples and sampling technique .............................................. - 134 - 4.4.2.3 Image analysis .......................................................................... - 134 -
4.4.3 Results and discussion .................................................................. - 136 - 4.4.4 Conclusion .................................................................................... - 141 -
4.5 Application of ATR-FTIR imaging to study the heating of crude oil .. - 142 - 4.5.1 Introduction ................................................................................... - 142 - 4.5.2 Experimental ................................................................................. - 142 -
4.5.2.1 Samples ..................................................................................... - 142 - 4.5.2.2 In situ heating of crude oil studied with ATR-FTIR imaging .... - 143 - 4.5.2.3 Analysis of crude oil particulates using micro ATR-FTIR imaging .... ................................................................................................... - 144 - 4.5.2.4 Factor analysis of micro ATR-FTIR images ............................. - 144 -
4.5.3 Results and discussion .................................................................. - 144 - 4.5.3.1 In situ studies of heating of crude oil ........................................ - 144 - 4.5.3.2 Micro ATR-FTIR imaging of crude oil after heating ................ - 147 -
4.5.4 Conclusion .................................................................................... - 155 - 5 Sorption of CO2 by ATR-FTIR Spectroscopy .............................................. - 158 -
5.1 Introduction ........................................................................................... - 158 - 5.2 Experimental ......................................................................................... - 158 -
5.2.1 Materials ....................................................................................... - 158 - 5.2.2 Equipment ..................................................................................... - 158 - 5.2.3 Preparation of film ........................................................................ - 161 - 5.2.4 Experimental procedure ................................................................ - 161 -
5.2.4.1 Measurement of the refractive index of asphaltene film ........... - 161 - 5.2.4.2 Measurement of CO2 sorption in asphaltene film ..................... - 162 -
5.3 Results and discussion .......................................................................... - 163 - 5.3.1 Calibrating the angle of incidence of an ATR diamond accessory .......... ....................................................................................................... - 163 - 5.3.2 Measurement of the refractive index of asphaltene film .............. - 164 - 5.3.3 Sorption of CO2 using ATR-FTIR spectroscopy .......................... - 168 -
5.4 Conclusion ............................................................................................ - 176 - 6 Investigating the carbon structures of carbonaceous materials combining Raman and FTIR spectroscopy ................................................................................. - 179 -
6.1 Introduction ........................................................................................... - 179 - 6.2 Experimental ......................................................................................... - 180 -
6.2.1 Samples ......................................................................................... - 180 - 6.2.2 Raman spectroscopy of carbonaceous materials ........................... - 180 - 6.2.3 ATR-FTIR spectroscopy of carbonaceous materials .................... - 181 -
6.3 Results and discussion .......................................................................... - 181 -

TABLE OF CONTENT
- 9 -
6.3.1 Comparing different Raman excitation wavelength ..................... - 181 - 6.3.2 Raman spectra of asphaltenes and deposited foulants .................. - 183 - 6.3.3 Classification of carbonaceous materials using Raman microspectroscopy ........................................................................ - 186 - 6.3.4 ATR-FTIR spectroscopic analysis in 900-700 cm-1 range ........... - 188 - 6.3.5 Conclusion .................................................................................... - 192 -
7 Conclusions and future work ........................................................................ - 195 -
7.1 Conclusions ........................................................................................... - 195 - 7.2 Future work ........................................................................................... - 198 -
REFERENCES ..................................................................................................... - 201 -

LIST OF FIGURES
- 10 -
LIST OF FIGURES
Figure 1-1. A schematic diagram of a typical crude oil distillation unit. Figure 2-1. General multistep chemical reaction fouling mechanism.11 Figure 2-2. A proposed structure of petroleum-derived asphaltenes showing
several characteristic chemical features.27 Figure 2-3. A rosary-type structure proposed for asphaltenes.39 Figure 2-4. Proposed typical chemical structures of asphaltenes.39 Figure 2-5. Different appearances of asphaltenes under different precipitating
conditions.48 Figure 2-6. Regions of the electromagnetic spectrum and their interactions with
matter. Figure 2-7. Schematic diagram of a Michelson interferometer. Figure 2-8. Interferograms obtained for (a) monochromatic radiation and (b)
polychromatic radiation. Figure 2-9. An illustration of how an interferogram is Fourier-transformed to
generate a single beam IR spectrum. Figure 2-10. Spectrum using transmission unit (a) or absorbance unit (b). Figure 2-11. Schematic diagram of transmission FTIR sampling. Figure 2-12. Diagram showing total internal reflection and evanescent wave. Figure 2-13. Schematic diagram showing the exponential decay of the
amplitude of the electric field of the evanescent wave with distance from the boundary of the media.
Figure 2-14. Schematic diagram of the optical arrangement using an inverted ATR prism.
Figure 2-15. Schematic diagram of the diffraction pattern of light. Figure 2-16. ATR-FTIR image of mineral oil measured with a ZnSe ATR
accessory showing the integrated absorbance at 1480-1420 cm-1. The histogram shows the integrated absorbance of each detector pixel.
Figure 2-17. ATR-FTIR image of mineral oil measured with a diamond ATR accessory showing the integrated absorbance at 1480-1420 cm-1. The histogram shows the integrated absorbance of each detector pixel.
Figure 2-18. ATR-FTIR images of a copper grid with a thick film of PDMS pressed behind measured using a) the ordinary and b) the new imaging diamond ATR accessory. c) the white light image of the copper grid measured with a 5× objective.
Figure 2-19. The four steps in the processing workflow of a hyperspectral data cube.
Figure 2-20. Geometric visualisation of principal component analysis.176 Figure 2-21. Schematic energy level diagram illustrating Raman scattering. Figure 2-22. Schematic diagram of the confocal operation in a Raman probe.195 Figure 2-23. Raman spectrum of diamond recorded photographically.199 Figure 2-24. Carbon motions in the a) E2g G mode and b) A1g D breathing
mode.197 Note that the G mode is just due to the relative motion of sp2 carbon atoms and can be found in chains as well.
Figure 2-25 Raman spectra of graphite excited by laser of different energy198 Figure 3-1. Photograph showing the FTIR imaging system. Figure 3-2. Photographs showing a) the IR microscope, b) the micro ATR
objective and c) the Ge ATR crystal.
22 28 32 34 34 37 49 50 50 51 52 53 54 55 62 63 66 66 69 71 72 75 76 78 79 79 82 83
LIST OF FIGURES
- 11 -
Figure 3-3. Photograph showing a) the large sample compartment for macro ATR measurement and b) the Imaging Golden Gate™ accessory which is connected to a heat controller.
Figure 3-4. Photo showing the cell used for compaction of asphaltene. Figure 3-5 Hydraulic piston pump used to create flat surface for micro ATR-
FTIR measurement Figure 3-6 Visible image of asphaltenes surface after compaction by the
hydraulic piston pump Figure 3-7 Calibrated "live" IR image to check contact of sample with ATR
crystal Figure 4-1. Schematic diagram to show the position of the aperture for large and
small angle of incidence set up. Figure 4-2. a) Images of paraffin oil measured with apertures at different
locations of the lenses. Images are generated using the absorption band at 1460 cm-1. Imaging area is ca. 610 μm × 530 μm. b) Averaged spectra of paraffin oil extracted from each imaging measurements.
Figure 4-3. ATR-FTIR images of the PDMS/nickel wire grid with and without the aperture. Images are generated using the absorption band at 1007 cm-1. From the size of the square (64 μm2) and the spacing (12 μm), the imaging area is ca. 610 μm × 530 μm.
Figure 4-4. ATR-FTIR images of PVP (top row) and PDMS (bottom two rows). The band used to generate the image is listed on the left hand side. The angles of incidence used for each measurement are listed at the top of each column.
Figure 4-5. Spectra extracted from the locations indicated with asterisk marks in the images in Figure 4-4. A pure PVP spectrum is also shown in the figure.
Figure 4-6. Schematic diagram showing the IR beam path through (a) the macro ATR and (b) the micro ATR crystal
Figure 4-7. Single-element FTIR spectra of RFD collected using 47° and 56° apertures. (b) and (c) show the distortions of the absorption bands at 3000-2800 cm-1 and 1700-1250 cm-1 respectively
Figure 4-8. Macro ATR-FTIR images of RFD. Images are based on the integration of the absorption band as indicated below each images. The imaging area is ca. 610 μm × 530 μm. Spectrum is extracted from point X of the chemical image above it. The red box in (b) shows the relative size of a micro ATR FTIR imaging measurement.
Figure 4-9. Micro ATR-FTIR images of RFD. Each of the images is from different measurement. Images (a) to (c) are based on the integration of the absorption band as indicated below each images. Image (d) is based on the shift of the absorbance at 1900 cm-1. Spectrum is extracted from point X of the chemical image beside it.
Figure 4-10. Macro ATR-FTIR images of RFD. Figure 4-11. Averaged spectrum of RFD across the macro ATR-FTIR image
obtained in three repeated measurements. Figure 4-12. Micro ATR-FTIR images of RFD. Each of the images corresponds
to the same measurement. Images (a) to (c) are based on the integration of the absorption band as indicated below each image. Spectrum is extracted from point X of the chemical image.
84 85 86 86 86 90 93 95 98 98 102 106 110 114 119119 121
LIST OF FIGURES
- 12 -
Figure 4-13. Micro ATR-FTIR images of RFD. Each of the images corresponds to a different measurement. Images (a) to (e) are based on the integration of the absorption band as indicated at the side of each image. Images (a) and (c) are results from Figure 4-9. Spectrum is extracted from point X of the chemical image beside it.
Figure 4-14. Single-element FTIR spectra of ASP-M collected with and without the use of the 56° aperture.
Figure 4-15. Averaged FTIR spectra of ASP-M, ASP-K and ASP-A. Figure 4-16. Macro ATR-FTIR images of ASP-M. Spectra are extracted from
the location of the image as denoted by the arrow. Figure 4-17. Macro ATR-FTIR images of ASP-A. Figure 4-18. Macro ATR-FTIR images of ASP-K. Figure 4-19. Micro ATR-FTIR images of ASP-M. Figure 4-20. Micro ATR-FTIR images of ASP-A. Figure 4-21. Micro ATR-FTIR images of ASP-K. Figure 4-22. Panel a) shows the distribution of oxalates based on the integrated
absorbance in the range of 1350-1300 cm-1. The accepted domain of interest is surrounded by blue contours. Panel b) shows the spectra extracted from accepted and rejected area of the distribution image from location denoted by the arrows. Panel c) shows the integrated absorbance of each detector pixel. Panel d) is the binary image created with the threshold limit of 0.5-1.5 cm-1 of the distribution image.
Figure 4-23. Panel a) shows the distribution of sulphates based on the integrated absorbance in the range of 1180-1100 cm-1. The accepted domain of interest is surrounded by blue contours. Panel b) shows the spectra extracted from accepted and rejected area of the distribution image from location denoted by the arrows. Panel c) shows the integrated absorbance of each detector pixel. Panel d) is the binary image created with the threshold limit of 0.6-3 cm-1 of the distribution image.
Figure 4-24. Chemical and binary images showing the distribution of oxalate compounds in RFD.
Figure 4-25. Chart showing the percentage area covered of RFD that has oxalate compunds with different number of images analysed.
Figure 4-26. Chart showing the mean equivalent diameter of oxalate compounds on the surface of RFD measured with different number of images analysed.
Figure 4-27. Chemical and binary images showing the distribution of sulphate compounds in RFD.
Figure 4-28. Chart showing the percentage area covered of RFD that has sulphates compounds with different number of images analysed.
Figure 4-29. Chart showing the mean equivalent diameter of sulphates compounds on the surface of RFD measured with different number of images analysed.
Figure 4-30. Schematic diagram of the high temperature cell used. Figure 4-31. ATR-FTIR images of P crude during heating and cooling of the
experiment. Figure 4-32. Averaged spectra of the measured sample before and after the
heating process.
122 125 125126 127128129130131135 136 137 138 138 139 139 140 144146 146

LIST OF FIGURES
- 13 -
Figure 4-33. Visible image of crude oil on BaF2 window after heating. Figure 4-34. a)Visible image and micro FTIR-ATR images of Area 1 showing
the distribution of the integrated absorbance of b) crude oil in the range of 3000-2800 cm-1 and c) particulate in the range of 1145-965 cm-1. Spectra representing the d) crude oil and e) particulate are presented.
Figure 4-35. a)Visible image and b)micro FTIR-ATR image of Area 2 showing the distribution of “coke-like” material based on the shift in the baseline absorbance at 1900 cm-1. A spectrum from this particulate is shown in panel c).
Figure 4-36. a)Visible image and micro FTIR-ATR images of Area 3 showing the distribution of the integrated absorbance of b) amides and c) sulfoxides in the range of 1700-1600 cm-1 and 1200-910 cm-1 respectively. Spectra representing the d) amides and e) sulfoxides are presented.
Figure 4-37. a)Visible image and micro FTIR-ATR images of Area 4 showing the distribution of the integrated absorbance of b) amides and c) carbonates, d) sulphates and vitrinite compounds in the range of 1700-1600 cm-1, 1500-1350 cm-1 and 1175-960 cm-1 respectively.
Figure 4-38. The image scores and its respective loading plot of the factors from the analysis of micro ATR-FTIR image of Area 4. a) Factor 1, b) Factor 2, c) Factor 3, d) Factor 5 and e) Factor 8.
Figure 4-39. Seven chemically different components are mapped onto the visible image of Crude-P after the heating process.
Figure 5-1. Schematic diagram of high pressure cell equipped on diamond ATR accessory.
Figure 5-2. Omni-Cell used in transmission measurement to calibrate the average angle of incidence of the ATR accessory.
Figure 5-3. Transmission and ATR-FTIR spectra of PEG 600. Figure 5-4. Schematic diagram showing the area of the AFM measurement. Figure 5-5. AFM image and extracted height profile showing the thickness the
asphaltene film. Figure 5-6. Plot of effective path length against IR absorbance height at 2920
cm-1 for the asphaltene film. Figure 5-7. ATR-FTIR spectra of asphaltene film at different pressure of CO2. Figure 5-8. ATR-FTIR spectra of asphaltene film in the 3100-2650 cm-1 range
showing the swelling effect after exposure to CO2. Figure 5-9. Percentage of swelling of asphaltene film as a function of CO2
pressure at 35 °C. Figure 5-10. ATR-FTIR spectra showing the evolution of CO2 bands with
increasing pressure. Figure 5-11. Sorption of CO2 in asphaltene film in mmol.g-1 and % mass of CO2
at 35 °C. Figure 5-12. Sorption of CO2 obtained from the ATR-FTIR method at 35 °C
compared with literature data240 at different density of CO2. Figure 5-13. ATR-FTIR spectra of asphaltene film showing the blue-shift of
νas(CH2) band subjected to CO2. Figure 5-14. Comparison of spectra of asphaltene film before and after exposure
of sample to high-pressure (75 bar) CO2.
148149 150 151 153 154 155 160 160 164165166 167 169170 170 171 172 172 173 174

LIST OF FIGURES
- 14 -
Figure 5-15. Subtracted spectrum of asphaltene film after the addition of solvents. The subtracted spectra, red and blue, are not normalised shifted along the y-axis for easy comparison.
Figure 6-1. The effect of excitation wavelength (1064 nm, 785 nm and 514.5 nm) on the Raman spectrum of ASP-K.
Figure 6-2. Baseline corrected Raman spectra of ASP-M, ASP-K and ASP-P using the 514.5 nm excitation.
Figure 6-3. Chart showing the ID/IG and IV/IG ratio of different asphaltenes. Figure 6-4. Raman spectra measured across the surface of RFD. M1 to M11 are
randomly selected locations of a 1 cm × 1 cm sampled area of RFD. Figure 6-5. Baseline corrected Raman spectra of different carbonaceous
materials. The spectra were normalised to their respective G band. Figure 6-6. Chart showing the variation of the ID/IG and IV/IG ratio for the
different carbonaceous materials. Figure 6-7. ID/IG vs IV/IG s mapping of different carbonaceous materials. Figure 6-8. ATR-FTIR spectra of RFD, ASP-M, ASP-K, ASP-P, ASP-O and
P-ASP. Figure 6-9. ATR-FTIR spectra of C-900, C-1300 and C-1500. Figure 6-10. The percentage of different aromatic C-H out-of-plane deformation
bands in asphaltenes. Figure 6-11. Schematic diagram, adapted from the work Bauschlicher and co-
workers259, showing how the different aromatic C-H deformation bands affect the shape of the PAH molecule.
174 182 184 184185 187 187 188190 191191 192

LIST OF TABLES
- 15 -
LIST OF TABLES Table 2-1. Summary of capabilities of different ATR-FTIR imaging approaches. Table 2-2. Statistical summary of the integral absorbance of mineral oil at the
1480-1420 cm-1 band. Table 4-1. Summary of the angles of incidence estimated when different
aperture positions on the lenses was used Table 4-2. Elemental analysis of Crude-P and ASP-P in weight percentage. Table 5-1. Calculation of the angle of incidence of the diamond ATR accessory. Table 5-2. Calculation of the refractive index of asphaltene film.
57 66 94 143164168
LISTS OF PUBLICATIONS AND CONFERENCES
- 16 -
LISTS OF PUBLICATIONS AND CONFERENCES
The results presented in this thesis are described in the following publications:
1. Tay, F. H.; Kazarian, S. G., Study of petroleum heat-exchanger deposits with
ATR-FTIR spectroscopic imaging. Energy & Fuels 2009, 23, 4059-4067.
2. Chan, K. L. A.; Tay, F. H.; Poulter, G.; Kazarian, S. G., Chemical imaging
with variable angles of incidence using a diamond attenuated total reflection
accessory. Applied Spectroscopy 2008, 62, (10), 1102-1107.
3. Kazarian, S. G.; Chan, K. L. A.; Tay, F. H., ATR-FTIR imaging for
pharmaceutical and polymeric materials: from micro to macro approaches. In
Infrared and Raman spectroscopic imaging, Salzer, R.; Siesler, H. W., Eds.
Wiley VCH: Weinhiem, 2008, 347-376.
Other publications:
4. Dehghani, F.; Annabi, N.; Valtchev, P.; Mithieux, S. M.; Weiss, A. S.;
Kazarian, S. G.; Tay, F. H., Effect of dense gas CO2 on the coacervation of
elastin. Biomacromolecules 2008, 9, (4), 1100-1105.
5. de Sousa, A. R. S.; Silva, R.; Tay, F. H.; Simplicio, A. L.; Kazarian, S. G.;
Duarte, C. M. M., Solubility enhancement of trans-chalcone using lipid
carriers and supercritical CO2 processing. Journal of Supercritical Fluids 2009,
48, (2), 120-125.
The work has been selected for the following conference presentations:
1. Study of petroleum heat-exchanger deposits with ATR-FTIR spectroscopic
imaging, Abstracts of the 5th International Conference on Advanced
Vibrational Spectroscopy (Melbourne, Australia), 2009, p.165.
2. A preliminary study of the chemical structure of coal and petroleum derived
asphaltenes, and carbon materials, using FTIR and Raman spectroscopy,

LISTS OF PUBLICATIONS AND CONFERENCES
- 17 -
Abstracts of the European Conference on Coal Research and its Applications
(Cardiff, UK), 2008, p.64.
3. Characterisation of asphaltenes using advanced vibrational spectroscopic
techniques, Abstracts of the International Conference on Raman Spectroscopy
(London, UK), 2008, p.766.
4. Advances in characterising asphaltenes combining macro- and micro- ATR-
FTIR imaging, Abstracts of the Pittsburgh Conference on Analytical
Chemistry and Applied Spectroscopy (New Orleans, USA), 2008, p.430-4.
5. “Characterisation of asphaltenes and deposited foulants using FTIR
spectroscopic imaging”, Abstracts of the Molecular Structure of Heavy Oils
and Coal Liquefaction Products (IFP-Lyon, France), 2007, p.P1.
LIST OF ABBREVIATIONS
- 18 -
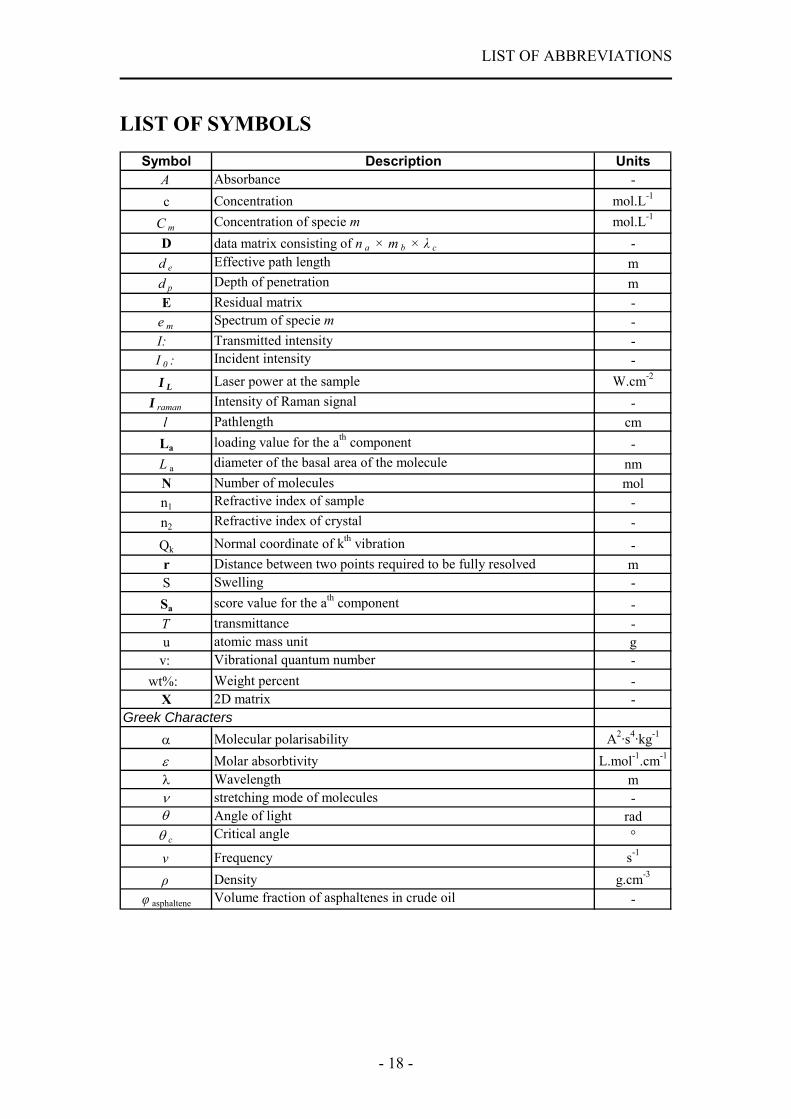
LIST OF SYMBOLS
Symbol Description UnitsA Absorbance -c Concentration mol.L-1
C m Concentration of specie m mol.L-1
D data matrix consisting of n a × m b × λ c -d e Effective path length md p Depth of penetration mE Residual matrix -
e m Spectrum of specie m -I: Transmitted intensity -I 0 : Incident intensity -I L Laser power at the sample W.cm-2
I raman Intensity of Raman signal -l Pathlength cm
La loading value for the ath component -L a diameter of the basal area of the molecule nmN Number of molecules moln1 Refractive index of sample -n2 Refractive index of crystal -
Qk Normal coordinate of kth vibration -r Distance between two points required to be fully resolved mS Swelling -Sa score value for the ath component -T transmittance -u atomic mass unit g
v: Vibrational quantum number -wt%: Weight percent -
X 2D matrix -
α Molecular polarisability A2·s4·kg-1
ε Molar absorbtivity L.mol-1.cm-1
λ Wavelength mν stretching mode of molecules -θ Angle of light radθ c Critical angle °
v Frequency s-1
ρ Density g.cm-3
φ asphaltene Volume fraction of asphaltenes in crude oil -
Greek Characters

LIST OF ABBREVIATIONS
- 19 -
LIST OF ABBREVIATIONS
Abbreviation DescriptionAFM Atomic force microscopya.u. Arbitrary units
ASP-X Petroleum asphaltenes extracted from Crude oil of location XASTM American Soceity for Testing and MaterialsATR Attenuated total reflectionCCD Charge coupled detectorCLS Classical least squareCRM Confocal Raman microscopy
DRIFTS Diffuse reflectance infrared fourier transform spectroscopyDTGS Deuterated triglycine sulfateEPSRC Engineering Physical Science Research Council
FA Factor analysisFOV Field of viewFPA Focal plane array
FT-ICR Fourier-transform ion cyclotron resonanceFTIR Fourier transform InfraredGC Gas chromatographyGe Germanium
HPMC HydroxylpropylmethylcelluloseLB Langmuir BlodgettLC Liquid chromatography
MCT Mercury-Cadmium-TellurideMS Mass spectrometryNA Numerical apertureNIR Near InfraredNMP N-methylpyrrolidonePAH Polycyclic aromatic hydrocarbon
P-ASP Asphaltenes extracted from coal tar pitchPCA Principle components analysis
PDMS PolydimethylsiloxanePEG Poly(ethylene glycol)PET Poly(ethylene terephthalate)PLS Partial least squares
PTFE Polytetrafluoroethylene PVP Poly(vinylpyrrolidone)RFD Real fouling deposits from refinery
SANS Small-angle neutron scatteringSAXS Small-angle X-ray scatteringSEC Size-exclusion chromatographySi Silicon
SNR Signal to noise ratioUV-F Ultraviolet fluorescenceVPO Vapour pressure osmometry

- 20 -
CHAPTER ONE
GENERAL INFORMATION
Chapter 1: General information
- 21 -
1. General information
1.1 Background
The oil and gas industry is one of the most important industries with the global oil
demand projected at 84.4 million barrel per day in 2009.1 The price of crude oil is
projected to stay high because of the increasing global demand especially from fast-
growing developing economies in China and India. On the supply side, uncertainties
due to storm fears, attacks on oil and gas pipelines and refinery shutdowns due to
geopolitical reasons have made this market volatile. In the September 2007 oil market
report from OPEC, higher service costs and the trend of heavier oil field shut-downs
had been listed down as major factors contributing to the uncertainties of the market
fundamentals.2
Crude oil distillation accounts for a large fraction of the energy used in oil refining. It
is a conventional practice for process engineers to recover energy from heated parts of
the plant to parts where heat is required in process units called heat exchangers. A
typical distillation unit is shown in Figure 1-1. Crude oil is normally stored at ambient
conditions and heated to 110-150 °C before entering the desalter where inorganic
ionic species such as chlorides, fluorides, sodium, etc. are removed. Particulate matter
and sludge (sand, corrosion products, etc.) are also removed in the desalter. Crude oil
from the desalter will be heated further to 230-300 °C in the pre-heat train before it
enters the furnace. This heat integration helps to reduce the utility cost of the process
but crude oil is a mixture of substances and some tend to deposit as fouling layers in
the heat exchanger units. This fouling layer, as it builds up, decreases the heat flux
reaching the process stream, thus more energy input is required. In a typical (100 000
barrel.day-1) unit, a loss of only 1 °C in inlet temperature to the furnace equates to 450
kW and would result in a cost of USD$ 40 000 per annum in additional fuel charges.3
Baudelet and Krueger estimated that an increase of furnace inlet temperature of 1 °C
is equivalent to 1 tonne of fuel saved per day.4
In general, fouling in heat exchangers is a major economic problem. Muller-
Steinhagen estimated that the total cost of all heat exchanger fouling in the UK is of
the order of USD$ 2.5 billion and the equivalent cost in America is USD$ 15 billion.5

Chapter 1: General information
- 22 -
Muller-Steinhagen also categorised the total fouling-related costs in four main areas:
energy costs and environmental impact, production costs during shutdowns due to
fouling, capital expenditure and maintenance costs. More fuel (energy) is required for
the furnace to bring the process stream to its desired temperature and the use of more
fuel leads to increases in the CO2 burden of the process. When fouling becomes
serious for a particular batch of crude oil, a partial shutdown or even a full shutdown
of the plant may be needed. This cost is significant but very difficult to estimate.
Capital expenditure includes the cost of the “over designing” of the process plant,
taking into account of the excess area, extra space, foundation, etc. of the units.
Finally the maintenance costs involved are operating costs such as extra manpower
and anti-fouling devices to keep the process running.
Figure 1-1. A schematic diagram of a typical crude oil distillation unit.
The most serious cases of fouling can be found upstream of the desalter and in the
exchangers immediately upstream of the furnace. The main fouling mechanisms of
the heat exchanger unit before the desalter are usually crystallisation fouling and
particulate fouling due to solids and salt deposition. Crude oil becomes hotter as it
flows through the pre-heat train so chemical fouling becomes more significant.
Epstein defined chemical reaction fouling as the formation of deposits at the heat

Chapter 1: General information
- 23 -
transfer surface by chemical reaction, in which the surface itself is not a reactant.6 It
was originally thought that the formation of polymeric materials in crude oil was an
important factor in fouling but the change in concentration of these materials is small
compared to the concentration of the materials entering the heat exchangers. Thus the
formation process of such polymeric materials is not dominant. The magnitude and
significance of crude oil fouling have led to a number of studies but the fundamentals
of the complex fouling process are not fully understood.7-9 Asphaltenes have been
closely linked and related to level of fouling in heat exchangers. These materials are
typically complex mixtures with high contents of polycyclic aromatic hydrocarbons
(PAHs) and with high heteroatom content (N, O and S). Asphaltene deposition is a
well known problem in many aspects of the oil industry, namely, oil production,
transportation, processing and storage. Despite the large amount of research that has
been carried out, the complex behaviour of such materials is still not well understood.
The recent emergence of attenuated total reflection-Fourier transform infrared (ATR-
FTIR) imaging has permitted the study of heterogeneous systems through providing
both chemical and spatial information about the sample. This powerful material
characterisation method with a diamond crystal has allowed the dynamic study of
samples at high pressure and temperature conditions. However, the potential of FTIR
imaging in the analysis of crude oil fouling is still unexplored. Raman spectroscopy, a
complementary technique to FTIR spectroscopy, has been readily applied to study the
structures of different carbons but its applications to deposited foulants and
asphaltenes are few.
Due to the importance and complex nature of the subject, a joint project10, funded by
Engineering and Physical Science Research Council (EPSRC), between Imperial
College London, University of Bath, University of Cambridge and IHS ESDU is to
bring together a wide range of skills and backgrounds needed to address this problem
in new ways. This project is divided into eight sub-projects, each tackling in depth in
its focus but coordinating closely with each other, aimed ultimately to have a
fundamental and integrated study that addresses the basics of the problem. This work
carried out in this thesis is part of sub-project A, addressing the chemical
characterisation of deposits and the characterisation of the fouling process under
controlled conditions.
Chapter 1: General information
- 24 -
1.2 Objectives
The main objective of this thesis is to develop applications of advanced vibrational
spectroscopic methods such as ATR-FTIR imaging and Raman microspectroscopy for
enhanced chemical characterisation of the deposits from crude oil in heat exchangers.
Chemical and spatial information from these advanced spectroscopic techniques can
provide new insight into the processes of fouling.
As this is the first application of ATR-FTIR imaging to study these complex materials,
the feasibility and the reliability of the technique have to be established. There are two
main approaches (micro and macro) that will be explored in applications of ATR-
FTIR imaging to deposited foulants and asphaltenes.
The flexibility offered by macro ATR-FTIR imaging with a diamond crystal provides
a large range of investigative opportunities such as facilitating the study of crude oil
systems at high temperatures and pressures.
The specific objectives of the research are laid out as follows:
I. First, experimental approaches will be developed and protocols will be
established for studying deposited foulants and asphaltenes with ATR-FTIR
imaging. The reproducibility and reliability of these approaches are to be
validated so that accurate interpretation of the spectroscopic data can be
achieved. The opportunities and limitations afforded by the different ATR
approaches will be explored.
II. The application of combining macro and micro ATR modes in FTIR imaging to
characterise real deposited foulants and asphaltenes extracted from crude oil to
establish the link between asphaltenes and fouling in heat exchangers. Macro
ATR-FTIR imaging provides a relatively larger measured field of view to obtain
the overall distribution of different components within the sample where as
micro ATR-FTIR imaging, although measuring a smaller area, has the
advantage of a higher spatial resolution. In crude oil and asphaltene systems,
there is a huge diversity of chemical substances. Multivariate analytical tools

Chapter 1: General information
- 25 -
will be applied to the FTIR images to extract more refined spectroscopic
information from heterogeneous systems with overlapping spectral bands.
III. The feasibility of studying crude oil and asphaltene systems at high temperature
and pressure conditions using the ATR-FTIR spectroscopy with the diamond
ATR accessory will be assessed. Two opportunities will be explored:
• Investigate the heating of crude oil in situ using ATR-FTIR imaging to
monitor the chemical transformation during the deposition process.
• The effects of temperature and pressure are relevant to understanding
and predicting asphaltene stability in crude oil. In order to assess the
suitability of ATR-FTIR spectroscopy to study the phase behaviour of
asphaltenes in complex crude oil systems, an asphaltene and CO2
system is first investigated because of its relevance to the use of high-
pressure CO2 for enhanced oil recovery and CO2 storage.
IV. The viability of Raman spectroscopy to characterise the carbon structures of
deposited foulants and asphaltenes will also be investigated. Different order
classes of other carbonaceous materials will be compared to rapidly classify the
different carbon structures so as to build up a methodology to study the effects
of ageing on deposits and asphaltenes.
In summary, the aim of this study is to improve the understanding of crude oil
fouling in heat exchangers by providing information obtained from advanced
vibrational spectroscopic methods.
1.3 Outline of thesis
This thesis demonstrates the application of two advanced vibrational spectroscopic
techniques, ATR-FTIR imaging and Raman microspectroscopy, to the study of crude
oil fouling. Chapter 2 serves as a literature review to introduce the background
knowledge required for this study. This covers the mechanisms of fouling and the
relevance of asphaltenes to this problem, a brief review of various analytical
techniques used in the characterisation of related materials and the advanced
spectroscopic methods employed throughout this research. Chapter 3 provides a

Chapter 1: General information
- 26 -
general description of the instrumentation used and the sampling protocols applied to
the experiments.
Chapter 4 is the core of the thesis where the development of the application of ATR-
FTIR spectroscopic imaging to crude oil deposits and asphaltenes is detailed. This
chapter is sectioned into 5 parts. First, the development of a movable aperture to
control the average angle of incidence of the macro diamond ATR accessory is
described. The second section investigates the application of macro and micro ATR-
FTIR imaging to real deposits from a refinery. This imaging methodology is extended
to characterise laboratory extracted asphaltenes and this is presented in the third
section. The fourth section of this chapter introduces a statistical testing method
developed to determine how many chemical images of a sample need to be analysed
before representative parameters for particle analysis can be obtained. The last section
demonstrates the application of ATR-FTIR imaging in situ to study the heating of
crude oil. Chapter 5 describes an application of studying asphaltene film exposed to
high pressure CO2 where related asphaltene phenomena can be monitored in situ
using ATR-FTIR spectroscopy. The complementary use of Raman and FTIR
spectroscopy to characterise the carbon structures of the carbonaceous materials is
introduced in Chapter 6. Finally, the thesis is concluded in Chapter 7 with an overall
summary and suggestions for future work as a possible continuation of this research.

- 27 -
CHAPTER TWO
LITERATURE REVIEW
Chapter 2: Literature review
- 28 -
2 Literature review
2.1 Mechanisms of fouling
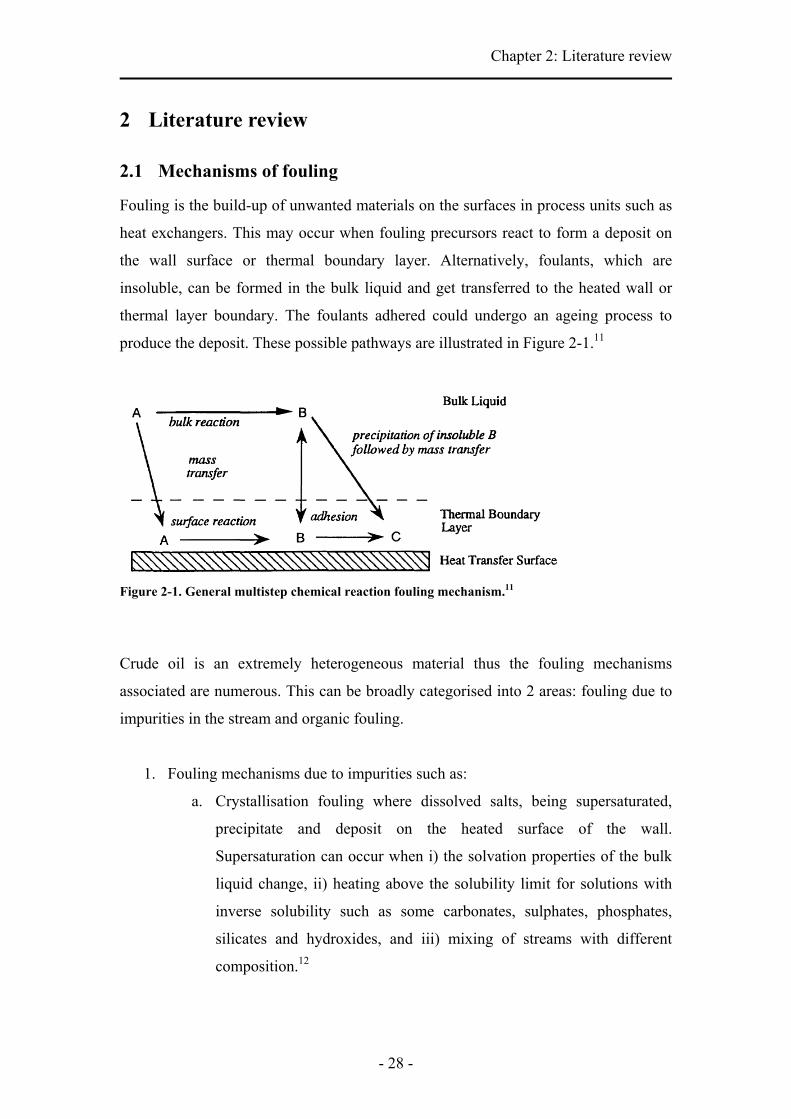
Fouling is the build-up of unwanted materials on the surfaces in process units such as
heat exchangers. This may occur when fouling precursors react to form a deposit on
the wall surface or thermal boundary layer. Alternatively, foulants, which are
insoluble, can be formed in the bulk liquid and get transferred to the heated wall or
thermal layer boundary. The foulants adhered could undergo an ageing process to
produce the deposit. These possible pathways are illustrated in Figure 2-1.11
Figure 2-1. General multistep chemical reaction fouling mechanism.11
Crude oil is an extremely heterogeneous material thus the fouling mechanisms
associated are numerous. This can be broadly categorised into 2 areas: fouling due to
impurities in the stream and organic fouling.
1. Fouling mechanisms due to impurities such as:
a. Crystallisation fouling where dissolved salts, being supersaturated,
precipitate and deposit on the heated surface of the wall.
Supersaturation can occur when i) the solvation properties of the bulk
liquid change, ii) heating above the solubility limit for solutions with
inverse solubility such as some carbonates, sulphates, phosphates,
silicates and hydroxides, and iii) mixing of streams with different
composition.12

Chapter 2: Literature review
- 29 -
b. Particulates fouling where small suspended particles, like dirt, clay or
silt deposit on any heat transfer surfaces
c. Corrosion fouling. The surface of the heated wall can corrode in the
harsh environment of crude oil stream. Although the thermal resistance
of the corroded layers is usually low, the increased surface roughness
may promote other mechanisms of fouling. Furthermore, rusts may
aggravate particulate fouling.
2. Organic fouling can be sub-categorise into:
a. Insoluble gum formation. Depending on the amount of oxygen and the
nature of the feed hydrocarbon fluid, autoxidation or polymerisation
reactions can occur to form the unwanted deposits. The autoxidation
reaction in heat exchanger fouling has been studied extensively and the
chemistry is established.11 It is known that such reactions occur
through a series of complex free radical reactions. Using a model
solution of aromatic alkenes such as indene, the deposit formed was
found to consist of indene polyperoxide gums and their ageing
products.13, 14 De-aerated systems fouled at a lower rate as the
polymerisation reaction dominates over the autoxidation reaction. This
polymerisation fouling has been closely modelled using the styrene
system, assuming that the fouling mechanism is through vinyl-type
polymerisation.15
b. Soluble sulphur species in crude oil that can react with the tube surface
can cause fouling. Srinivasan and Watkinson16 conducted a thermal
fouling study on three sour crude oils (crude oil with more than 5 %
sulphur content) and found a significant amount of iron sulphide in the
deposits. At the highest temperature used in the experiment, the
deposits were about 30 % organic and 70 % inorganic materials.
c. Asphaltene precipitation is claimed to be the largest contributor to
organic fouling in crude oil heat exchanger in non-oxidative
conditions.17 Although asphaltenes are linked to the extent of fouling,
the presence of asphaltenes in a crude oil does not necessary mean that
it will foul. A kinetic model developed by Wiehe18 provided an
explanation that it is not just the asphaltene content that dictates

Chapter 2: Literature review
- 30 -
fouling but the incompatibility phenomenon which controlled by the
phase equilibrium. Dickakian and Seay have proposed that the
precipitation of asphaltenes is first triggered by the incompatibility of
the soluble asphaltene with the bulk solution. The precipitated
asphaltenes adhere to the high temperature heat exchanger surface and
then carbonise into coke.17
d. Coke formation is due to the thermal decomposition of the oil
components. This fouling mechanism dominates at temperatures higher
than 350 °C. It has been shown that coke formation is related to the
ageing of asphaltene deposits.11, 17-19 In industrial heat exchangers
where the process may be in operation for a long time, the actual cause
of fouling may be misinterpreted if it is just based on the analysis of
the deposit taken from these units. Therefore it is important to
understand this mechanism.
On a new heat transfer surface, there may be an initiation period where the heat
transfer coefficient remains unchanged. As nucleation sites for deposition start to
form, the surface becomes rougher and the heat transfer coefficient may increase
during this period. The fouling materials will continue to diffuse to the nuclei sites to
augment the deposits. At the same time, depending on the strength of the deposit,
erosion may occur. In a shell and tube exchanger, accumulation of the fouling layer in
the tube will lead to a decrease in the cross-sectional area of the flow thus increasing
the shear stress rate at the wall, favouring the removal of the deposit. In addition, the
build up of the deposit will result in driving a temperature difference between the
heated surface and the bulk thus reducing the rate of fouling.12 The mechanism of
fouling in a crude oil heat exchanger is complex as mentioned above. It is important
to consider the whole sequence of events in order to fully understand the
fundamentals of the crude oil fouling better.

Chapter 2: Literature review
- 31 -
2.2 Fouling and relevance of asphaltenes
Asphaltenes have been closely linked and related to the level of fouling in heat
exchangers. These materials are typically complex mixtures with a high content of
PAHs and with high heteroatom content (N, O and S). Asphaltene deposition is a well
known problem in many aspects of the oil industry, namely, oil production,
transportation, processing and storage. Despite the numerous studies that have been
carried out, the complex behaviour of such material is still not well understood.
Asphaltenes are the heaviest and most polar constituents in crude oil.20 They are
defined operationally as a solubility class of crude oil that is insoluble in n-heptane
and soluble in light aromatics like toluene. The amount and characteristics of this
fraction in crude oil depends on the nature and source of crude oil.
It was first proposed that asphaltenes form a colloidal suspension in crude oil in
1940.21 Asphaltenes are at the centre of the micelle surrounded by a stabilising layer
of resinous species.22, 23 More recently it has been suggested that asphaltenes are a
molecular, non-ideal solution close to their glass transition temperature.24, 25 After 70
years of research the structure of asphaltenes is still in dispute in academic circles.
Asphaltenes tend to precipitate upon changes in temperature, pressure and
concentration of the light fractions of crude oil, short alkane chains from methane to
heptane. To analyse asphaltenes in the laboratory, solvents are added to crude oil to
precipitate the asphaltenes. Many parameters can affect the properties of asphaltenes
and these are discussed further in Section 2.3.
2.2.1 General chemical structure
Asphaltenes are believed to be a collection of PAH systems joined by carbon and
sulphide bridges to provide a large molecule which aggregates upon changes in the
local environment.26 The high boiling point of the asphaltene fraction is believed to be
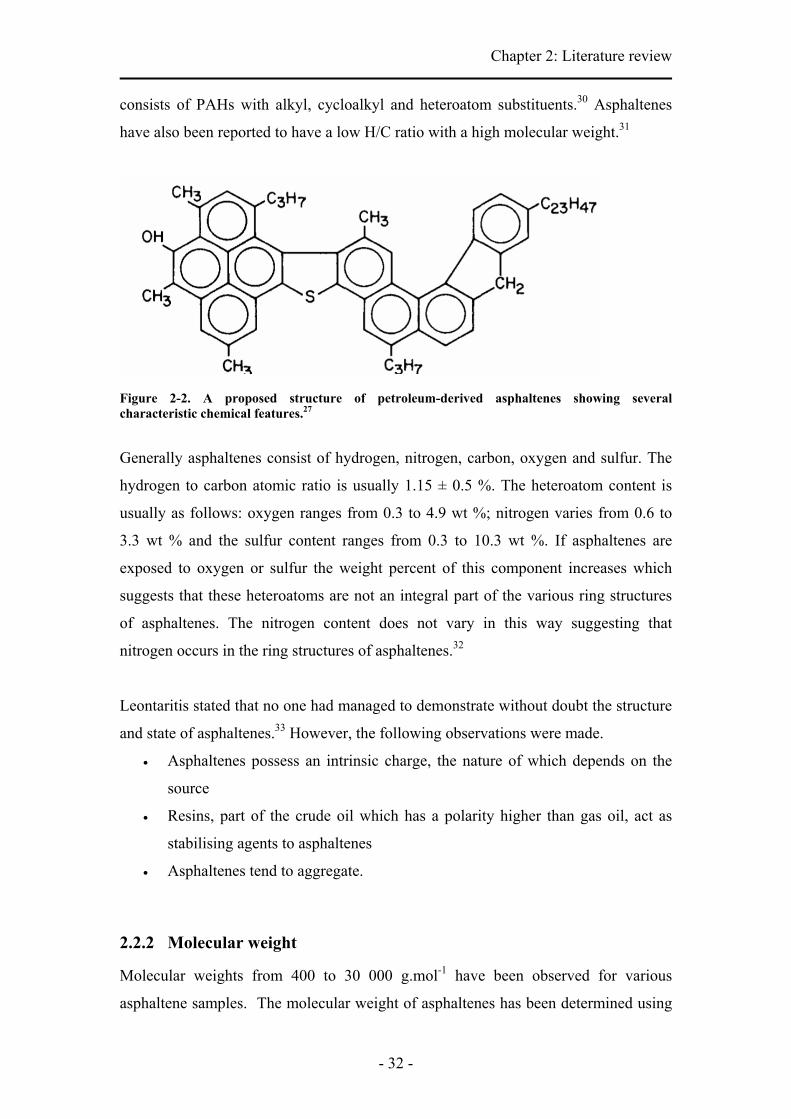
due to the presence of heteroatoms and long alkyl chains. Figure 2-2 shows several
characteristic features of asphaltenes as proposed by Waller et al.27 Several authors28,
29 have reported that the structure of asphaltenes consists of PAHs of about 6 to 8
aromatic rings. Ancheyta and co-workers have reported the structure of asphaltenes
Chapter 2: Literature review
- 32 -
consists of PAHs with alkyl, cycloalkyl and heteroatom substituents.30 Asphaltenes
have also been reported to have a low H/C ratio with a high molecular weight.31
Figure 2-2. A proposed structure of petroleum-derived asphaltenes showing several characteristic chemical features.27
Generally asphaltenes consist of hydrogen, nitrogen, carbon, oxygen and sulfur. The
hydrogen to carbon atomic ratio is usually 1.15 ± 0.5 %. The heteroatom content is
usually as follows: oxygen ranges from 0.3 to 4.9 wt %; nitrogen varies from 0.6 to
3.3 wt % and the sulfur content ranges from 0.3 to 10.3 wt %. If asphaltenes are
exposed to oxygen or sulfur the weight percent of this component increases which
suggests that these heteroatoms are not an integral part of the various ring structures
of asphaltenes. The nitrogen content does not vary in this way suggesting that
nitrogen occurs in the ring structures of asphaltenes.32
Leontaritis stated that no one had managed to demonstrate without doubt the structure
and state of asphaltenes.33 However, the following observations were made.
• Asphaltenes possess an intrinsic charge, the nature of which depends on the
source
• Resins, part of the crude oil which has a polarity higher than gas oil, act as
stabilising agents to asphaltenes
• Asphaltenes tend to aggregate.
2.2.2 Molecular weight
Molecular weights from 400 to 30 000 g.mol-1 have been observed for various
asphaltene samples. The molecular weight of asphaltenes has been determined using

Chapter 2: Literature review
- 33 -
various experimental techniques of sample preparation and analysis as discussed in
Sections 2.4.2, 2.4.4 and 2.4.5. However, there is still a debate over the range of the
average molecular weight of asphaltenes and the range depends largely on the
method.30, 34, 35
In the high molecular weight range, a molecular weight of 30 000 g.mol-1 was
observed for asphaltenes by Ravey et al.36 Waller et al. observed molecular weights of
asphaltenes ranging from 500 g.mol-1 to 12 000 g.mol-1.27 The work by Herod et al.
has also provided evidence that petroleum asphaltenes contain molecules of mass up
to 10 000 g.mol-1.
In the low molecular weight range, Groenzin and Mullin reported a range of
molecular weights from 500 to 1000 g.mol-1 when analysing asphaltenes using
fluorescence depolarisation techniques.29 The results from this experiment suggested
that asphaltenes are much smaller than previously suggested. Rodgers and Marshall
observed that the molecular weight of asphaltenes ranged from 350 to 750 g.mol-1.37
The authors explained the high molecular masses obtained by other mass
spectrometry techniques were actually due to aggregation tendencies in the polar
components of the sample.
2.2.3 Aggregation of asphaltenes
Asphaltenes have a strong tendency to aggregate. The existence of asphaltene sheets
with a diameter of 6 to 20 nm and a thickness of 0.6 to 0.8 nm was observed using the
small angle neutron scattering technique.36 Asphaltenes tend to aggregate and bind to
resins. Strausz et al. found that the resin material was partitioned equally between the
n-pentane maltene fraction and the solid asphaltene fraction.38 Additional washing of
the solid precipitate did not remove the resin fraction. This suggests that these resins
are strongly bound to asphaltene molecules. Acevedo et al. presented the idea that
asphaltenes are a rosary type structure (Figure 2-3).39 They can either interact through
π-π interactions of the aromatic rings inter-molecularly or intra-molecularly (Figure
2-3). Asphaltenes which can only interact inter-molecularly, as shown in Figure 2-4,
have poor solubility as the entire condensed aromatic system is exposed to
unfavourable solvent molecule interactions. This will cause molecules to aggregate

Chapter 2: Literature review
- 34 -
and therefore precipitate at lower concentrations of solvent. Asphaltene structures
which can have intra-molecular interactions, Figure 2-3, will be more soluble as they
can minimise solvent-aromatic interactions by folding over themselves. Other work
using X-ray diffraction technique on asphaltenes has also suggested that asphaltenes
form aggregates of sheets around aromatic centres.40, 41
Figure 2-3. A rosary-type structure proposed for asphaltenes.39
Figure 2-4. Proposed typical chemical structures of asphaltenes.39

Chapter 2: Literature review
- 35 -
2.2.4 Temperature effect
Lighter crude oils have been subjected to higher temperatures and pressures than
heavier oils. Under these conditions thermal cracking may occur. It is believed that
alkyl chains, bridges and appendages are lost from the large aromatic core which
composes the asphaltene. This results in molecules with high aromatic condensation.
As these molecules have lost the appendages which are believed to enhance their
solubility in oil, they remain in the well. Therefore the asphaltene content of light oils
is much lower than heavy oils.31
The solubility of asphaltenes in crude oil is largely sensitive to the temperature and
pressure conditions. At low temperatures, asphaltenes become unstable and
precipitate because of differences in the interaction energies between asphaltene
molecules and solvent (crude oil) molecules. As the temperature increase above
154 °C, they assume that the asphaltene solution demixes as a result of the large
thermal expansivity of the solvent compared to that of the asphaltene.42, 43
For most asphaltene molecules, at a temperature above 340 °C, there will be enough
energy to break hydrogen bonds, acid-base interactions and van der Waals forces.
Short periods of heating result in reversible dissociation of the asphaltene molecules
but prolonged heating has been found to cause irreversible dissociation of asphaltene
structures resulting in a solid precipitate.20 When asphaltenes are thermally
decomposed, the coke is more aromatic than the starting material. It is believed that
the alkane chains break off the asphaltene aromatic core to form reactive aromatic
species. These active aromatic species then condense to form the coke.11, 17-19
2.2.5 Industrial implications of asphaltene precipitation
Generally the asphaltene problem is not detected prior to the exploration or
development phase of oil discoveries. This is then too late to stop operating in
economic terms. The unwanted precipitation of asphaltenes is an expensive
occurrence in the oil industry. Asphaltenes precipitate upon: a) a change in
temperature, for example in heat exchangers; b) a change in pressure, for example in
the well bore when the oil changes pressure as it ascends particularly at the bubble
point of the oil; c) a change in concentration, for example when two or more crude

Chapter 2: Literature review
- 36 -
oils are blended to make up the feedstock for a refinery. These precipitates can cause
blockages and therefore a loss of production or inefficiencies in heat exchangers as
they foul inside of the exchangers. Precipitation of asphaltenes on porous media
causes a change in the wettability of the channels from hydrophilic to hydrophobic,
thus reducing the productivity of the well.
At present, heavier crude oils are experiencing an increased production rate as lighter
oil fields are being depleted. The products in demand are often the lighter
hydrocarbons, therefore additional processing is required for heavier crude oil.
Asphaltenes increase the operational cost of fractionation with heavier crude oils as
they are generally in a higher concentration than in the light oils. This requires the
addition of diluents and/or heating to reduce the viscosity of this fluid for ease of
processing. Therefore processing of heavier hydrocarbons is more expensive.
Mohamed et al. have demonstrated the precipitation prevention capacity of surfactants
and polymers to reduce precipitation.44 The most promising compounds were
ethoxylated nonylphenols and hexadecyl trimethyl ammonium bromide for the
inhibition of asphaltene precipitation. The usual method employed in industry to
remove asphaltenes prior to refining is to inject large amounts of propane.20 However,
these methods are expensive and energy intensive.
Asphaltenes cause major problems in the oil industry as described above. It has not
been possible to predict asphaltene problems prior to exploration and this has caused
asphaltenes to threaten the economic viability of several wells. Another major point is
that low asphaltene content does not indicate the absence of operational problems due
to asphaltenes. It is thought that with a better understanding of their structure and
behaviour, precipitation of asphaltenes can be predicted and avoided using
computational models. Current analytical methods used to aid in the understanding of
this complex problem are detailed in Section 2.4. However, due to the challenges of
working with such a complex material, each technique has its own limitation. It is
hoped that the work conducted in this thesis will contribute towards a better
characterisation of the material.

Chapter 2: Literature review
- 37 -
2.3 Extraction methods of asphaltenes
There are several methods used for the isolation of the asphaltene fraction from crude
oil. Lundanes and Greibrokk45 gave a review on the existing techniques for the
separation and characterisation of crude oils and related materials into different class
types. The American Society for Testing and Materials (ASTM) D327946 for n-
heptane insolubles is the most common and widely used method to determine the
asphaltene content in crude oil. The main reason is that this fractionation procedure is
easy and repeatable. It is important to note that the separation procedure used for the
isolation not only dictates the yield but can also affect the quality of the fraction.32, 47
Speight emphasised in his paper that there is no one parameter that is operational in
the separation of asphaltene constituents.32 The relevant parameters for asphaltene
separation are both physical and chemical in nature. The effect of the different
methods on asphaltene precipitation can be seen in Figure 2-5.48 The asphaltene
produced by pentane is a red-brown powder. The CO2 induced asphaltene is smooth
and black and the pressure induced asphaltene is black and splintery.48 The main
parameters that affect the yield and chemical nature of the asphaltenes separated are
discussed below.
Figure 2-5. Different appearances of asphaltenes under different precipitating conditions.48
Type of solvent
The type of solvent used to extract asphaltenes will have an effect on their physical
properties. This is the most influential parameter when separating asphaltenes as it
was found to affect the yield, aromaticity and relative molecular weights of
asphaltenes. Speight and co-workers reported that asphaltene yields are more stable
pentane induced CO2 induced pressure induced

Chapter 2: Literature review
- 38 -
when recovered using n-heptane instead of n-pentane.26 For this reason n-heptane are
commonly used as the separation solvent for asphaltene studies so that asphaltene
properties will not change significantly with each extraction.
Kaminski and co-workers49 demonstrated the effect of polarity on the dissolution of
asphaltenes with changes in pentane and methylene chloride solvents. As the ratio of
methylene chloride to pentane increased, the polarity of the solution increased. In the
highly polar solutions the asphaltene fraction was found to contain more metals. This
fraction also dissolved at a slower rate than the fraction obtained in less polar
solutions. Waller et al. also showed that the yield between pentane and heptane
extraction can vary by as much as 50 %.27 Buenrostro-Gonzalez et al. noted that
asphaltene molecules had a greater distribution according to their solubility, when
precipitated with a more polar solvent (acetone) than to a less-polar solvent
(heptane).50
Dilution ratio
If the dilution ratio of solvent to crude is not sufficient, the yield and quality of the
asphaltene fraction will be affected. A semi-solid asphaltene that contains resins will
be produced with a dilution ratio of less than or equal to 20 mg.l-1, which will
overestimate the yield.26
Temperature
The solubility of asphaltenes in n-pentane increases with the temperature at which the
extraction was carried out. The yield of solvent extraction will decrease as more
asphaltenes will remain in solution.26
Contact time
Speight and co-workers26 found that a contact time of eight hours was needed
between the oil fraction and the separating solvent for stable asphaltene yields. For
asphaltene extraction by precipitation, the contact time must be between 12 and 16
hours to ensure reproducible results. If the contact time is more than 16 hours, resins
were found to adsorb onto the asphaltene.

Chapter 2: Literature review
- 39 -
2.4 Characterisation techniques of asphaltenes and deposited
foulants
2.4.1 Small angle scattering
Light scattering is a commonly used technique in biological systems,51
pharmaceuticals,52 polymers53 and asphaltenes29, 54-56 for determining the particle size
in solution. The angle at which light is diffracted depends upon the wavelength of the
light and the particle size. The angle of diffraction is measured to determine the size.
Frequency is another feature of light that can be used for determining the particle size.
Small-angle scattering methods, such as small-angle X-ray scattering (SAXS)24, 57-60
and small-angle neutron scattering (SANS),24, 36, 55, 57, 58 have been useful for deducing
the sizes of asphaltenic aggregates in solution based on assumed particle
morphologies. However, various intra-particle structure factor models have to be
applied to determine information from the scattering intensity curves but it is very
difficult to judge accurately the morphology of the asphaltenic aggregates in solution
thus bringing the quality of the data fit into question.61
SAXS makes use of the electron differences between asphaltenic aggregates and its
surrounding to identify and measure the particle size, shape, and polydispersity of the
aggregates. SANS applies similar principles to SAXS except that it uses the scattering
length densities of the neutrons on the system which depends on the nuclei that
comprise the molecules.
Espinat57 studied the effects of temperature and pressure on asphaltene agglomeration
in toluene using both SANS and SAXS. He observed that pressure has a small effect
on asphaltene agglomeration and the agglomeration is reversible at high enough
temperatures but irreversible at low temperatures. Savvadis, using SAXS and Ultra-
SAXS, deduced that flocculated asphaltenes are a compact organisation of spherical
entities ranging from nanometers to microns.60
Sheu has presented a good overview of using small angle scattering techniques in
characterising asphaltene aggregates.62

Chapter 2: Literature review
- 40 -
2.4.2 Atomic force microscopy
In atomic force microscopy (AFM), a sharp tip on a cantilever, which acts like a
probe, is used to interact with surface of the sample. Particles of different surface
properties can be deposited on the tip on the cantilever to study the interaction of
interest. A polystyrene particle deposited on the tip of the cantilever has been shown
to interact strongly with asphaltenes, thus this interaction may affect the elution time
of asphaltenes through the polystyrene column in size exclusion chromatography.35
Hence, the interpretation of the results to the size and mass distributions of
asphaltenes based on size exclusion chromatographic technique is not straightforward.
Several authors23, 63-65 also have used AFM to study the interfacial behaviour of
asphaltenes using AFM at different interfaces.
The interaction forces between asphaltene surfaces can be used to understand the
flocculation of asphaltenes. Ese and co-workers66 studied the interactions between
asphaltenes and resins by examining the topography of their monolayers transferred
onto mica surfaces via the Langmuir-Blodgett (LB) technique using AFM. They have
reported that the aggregates formed from a mixture of asphaltenes and resins are of
larger dimensions than when they are in pure fractions. Wang and co-workers67
observed a repulsion force between asphaltene surfaces in toluene and have attributed
the origin of this repulsion to a steric force. Liu and co-workers68 reported that both
long-range and adhesion forces between asphaltene films in aqueous solutions are
significantly affected by solution pH, salinity, calcium concentration and temperature.
Cadena-Nava and co-workers69 provided evidence that the interfacial behaviour of
asphaltenes obtained from different origins and separation methods is very similar,
thus indicating that the intermolecular interactions must be dominated by the nature
and amount of functional groups that are common to all asphaltene samples.
Recently, a new technique, combining AFM and Raman microspectroscopy, has been
shown to be able to obtain spectroscopic information of a sample with a spatial
resolution on the nanometer scale.70, 71 This technique, although still in an early
development stage, has opened up new opportunities in nanoscale analysis for a more
comprehensive characterisation of complex materials and may be applied to study
asphaltenes.
Chapter 2: Literature review
- 41 -
2.4.3 Vapour pressure osmometry
Vapour pressure osmometry (VPO) is among the most commonly used techniques
used for molecular weight studies of asphaltenes because of its simplicity and low
cost.30, 72-76 The average molecular mass of asphaltenes can be inferred from the
temperature difference obtained when the solvent evaporates from a solution
containing asphaltenes. Various authors have compared this technique with other
techniques like size-exclusion chromatography (SEC),77 mass spectrometry (MS)73
and ultraviolet-fluorescence (UV-F) depolarisation.29 In Zhang’s work, VPO has been
used to characterise fractionated and whole asphaltenes with a Langmuir trough at an
air-water interface.78
However, the requisite concentration of asphaltenes for this technique is about 1 %
and this greatly exceeds the critical nanoaggregate concentrations of asphaltenes.79
Groenzin and Mullins79 claimed that the reported “molecular” weights in literature
using the VPO technique should in fact be aggregate weights of asphaltenes. They
also stated that the extrapolations of the VPO results to low concentrations are also
problematic as they believed asphaltenes in solution are known to exhibit aggregation
at different length scales at different concentrations.
2.4.4 Size exclusion chromatography
Size exclusion chromatography (SEC) is a liquid chromatography method in which
particles are separated by their molecular sizes. This technique can provide the
molecular weight distribution of polymeric materials by comparing the results with
standard molecular weights. The sample is carried by a mobile solvent to an analytical
column where molecular size discrimination occurs. The sample then elutes from the
columns to a detector where signals are sent to a computer for data processing. Ideally,
when a series of different molecular weight materials are injected into a porous SEC
column, the smaller molecules are retained temporary in the column where as the
bigger molecules remain in the interstitial space as they cannot penetrate into the
pores of the column. Hence, the larger molecules will be eluted from the column
earlier.
Chapter 2: Literature review
- 42 -
The separation in SEC is based on molecular sizes and not mass, thus applying this
technique to a complex material like asphaltenes is not trivial. Also, factors like
polarity of the sample80, interaction of sample with the column35, aggregation81 and
conformational changes of large molecules82, 83 may affect the elution time of the
sample.
Several authors have observed a bimodal distribution of their petroleum vacuum
residues and asphaltene samples using SEC.80, 82-85 It is proposed that the material
under this early eluting peak corresponded to apparently very large molecular masses.
However, workers using other techniques had suggested that materials identified with
molecular masses above 1000 u would be composed of aggregated molecules.29, 79, 86,
87
Herod and co-workers34 have presented an overview of different chromatographic and
mass spectrometric techniques used to characterise heavy hydrocarbons. They
highlighted the challenges of indicating unambiguously molecular masses higher than
500 u with any single technique and emphasised that fact that no confirmable
experimental evidence showed that aggregation occurs under the dilute conditions
prevailing during SEC, using N-methylpyrrolidone (NMP) as an eluent.
Berrueco and co-workers88, have developed a mixed NMP/CHCl3 solvent system as
eluents for SEC. Their work was aimed at characterising the fraction of petroleum-
derived asphaltenes which was usually not dissolved and eluded in the SEC system
where pure NMP was used. They have found that the NMP insoluble fraction was of
larger aromatic cluster size and attached to very large aliphatic groups that made the
material analysed insoluble in just NMP. Thus using the mixed solvent system, a
more complete characterisation of the sample can be achieved.
2.4.5 Mass spectrometry
Mass Spectrometry (MS) is a technique used for separating ions by their mass-to-
charge (m/z) ratios. The sample is first ionised and the resulting ions are separated by
their masses. The relative abundance of these ions is then recorded by a detector. MS
is often coupled to other techniques such as gas chromatography (GC), liquid

Chapter 2: Literature review
- 43 -
chromatography (LC) and SEC. Although restricted at the high-mass end by the
volatility of components that can pass through the chromatography stage, GC-MS has
been described as “one of the most powerful analytical methods ever devised”.34
There several different variations of MS depending on the method of ionisation of the
samples and type of detectors used. For measuring heavy hydrocarbons of molecular
mass range up to ca. 450-500 u, there are probe-MS, field ionisation-MS and
electrospray ionisation-MS. For higher mass materials, there are fast atom
bombardment-MS, laser desorption-MS, matrix-assisted laser desorption ionisation-
MS and plasma desorption-MS. Among these techniques, laser desorption-MS and
matrix-assisted laser desorption ionisation-MS have been more widely used to
generate mass spectra from asphaltenes to overcome the discrimination against high-
mass molecules in favour of ionisation of smaller molecules in mass spectrometry.
Workers in this field have reported molecular masses of asphaltenes can be greater
than (m/z) 10 000.82, 85, 89
Fourier transform ion cyclotron resonance (FT-ICR) is a newly developed mass
spectrometry technique.90, 91 The mass resolution provided by this technique is
exceptional but the collection and transmission of the high-mass components from a
complex mixture like asphaltenes are still yet to be established.
To date, mass spectroscopic methods still cannot easily define the upper mass limits
of complex fractions, because an absence of signal does not mean an absence of a
material but the limit of ionisation may have been reached.34 More work is still
needed to establish an unambiguous method to determine molecular masses of such a
poly-diversified system like asphaltenes.
2.4.6 Nuclear magnetic resonance
Nuclear Magnetic Resonance (NMR) has been recognised as an important developing
tool used to obtain physical, chemical and structural information about molecules.
Nuclei that have an odd number of protons and neutrons have an intrinsic magnetic
dipole moment and angular momentum. When these nuclei are placed in a magnetic
field they absorb energy at a frequency characteristic of the isotope and its
Chapter 2: Literature review
- 44 -
environment, called the resonance frequency. The chemical shift value is the
difference between the resonance frequency and the reference standard. A chemical
shift value is used to obtain structural information of the sample.
The resonance frequency is affected by the local environment and therefore the
chemical shift value is used to assign chemical structure as it is a field independent
dimensionless value. By integrating peaks, the total number of nuclei that have given
rise to the peak can be found. The most commonly measured nuclei are 1H and 13C.
NMR is a frequently used technique in asphaltene characterisation.50, 92-95 The
principle molecular parameters that can be calculated using this technique are the
aromatic carbon fraction, average number of carbons per alkyl side chain and the
percent substitution of aromatic rings.95 Additional structural parameters such as the
types of quaternary aromatic carbon can be quantified using the average structural
parameters calculations.94 This calculation utilises data from liquid NMR, elemental
analysis and molecular mass estimates of the sample.
Buenrostro-Gonzalez et al. have used Proton Nuclear Magnetic Resonance (1H NMR)
to calculate different structural parameters of asphaltenes in order to determine the
effect of the relationship between aliphatic and aromatic parts of the asphaltene on
solubility.50
2.4.7 Ultraviolet fluorescence spectroscopy
Ultraviolet-Fluorescence spectroscopy (UV-F) is a useful technique for providing
information on the relative concentrations and sizes of PAHs. When a sample is
irradiated with UV light, the molecules will undergo a transition from a state of low
energy (ground state) to a state of high energy (excited state). The energy absorbed
corresponds to a transition between electronic energy levels where an electron is
promoted from an occupied orbital to an unoccupied orbital of greater energy.
Fluorescence emission occurs when the molecule passes from the lowest energy level
of the “excited” electronic state to any of the transitional levels of the ground
electronic state.
Chapter 2: Literature review
- 45 -
UV-F had been used in many studies had been used characterised high-mass
materials82, 96, 97 but recently, it had been reported by several groups that UV-F is
unable to detect masses greater than ca. 3000 u.34, 98 Fluorescence is not detected for
large complex molecules as the excitational energy induced by the absorbing photons
can be lost by methods other than fluorescence through forbidden transitions and
intermolecular energy transfer.
2.4.8 Fourier transform infrared spectroscopy
Fourier transform infrared (FTIR) spectroscopy has been one of the most robust
techniques in material characterisation. A detailed discussion of this vibrational
technique can be found in the Section 2.5.
Yen and Erdman were among the first to report the application of IR spectroscopy to
study the structure of petroleum asphaltenes.99 Apart from a detailed peak assignment
of the IR spectra of asphaltenes, they proposed methods to determine the size of the
aromatic clusters and the aliphaticity of the samples. Their results suggested that as
the size of aromatic clusters increases, the number of terminal aliphatic chains
decreases.
Coelho et al.100 used diffuse reflectance IR Fourier transform spectroscopy (DRIFTS)
together with a spectral deconvolution modelling procedure to determine abundances
of the carbon chains in asphaltenes and resins by looking at the absorbance of the
2927 cm-1 and 2957 cm-1 bands. In another of their papers, they proposed a
methodology to determine the functionality and calculate the percentage of single H
and paired H, attached to aromatic rings for both asphaltenes and resins.101 In that
study, they compared the absorbance of the spectral bands corresponding to the
symmetric and asymmetric aromatic hydrogens in methyl substituted arenes, in the
3100-2900 cm-1 region and of the bands corresponding to the out-of-plane
deformation in the 900-700 cm-1 region. DRIFTS was also compared with spectra of
asphaltenes acquired from transmission mode and had been used to monitor the
thermal evolution of asphaltene fractions.102
Chapter 2: Literature review
- 46 -
Siddiqui studied the hydrogen bonding capabilities of asphaltenes with phenol (OH
group) and pyperidine (NH group).103 It is known that most of the oxygen atoms in
asphaltenes are present as hydroxyl groups and attached to nitrogen atoms in basic
pyrrolic forms that may lead to the formation of strong intermolecular hydrogen
bonds in asphaltenes. The absorbance of the ν(OH) band of phenol depends on the
presence of functional groups in asphaltenes and their results showed that the
asphaltenes with high oxygen and low nitrogen contents have poor interaction with
phenol, which indicates that oxygen might be incorporated as acidic hydroxyl groups
in asphaltenes.103
FTIR spectroscopy is a quick and relatively simple technique to give structural and
chemical information of samples, thus it has been used in many studies to verify the
structure of asphaltenes. Akrami et al.104 used this robust technique to characterise
pitches from Avgamasya asphaltite prepared by solvent extraction, pyrolysis followed
by vacuum distillation of the resulting tar and air blowing of the vacuum-distilled tars.
Several chemical changes were observed in these processes including aromaticity,
aliphaticity and the formation of oxygenated groups. In general, aliphaticity decreases
and aromaticity increases with temperature. Huang105 used FTIR spectroscopy to
study thermally degraded fractions of asphaltenes. He observed different degrees of
oxidation in fractions collected before 450 °C and after 450 °C. The spectrum of the
degraded asphaltene fraction (>450 °C) was totally different thus suggesting that the
polycyclic structure of the molecules only decomposes in the temperature range of
450-650 °C.
Asphaltenes separated from “live” or “dead” oil samples were compared.106 As crude
oil is normally under pressure in a reservoir, “live” oil is pressure-preserved oil and
“dead” oil is at atmospheric pressure. FTIR spectroscopy was used to show that there
are large differences between asphaltenes extracted in the laboratory and asphaltenes
obtained at high pressure. Asphaltenes from the “live” oil samples appeared to be
more polar as revealed by the content of the functional groups and were more
aromatic.106 Aquino-Olivos and co-workers106 suggested that polarity may be the
governing factor rather than size in the precipitation process of asphaltenes in oil
reservoirs.
Chapter 2: Literature review
- 47 -
Carbognani and Espidel107 compared asphaltenes and resins from stable and unstable
crude oil. Oxygenenated compounds were observed to be more abundant within
fractions isolated from unstable oils, particularly in resins and in the low molecular
range fractions.
Boukir et al.108 studied the photo-oxidation of asphaltenes. Using structural indices
derived from the FTIR spectra, they observed an overall increase in carbonyl groups
and a decrease in aliphaticity of the molecules. Juyal et al.81 studied the influence of
heteroatom groups on molecular interaction that leads to aggregation of asphaltenes.
Asphaltene samples were chemically altered by methylation and silylation, and were
studied by FTIR spectroscopy. It was found that the silylation reaction was less
effective than methylation in reducing the aggregation.81 The results suggested that
the presence of sulphur and nitrogen functional groups has important role in the
aggregation of asphaltenes.
Douda and co-workers109 studied the structure of a Maya asphaltene-resin complex
using FTIR. It was found that whole asphaltenes have a higher degree of aromaticity
and a higher content of heterocyclic compounds and ketones as compared to maltene
fractions.
Calemma and co-workers110, apart from looking at the aromaticity and hydrogen
bonding of asphaltenes, also investigated the IR band intensities of carbonyl groups
(1750-1600 cm-1). They deconvoluted the spectral zone into four bands centered at
1735 cm-1(esters), 1700 cm-1 (ketones, aldehydes and carboxylic acids), 1650 cm-1
(highly conjugated carbonyls such as quinone-type structure and amides) and 1600
cm-1 (aromatic C=C stretching). Using an empirical index of carbonyl abundances
based on these bands, the contents of the oxygenated groups in different asphaltene
samples were compared. They also investigated the degree of condensation and
degree of substitution of different asphaltenes using the out-of-plane aromatic C-H
deformation modes in the 900-700 cm-1 spectral range.
Deposited Langmuir-Blodgett (LB) asphaltene films from toluene-water were
characterised using an FTIR spectrometer coupled with a specular reflectance

Chapter 2: Literature review
- 48 -
accessory.78, 111, 112 Spectra were obtained for a single-layer LB asphaltene film.
Zhang and co-workers observed two new bands at 3448 cm-1 and 1723 cm-1 formed in
the spectra of the LB asphaltene film but not for the spectra of asphaltene powders or
cast asphaltene films.111 From the 3448 cm-1 peak, they believed that the asphaltene
was bonded with water although the nature of this bond is unclear. Also, they
assigned the band at 1723 cm-1 not to the carboxyl band but to the esters of
polyfunctional phenols due to the hydrogen bonding. These findings suggested that
asphaltenes are bonded with water at the oil/water interface to form hydroxyl groups.
2.5 Introduction to vibrational spectroscopy
The electromagnetic spectrum consists of different regions namely, radiowave,
microwave, IR, visible, ultraviolet, X-ray and γ-ray. Matter interacts differently with
radiation from different region of the spectrum as shown in Figure 2-6. IR radiation is
an electromagnetic wave in the range from 12000 cm-1 to 20 cm-1. The term “IR
spectroscopy” is often referred to the mid-IR region of wavenumber 4000 cm-1 to 400
cm-1. The near-IR and far-IR regions are from 12000 cm-1 to 4000 cm-1 and 400 cm-1
to 20 cm-1 respectively. All objects in the universe at a temperature above absolute
zero (0 Kelvin) give off IR radiation. When this radiation interacts with matter, it
causes the molecules (specifically chemical bonds) to vibrate with greater amplitude
when they absorb the energy. For a molecule to show IR absorption there must be a
change in dipole moment during a molecular vibration. This is the selection rule for
IR spectroscopy. Molecular vibration can involve either a change in bond length
(stretching) or bond angle (bending). Another criterion for IR absorbance is the
incoming IR radiation is of the same frequency as one of the fundamental modes of
the vibration of the molecules. These fundamental modes of vibration are mainly
affected by the stiffness of the bond and the masses of the atoms at each end of the
bond but they are also affected by the surrounding environment. Therefore,
functional groups tend to absorb IR radiation in similar wavenumber ranges
regardless of the structure of the rest of the molecule. The inherently rich information
contained in the mid-IR spectrum allows one to identify different components from
their chemical structure by measuring the absorbance of IR energy as a function of
wavenumber.

Chapter 2: Literature review
- 49 -
Figure 2-6. Regions of the electromagnetic spectrum and their interactions with matter.
2.5.1 Principles of FTIR spectroscopy
FTIR spectroscopy is a powerful tool for characterising the distribution of different
chemicals in heterogeneous materials. This specificity of FTIR spectroscopy allows
different chemical components and morphologies to be distinguished on the basis of
their absorbance in the mid-IR region. This approach of spectroscopy is based on the
the concept that when two beams of radiation are interfered they will produce an
interferogram. This is a signal produced as a function of the change in path length
between the two beams. The first interferometer was invented by Albert Abraham
Michelson in 1880, not to perform IR spectroscopy but was designed to test the
existence of a “luminiferous aether”, a medium through which light waves were
thought to propagate.113 This experiment produced is one of the most famous
“negative” results in the history of science which prompted the foundation of modern
physics at that time and eventually led to Einstein’s discovery of special relativity.
Wavelength/m
molecular rotation and torsions
10-2
molecular vibration
electron transition
photoionisation change of nuclear distribution
10-5 0.5 ×10⁻⁶ 10-8 10-10 10-12
1.2 ×10⁻²
microwave IR visible UV X-rays γ rays
Energy/kJ.mol-1
1.2 ×10 1.2 ×10² 1.2 ×10⁴ 1.2 ×10⁶ 1.2 ×10⁸
electron transition

Chapter 2: Literature review
- 50 -
Figure 2-7. Schematic diagram of a Michelson interferometer.
Figure 2-8. Interferograms obtained for (a) monochromatic radiation and (b) polychromatic radiation.
The Michelson interferometer was the first interferometer used in commercial FTIR
instruments and is still the most used in modern FTIR spectroscopy. The schematic
diagram of the interferometer is shown in Figure 2-7. The beam splitter was designed
to transmit half of the radiation from the incident beam to the moving mirror and
reflecting the other half of the radiation to the fixed mirror. After reflecting off the
mirrors, the two beams recombined at the beamsplitter. This beam then leaves the
interferometer to interact with the sample and finally reaching the detector. The
moving mirror produces an optical path difference between the two beams and the
Unmodulated incident beam
Stationary mirror
Beamsplitter
Infrared Source
Moving mirror
Modulated exit beam
Sample Detector
a) b)
Intensity
Change in optical path
Intensity
Change in optical path

Chapter 2: Literature review
- 51 -
resultant interference patterns were shown in Figure 2-8 for a monochromatic source
and a polychromatic source. The sharp intensity peak in Figure 2-8b is called the
centerburst and it is caused by all the wavelengths constructively interfering at zero
path difference.
The interferogram is a plot of IR intensity against optical path difference and this
function is Fourier-transformed to produce a plot of IR intensity versus wavenumber
(cm-1). This is illustrated in Figure 2-9. To eliminate the instrumental and atmospheric
contributions to the single beam spectrum of a sample, the sample spectrum must be
ratioed against the background spectrum to give a transmittance spectrum using
Equation 2-1. The absorbance spectrum can be calculated from the transmittance
spectrum using Equation 2-2. The choice of using a transmittance (Figure 2-10a) or an
absorbance (Figure 2-10) spectrum is up to the preference of the user but for
quantitative analysis, absorbance units must be used.
0=
II
T% Equation 2-1
TA 10log−= Equation 2-2
Figure 2-9. An illustration of how an interferogram is Fourier-transformed to generate a single beam IR spectrum.
Interferogram Single beam spectrum
Wavenumber (cm-1) Optical path length (cm)
Fourier transform

Chapter 2: Literature review
- 52 -
Figure 2-10. Spectrum using transmission unit (a) or absorbance unit (b).
2.5.2 Quantitative analysis
It is found empirically that the transmitted intensity varies with the path length of the
sample and the molar concentration of the absorbing species in accord with the Beer-
Lambert law as shown in Equation 2-3.
lcII ε−= 100 Equation 2-3
IIA 0log= Equation 2-4
lcA ε= Equation 2-5
Absorbance, A, of the sample at a given wavenumber was introduced as shown in
Equation 2-4 and the Beer-Lambert law becomes Equation 2-5. Hence, if the path
length of the sample is kept constant, the absorbance of the mid-IR spectrum would
be proportional to the concentration of the sample.
2.5.3 Methods of acquisition
There are three main methods of IR sampling which are the most commonly used.
They are the transmission, reflection and attenuated total reflection (ATR) methods.
The transmission method is probably the most common way of obtaining IR spectra.
This is done by passing IR radiation directly through the sample as shown in Figure
2-11. The advantages of this technique are that the spectrum has a high signal to noise
ratio (SNR) and the accessories are relatively cheaper. This is the most straight
a) b)
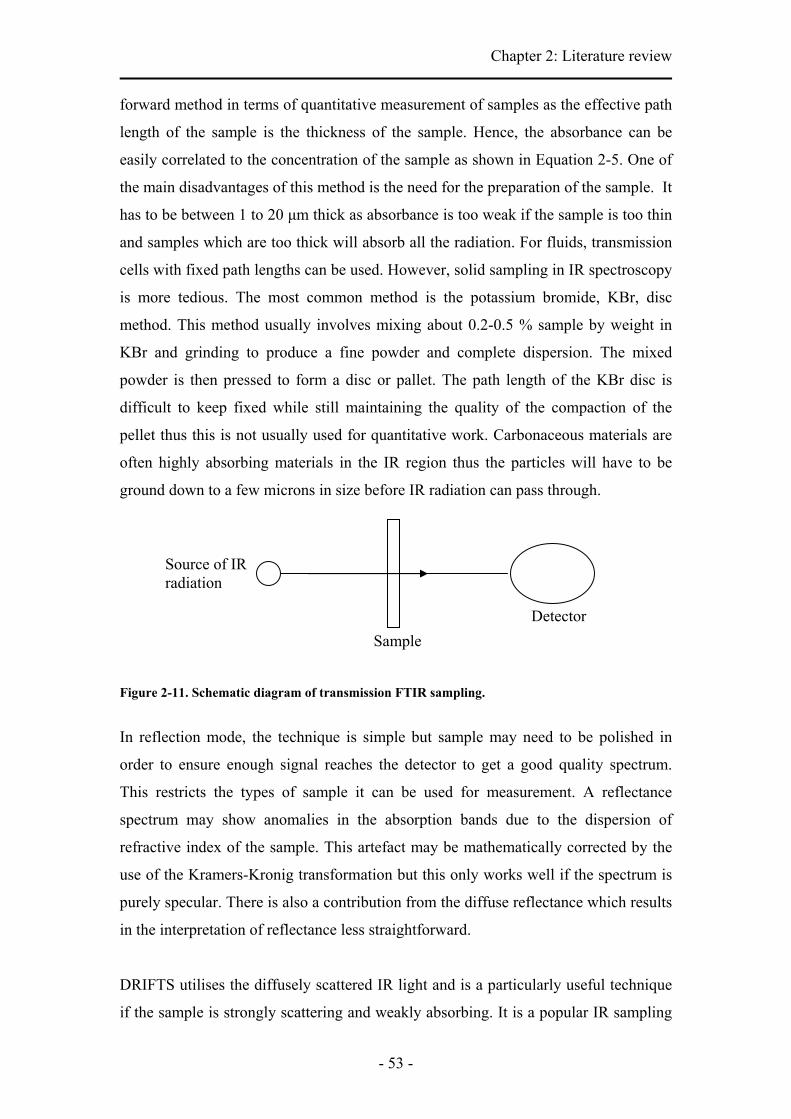
Chapter 2: Literature review
- 53 -
forward method in terms of quantitative measurement of samples as the effective path
length of the sample is the thickness of the sample. Hence, the absorbance can be
easily correlated to the concentration of the sample as shown in Equation 2-5. One of
the main disadvantages of this method is the need for the preparation of the sample. It
has to be between 1 to 20 μm thick as absorbance is too weak if the sample is too thin
and samples which are too thick will absorb all the radiation. For fluids, transmission
cells with fixed path lengths can be used. However, solid sampling in IR spectroscopy
is more tedious. The most common method is the potassium bromide, KBr, disc
method. This method usually involves mixing about 0.2-0.5 % sample by weight in
KBr and grinding to produce a fine powder and complete dispersion. The mixed
powder is then pressed to form a disc or pallet. The path length of the KBr disc is
difficult to keep fixed while still maintaining the quality of the compaction of the
pellet thus this is not usually used for quantitative work. Carbonaceous materials are
often highly absorbing materials in the IR region thus the particles will have to be
ground down to a few microns in size before IR radiation can pass through.
Figure 2-11. Schematic diagram of transmission FTIR sampling.
In reflection mode, the technique is simple but sample may need to be polished in
order to ensure enough signal reaches the detector to get a good quality spectrum.
This restricts the types of sample it can be used for measurement. A reflectance
spectrum may show anomalies in the absorption bands due to the dispersion of
refractive index of the sample. This artefact may be mathematically corrected by the
use of the Kramers-Kronig transformation but this only works well if the spectrum is
purely specular. There is also a contribution from the diffuse reflectance which results
in the interpretation of reflectance less straightforward.
DRIFTS utilises the diffusely scattered IR light and is a particularly useful technique
if the sample is strongly scattering and weakly absorbing. It is a popular IR sampling
Source of IR radiation
Sample Detector

Chapter 2: Literature review
- 54 -
method for solid particulate as it requires little sample preparation. Solid samples
need to be ground down and dilute with nonabsorbing materials like KBr. To compare
DRIFTS spectra reliably, the sample particles need to be of similar size. In addition,
the signal collected by the detector is very low, thus a longer acquisition time is
needed to spectrum with a reasonable SNR.
The principle of ATR-FTIR spectroscopy is described in detail by Harrick.114 This is
an extremely versatile sampling technique for surface characterisation. In short, an
evanescent wave, which is the result of total internal reflection of the incident wave at
the surface of the higher refractive index ATR crystal, penetrates into the sample to a
depth of several micrometers shown in Figure 2-12. The amplitude of the electric field
of the evanescent wave falls off exponentially with distance from the surface of the
boundary of the mediums shown in Figure 2-13.
Figure 2-12. Diagram showing total internal reflection and evanescent wave.
^
* Total internal reflection
n2 low refractive index material
*
evanescent wave
n1 high refractive index material
light sourceθc critical angle
θc

Chapter 2: Literature review
- 55 -
Figure 2-13. Schematic diagram showing the exponential decay of the amplitude of the electric field of the evanescent wave with distance from the boundary of the media.
The depth of penetration of this evanescent wave is defined as the distance required
for the electric field amplitude to fall to e-1 of its value at the surface and it depends on
several parameters; refractive index of the ATR crystal and sample, the angle of
incidence and its wavelength as shown in Equation 2-6. The material in close contact
with the reflecting surface selectively absorbs the radiation and the resulting
attenuated radiation is collected and measured. The small penetration depth of the
ATR approach makes it a convenient sampling method with little or no sample
preparation and can be applied to highly absorbing materials such as carbonaceous
hydrocarbons. This is advantageous for carbonaceous materials as they would have to
be ground down to a few microns in diameters in order to be used for the transmission
approach. The ATR approach has its limitations as the refractive index of the sample
must be low enough such that the angle of incidence of the IR source is well above
the critical angle to ensure an artefact-free spectrum. It is shown in this study how a
lab-made aperture is incorporated in a commercially available diamond ATR
accessory to obtain reliable ATR-FTIR spectra of a high refractive index material
(this will be discussed in detail below) thus addressing the feasibility of using ATR-
FTIR to study carbonaceous materials.
evanescent wave
dp Low refractive index medium
High refractive index medium

Chapter 2: Literature review
- 56 -
2
1
221 sin2 ⎟⎟
⎠
⎞⎜⎜⎝
⎛−
=
nnn
d p
θπ
λ Equation 2-6
2.6 FTIR spectroscopic imaging
A single spectrum only provides information about the presence of different
components in the measured area but it contains no spatial information. By studying
many spectra measured from different locations in a sample, the chemical distribution
of different components in the sample can be obtained in an image. Novel approaches
to FTIR spectroscopic imaging are needed to fully utilise the power of this chemical
imaging technique. The modes of image acquisition are the same as in conventional
FTIR spectroscopy, i.e., transmission, reflection and ATR. The requirements for
sample preparation for each mode are similar but in imaging, it is important that the
spatial identities of the chemical domains of interest are not altered so as to get a true
chemical map of the sample. The two most robust and common modes of imaging,
transmission and ATR, are discussed in detail in Section 2.6.2.
2.6.1 ATR-FTIR imaging
ATR imaging with visible light can be observed most easily if a glass of water is held
in the hand, when the skin or finger print making contact with the glass can be
observed through the surface of the water, while the remainder of the light is totally
internally reflected. The area where the surface of the glass makes contact with the
skin destroys the total reflection and forms an image of the finger print. An ATR
image of a finger print has been demonstrated by Harrick, who obtained the ATR
image by illuminating a prism with a finger pressed on the large surface and then
focusing the light that had been internally reflected off the prism onto a photo film.115
A similar principle to that described by Harrick has been applied for the purpose of
ATR-FTIR spectroscopic imaging. Here, instead of shining visible light, and using a
photo film to record the projected image, the IR light was shone through an
interferometer, an IR transparent crystal, and onto a focal plane array (FPA)
detector.116

Chapter 2: Literature review
- 57 -
The applicability of ATR-FTIR imaging ranges from micro ATR imaging using a
microscope objective to the use of ATR accessories with focused or expanded optics,
without need to use the microscope. The ATR crystal in a prism shape provides much
versatility in terms of sample preparation. The measured area with macro ATR
imaging depends not only on the specific optics used in these ATR accessories but
also on the size of the pixels in the array detector. Most currently available detectors
have a pixel size of 40 μm × 40 μm or 60 μm × 60 μm. Thus, the range of areas in the
samples that could be measured simultaneously using FPA detectors and prism-
shaped ATR crystals was from 500 μm × 700 μm to 1.6 cm × 2.1 cm (see Table 2-1).
One of the main advantages of FTIR spectroscopic imaging in the ATR mode is that it
requires minimal or no sample preparation. The small penetration of IR light into the
sample when using the ATR mode also allows one to image samples in contact with
aqueous solutions, or materials with a high water content. As with any technique,
however, FTIR imaging in ATR mode has its limitations.
Table 2-1. Summary of capabilities of different ATR-FTIR imaging approaches.
Micro ATR imaging has the advantage of having better spatial resolution while the
sample preparation is relatively simple (there is no need to microtome and polish).117,
118 There is a general belief that pressure must always be applied to a sample in order
to obtain an FTIR image in the ATR mode. Whilst it is important to ensure
homogeneous contact between the sample and the ATR crystal, such that the image
would not represent only the quality of the contact, there is often no need to apply
Large ZnSe Variable angle ATR accessory Medium ZnSe Diamond ATR Micro ATR with 10x
Ge objective
Field of view / mm x mma 15.4 x 21.5 ~3.9 x 5.5 2.6 x 3.6 ~0.5 x 0.7 0.0642
Spatial resolution (estimated) / μm 500 150 60 15-20 4
Combined with a UV detector No No Yes Yes No
In situ compaction of samples No No No Yes No
High-throughput applications (number of samples)
Yes (>100) Yes (>100) Yes (50)b Yes (10)b No
Depth profiling No Yes No Yes Noa Sizes quoted are obtained with new 64 x 64 FPA detector (40 µm pixel size).b Only possible when using a microdroplet dispensing systems.

Chapter 2: Literature review
- 58 -
pressure in this situation. Examples in macro ATR imaging include swelling of
pharmaceutical tablets or biomedical tissues, whereby a good and reproducible
contact is achieved simply by placing the samples onto the surface of the ATR crystal.
Clearly, special care should be taken to ensure that no excessive pressure is applied
when working in micro ATR mode, where the use of an ATR microscope objective
and a small contact area with the sample may result in significant pressures. However,
modern IR microscopes can employ commercial or home-made pressure-monitoring
devices to ensure that a controlled and reproducible contact is achieved in the micro
ATR mode. The introduction of various macro ATR accessories has provided the
opportunity to obtain chemical images with different fields of view, without recourse
to using an IR microscope.
2.6.2 Applications of FTIR imaging in ATR and transmission modes
Approaches and applications of FTIR imaging in both ATR and transmission modes
have been developed for a broad range of materials and chemical systems. It has been
demonstrated that ATR-FTIR imaging has the potential for greatly improved spatial
resolution compared to conventional transmission microscopy, with the achieved
spatial resolution of FTIR imaging being beyond the diffraction limit for IR light in
air.117 As a consequence, this development has opened up many new areas amenable
to study, which were previously ruled out by the inadequate spatial resolution – for
example, studying the distribution of a drug in a tablet or imaging the cross-section of
a human hair without recourse to a synchrotron.
In one of the first reports on the application of ATR-FTIR imaging, a sample of a
polymer blend [polyamide 6.6, poly(tetrafluoroethylene) and silicon oil] was analysed
using both FTIR imaging in transmission and ATR modes, and the results were
compared.119 Moreover, these studies represented the first occasion that chemical
images obtained by both FTIR imaging and Raman microspectroscopy for the same
samples had been compared. The chemical images of the same sample were also
compared to the results obtained with scanning electron microscopy, energy-
dispersive X-ray spectrometry and microthermal imaging analysis. Remarkably, this
direct comparison between four different imaging techniques resulted in an excellent
agreement between them. The agreement between FTIR images obtained by

Chapter 2: Literature review
- 59 -
transmission and ATR was helped by the fact that the thickness of the polymer film
was 5 μm. It was also highlighted in that report that, because of the limited
penetration of the evanescent wave into the sample, the images obtained by the ATR-
FTIR method would only reflect the composition of the surface layer, 1–3 μm of the
sample, depending on the type of ATR crystal employed, the angle of incidence and
the wavelength of the light.119 However, it was also noted that the small thickness of
the probed layer in ATR imaging might also be advantageous. For example, imaging
in transmission may averages through the thickness of the sample, and microtoming
of samples is usually required to obtain thicknesses less than the domain size in order
to ensure that imaging in transmission does not result in the production of spurious
images.120 The differences between the two FTIR imaging modes (transmission and
ATR), when discussed in more detail, were the advantages and limitations of the
particular imaging mode in terms of spatial resolution, the image field of view (FOV)
and possible artefacts.120
2.6.3 Approaches to acquire ATR-FTIR images
Previously, it was difficult to obtain ATR-FTIR images without the use of an FPA
detector because, when using the mapping approach, the crystal is in contact with the
sample during the measurement, such that the sample might be deformed and the
distribution of different components in the mixture altered. Furthermore, if the crystal
remains in contact with the sample during translation from one measuring location to
another, smearing of the sample – or even its physical damage – might reduce the
reliability of the ATR method for mapping. Yet, if the crystal is detached from the
sample when moving from one measuring point to another, then the time required to
acquire a single map will be extended and the multiple contacts between the crystal
and sample might cause damage to the sample. As a consequence, Esaki et al. have
developed a new ATR crystal with a hexagonal shape that allows ATR mapping, but
without the problems stated above.121 Here, the crystal is translated with the sample
attached, while the size of the ATR map is limited only by the size of the crystal used
(ca. 2 mm × 7 mm map). As a specific ATR crystal is required for this type of
measurement, it is currently not as widely available as hemispherical crystals.122
Lewis et al. have demonstrated ATR mapping with a hemispherical germanium (Ge)
crystal on a photographic film laminate.123 Their study involved mapping an image by

Chapter 2: Literature review
- 60 -
translating the ATR crystal together with the sample, such that there was no smearing
of the sample. However, while this method eliminated any potential damage to the
sample, it remained a relatively long process for mapping a relatively small area.
Recently, this ATR mapping approach has been further developed by the use of a
linear array detector rather than a single-element detector.124 While this new
development speeds up the mapping process to a point where it could rival the FPA
approach,125 it also has some other advantages over the FPA detector, such as a more
flexible imaging size (up to ca. 600 μm before significant optical aberration takes
place) and a larger spectral range in the lower wavenumber spectral region (down to
700 cm−1). However, the inability to acquire all of the spectra simultaneously would
serve as a limitation when studying dynamic systems. The spatial resolution and depth
of penetration of this approach are variable across the imaged area, however, further
optimisation of the method is still in progress. When using the FPA detector and a
stationary ATR crystal, all spectral information across the whole imaging area is
captured simultaneously.126 The snap-shot feature of this FPA imaging approach
enables the study of dynamic systems, such as drug dissolution,127, 128 parallel analysis
of many samples in a high-throughput manner,129-132 studies of biopolymers and
biomedical systems133-138 and diffusion processes in situ139-143. FTIR imaging in
transmission has been used in many polymer applications,128, 144-147 with recent
exciting applications including micro patterning reactions148. As there is no rastering
with a fixed ATR crystal, the imaging area or FOV is defined by the size of the FPA
and the optics. Patterson et al.125 have shown that it is possible to combine FPA
imaging and mapping methods by using the translating ATR crystal to image a larger
area of the sample. However, in this approach due to the design of the crystal, there is
a trade off between the size of the sampling area measured and the spatial resolution
obtained. Chan and Kazarian have recently combined mapping and imaging to acquire
chemical images with a larger FOV while maintaining the spatial resolution of the
system.149 These approaches, as with other mapping methods, are limited to the study
of static systems.
Another approach to obtain flexibility in imaging with different FOVs, without
sacrificing the ability to study dynamic systems, is to employ different optical
arrangements or to use different sizes of detector. With this option, the number of
Chapter 2: Literature review
- 61 -
pixels measured per image and the FOV is defined by the number of pixels of the
detector, the size of each pixel, and the optics used to project the image onto the
detector. Today, a range of different sizes of FPA detectors are available
commercially, from 32 × 32 to 256 × 256. While the earlier versions of the FPA
detector had a pixel size of approximately 62 μm, with a relatively slow performance,
the new-generation FPA detectors may have a pixel size of ca. 40 μm and are up to
10-fold faster in operation. However, FPA detectors are often expensive, the choice of
detector size is still limited, and switching between detectors requires an alignment
procedure to be carried out which often is not preferable. It is, therefore, logical to
obtain the flexibility in FOV by using different optical arrangements. When
considering a new 64 × 64 FPA detector (pixel size ca. 40 μm), and with no
magnification, the FOV of the image would be approximately 2.6 mm × 2.6 mm. In
an IR microscope equipped with a 10× Ge ATR objective, the magnification would be
40×, and hence the theoretical image size would be 65 μm × 65 μm (measured image
size of 50 μm × 50 μm using the old FPA with a 20× Ge ATR). Although the image
size is relatively small, a high spatial resolution (4 μm) can be achieved. It is
important that the value of the achieved spatial resolution is obtained using the
stringent test of measuring the distance between the 5 % to 95 % points on an
absorbance profile, obtained through a sharp interface between two materials with
similar refractive indices,117 rather than artificial resolution markers that use reflective
and transparent features.
There is a small degree of flexibility in the FOV when using different objectives and
FPA detectors, although the range would be rather small unless a rastering or mapping
approach were to be adapted (as discussed above). For imaging with a larger FOV
using a stationary ATR crystal, the IR light is directed to a large sample compartment
instead of to the IR microscope. This chamber allows different accessories to be used;
specifically, ATR accessories with an inverted prism can be employed that make
measurements more convenient for many applications. The optical arrangement using
an inverted prism is shown schematically in Figure 2-14. When using an inverted
prism diamond ATR accessory, it has been shown that the FOV is approximately 500
μm × 700 μm (ca. 5× magnification117). For the inverted prism ZnSe ATR accessory,
which does not contain any lenses (e.g., Oil Analyzer; Specac, UK)127, the FOV
becomes approximately 2.6 mm × 3.6 mm, with the change in the imaging aspect

Chapter 2: Literature review
- 62 -
ratio being related to the geometry of the prism and the angle of incidence.117 Other
novel developments include a new diamond ATR accessory designed specifically for
imaging applications, an inverted prism ZnSe ATR accessory with expanding
lenses150 and an accessory which allows ATR imaging with variable angles of
incidence151. The different FOVs and spatial resolutions of the ATR accessories are
summarised in Table 2-1.
Figure 2-14. Schematic diagram of the optical arrangement using an inverted ATR prism.
2.6.4 Spatial resolution
A good (high) spatial resolution allows one to reveal the true distribution of different
components in heterogeneous materials. In an imaging system that uses an ATR
objective together with an FPA, the spatial resolution is limited by the pixel size of
the FPA, the numerical aperture (NA) of the objective of the IR microscope and also
by the wavelength of the light.
When light enters a slit, diffraction occurs. The diffraction pattern is shown in Figure
2-15. The intensity of light is the highest in the centre lobe and decreases quickly
away from the centre in the fringes. For two spots to be just resolved, they have to be
separated by a distance r which is the minimum distance needed to distinguish the
two spots of light. This radius, r, is given by the Rayleigh criterion as;152
Evanescent wave
ATR Crystal
Sampling volume with a depth of few micrometers from the surface of the ATR crystal
Sample
IR radiation

Chapter 2: Literature review
- 63 -
1 22=
2NAλ.
r Equation 2-7
NA = n θsin Equation 2-8
λ is the wavelength of light, n is the refractive index of the medium and θ is half the
angular aperture. The spatial resolution described in spectroscopy is the distance 2r
which is the distance required to completely resolve two spots of light.117 This
theoretical spatial resolution is therefore limited by the wavelength of light and the
NA of the system. However, the achievable spatial resolution is approximately two to
four times lower than the calculated theoretical value due to other optical aberrations.
For mid-IR spectroscopy, the practical spatial resolution is ca. 5-20 µm.153
Figure 2-15. Schematic diagram of the diffraction pattern of light.
As stated in the Rayleigh Criterion, the spatial resolution depends on the NA of the
system which depends on the refractive index of the medium when θ is kept constant.
Chan and Kazarian measured an ATR-FTIR image of a cross-section of polyethylene
terepthalate (PET) embedded in epoxy resin. There is no inter-diffusion between this
interface thus it was a good test for spatial resolution. The spatial resolution obtained
from their experiment was ca. 4 µm for the wavelength of light of 6 µm as opposed to
the theoretical spatial resolution of 3 µm.117
Centre lobe
Secondary lobe
r-r

Chapter 2: Literature review
- 64 -
2.6.5 Quantitative ATR-FTIR Imaging
As with conventional ATR-FTIR spectroscopy, ATR-FTIR imaging results can be
analysed quantitatively, some recent examples include the study of tablet dissolution
in water. In this case, the concentration profiles of hydroxylpropylmethylcellulose
(HPMC) and niacinamide, at different stages of the dissolution process, were utilised
to provide an understanding of the drug release mechanism.154 Using this technique, it
was shown that the concentration profiles of different components could be obtained
with the partial least squares (PLS) method. Here, with concentration profiles readily
measurable, it is possible to monitor other parameters, such as diffusion type (i.e.,
Fickian versus non-Fickian mechanisms of diffusion). In situ ATR-FTIR
spectroscopic imaging has also been used to investigate the polymer interdiffusion of
poly(vinylpyrrolidone) (PVP) and poly(ethylene glycol) (PEG), under high pressure
CO2.155 The diffusion mechanism of the system was described based on the
spectroscopic imaging data, and it was found that CO2 molecules dissolved in the
polymeric system greatly enhanced the interdiffusion process. These two examples
have shown that valuable information can be acquired via ATR-FTIR spectroscopic
imaging studies, thus providing an aid for the development of new mathematical
models in the analysis of dynamic processes.
Quantitative analysis is made possible by employing the Beer–Lambert law shown in
Equation 2-5. In this way, a calibration curve can be produced, either by measuring
the absorbance of a number of samples of various known concentrations, or by
identifying the molar absorbtivity, ε, from reference sources and the path length in the
measurement. For transmission measurements, the path length is usually equal to the
thickness of the sample. In ATR measurements, this is to be taken as the effective
path length, and can be calculated using Equation 2-9 for nonpolarised light.151
5.02
1
222
1
222
1
22
1
2
22
1
22
1
22
1
2
sinsin112
sin2sin3cos
⎟⎟
⎠
⎞
⎜⎜
⎝
⎛⎟⎟⎠
⎞⎜⎜⎝
⎛−
⎥⎥
⎦
⎤
⎢⎢
⎣
⎡⎟⎟⎠
⎞⎜⎜⎝
⎛−⎟
⎟
⎠
⎞
⎜⎜
⎝
⎛⎟⎟⎠
⎞⎜⎜⎝
⎛+⎟
⎟
⎠
⎞
⎜⎜
⎝
⎛⎟⎟⎠
⎞⎜⎜⎝
⎛−
⎥⎥⎦
⎤
⎢⎢⎣
⎡⎟⎟⎠
⎞⎜⎜⎝
⎛+⎟⎟
⎠
⎞⎜⎜⎝
⎛−
=
nn
nn
nn
nn
nn
nn
nn
de
θθπ
θθθ
λ Equation 2-9

Chapter 2: Literature review
- 65 -
It has been reported that an absorbance gradient was observed across an ATR-FTIR
spectroscopic image when measuring a homogeneous paraffin oil using a FastIR ATR
accessory.156 The explanation for this phenomenon was that the angle of incidence
was not uniform across the imaging plane.156 Should the angle of incidence change
across the imaging plane, the effective path length will be different, and hence the
absorbance would not be the same, even if the concentration of the sample were
uniform as in the case of paraffin oil. Apparently, the alignment of the optics in the
accessory is crucial to the occurrence of this absorbance gradient effect,157 and
therefore it is important to ensure that the ATR accessories used in imaging studies
are well aligned if quantitative results are important to the study.
To demonstrate that the gradient effect can be removed in an aligned system, similar
experiments were performed by measuring a homogeneous sample of mineral oil
(refractive index ca. 1.48), using both the ZnSe ATR accessory and the diamond ATR
accessory (Supercritical Fluid Analyzer, Specac, UK). Both results showed a
relatively homogeneous distribution of the integrated absorbance in the range of
(1480-1420 cm-1) over the whole imaged area (Figure 2-16 and Figure 2-17). For the
ZnSe ATR accessory, the mean integrated absorbance was approximately 2.1 cm-1
with a standard deviation of ±0.09 cm-1, while for the diamond ATR accessory the
mean integrated absorbance was approximately 3.5 ± 0.26 cm-1. The remainder of the
statistical results are summarised in Table 2-2. Notably, the ZnSe ATR accessory had
a better SNR due to the intrinsic design of the equipment (a better throughput of
energy). The difference in mean integrated absorbance could be explained by the
difference in the average angle of incidence. It has been reported previously that for
some ATR accessories, the angle of incidence is not necessarily the same as the
specification provided by the manufacturer.158 Rather, it is very much dependent on
the alignment of the spectrometer and the ATR accessory, which may of course vary
from system to system. The findings presented in Figure 2-16 and Figure 2-17 are
important because they show that the acquisition of reliable quantitative imaging data
is possible with the use of macro ATR accessories.157 But, the findings also highlight
the fact that the choice of accessory and its alignment are crucial if such data are to be
obtained in this way.

Chapter 2: Literature review
- 66 -
Table 2-2. Statistical summary of the integral absorbance of mineral oil at the 1480-1420 cm-1 band.
Figure 2-16. ATR-FTIR image of mineral oil measured with a ZnSe ATR accessory showing the integrated absorbance at 1480-1420 cm-1. The histogram shows the integrated absorbance of each detector pixel.
Figure 2-17. ATR-FTIR image of mineral oil measured with a diamond ATR accessory showing the integrated absorbance at 1480-1420 cm-1. The histogram shows the integrated absorbance of each detector pixel.
2.6.6 Micro ATR-FTIR imaging
The main advantage of micro ATR imaging with the use of microscope objective is
the high spatial resolution images that can be achieved using this method. The high
refractive index of the ATR crystal used for this type of ATR imaging (which is 4 for
No.
of p
ixel
s
Integral absorbance
No.
of p
ixel
s
Integral absorbance
ZnSe DiamondRefractive Index 2.4 2.4Included no. of pixels 4009 4035Mean absorbance (cm-1) 2.1 3.5Standard deviation (cm-1) 0.09 0.26Upper limit (cm-1) 2.39 4.34Lower limit (cm-1) 1.87 2.68Excluded no. of pixels 87 61
ATR accessory
Chapter 2: Literature review
- 67 -
the Ge crystal) greatly increases the NA of the system and hence it is possible to
achieve spatial resolution beyond the diffraction limit of light in air compared to
imaging in transmission where the Ge crystal is not used.118, 159 High spatial resolution
FTIR images up to the diffraction limit can be obtained using a bright synchrotron
source.160, 161 However, images are obtained by rastering and this is usually a
relatively slow procedure and hence lacks the capability to study dynamic systems
while the spatial resolution is still limited by the diffraction of light travelling in air.
The SNR of the spectra collected, on the other hand, is often better than those
measured by FPA detectors and it can be a good complementary method. FTIR
images obtained with the use of an FPA detector in micro ATR mode can be obtained
within a few minutes of acquisition time and the achieved SNR is often sufficient for
most applications. With this advantage, micro ATR imaging enables the
measurements of small features which were not attainable before. The high resolving
power also enhanced the detection limits for heterogeneous materials.162 It opens a
range of new opportunities to study complex materials, polymer blends and
pharmaceutical tablets where the region of interest is often in the micrometer scale.117,
119, 133, 163-166
2.6.7 Macro ATR-FTIR imaging with a diamond accessory
In ATR-FTIR spectroscopy, the crystal used to create the internal reflection has to be
infrared transparent while the refractive index must be relatively high for the
measurement of a wide range of materials. One such material that has been widely
used is diamond. The hardness of diamond has proven to be a valuable property as a
high contact pressure between the sample and the crystal may be applied to improve
the reproducibility of the spectrum without damaging the crystal.167, 168 It also makes
studies of polymeric materials under a high pressure environment in situ possible.158,
169, 170 Recently, a diamond ATR accessory which was originally not designed for
imaging purposes has been shown to be applicable to acquiring FTIR images.117, 120,
171 Further development from this has led to the introduction of a new diamond ATR
accessory, the Imaging Golden Gate™ (Specac, UK), which is designed specifically
for imaging applications. The aspect ratio of the ATR images obtained using the
original diamond ATR accessory had to be corrected by a factor of 1.4 due to the

Chapter 2: Literature review
- 68 -
geometry of the ATR crystal and the angle of incidence of the infrared source.117 The
new design of the accessory incorporated a pair of ZnSe/Ge lenses and a new mirror
configuration patented by Specac 172 which corrects optical aberrations and the aspect
ratio of the images.
2.6.8 New versus old diamond ATR accessory
ATR-FTIR images of polydimethylsiloxane (PDMS) on a copper grid from the non-
imaging diamond ATR accessory with the old FPA detector and from the new
imaging diamond ATR accessory with the new FPA detector are shown in Figure
2-18. The images are based on the distribution of the absorbance of the spectral bands
at 1150-950 cm-1. The visible image of the copper grid used is shown in Figure 2-18c
and the distance between each square is ca. 63 µm. Chan and Kazarian 173 earlier
presented a similar experiment with the same imaging system but using poly(vinyl
acetate) pressed onto the same copper grid. They showed that the size of the chemical
image captured is approximately 820 µm × 1140 µm. Whereas with the imaging
diamond ATR accessory and new FPA detector, it can be observed that there are
about 9 squares in the x direction and 8.4 squares in the y direction thus the new
imaged area is ca. 570 µm × 530 µm. It also shows that the aspect ratio of the
measured area has improved from 1:1.4 to 1:1.1. The new image of the copper grid
not only showed a greater magnification but also appeared to be sharper and a better
resemblance of the 5× optical image of the grid.

Chapter 2: Literature review
- 69 -
Figure 2-18. ATR-FTIR images of a copper grid with a thick film of PDMS pressed behind measured using a) the ordinary and b) the new imaging diamond ATR accessory. c) the white light image of the copper grid measured with a 5× objective. Note that the measured area is different from the specification given by the
manufacturer of 650 µm × 650 µm. The aspect ratio and the magnification of the
measured area are largely dependent on the alignment of the system. In a typical IR
macro imaging system, the ATR accessory is placed in the large sample compartment
and its position can be adjusted along the path of the IR beam. To get a well-focused
image, the two most important parameters are the position of the objective lens in the
ATR accessory and the image distance which can be taken as the path distance of the
IR light from the objective lens to the FPA detector. Specifically to this imaging
system, the new ATR accessory was aligned slightly left of the default factory
position, which the Imaging Golden GateTM ATR accessory is designed for, and thus
may explain the slight deviation from the ideal aspect ratio and the increase in
magnification.
high
low
x y
b
c
a

Chapter 2: Literature review
- 70 -
2.6.9 Image processing: univariate and multivariate analysis
One of the ways to generate chemical images from the spectra measured is by plotting
the distribution of absorbance of the specific spectral band. Plotting the distribution of
the integrated absorbance of the specific band for all measured spectra within the
imaged area will produce an image corresponding to the variation of the absorbance
of the band across that area. According to the Beer-Lambert law, the image obtained
using the integration method represents the relative concentration of the component in
the imaged area. Univariate analysis provides a direct and one of the most
straightforward means of presenting the spectral data in a 2D contour map. However,
overlapping of spectral bands of different components may induce image artefacts for
this type of image analysis.174 Multivariate analysis aims at the extraction of
spectroscopic information from heterogeneous systems, where the spectral properties
of different components can be elucidated along their spectral distribution.175
A hyperspectral image is one where each pixel forms a continuous spectrum and in
relevance to the study here, is analogous to a chemical image. This dataset carries a
huge amount of information and a certain procedure is needed to obtain valuable
information of the sample. Gendrin et al. had given an overview of the different data
treatments, uivariate analysis and chemometrics in applications in the pharmaceutical
and biomedical fields.176 A processing flowsheet on a hyperspectral dataset has been
proposed on a practical application of samples to fully extract the information in a
relatively systematic way and this is shown in Figure 2-19. The methods to extract
distribution maps are purely mathematical calculations, thus spectral and spatial
artefacts like uneven surfaces, optical effects, computational noise and detector noise,
have to be removed to ensure a representative distribution map of the sample.
Hyperspectral imaging has the added advantage in spectral pre-processing as pixel-to-
pixel comparison can give the extra information for cleaning up the dataset. Spatial
masking is also a very useful way to selectively choose from within the hyperspectral
image to reduce noise and revealing fine spectra and spatial patterns. To obtain
distribution maps of chemical compounds in the sample, univariate and/or
multivariate analysis can be used depending on the type of samples being examined.
As mentioned before, univariate analysis is the simplest and most straightforward
method of obtaining a distribution map but it is limited to relatively simple and known
samples. In cases where system is complex, overlapped in characteristic spectral

Chapter 2: Literature review
- 71 -
bands or low concentration of chemical compound in the samples, multivariate
analysis is more appropriate for identifying fine spectral variations and for localising
chemical compounds.
Figure 2-19. The four steps in the processing workflow of a hyperspectral data cube.
Several multivariate techniques such as partial least square (PLS), classical least
square (CLS), principal components analysis (PCA) and factor analysis (FA) have
already been applied using FTIR spectroscopy in the field of pharmaceuticals,174, 175,
177-179 biomedicals,180-182 forensics 183, 184 and in the oil industry.185 There are also
many other analytical pathways already developed and they are available in
commercial chemometrics software packages. In relevance to the work here, only the
PCA and FA methods are briefly discussed.
Hyperspectral data cube
Pre processing to correct scattering effects • Baseline correction • Normalisation
Extraction of distribution maps • Image at a specific wavelength • Chemometrics: CLS, PCA, PLS, etc
As appropriate: post processing • Image smoothing and filtering • Contrast enhancement
Extraction of quantitative parameters • Particle sizes • Concentration of chemical species • Assessment of homogeneity

Chapter 2: Literature review
- 72 -
A datacube, D, consisting of na × mb × λc is transformed into a 2D matrix, X, where X
= ((na × mb) × λc) = (I × λc). na and mb are the number of pixels in the spatial
dimension and λc consists of the datapoints in the spectrum which are determined by
the spectral range and the spectral resolution settings of the measurement. PCA uses
an algorithm which projects the large data space in the matrix X into a smaller space
that is easier to overview. This is shown in Equation 2-10 where Sa and La are the
score and loading values for the ath component and E is the residual matrix. The first
principal component, known as loading, is constructed to explain as much of the data
variance as possible. The second loading is constrained to be orthogonal to the first
and explaining the residual variance not taken into account of the first principal
component. This is illustrated in Figure 2-20. After this transformation, each column
of the score matrix is folded back to an image that represents the corresponding
loading in the right spatial dimension. Although PCA is useful to explain variance
across the dataset of spectra, the scores do not have any chemical meaning (they are
not spectra) as PCA loading also describe negatives values.
X = S1L1’ + S2L2’ + ... + SaLa’ + E Equation 2-10
Figure 2-20. Geometric visualisation of principal component analysis.176
FA is a method which builds on the underlying principles of PCA but seeks to
transform meaningless loading vectors to, single component absorption spectra. The
2D matrix, X, can be expressed as a sum of concentration vectors and pure component
spectra as shown in Equation 2-11 where Cm is the concentration of specie m and em is
Chapter 2: Literature review
- 73 -
the spectrum of specie m. The PCA transformation shown in Equation 2-10 can also
be represented as shown in Equation 2-12.
X =∑m Cmem Equation 2-11
X =∑j SjLj Equation 2-12
If the 2D matrix X can be factorised in terms of concentrations and spectra, then it
will be possible to find the transformations between Lj and em. A new factor loading is
calculated using an algorithm and the corresponding score images will then represent
the concentration profile of the various components in the sample. Thus the images
from FA not only show distribution of the different components, spectroscopic
information of the species is retained.
The last step of the flowsheet for processing a hyperspectral data cube is to extract
useful information from the distribution map obtained. This can be simply multiple
images showing the distribution of the different components. A useful imaging tool is
red-green-blue reconstruction. Assigning a compound to each of the colour plane, the
distribution of the three compounds can be displayed and compared simultaneously.
There are also other quantitative methods such as histogram analysis and particle size
analysis which can help interpreting the hyperspectral data. Histogram analysis can
give information regarding the heterogeneity of the sample by looking at the shape of
the figure it generates. Particle size analysis can generate statistics of the different
chemical compounds based on its individual distribution maps.
In crude oil and asphaltene systems, there is a huge diversity of chemical substances.
There are hundreds of different molecules and chemical structures in the sample thus
the resulting spectroscopic data most often shows a large number of features that can
be exploited to best effect only with the help of multivariate analytical tools. With
thousands of spectra in a single hyperspectral dataset, there are numerous methods to
extract useful information to better understand the complex system.
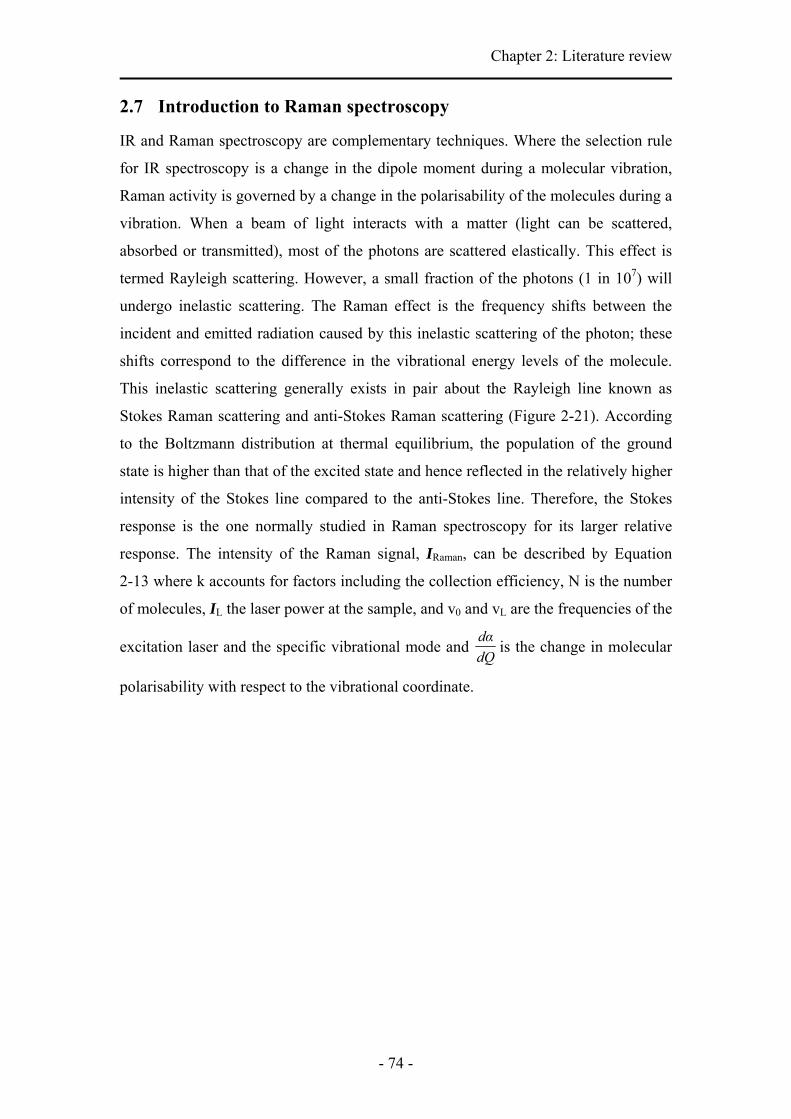
Chapter 2: Literature review
- 74 -
2.7 Introduction to Raman spectroscopy
IR and Raman spectroscopy are complementary techniques. Where the selection rule
for IR spectroscopy is a change in the dipole moment during a molecular vibration,
Raman activity is governed by a change in the polarisability of the molecules during a
vibration. When a beam of light interacts with a matter (light can be scattered,
absorbed or transmitted), most of the photons are scattered elastically. This effect is
termed Rayleigh scattering. However, a small fraction of the photons (1 in 107) will
undergo inelastic scattering. The Raman effect is the frequency shifts between the
incident and emitted radiation caused by this inelastic scattering of the photon; these
shifts correspond to the difference in the vibrational energy levels of the molecule.
This inelastic scattering generally exists in pair about the Rayleigh line known as
Stokes Raman scattering and anti-Stokes Raman scattering (Figure 2-21). According
to the Boltzmann distribution at thermal equilibrium, the population of the ground
state is higher than that of the excited state and hence reflected in the relatively higher
intensity of the Stokes line compared to the anti-Stokes line. Therefore, the Stokes
response is the one normally studied in Raman spectroscopy for its larger relative
response. The intensity of the Raman signal, IRaman, can be described by Equation
2-13 where k accounts for factors including the collection efficiency, N is the number
of molecules, IL the laser power at the sample, and v0 and vL are the frequencies of the
excitation laser and the specific vibrational mode and dQαd
is the change in molecular
polarisability with respect to the vibrational coordinate.
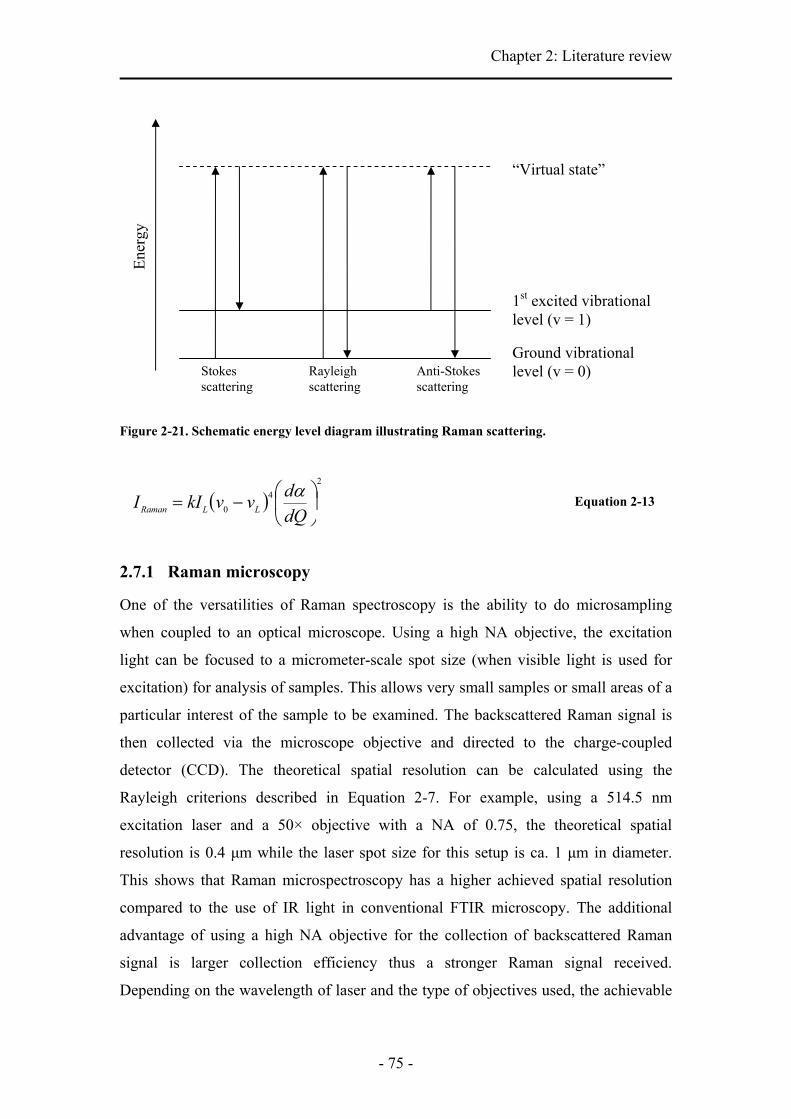
Chapter 2: Literature review
- 75 -
Figure 2-21. Schematic energy level diagram illustrating Raman scattering.
Equation 2-13
2.7.1 Raman microscopy
One of the versatilities of Raman spectroscopy is the ability to do microsampling
when coupled to an optical microscope. Using a high NA objective, the excitation
light can be focused to a micrometer-scale spot size (when visible light is used for
excitation) for analysis of samples. This allows very small samples or small areas of a
particular interest of the sample to be examined. The backscattered Raman signal is
then collected via the microscope objective and directed to the charge-coupled
detector (CCD). The theoretical spatial resolution can be calculated using the
Rayleigh criterions described in Equation 2-7. For example, using a 514.5 nm
excitation laser and a 50× objective with a NA of 0.75, the theoretical spatial
resolution is 0.4 μm while the laser spot size for this setup is ca. 1 μm in diameter.
This shows that Raman microspectroscopy has a higher achieved spatial resolution
compared to the use of IR light in conventional FTIR microscopy. The additional
advantage of using a high NA objective for the collection of backscattered Raman
signal is larger collection efficiency thus a stronger Raman signal received.
Depending on the wavelength of laser and the type of objectives used, the achievable
Ener
gy
“Virtual state”
Ground vibrational level (v = 0)
1st excited vibrational level (v = 1)
Anti-Stokes scattering
Stokes scattering
Rayleigh scattering
( )2
40 ⎟
⎠
⎞⎜⎝
⎛−=dQdvvkII LLRaman
α

Chapter 2: Literature review
- 76 -
spatial resolution, the local energy and resulting heating effect and photochemical
damage of the sample can be controlled.
2.7.2 Confocal Raman microscopy
By extending the underlying principal of confocal microscopy, it is possible to obtain
Raman measurements at different depth locations in a sample. Utilising a confocal
pin-hole, in the optical design, only the Raman signal originating from a small
sampling volume will reach the detector. The stray scattered light originating from the
out of focus region of the sample will be rejected as shown in Figure 2-22. The
confocal ability of this technique allows the depth profile characterisation of materials
with minimum sample preparation and discrimination of well-defined regions in the
sample.186-189 The depth resolution of this approach using a dry, metallurgical
objective is affected by the refraction effect caused by the difference in refractive
indices between the sample and the air in this type of objective.190-193 However, the
resolution in this axis can be very much improved by using an oil immersion objective
where light travels in a oil medium with a refractive index similar to the refractive
index of the sample.194
Figure 2-22. Schematic diagram of the confocal operation in a Raman probe.195
Chapter 2: Literature review
- 77 -
2.7.3 Fluorescence
Fluorescence is one of the main problems encountered in Raman spectroscopy for
certain samples. When the energy of the excitation photon gets close to the transition
energy between two electronic states, fluorescence may be generated. This effect is
often much more intense than the Raman response and the time scale is in the range of
10-9 s compared to Raman response which is within the time scale of 10-12 s or less.
Hence, Raman spectra can be totally or largely hidden under the fluorescence bands
of the sample itself or its trace contaminants. One approach to remove the effect of
fluorescence caused by impurities within the sample is by photobleaching. However,
this method is limited as it is sample specific and may cause photochemical damage to
the sample.
The other approach is to use a different wavelength excitation laser to move out from
the spectral zone where fluorescence occurs. For example, Fourier transform (FT)
Raman spectroscopy has been used frequently for samples that exhibit laser-induced
fluorescence due to the recent advancements in instrumentation. It utilises a Nd:YAG
laser with a wavelength of 1064 nm. However, there is an overall loss of signal due to
the λ4 dependence of the scattering process (Equation 2-13). In addition, using the
Nd:YAG laser to excite a FT-Raman response will mean studying the sample at
elevated temperature (>150 °C). The thermal blackbody emission from the sample
will increase, thus reducing the SNR obtained. The other option is to use an ultraviolet
excitation laser to avoid the fluorescence. It has been shown that aromatic organic
compounds show little fluorescence with a UV excitation wavelength of below 260
nm.196 Benzene, the smallest aromatic molecule, shows significant fluorescence from
its excited singlet state at wavelength >260 nm. Larger aromatics show absorption
bands below 260 nm but excitation into these bands results in fast internal conversion
of this energy into lowest singlet of triplet excited state thus fluorescence occurs at
much longer wavelengths.196 In addition, at a higher excitation frequency, the
scattering efficiency is very much improved according to Equation 2-13 and hence a
stronger Raman signal intensity. However, the complication at this higher excitation
energy is photochemical damage to the sample.

Chapter 2: Literature review
- 78 -
2.7.4 Raman spectroscopy of carbonaceous materials
One of the earliest Raman spectra of diamond, shown in Figure 2-23, was obtained by
the Nobel laureate in physics this technique was named after, Sir Chandrasekhara
Venkata Raman in 1957. Advances in instrumentation have allowed a much faster and
more convenient approach to acquiring a Raman spectrum. In the Raman spectra of
carbonaceous materials, the main information that can be extracted from Raman
spectra is about the core carbon structures by taking reference to a graphitic lattice.
The typical carbon structures in carbonaceous hydrocarbons such as coal tar, pitch,
asphaltenes, minerals and ores consist of PAHs. In Raman spectra, this polycyclic
aromatic structure corresponds to two bands in the region of 1350-1365 cm-1 and
1580-1620 cm-1. The former is called the D band and the latter is called the G band.
The G band, often called the graphite band, at about 1600 cm-1 is assigned to the E2g
C-C stretching mode of a graphite crystal (Figure 2-24a). For carbonaceous materials,
this mode corresponds to both the stretching vibration of the sp2 carbon atoms in the
hexagonal sheet as well as in the chains. The D band can be assigned to the breathing
mode of A1g symmetry (Figure 2-24a) involving phonons between the K and M zone
boundaries.40, 197 This mode is not allowed in a perfect graphite structure and only
becomes active in the presence of disorder. The intensity and frequency of the D band
is very much sensitive to the excitation energy of the laser (Figure 2-25).198 The
position of the D band shifts to a higher wavenumber and the intensity decreases with
lower wavelength of the excitation laser used.197, 198
Figure 2-23. Raman spectrum of diamond recorded photographically.199

Chapter 2: Literature review
- 79 -
Figure 2-24. Carbon motions in the a) E2g G mode and b) A1g D breathing mode.197 Note that the G mode is just due to the relative motion of sp2 carbon atoms and can be found in chains as well.
Figure 2-25 Raman spectra of graphite excited by laser of different energy198
Although Raman spectroscopy has been a popular non-destructive technique to study
graphite-like or diamond-like PAH materials, only a few studies were done on
asphaltenes. One of the Raman studies is the used of a synchrotron based X-ray
source applied to a series of standard PAHs and several asphaltenes.54 It was shown
that X-ray Raman spectroscopy could probe the geometry of the aromatic ring
systems in asphaltenes, as well as its ratio of aromatic and aliphatic constituents. They
reported that the aromatic fraction of the carbon in asphaltene molecules consist of
about seven aromatic rings and an asphaltenic system has a small double bond to
sextet (benzene ring) ratio. However, as a synchrotron based source is needed, this
technique is not readily available.
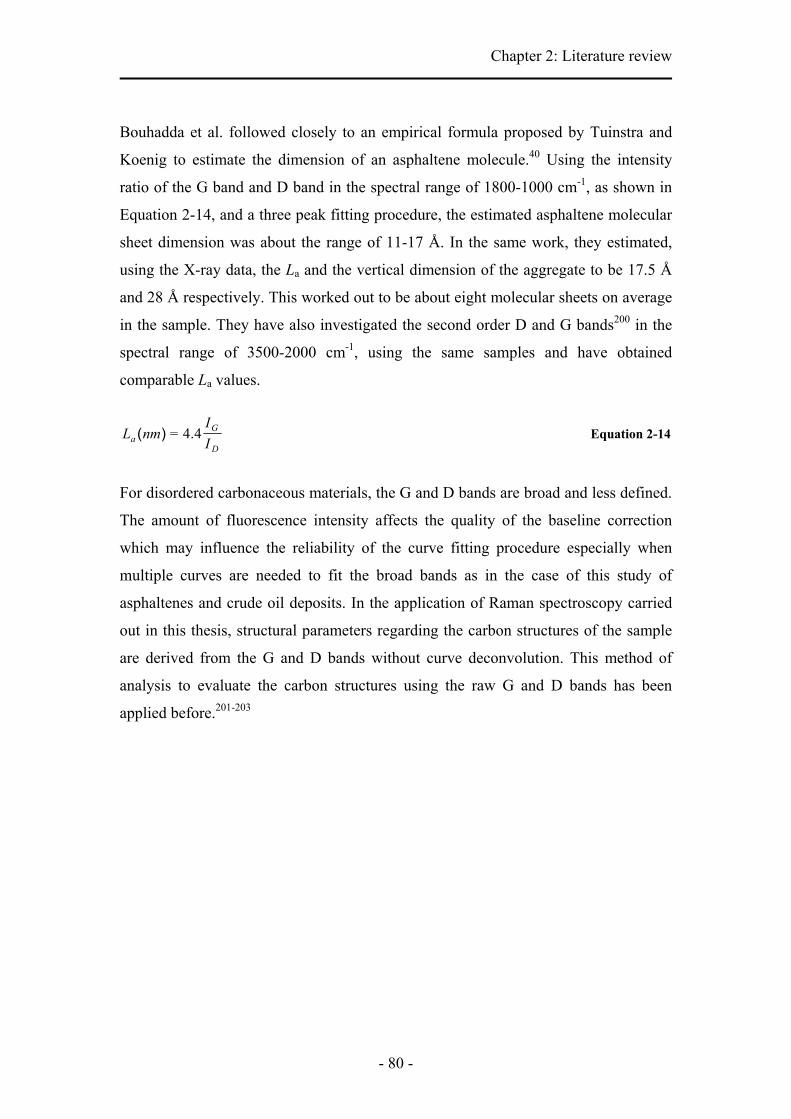
Chapter 2: Literature review
- 80 -
Bouhadda et al. followed closely to an empirical formula proposed by Tuinstra and
Koenig to estimate the dimension of an asphaltene molecule.40 Using the intensity
ratio of the G band and D band in the spectral range of 1800-1000 cm-1, as shown in
Equation 2-14, and a three peak fitting procedure, the estimated asphaltene molecular
sheet dimension was about the range of 11-17 Å. In the same work, they estimated,
using the X-ray data, the La and the vertical dimension of the aggregate to be 17.5 Å
and 28 Å respectively. This worked out to be about eight molecular sheets on average
in the sample. They have also investigated the second order D and G bands200 in the
spectral range of 3500-2000 cm-1, using the same samples and have obtained
comparable La values.
D
Ga I
InmL 44= .)( Equation 2-14
For disordered carbonaceous materials, the G and D bands are broad and less defined.
The amount of fluorescence intensity affects the quality of the baseline correction
which may influence the reliability of the curve fitting procedure especially when
multiple curves are needed to fit the broad bands as in the case of this study of
asphaltenes and crude oil deposits. In the application of Raman spectroscopy carried
out in this thesis, structural parameters regarding the carbon structures of the sample
are derived from the G and D bands without curve deconvolution. This method of
analysis to evaluate the carbon structures using the raw G and D bands has been
applied before.201-203

- 81 -
CHAPTER THREE
EXPERIMENTAL APPARATUS AND
INSTRUMENTATIONS
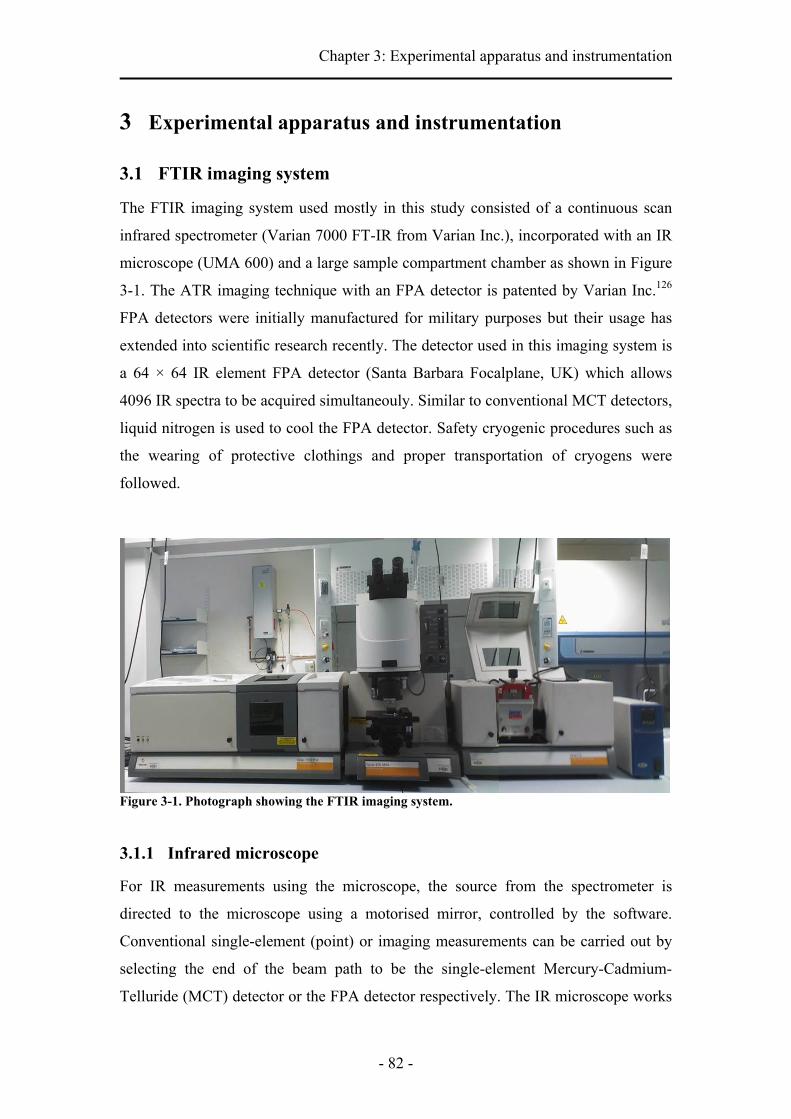
Chapter 3: Experimental apparatus and instrumentation
- 82 -
3 Experimental apparatus and instrumentation
3.1 FTIR imaging system
The FTIR imaging system used mostly in this study consisted of a continuous scan
infrared spectrometer (Varian 7000 FT-IR from Varian Inc.), incorporated with an IR
microscope (UMA 600) and a large sample compartment chamber as shown in Figure
3-1. The ATR imaging technique with an FPA detector is patented by Varian Inc.126
FPA detectors were initially manufactured for military purposes but their usage has
extended into scientific research recently. The detector used in this imaging system is
a 64 × 64 IR element FPA detector (Santa Barbara Focalplane, UK) which allows
4096 IR spectra to be acquired simultaneouly. Similar to conventional MCT detectors,
liquid nitrogen is used to cool the FPA detector. Safety cryogenic procedures such as
the wearing of protective clothings and proper transportation of cryogens were
followed.
Figure 3-1. Photograph showing the FTIR imaging system.
3.1.1 Infrared microscope
For IR measurements using the microscope, the source from the spectrometer is
directed to the microscope using a motorised mirror, controlled by the software.
Conventional single-element (point) or imaging measurements can be carried out by
selecting the end of the beam path to be the single-element Mercury-Cadmium-
Telluride (MCT) detector or the FPA detector respectively. The IR microscope works

Chapter 3: Experimental apparatus and instrumentation
- 83 -
in a similar way to an optical microscope where the light path can be set to
transmission mode or reflection mode. The IR beam comes from the bottom of the
stage to the IR detector in transmission mode and comes from the objective when it is
set to reflection mode. In ATR mode, the Ge crystal is attached onto a mounting and
inserted into the ATR objective of the microscope as shown in Figure 3-2. The area of
interest is first located without the Ge mounting in visible mode. The mounting is
inserted back to the objective and the stage can be raised to bring the sample in
contact with the Ge crystal. The contact pressure can be measured and regulated by
having an electronic balance on the stage.
Figure 3-2. Photographs showing a) the IR microscope, b) the micro ATR objective and c) the Ge ATR crystal.
3.1.2 Large sample compartment
IR measurements with a larger FOV are carried out in a large sample compartment as
shown in Figure 3-3. The IR beam passed through microscope, enters the sampling
compartment and get focused onto the FPA detector. Section 2.6.3 has described the
numerous accessories that can be used to acquire an image with different FOV and
a) b)
c)
Ge crystal

Chapter 3: Experimental apparatus and instrumentation
- 84 -
spatial resolution. The work done in this study uses mainly the Imaging Golden
Gate™ with a diamond crystal embedded in tungsten carbide as shown in Figure 3-3b.
Figure 3-3. Photograph showing a) the large sample compartment for macro ATR measurement and b) the Imaging Golden Gate™ accessory which is connected to a heat controller.
3.2 Sampling procedure
The sampling procedure for ATR-FTIR spectroscopy is generally simple. A sample is
placed on the ATR crystal and the software is used to start the measurement. However,
the contact is imperative in obtaining reliable and reproducible FTIR images of the
sample. The samples studied mostly in this thesis are mostly hard, rigid solid particles
for which it is challenging to obtain good contact between the sample and ATR
crystal. Removal of the samples is as important as depositing a good sample on the
ATR crystal. The samples studied are mostly insoluble in common cleaning solvent
like ethanol and acetone. Depending on the type of materials being studied, strong
solvents like chloroform are used to remove the samples and to clean the crystal prior
to the next measurement. The following procedures have been developed in macro
and micro ATR modes so that reproducible and reliable spectroscopic information can
be obtained.
3.2.1 Macro ATR approach
In the macro ATR approach, the diamond ATR accessory is mostly used. Samples
were deposited in a compaction cell204 as shown in Figure 3-4 and a punch was used
a) b)
diamond crystal
heat controlleranvil
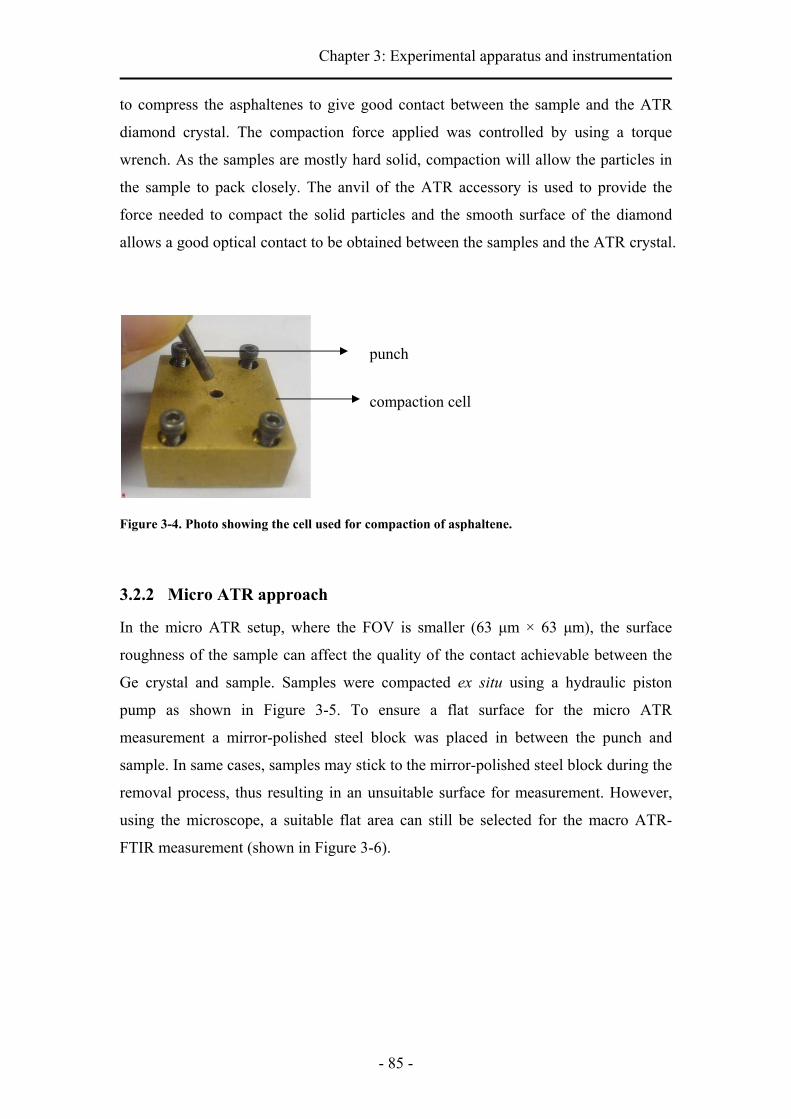
Chapter 3: Experimental apparatus and instrumentation
- 85 -
to compress the asphaltenes to give good contact between the sample and the ATR
diamond crystal. The compaction force applied was controlled by using a torque
wrench. As the samples are mostly hard solid, compaction will allow the particles in
the sample to pack closely. The anvil of the ATR accessory is used to provide the
force needed to compact the solid particles and the smooth surface of the diamond
allows a good optical contact to be obtained between the samples and the ATR crystal.
Figure 3-4. Photo showing the cell used for compaction of asphaltene.
3.2.2 Micro ATR approach
In the micro ATR setup, where the FOV is smaller (63 μm × 63 μm), the surface
roughness of the sample can affect the quality of the contact achievable between the
Ge crystal and sample. Samples were compacted ex situ using a hydraulic piston
pump as shown in Figure 3-5. To ensure a flat surface for the micro ATR
measurement a mirror-polished steel block was placed in between the punch and
sample. In same cases, samples may stick to the mirror-polished steel block during the
removal process, thus resulting in an unsuitable surface for measurement. However,
using the microscope, a suitable flat area can still be selected for the macro ATR-
FTIR measurement (shown in Figure 3-6).
punch
compaction cell

Chapter 3: Experimental apparatus and instrumentation
- 86 -
Figure 3-5 Hydraulic piston pump used to create flat surface for micro ATR-FTIR measurement
Figure 3-6 Visible image of asphaltenes surface after compaction by the hydraulic piston pump
3.2.3 Checking contact with “live” IR image
A calibrated “live” IR image is shown in Figure 3-7. The IR image calibration is a
function in the software of the imaging system which normalised the intensity of the
IR beam across all the pixels. This function aids the user to locate the sample to be
measured and can be used to check the contact between the ATR crystal and sample.
When only partial contact is established (Figure 3-7b) only some parts of the image
(blue) show a decrease in IR signal reaching the FPA detector. A larger contact
pressure can then be introduced to improve this contact as shown in Figure 3-7c.
Figure 3-7 Calibrated "live" IR image to check contact of sample with ATR crystal
No sample Partial contact Good contact (a) (b) (c)
punch
100 μm

- 87 -
CHAPTER FOUR
DEVELOPMENT OF ATR-FTIR
IMAGING APPROACH ON
CARBONACEOUS MATERIALS

Chapter 4: Development of ATR-FTIR imaging approach on carbonaceous materials
- 88 -
4 Development of ATR-FTIR imaging approach on
carbonaceous materials
This chapter presents the development and application of ATR-FTIR spectroscopic
imaging with an FPA detector to characterise carbonaceous materials such as crude
oil deposits and asphaltenes. This study utilises the ATR approach which has several
advantages as compared to other sampling methods such as reflection and
transmission. The small penetration depth of the ATR approach makes it a convenient
sampling method which requires only relatively simple sample preparation and can be
applied to highly absorbing materials such as carbonaceous hydrocarbons.
The first section of this chapter describes the development of a variable angle
diamond ATR accessory that enables the angle of incidence to be controlled. This not
only allows chemical images from subsurface layers of different thicknesses to be
obtained (Section 4.1), but it also can be used to correct distortions of IR spectral
bands that occur for high refractive index samples when using ATR approach (Section
4.2). A comparison, using ATR-FTIR imaging, between real deposited foulants and
laboratory-extracted asphaltenes is described in Section 4.3. Section 4.4 introduces a
statistical testing method to determine how many chemical images of the sample need
to be analysed before representative parameters for particle analysis can be obtained.
Finally, the application of ATR-FTIR imaging to study the in situ heating of crude oil
is demonstrated in Section 4.5.
4.1 A variable angle diamond ATR accessory
ATR-FTIR spectroscopy is known to be capable of obtaining depth profiles in a non-
destructive manner by changing the angle of incidence of the IR radiation. This type
of depth profiling has been demonstrated in a number of previous studies.205-212 The
application of this approach has been further extended by the demonstration of
combining a variable angle ATR accessory (not designed specifically for imaging
purpose) with a FPA detector to obtain images measured at different angles of
incidence. 3D information from the sample is readily obtained as the depth of
penetration for each imaging measurement is controlled by the angle of incidence.151
The main advantages of combining ATR-FTIR imaging with variable angles of
Chapter 4: Development of ATR-FTIR imaging approach on carbonaceous materials
- 89 -
incidence are the high depth resolution (which is not diffraction limited and depends
on the depth of the evanescent wave) and the rapid data acquisition (only a few
minutes per image) if depth profiling within a relatively small thickness range (from a
fraction to several micrometers) is required.
The previous study151 utilised a relatively large ZnSe crystal and slightly expanding
optics resulting in an imaging area of ca. 5 mm × 6 mm. However, due to the optical
design of the accessory, the lateral spatial resolution was relatively poor (ca. 100 µm).
ATR imaging with a diamond ATR accessory on the other hand gives a much better
lateral resolution (ca. 15-20 µm) due to the optics used to focus the IR light onto the
small diamond crystal.117 A new diamond ATR accessory specifically designed for
imaging purpose has recently become commercially available.172 Previous studies
have demonstrated the large number of possible applications of this highly versatile
ATR accessory for imaging studies due to the good spatial resolving power, the
desirable properties of diamond and the short (minutes to seconds) imaging
acquisition time.117, 155, 159, 171, 179, 213, 214 The complicated optical design of the
diamond ATR imaging accessory might be expected to limit the flexibility in
alteration of the angle of incidence without major changes to the original optics.
However, the high power lenses employed result in a relatively large numerical NA
and provide an opportunity to change the angle of incidence by selectively masking
different part of the light exiting the condenser lens. The idea is schematically
illustrated in Figure 4-1. In this work, it was demonstrated the possibility of ATR-
FTIR imaging using the diamond ATR accessory with different angles of incidence to
achieve imaging of a sample’s subsurface layers of different thickness. The image
quality and the possible image artefacts generated via this approach are discussed.

Chapter 4: Development of ATR-FTIR imaging approach on carbonaceous materials
- 90 -
Figure 4-1. Schematic diagram to show the position of the aperture for large and small angle of incidence set up.
4.1.1 Experimental
4.1.1.1 ATR-FTIR imaging
FTIR images were measured with an FTIR spectrometer in continuous scan mode
using a 64 × 64 FPA detector. Spectra with spectral resolution of 8 cm-1 were
Normal operation
Lenses Diamond crystal
IR beam
Aperture
Large angle of incidence set-up
Aperture
Small angle of incidence set-up
Aperture
Lenses
Front view of the lenses
Aperture
Lenses
Front view of the lenses
Chapter 4: Development of ATR-FTIR imaging approach on carbonaceous materials
- 91 -
collected with 50 co-additions for spectral averaging. The diamond ATR accessory
(Imaging Golden GateTM, Specac Ltd.), was placed in a large sample compartment
which is designed for FTIR imaging with large accessories. The diamond ATR crystal
is an inverted pyramid with a 4 mm2 square top surface and two rectangular side
surfaces with a face angle of 45°. The accessory was carefully aligned to ensure that
the imaging area is at the centre of the diamond ATR crystal and a homogeneous
focus is achieved. This is followed by optimising the illumination of the imaging area
to ensure, if possible, all areas are well illuminated. A background measurement with
the clean crystal was made for each of the angle of incidence set ups.
4.1.1.2 Lab-made apertures
Two 5 mm diameter circular apertures were constructed which can be mounted on the
condenser lens of the diamond ATR accessory. The first aperture was made such that
the aperture is situated approximately at the centre of the lens. The second aperture
was made ca. 6 mm vertically off centred. Three different angles of incidence can be
achieved by using these two apertures.
4.1.1.3 Calibration for the angle of incidence
Paraffin oil (n=1.473, Sigma Aldrich) was used as a reference sample for the
calibration of the angle of incidence. Images of the paraffin oil were measured with
the different apertures. The largest angle of incidence was produced by using the 6
mm off-centred aperture with the opening located close to the top of the lens. The
smallest angle of incidence was made by turning this aperture by 180°. The medium
angle of incidence was created by using the aperture with the opening at the centre.
The depth of penetration was calculated using the same approach as described in
Equation 2-6 the previous study.151 In brief, the effective thickness of the measurement
was obtained by comparing the absorbance measured at different angles of incidence
to the absorbance in a transmission measurement of known path length. By using the
formula as described in Equation 2-6, the angle of incidence can be calculated.
Chapter 4: Development of ATR-FTIR imaging approach on carbonaceous materials
- 92 -
4.1.1.4 Preparation of samples
A film of PDMS and a thin film of PVP were made as described in the previous
study.151 In brief, the PVP film was made by casting from a 0.5 mg.ml-1 solution of
PVP (K15, Sigma Aldrich) in ethanol directly onto the surface of the diamond. Thick
PDMS film (Sylgard 184, Sigma) was made by crosslinking the elastomer on a flat
surface according to the instruction specified by the manufacturer. A 3 μm thick
nickel wire grid with wire width of 12 μm and square spacing of 64 μm were
purchased from Precision Eforming LLC (New York, USA). The sizes of the wire and
the spacing were verified under a calibrated visible microscope with a 50× objective.
4.1.2 Results and discussion
Pure paraffin oil has been used as a reference material for the calibration of the angle
of incidence. The results of the paraffin oil measurements are shown in Figure 4-2a.
The same paraffin oil sample was used for each imaging measurement. The images
are generated by plotting the value of the integrated area under the absorbance band at
1460 cm-1 of each pixel on the X-Y plane. The grey scale has been adjusted to be the
same to facilitate direct comparison. The images clearly show that the absorbance of
the paraffin oil changs according to the angle of incidence. The image with the
aperture opening at the top of the lenses has shown the lowest absorbance. This was
expected as a large angle of incidence was used. Similarly, the image measured with
the aperture located at the centre of the lens shows a medium absorbance while the
image measured with the aperture located at the bottom of the lens shows the
strongest absorbance. The averaged spectra from the imaging data sets are shown in
Figure 4-2b which clearly demonstrates that the change in intensity in the image is a
result of a change in the band absorbances. An important observation from
Figure 4-2a is that the distribution of the absorbance of paraffin oil appears to be
homogeneous. The variation of the absorbance across the whole imaged area is less
than 5 % which is small enough for most applications. This is true even when the
angle of incidence is closer to the critical angle of the system where the value of the
absorbance would be the most sensitive to a spread of angles across the imaging area
if it does exist. The noise at the left edge of the image measured with the aperture at
the bottom of the lens is due to the weak illumination by IR light in those areas which
does not affect other areas of the image. A spread of angles of incidence over the
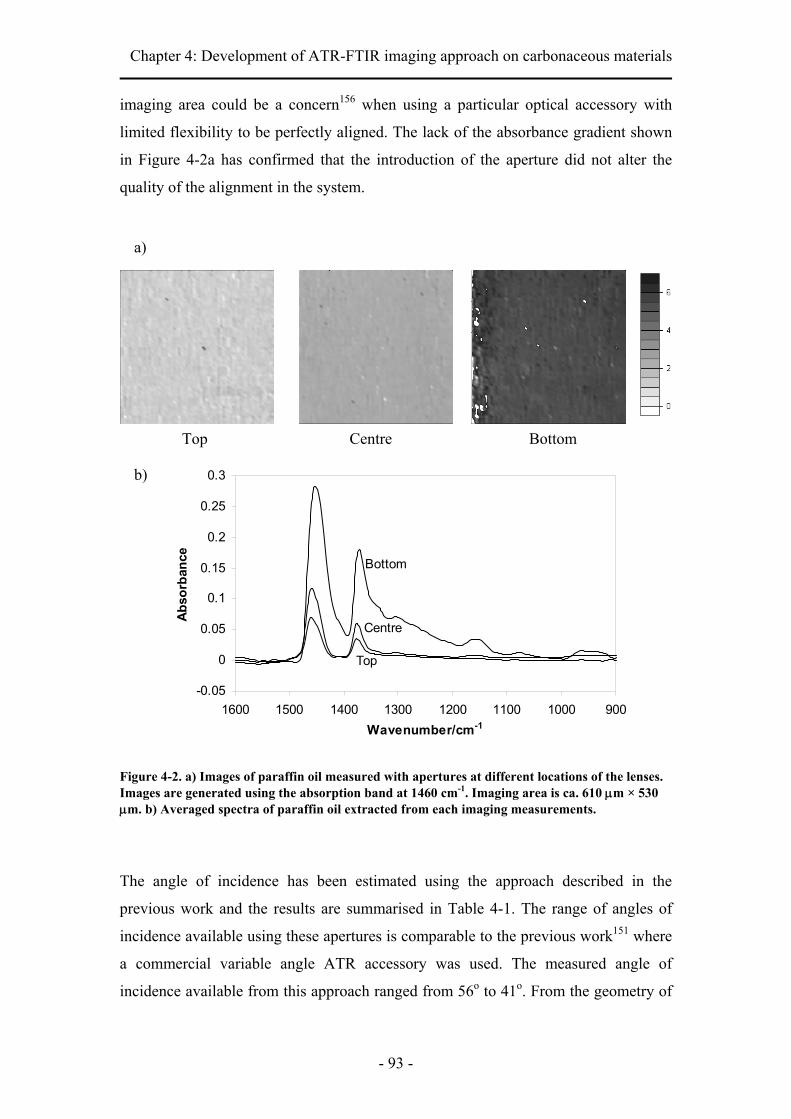
Chapter 4: Development of ATR-FTIR imaging approach on carbonaceous materials
- 93 -
imaging area could be a concern156 when using a particular optical accessory with
limited flexibility to be perfectly aligned. The lack of the absorbance gradient shown
in Figure 4-2a has confirmed that the introduction of the aperture did not alter the
quality of the alignment in the system.
Figure 4-2. a) Images of paraffin oil measured with apertures at different locations of the lenses. Images are generated using the absorption band at 1460 cm-1. Imaging area is ca. 610 μm × 530 μm. b) Averaged spectra of paraffin oil extracted from each imaging measurements.
The angle of incidence has been estimated using the approach described in the
previous work and the results are summarised in Table 4-1. The range of angles of
incidence available using these apertures is comparable to the previous work151 where
a commercial variable angle ATR accessory was used. The measured angle of
incidence available from this approach ranged from 56o to 41o. From the geometry of
Top Centre Bottom
a)
b)
-0.05
0
0.05
0.1
0.15
0.2
0.25
0.3
9001000110012001300140015001600Wavenumber/cm-1
Abso
rban
ce Bottom
Centre
Top
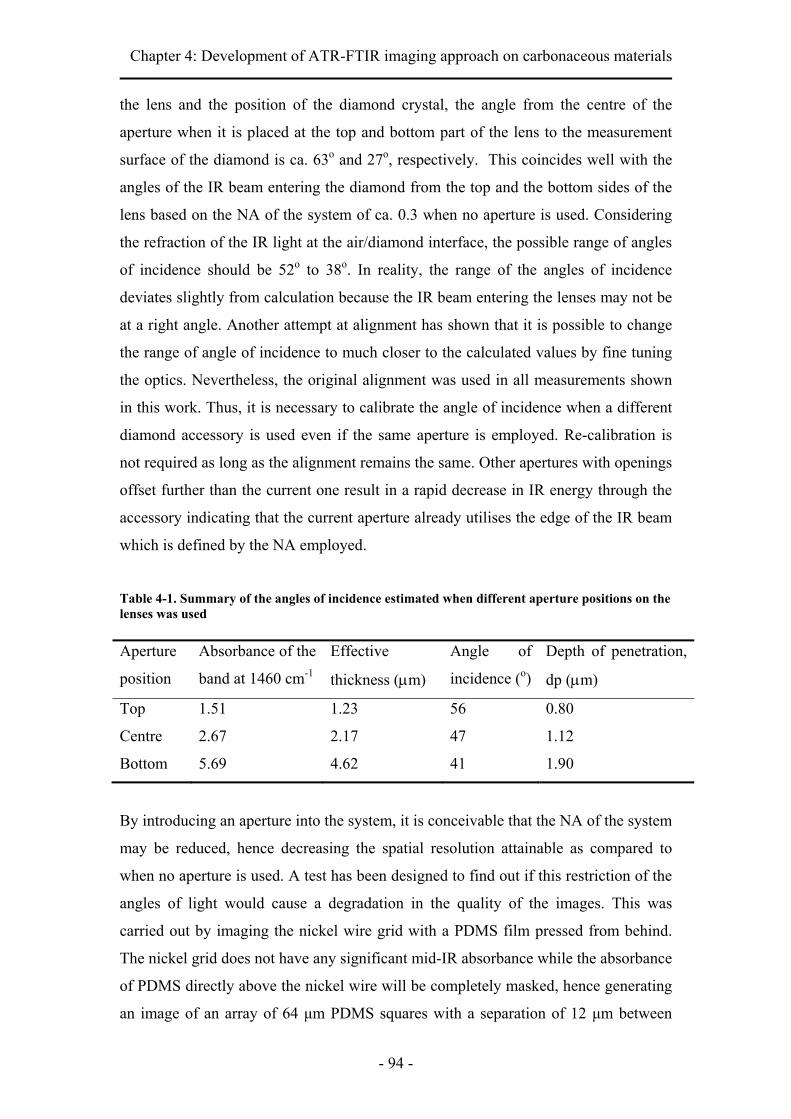
Chapter 4: Development of ATR-FTIR imaging approach on carbonaceous materials
- 94 -
the lens and the position of the diamond crystal, the angle from the centre of the
aperture when it is placed at the top and bottom part of the lens to the measurement
surface of the diamond is ca. 63o and 27o, respectively. This coincides well with the
angles of the IR beam entering the diamond from the top and the bottom sides of the
lens based on the NA of the system of ca. 0.3 when no aperture is used. Considering
the refraction of the IR light at the air/diamond interface, the possible range of angles
of incidence should be 52o to 38o. In reality, the range of the angles of incidence
deviates slightly from calculation because the IR beam entering the lenses may not be
at a right angle. Another attempt at alignment has shown that it is possible to change
the range of angle of incidence to much closer to the calculated values by fine tuning
the optics. Nevertheless, the original alignment was used in all measurements shown
in this work. Thus, it is necessary to calibrate the angle of incidence when a different
diamond accessory is used even if the same aperture is employed. Re-calibration is
not required as long as the alignment remains the same. Other apertures with openings
offset further than the current one result in a rapid decrease in IR energy through the
accessory indicating that the current aperture already utilises the edge of the IR beam
which is defined by the NA employed.
Table 4-1. Summary of the angles of incidence estimated when different aperture positions on the lenses was used Aperture
position
Absorbance of the
band at 1460 cm-1
Effective
thickness (μm)
Angle of
incidence (o)
Depth of penetration,
dp (μm)
Top 1.51 1.23 56 0.80
Centre 2.67 2.17 47 1.12
Bottom 5.69 4.62 41 1.90
By introducing an aperture into the system, it is conceivable that the NA of the system
may be reduced, hence decreasing the spatial resolution attainable as compared to
when no aperture is used. A test has been designed to find out if this restriction of the
angles of light would cause a degradation in the quality of the images. This was
carried out by imaging the nickel wire grid with a PDMS film pressed from behind.
The nickel grid does not have any significant mid-IR absorbance while the absorbance
of PDMS directly above the nickel wire will be completely masked, hence generating
an image of an array of 64 μm PDMS squares with a separation of 12 μm between

Chapter 4: Development of ATR-FTIR imaging approach on carbonaceous materials
- 95 -
them. Images of this grid were measured with and without the aperture which has an
opening at the centre. The images of the grid with the aperture mounted on the
condenser and objective lenses are also compared. The results are shown in Figure 4-3.
Images are generated by plotting the values of the integrated area under the PDMS
band at 1007 cm-1 across the imaging area. All images use the same grey scale. There
are 8 squares and 8 spaces in the horizontal dimension and 7 squares and 7 spaces in
the vertical dimension which gives an imaging area of ca. 610 μm × 530 μm. The
results have demonstrated that the introduction of the aperture at the condenser did
not degrade the imaging quality while the image became more blurred when the
aperture was placed on the objective lens. This difference may be related to
differences in the effective NA of the system with the aperture in different locations.
Figure 4-3. ATR-FTIR images of the PDMS/nickel wire grid with and without the aperture. Images are generated using the absorption band at 1007 cm-1. From the size of the square (64 μm2) and the spacing (12 μm), the imaging area is ca. 610 μm × 530 μm.
To demonstrate the possibility of obtaining chemical information from the sample as a
function of depth with this approach, a model sample was created with a ca. 2 μm
thick film of PVP attached to the diamond measuring surface followed by
sandwiching a thin nickel wire grid between the PVP film and a thick film of PDMS.
The spectral band at 1425 cm-1 has been used to characterise PVP while the spectral
bands at 1260 cm-1 and 1007 cm-1 have been used to characterise PDMS. The idea of
sandwiching the metal wire between the two polymers is to create a known regular
pattern which may be used to assess the quality of the image that is measured at some
“depth” inside the sample and to identify possible image artefacts that may arise from
the introduction of apertures. The results are shown in Figure 4-4. The PVP image
measured with the angle of incidence of 56° (first column, top image in Figure 4-4)
No apertureAperture at centre of
the condenser Aperture at centre of
the objectiveNo apertureAperture at centre of
the condenser Aperture at centre of
the objective

Chapter 4: Development of ATR-FTIR imaging approach on carbonaceous materials
- 96 -
showed the whole imaging area was covered with the PVP film. The distribution of
PVP was not completely uniform with some areas, such as the circled area, showing
stronger PVP absorbance than the others. Compared to the images generated using the
1260 cm-1 PDMS band, the pattern of PDMS through the nickel grid starts to appear
at the areas where the PVP absorbance is weaker while in the circled region (where
PVP absorbance is stronger) the PDMS pattern remains less obvious. This indicates
that the PVP film was thicker in the circled region. The image of PDMS generated
using the 1007 cm-1 band, on the other hand, showed some weak absorbance of
PDMS through the thicker layer of PVP in the circled region. A greater depth of
penetration for the 1007 cm-1 band is expected according to the relationship given by
Harrick114 as well as the fact that the 1007 cm-1 band is a stronger band than the band
at 1260 cm-1 (the depth of penetration is also a function of absorbance for an
absorbing material).210 Extracted spectra from the circled area measured at different
angles of incidence are shown in Figure 4-5. This result demonstrates the possibility
of obtaining chemical images from surface layers of different thickness using spectral
bands at different wavenumbers as well as varying the angle of incidence.
As the position of the aperture changed, the angle of incidence is also changed
accordingly. At the angle of incidence of 47° (the middle column of images in
Figure 4-4), the absorbance of PVP increased similar to the experiment with the
paraffin oil. Both PDMS images measured at this angle of incidence showed a clearer
image of the grid as the absorbance of PDMS increased. The grid image of PDMS at
1260 cm-1 in the circled area remains relatively blurred compared to the image of
PDMS at 1007 cm-1. At the angle of incidence of 41°, the PDMS grid became clear
even in the circled region for the image generated using the 1260 cm-1 band showing
that the evanescence wave is already probing information beyond the thickest region
of the PVP film. It is interesting to note that at this angle of incidence, the pattern of
the grid also start to appear in the PVP image. In the area where the nickel wire is
present, the PVP absorbance becomes weaker. One possible reason for this
observation was that the PVP film was slightly squeezed by the nickel wire with the
small pressure applied. This image is only visible when the angle of incidence is
reduced to 41°, demonstrating that the system is capable of obtaining information
from different depths of the sample.

Chapter 4: Development of ATR-FTIR imaging approach on carbonaceous materials
- 97 -
The image quality demonstrated in these images has shown that it is possible to
clearly resolve the nickel wire (which has a width of 12 μm) in images generated
using spectral bands at both 1260 cm-1 and 1007 cm-1. The spatial resolution obtained
with this approach is far superior to the spatial resolution in a previously
demonstrated approach with a commercial variable angle ATR accessory.151 However,
the good spatial resolution achieved with a diamond ATR accessory comes with the
smaller imaging area which makes these two approaches complementary to each other.
The image quality is comparable to the image obtained without the introduction of the
aperture despite the resulting reduction in the NA of the imaging optics. Another
advantage of this approach is that the aspect ratio and the magnification of the image
do not change upon a change in angle of incidence unlike the approach introduced
previously.151 The same area of the sample can be measured and compared directly as
demonstrated by the images of PDMS at different angles of incidence shown in
Figure 4-4. This could be an important feature for quantifying the distribution of
particular chemical substances in the axial direction by spectral subtraction of
chemical information obtained from shallower layers from spectral images obtained at
deeper layers, thus building up a truly 3D chemical image non-destructively.

Chapter 4: Development of ATR-FTIR imaging approach on carbonaceous materials
- 98 -
Figure 4-4. ATR-FTIR images of PVP (top row) and PDMS (bottom two rows). The band used to generate the image is listed on the left hand side. The angles of incidence used for each measurement are listed at the top of each column.
Figure 4-5. Spectra extracted from the locations indicated with asterisk marks in the images in Figure 4-4. A pure PVP spectrum is also shown in the figure.
47 °, dp=1.12 μm 56 °, dp=0.8 μm
PVP
(142
5 cm
-1)
PDM
S (1
007
cm-1
) PD
MS
(126
0 cm
-1)
41 °, dp=1.9 μm
* * *
0
0.2
0.4
0.6
0.8
1
1.2
1.4
1.6
1.8
2
9001100130015001700
Wavenumber/cm-1
Abs
orba
nce
dp = 1.9
dp = 1.12
dp = 0.8
Pure PVP

Chapter 4: Development of ATR-FTIR imaging approach on carbonaceous materials
- 99 -
4.1.3 Conclusion
The opportunity to obtain ATR-FTIR images of the same sample at the same location
with different depths of penetration using a diamond ATR imaging accessory has
been demonstrated. The new approach can be used to obtain 3D information from the
sample by changing the angle of incidence. The change of the angle of incidence
using the diamond ATR accessory was realised with a simple approach but the results
are highly reproducible. This approach involved the introduction of a movable
aperture to control angles of incidence within a certain range. Two samples have been
studied: one for the calibration of the angle of incidence while the other one
demonstrates the capability of obtaining 3D information using this approach. The
results have demonstrated that this imaging method can produce high quality images
with good spatial resolution. Squared features of PDMS film of 64 μm separated by
12 μm and placed ca. 2 μm above the measuring surface of the diamond crystal are
spatially resolved. Images of these squares of PDMS are only visible with deeper
depths of penetration but not with shallower depths of penetration. Since there is no
change in the position and the magnification of the image while changing the depth of
penetration, this approach provides the necessary tool for quantitative 3D imaging
with ATR-FTIR spectroscopy. This development using a versatile diamond ATR
accessory opens a range of new possibilities in spectroscopic imaging of different
materials. In relevance to the study of carbonaceous materials, this allows spectral
artefacts inherent to the ATR approach with high refractive index materials to be
corrected. This will be discussed in detail in the next section.

Chapter 4: Development of ATR-FTIR imaging approach on carbonaceous materials
- 100 -
4.2 Study of high refractive index petroleum heat-exchanger
deposits with ATR-FTIR spectroscopic imaging
4.2.1 Introduction
Chemical maps of crude oil deposits have been reported before using FTIR
spectroscopy with a synchrotron source measured in transflection mode.160 The
synchrotron source is ca. 1000 times brighter compared to an ordinary thermal source,
thus in microscopy the IR beam can be masked into a 5 μm spot using an aperture
without impairing the quality of the spectrum. However, this facility is expensive and
not widely available. Also, the chemical map was generated by raster scanning and it
is slower compared to a chemical image obtained using an FPA detector.163 ATR-
FTIR imaging with a FPA detector before has been compared to FTIR microscopy in
transmission with a synchrotron source and it was concluded that while the SNR is
much better when using the synchrotron, the spatial resolution is higher with micro
ATR-FTIR imaging due to the use of the ATR objective with a high refractive index
Ge.163 Thus, versatility and the opportunities offered by ATR-FTIR imaging are still
to be exploited in the characterisation of crude oil deposits.
In this section, the feasibility of applying ATR-FTIR imaging to study real crude oil
deposits from a refinery is addressed. These materials are often of high refractive
indices thus may result in spectral artifacts inherent to the ATR approach. The
variable angle diamond ATR accessory, introduced in Section 4.1, is shown in this
work to be able to obtain reliable ATR-FTIR spectra of high refractive index
materials, thus allowing carbonaceous materials to be studied using this technique.
The advantages of combining both the macro and micro ATR-FTIR imaging
approaches to characterise these materials are also discussed.
Chapter 4: Development of ATR-FTIR imaging approach on carbonaceous materials
- 101 -
4.2.2 Experimental
4.2.2.1 Samples
The crude oil deposits were obtained from a pre-heat train of a distillation column in a
refinery with inlet and outlet temperature at around 158 °C and 166 °C respectively.
The shut down procedure was standard thus the deposits were only exposed to
nitrogen and steam. The deposits were removed from the exchanger and sent to the
laboratory. They are labeled and referred as RFD.
4.2.2.2 ATR-FTIR spectroscopic imaging
Macro ATR-FTIR images were measured with a continuous scan FTIR spectrometer
using a 64 × 64 FPA detector. A diamond ATR accessory (Imaging Golden Gate™
(Specac, UK) was placed in a large sample compartment. The refractive index of
diamond is 2.4. The optics of the accessory utilises a pair of ZnSe/Ge lenses which
allow IR light to be focused onto the small diamond ATR crystal. The condenser lens
was modified with a lab-made aperture to only allow certain angles of incidence of
the IR beam to reach the diamond crystal. The aperture used and the alignment of the
imaging system, as described in Section 4.1, give an average angle of incidence of 56o
as supposed to 47o without any aperture. Spectra were collected from 3800 cm-1 to
900 cm-1 with a spectral resolution of 8 cm-1. 200 co-additions were acquired and each
measurement took less than 5 minutes.
Micro ATR-FTIR images were measured with a Bio-Rad FTS-60A coupled to the
UMA 600 IR microscope (Varian, Inc) using a 64 × 64 FPA detector. The ATR
crystal used here is Ge with a refractive index of 4. Spectra were collected from 4000
cm-1 to 875 cm-1 with a spectral resolution of 8 cm-1 and 256 co-additions.
4.2.2.3 Sampling technique
For the macro ATR measurement, the sample was placed on the top surface of the
ATR diamond crystal and compressed into a tablet using a compaction cell as
described in Section 3.2.1. As the samples are hard, compaction allows them to pack
closely so that good optical contact can be obtained between the samples and the ATR
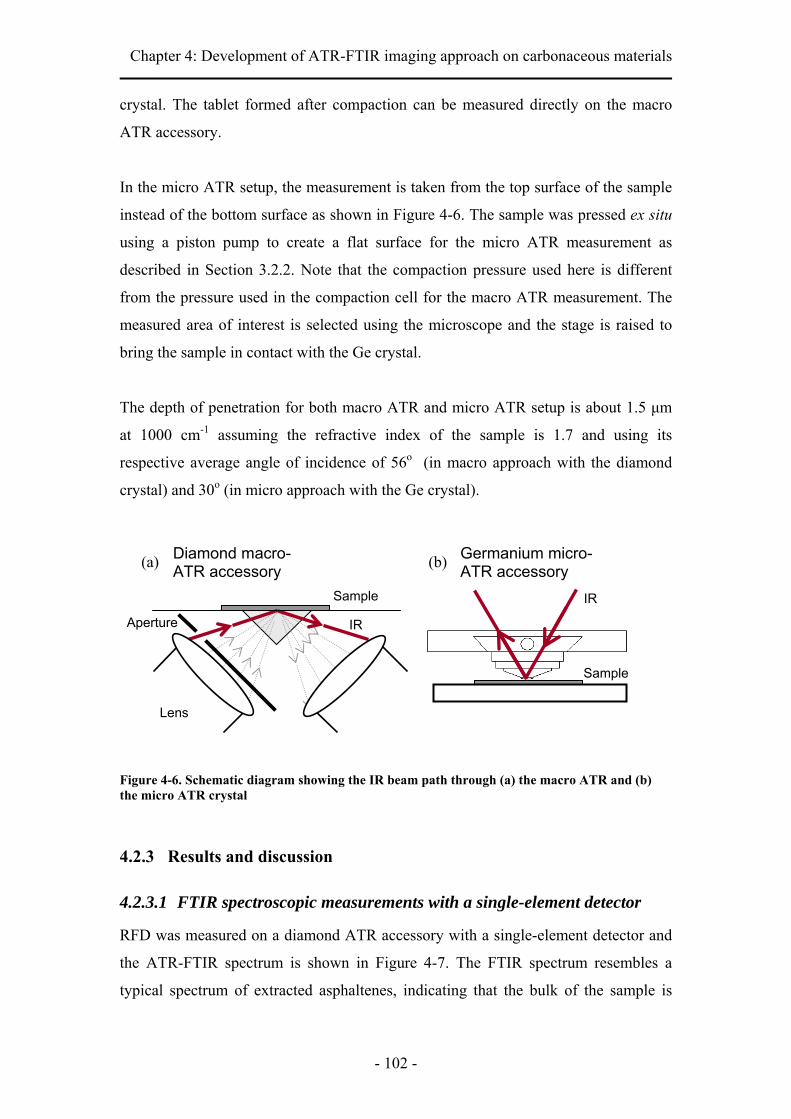
Chapter 4: Development of ATR-FTIR imaging approach on carbonaceous materials
- 102 -
crystal. The tablet formed after compaction can be measured directly on the macro
ATR accessory.
In the micro ATR setup, the measurement is taken from the top surface of the sample
instead of the bottom surface as shown in Figure 4-6. The sample was pressed ex situ
using a piston pump to create a flat surface for the micro ATR measurement as
described in Section 3.2.2. Note that the compaction pressure used here is different
from the pressure used in the compaction cell for the macro ATR measurement. The
measured area of interest is selected using the microscope and the stage is raised to
bring the sample in contact with the Ge crystal.
The depth of penetration for both macro ATR and micro ATR setup is about 1.5 μm
at 1000 cm-1 assuming the refractive index of the sample is 1.7 and using its
respective average angle of incidence of 56o (in macro approach with the diamond
crystal) and 30o (in micro approach with the Ge crystal).
Figure 4-6. Schematic diagram showing the IR beam path through (a) the macro ATR and (b) the micro ATR crystal
4.2.3 Results and discussion
4.2.3.1 FTIR spectroscopic measurements with a single-element detector
RFD was measured on a diamond ATR accessory with a single-element detector and
the ATR-FTIR spectrum is shown in Figure 4-7. The FTIR spectrum resembles a
typical spectrum of extracted asphaltenes, indicating that the bulk of the sample is
Diamond macro-ATR accessory
Sample
Aperture
Lens
Sample
Germanium micro-ATR accessory
IR
IR
(a) (b)

Chapter 4: Development of ATR-FTIR imaging approach on carbonaceous materials
- 103 -
asphaltenic.109, 110, 215 It also shows that when no aperture was used in the diamond
ATR accessory (the average angle of incidence of 47°) distortions such as the sharp
decrease in absorbance close to the 3000 cm-1 and an increase in baseline after 2800
cm-1 can be observed. The condition for ATR is that the electromagnetic wave must
enter a lower refractive index material (sample) at an angle greater than the critical
angle of the system. For ATR measurements made near the critical angle, the spectral
bands may become distorted. Strong bands can become broadened and red-shifted,
both effects increasing as the angle of incidence is decreased. This is due to dispersion
in the refractive index as a function of light frequency. Harrick114 has shown that this
shift in spectral band will be small when the angle of incidence is greater than a few
degrees above the critical angle. Thus, the general rule of thumb for the practical
application of internal reflection spectroscopy, that is, ATR spectroscopy, to avoid the
distortion of the bands, is to keep measurement well above the critical angle of the
system.
The refractive index of asphaltenes from the literature has been estimated to be
around 1.7,216, 217 thus the critical angle for the diamond and Ge ATR crystals can be
calculated from Equation 4-1 to give 44.6° and 25.1° respectively. The actual
refractive index of RFD is not measured in this study but the bulk of the sample have
been shown, in Figure 4-7a, to be asphaltenic in nature, thus the typical refractive
index of extracted asphaltenes is used for the calculation here. An angle of incidence
of 47° is very close to the estimated critical angle for the diamond and the sample,
thus explaining the observed spectral distortion.
⎟⎟⎠
⎞⎜⎜⎝
⎛=
1
21-sin angle criticalnn
Equation 4-1
On the other hand, introducing the aperture would only allow greater angles of the
incoming IR beam, relative to the normal of the top surface of the diamond to pass
through, thus the average angle of incidence is increased to 56°. The resultant
spectrum obtained, shown in Figure 4-7a, has demonstrated that the distortion is
removed under this configuration. This development allows high refractive index
materials to be measured with ATR spectroscopy without these optical artefacts
which may affect both qualitative and, in a larger extent, quantitative analysis of the
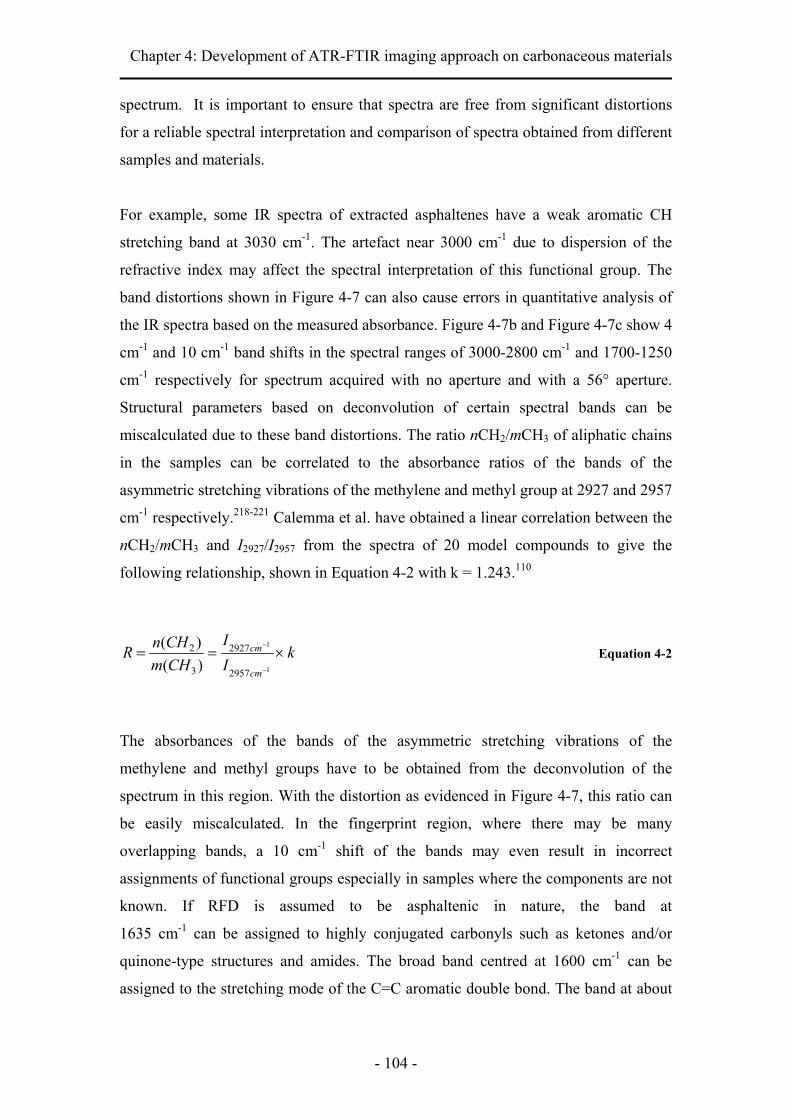
Chapter 4: Development of ATR-FTIR imaging approach on carbonaceous materials
- 104 -
spectrum. It is important to ensure that spectra are free from significant distortions
for a reliable spectral interpretation and comparison of spectra obtained from different
samples and materials.
For example, some IR spectra of extracted asphaltenes have a weak aromatic CH
stretching band at 3030 cm-1. The artefact near 3000 cm-1 due to dispersion of the
refractive index may affect the spectral interpretation of this functional group. The
band distortions shown in Figure 4-7 can also cause errors in quantitative analysis of
the IR spectra based on the measured absorbance. Figure 4-7b and Figure 4-7c show 4
cm-1 and 10 cm-1 band shifts in the spectral ranges of 3000-2800 cm-1 and 1700-1250
cm-1 respectively for spectrum acquired with no aperture and with a 56° aperture.
Structural parameters based on deconvolution of certain spectral bands can be
miscalculated due to these band distortions. The ratio nCH2/mCH3 of aliphatic chains
in the samples can be correlated to the absorbance ratios of the bands of the
asymmetric stretching vibrations of the methylene and methyl group at 2927 and 2957
cm-1 respectively.218-221 Calemma et al. have obtained a linear correlation between the
nCH2/mCH3 and I2927/I2957 from the spectra of 20 model compounds to give the
following relationship, shown in Equation 4-2 with k = 1.243.110
Equation 4-2
The absorbances of the bands of the asymmetric stretching vibrations of the
methylene and methyl groups have to be obtained from the deconvolution of the
spectrum in this region. With the distortion as evidenced in Figure 4-7, this ratio can
be easily miscalculated. In the fingerprint region, where there may be many
overlapping bands, a 10 cm-1 shift of the bands may even result in incorrect
assignments of functional groups especially in samples where the components are not
known. If RFD is assumed to be asphaltenic in nature, the band at
1635 cm-1 can be assigned to highly conjugated carbonyls such as ketones and/or
quinone-type structures and amides. The broad band centred at 1600 cm-1 can be
assigned to the stretching mode of the C=C aromatic double bond. The band at about
kII
CHmCHnR
cm
cm ×==−
−
1
1
2957
2927
3
2
)()(

Chapter 4: Development of ATR-FTIR imaging approach on carbonaceous materials
- 105 -
1450 cm-1 can be assigned to the bending modes of CH2 and CH3 and the band at
1370 cm-1 can be attributed to the symmetrical CH bending mode of methyl groups
adjacent to alkyl or aryl groups. The band assignment in the 1370-1000 cm-1 region is
complicated, and not every band can be assigned to a specific functional group; this
again reiterates the importance of an artefact-free spectrum. The band at 1150 cm-1
may be assigned to a sulphate group and the band at 1030 cm-1 can be assigned to a
sulfoxide group.
Good contact between the sample and the crystal is vital for reliable and reproducible
measurements using ATR spectroscopy. For hard samples, such as crude oil deposits,
much force is needed to press the sample onto the ATR crystal to ensure this contact.
However, if the sample is harder than the crystal, this will damage the crystal. Not
only does diamond have a hardness of 10 on the Mohs scale, it is chemically inert
which makes cleaning of the ATR surface with most of the solvents possible. The
issue with the effect of dispersion of the refractive index on the spectrum could have
been overcome with a higher refractive index crystal such as Ge or silicon (Si) but
diamond still has the advantage of being hard, durable, chemically inert and relatively
non-absorbing in most of the mid-IR region. The modification on the optical design
of the diamond ATR accessory has made it possible to obtain reliable spectroscopic
information on high refractive index materials, such as asphaltenes and crude oil
deposits.
Chapter 4: Development of ATR-FTIR imaging approach on carbonaceous materials
- 106 -
Figure 4-7. Single-element FTIR spectra of RFD collected using 47° and 56° apertures. (b) and (c) show the distortions of the absorption bands at 3000-2800 cm-1 and 1700-1250 cm-1 respectively
4.2.3.2 Macro ATR-FTIR imaging
Figure 4-8 shows the image obtained using a diamond ATR accessory with the FTIR
spectroscopic imaging system. The images shown are from the same sample measured
using conventional spectroscopy with a single-element detector. The ATR accessory
was moved with the sample intact, after using a single-element detector to the macro
chamber of spectrometer where the images are acquired using the FPA detector. Each
pixel of the FPA detector measures a full mid-IR spectrum. All images are generated
from the data of a single measurement by allocating a colour to each pixel based on
the integrated absorbance of the particular spectral band as indicated below each
images in Figure 4-8. The red in the scale denotes a high value and blue denotes a low
value. This colour coding represents the concentration of the component and this can
be quantified with a calibration graph of the known component. The univariate
(a)
(b) (c)
Chapter 4: Development of ATR-FTIR imaging approach on carbonaceous materials
- 107 -
analysis of the FTIR images has revealed several chemically different components
and their representative spectra were extracted from the regions where their
concentration is the highest as denoted by the symbol X. The image size of this setup
is about 610 μm × 530 μm and the spatial resolution of this approach is ca. 12 μm
(Section 4.1).
The image showing the spatial distribution of the absorbance of the asymmetrical
methylene stretching mode at about 2920 cm-1 in Figure 4-8a is relatively
homogenous across the measured area, thus showing that good contact had been
established in this setup. Note that as lenses are utilised in the design of the ATR
accessory, chromatic aberration may exist in this setup. This system was optimised
using the fingerprint region of the IR spectrum where most of the spectroscopic
information is present, thus the CHx stretching modes in the higher wavenumber
region of 3100-2800 cm-1 may not have as sharp focus as compared to the fingerprint
region.
The image based on the integration range of 1470-1420 cm-1 is assigned to the
bending modes of CH2 and CH3 but there are also other bands, such as the
characteristic band for carbonates, which appears in the same range. Hence, the image
based on this integration range does not correspond to the image of the stretching
modes of CH in the 2940-2880 cm-1 region. The images based on the 1675-1620 cm-1
and 1350-1300 cm-1 ranges show similar distributions in the measured area, therefore
implying that the two bands belong to the same component. It was found from a
spectral library search that these two bands can be assigned to the oxalate functional
group. The concentration of this component may be high enough for the conventional
FTIR spectroscopy to detect a band at 1635 cm-1 but the band at 1330 cm-1 is not
obvious. As mentioned before, the 1635 cm-1 band can be assigned to different
conjugated carbonyls but it is difficult to assign a specific compound for an unknown
sample. From the FTIR image, domains of high concentration of this component can
be located thus a more representative spectrum of the component can be extracted.
With the “purer” spectrum, chemical species may be identified and spectral
assignment can be made with higher confidence. For this material, the oxalate
compound is not expected normally and thus is not identifiable if based on just the
conventional FTIR spectrum measured with a single-element detector. A broad band

Chapter 4: Development of ATR-FTIR imaging approach on carbonaceous materials
- 108 -
in the 1500-1350 cm-1 range was also observed from the thousands of spectra
acquired in a single measurement with the FPA detector. The image in Figure 4-8b is
based on the integrated absorbance of this band and it shows the distribution of
carbonate compounds in the sample. This characteristic carbonate band overlaps with
the band assigned to the bending modes of CH2 and CH3 at 1470-1420 cm-1 thus it
would not have been obvious if just based on the interpretation of the FTIR spectrum
measured with a single-element detector for RFD in Figure 4-7a.
The images in Figure 4-8e and Figure 4-8f are based on the distribution of the
integrated absorbance in the range of 1180-1100 cm-1 and 1080-1000 cm-1
respectively. They can be assigned to the sulphate and sulfoxide functional groups,
respectively, which substantiates our tentative assignment of these species based on
the conventional FTIR spectrum with a single-element detector. Although
conventional single-element FTIR spectroscopy may have a better SNR and a faster
acquisition time, its sensitivity is inferior to the more advanced imaging technique. In
single-element measurements, chemical information of the sample is averaged across
the whole measured area of the ATR crystal thus spectral bands of a component in a
heterogeneous sample will be diminished by the spectral bands of other components
depending on their concentration and absorptivities. On the basis of the images shown,
crude oil deposits from the heat exchanger are extremely heterogeneous. Clusters of
distinct compounds ranging in size from ca. 40 μm for the oxalate to ca. 150 μm for
the sulphate can be observed. This emphasises how the enhanced sensitivity of the
imaging approach can provide more accurate chemical information of a sample,
especially for heterogeneous materials. When components are resolved spatially,
spectroscopic information that represents the components can be obtained.
It is well accepted that the fouling mechanism of crude oil heat exchangers is complex
which often involves crystallisation of inorganics, deposition of particulates,
corrosion and chemical reactions of organics such as oxidative polymerisation,
asphaltenes precipitation and coke formation.9, 11 The mitigation strategy is therefore
plant specific and largely dependent on the feedstock composition of the crude oil.
The FTIR images have shown both chemical and spatial information about the
organic and inorganic fractions in RFD. From the measurements with a single-
element detector and the distribution of the methylene asymmetrical stretching mode
Chapter 4: Development of ATR-FTIR imaging approach on carbonaceous materials
- 109 -
measured by the macro ATR-FTIR imaging approach shown in Figure 4-8a, the bulk
of RFD was observed to be mainly asphaltenic. Detailed analysis of the organics such
as aromaticity, length of the aliphatic side chains and carbonyl abundances can be
carried across the large data set obtained from each imaging measurement. The
chemical images also reveal chemical heterogeneities in RFD especially for the
mineral compounds. This may help in indicating the main mechanisms that contribute
to fouling thus providing information to the heat exchanger specialist in deciding
mitigation strategies. For example, the oxalates detected are not commonly found in
crude oil but are known to exist in the form of an organic acid salt in sedimentary
rocks.222 This particular specie is largely present in deposit for this particular crude oil,
thus could be an initiator or a cofactor to the fouling process.

Chapter 4: Development of ATR-FTIR imaging approach on carbonaceous materials
- 110 -
Figure 4-8. Macro ATR-FTIR images of RFD. Images are based on the integration of the absorption band as indicated below each images. The imaging area is ca. 610 μm × 530 μm. Spectrum is extracted from point X of the chemical image above it. The red box in (b) shows the relative size of a micro ATR FTIR imaging measurement.
1675-1620 cm-1
x
1350-1300 cm-1 1630-1580 cm-1
1500-1350 cm-1
x
x
(d)
1180-1100 cm-1
x
(e)
1470-1420 cm-1
(a)
x
2940-2880 cm-1
E)
x
1080-1000 cm-1
(f)
(b)
1630-1580 cm-1

Chapter 4: Development of ATR-FTIR imaging approach on carbonaceous materials
- 111 -
4.2.3.3 Micro ATR-FTIR imaging
Figure 4-8 shows the overall distribution of the different components in RFD with the
macro ATR technique using the diamond ATR accessory and it has been discussed
how this approach surpasses the conventional single-element FTIR spectroscopy in
characterising such heterogeneous materials. A different ATR imaging approach is
used here to examine the crude oil deposit with a spatial resolution higher than that of
the macro ATR imaging approach. The micro ATR-FTIR imaging technique uses a
microscope objective with a Ge crystal. The Ge crystal is also hard, 6 on the Mohs
scale, but it is brittle compared to the diamond crystal. It has a high refractive index of
4 that provides the high spatial resolution when used in immersed objectives but it is
not as robust as the diamond crystal. The image size of the micro ATR measurements
is about 63 μm × 63 μm with the objective used in this study and the spatial resolution
is about 2-4 μm157, 223. A red square shown in Figure 4-8b shows the relative image
size of a micro ATR measurement compared to the size of a macro image obtained
with the diamond ATR accessory. From the macro FTIR images, it was shown that
the components are dispersed, thus a single micro ATR-FTIR image, which measures
almost 100 times smaller area of the sample, will not be a good representation of the
sample. In this work, multiple micro ATR imaging measurements were carried out
and analysed but only four measurements are presented and discussed below.
The micro ATR-FTIR measurement in Figure 4-9a shows the distribution of a
component not identified from initial analysis of the macro FTIR image in the
integration range of 1630-1580 cm-1. It shows a cluster of domain size ca. 7 μm. The
spectrum extracted shows two strong bands at 1605 cm-1 and 1313 cm-1. This
component was also detected in other separate micro ATR-FTIR measurements and
the two bands are originated from the same component. The oxalates also have two
similar bands at 1635 cm-1 and 1330 cm-1 thus it is speculated from these results that
this unknown component may be a different form of complex of the oxalate. The
macro ATR imaging used the same integration range of 1630-1580 cm-1 for this
compound and the image generated is shown in Figure 4-9d. The domain size of the
component is just large enough to observe a distribution in the image, but spectral
information of this component is still masked by the surrounding contributions. The
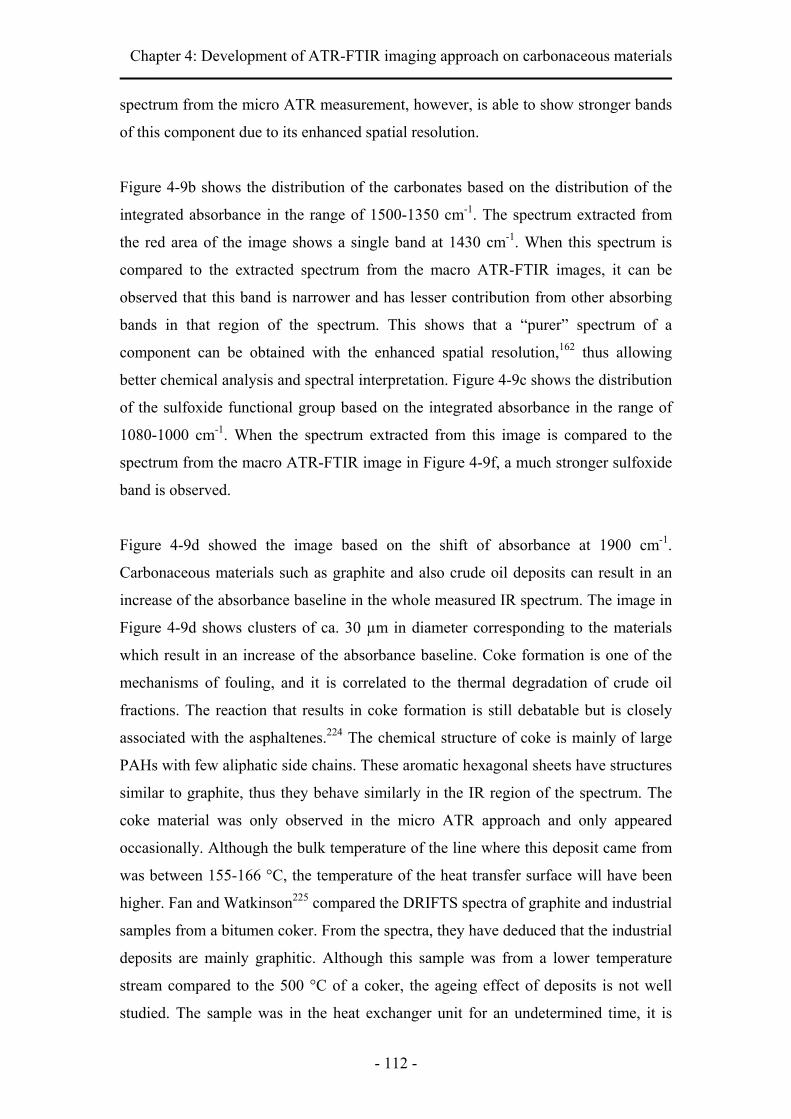
Chapter 4: Development of ATR-FTIR imaging approach on carbonaceous materials
- 112 -
spectrum from the micro ATR measurement, however, is able to show stronger bands
of this component due to its enhanced spatial resolution.
Figure 4-9b shows the distribution of the carbonates based on the distribution of the
integrated absorbance in the range of 1500-1350 cm-1. The spectrum extracted from
the red area of the image shows a single band at 1430 cm-1. When this spectrum is
compared to the extracted spectrum from the macro ATR-FTIR images, it can be
observed that this band is narrower and has lesser contribution from other absorbing
bands in that region of the spectrum. This shows that a “purer” spectrum of a
component can be obtained with the enhanced spatial resolution,162 thus allowing
better chemical analysis and spectral interpretation. Figure 4-9c shows the distribution
of the sulfoxide functional group based on the integrated absorbance in the range of
1080-1000 cm-1. When the spectrum extracted from this image is compared to the
spectrum from the macro ATR-FTIR image in Figure 4-9f, a much stronger sulfoxide
band is observed.
Figure 4-9d showed the image based on the shift of absorbance at 1900 cm-1.
Carbonaceous materials such as graphite and also crude oil deposits can result in an
increase of the absorbance baseline in the whole measured IR spectrum. The image in
Figure 4-9d shows clusters of ca. 30 µm in diameter corresponding to the materials
which result in an increase of the absorbance baseline. Coke formation is one of the
mechanisms of fouling, and it is correlated to the thermal degradation of crude oil
fractions. The reaction that results in coke formation is still debatable but is closely
associated with the asphaltenes.224 The chemical structure of coke is mainly of large
PAHs with few aliphatic side chains. These aromatic hexagonal sheets have structures
similar to graphite, thus they behave similarly in the IR region of the spectrum. The
coke material was only observed in the micro ATR approach and only appeared
occasionally. Although the bulk temperature of the line where this deposit came from
was between 155-166 °C, the temperature of the heat transfer surface will have been
higher. Fan and Watkinson225 compared the DRIFTS spectra of graphite and industrial
samples from a bitumen coker. From the spectra, they have deduced that the industrial
deposits are mainly graphitic. Although this sample was from a lower temperature
stream compared to the 500 °C of a coker, the ageing effect of deposits is not well
studied. The sample was in the heat exchanger unit for an undetermined time, it is

Chapter 4: Development of ATR-FTIR imaging approach on carbonaceous materials
- 113 -
possible that it has aged thus resulting in materials of a more graphitic nature. These
may be formed especially on hotspots of the heat exchanger surface. These highly
absorbing blackbody materials would not have been observed in techniques used
before and FTIR imaging may provide a way to monitor this ageing effect of the
deposits.
With a higher spatial resolution from the micro ATR imaging, smaller domains are
magnified, thus the sensitivity of the ATR-FTIR imaging effectively increases. In-
depth analysis of the different components in RFD can be carried out by using the
better-represented spectrum obtained using the micro ATR approach. The macro ATR
approach, with a larger field of view, can give a better overview picture of the whole
sample. Quantitative analysis of the deposits, such as the particle size analysis of the
different components, can be obtained from the FTIR images. Although multiple
measurements will still be needed to obtain a statistically significant representation of
the sample, this technique is relatively fast where each measurement only takes less
than 2 minutes.

Chapter 4: Development of ATR-FTIR imaging approach on carbonaceous materials
- 114 -
Figure 4-9. Micro ATR-FTIR images of RFD. Each of the images is from different measurement. Images (a) to (c) are based on the integration of the absorption band as indicated below each images. Image (d) is based on the shift of the absorbance at 1900 cm-1. Spectrum is extracted from point X of the chemical image beside it.
4.2.4 Conclusion
This study has addressed the advantages and intrinsic limitations of ATR-FTIR
spectroscopic measurements of high refractive index materials, such as crude oil
deposits. A lab-made aperture is used to correct the distortion of spectral bands due to
the dispersion of the refractive index. This allows reliable spectral information to be
obtained from high refractive index materials using ATR-FTIR spectroscopy with a
diamond accessory. This development was further extended to acquire ATR-FTIR
images of crude oil deposits with the FPA detector. FTIR imaging allows the
3
01630-1580 cm-1
6
01500-1350 cm-1
1.3
01080-1000 cm-1
0.4
0Shift of absorbance at 1900 cm-1
x
x
x
x
(d)
(c)
(b)
(a)

Chapter 4: Development of ATR-FTIR imaging approach on carbonaceous materials
- 115 -
visualisation of different chemical components in a heterogeneous sample. Using the
diamond accessory in the macro ATR setup, clusters of five chemically different
compounds, namely, organics which are asphaltene in nature, carbonates, sulphates,
sulfoxides and oxalates were identified in crude oil deposits. The imaging approach
provides both spatial and chemical information of the deposit which it was not
possible to characterise in this way before. It was also demonstrated that with the
enhanced spatial resolution of the micro ATR approach, a more representative
spectrum of the components can be achieved. A different complex form of the oxalate,
which was barely at the detection limit of the macro ATR approach, was also
identified using the micro ATR-FTIR imaging. Highly IR absorbing materials, which
may possibly be coke, were also found and represented in the chemical image from
the micro ATR-FTIR approach.

Chapter 4: Development of ATR-FTIR imaging approach on carbonaceous materials
- 116 -
4.3 Comparing crude oil deposits from refinery to laboratory-
extracted asphaltenes using ATR-FTIR spectroscopic imaging
4.3.1 Introduction
Asphaltenes have been closely linked and related to level of fouling in heat
exchangers as described in Section 2.2, thus it is important to characterise these
materials and their association to crude oil fouling. In this section, the developed
methodology of combining macro and micro ATR-FTIR spectroscopic imaging has
been applied to real deposited foulants from the refinery and extracted asphaltenes
from three different crude oils. Detailed analysis using FTIR imaging was performed
on the deposited foulants and the extracted asphaltenes.
4.3.2 Experimental
4.3.2.1 Samples
The deposited foulants were obtained from the pre-heat train of a distillation column
in a refinery with inlet and outlet temperature at around 158 °C and 166 °C
respectively. They are labeled and referred as RFD. The shut down procedure was
standard thus the deposits were only exposed to nitrogen and steam. The deposits
were removed from the process unit and sent to the laboratory. The crude oils
originate from three different geographical regions which are known to foul when the
oil is processed. The asphaltenes were extracted following the ASTM standard
procedure (D3279).46 They have been labeled as ASP-A, ASP-M and ASP-K. Three
macro ATR-FTIR imaging measurements were made and analysed for each sample.
The higher spatial resolution micro ATR-FTIR images were also presented.
4.3.2.2 ATR-FTIR spectroscopic imaging
The ATR-FTIR images were measured with a continuous scan FTIR spectrometer
using a 64 × 64 FPA detector as described in Section 3.1. The macro ATR-FTIR
images were obtained in the same system with the modified ATR accessory as
described in Section 4.2.2.2. The micro ATR-FTIR images were measured in the
same system as described in Section 3.1.1.
Chapter 4: Development of ATR-FTIR imaging approach on carbonaceous materials
- 117 -
The spectra were collected from 4000 cm-1 to 900 cm-1 with a spectral resolution of 8
cm-1 and 200 co-additions. For the macro and micro ATR-FTIR measurements, the
sampling technique was as described in Section 4.2.2.3. The colour scale of the
images was set the same across each row, unless otherwise stated, for easy
comparison of each chemical component.
4.3.3 Results and discussion
4.3.3.1 ATR-FTIR imaging of deposited foulants
The macro ATR-FTIR images of RFD in Figure 4-10 show the distribution of
different chemical groups based on the integrated absorbance of the spectral bands as
indicated on the left side of the images. The images along the first row, which were
based on the integrated absorbance in the range of 3000-2800 cm-1, show the
distribution of the CHx stretching modes. Since the sample is dominated by
hydrocarbon compounds, the high absorbance of this band throughout the images can
be used as an indication that good contact has been established. The result has shown
that ATR-FTIR imaging is suitable for studying this type of samples despite of the
samples being hard. The assignments of the different components for RFD have been
discussed in Section 4.2.
All three measurements have shown the presence of the following chemical
components, carbonates, oxalates, sulphates and sulfoxides, and the distribution of
these components are not the same in each of the image despite the fact that they were
all measured from the same sample. In measurements 1 and 3, there was a higher
presence of carbonates as compared to measurement 2. The distribution and particle
domain size of the oxalate compounds were similar for all three measurements but the
distributions of sulphates and sulfoxide compounds were different in each image. This
shows that a single macro ATR-FTIR measurement with a sampled area of ca. 610
μm × 530 μm is not enough to provide representative data concerning the distributions
of the chemical components in RFD. More chemical images need to be measured in
order for reliable parameters of the deposited foulant to be derived. This will be
discussed in detail in Section 4.4. Nevertheless, it is possible to analyse the sample
Chapter 4: Development of ATR-FTIR imaging approach on carbonaceous materials
- 118 -
qualitatively which would still provides valuable information about the chemical
nature of the sample.
The data produced by chemical imaging offers a far greater level of detail about the
sample studied compared to the averaged information obtained from typical single-
element measurements. This is clearly demonstrated in Figure 4-11 where the
averaged spectra of the three imaging measurements of RFD are shown. Little
difference can be observed between the three spectra even though the spatial
distribution and the cluster size of the different components differ significantly. Due
to the overlapping characteristic spectral bands of the different chemical components,
the distribution of asphaltenic components in RFD is difficult to present as an image
using univariate analysis. The averaged spectra resemble the spectrum of asphaltenes
(Figure 4-15), however, it can be observed that there are still contributions from other
chemical components, such as carbonates, oxalates, sulphates and sulfoxides, to the
overall spectrum of RFD.

Chapter 4: Development of ATR-FTIR imaging approach on carbonaceous materials
- 119 -
Figure 4-10. Macro ATR-FTIR images of RFD.
Figure 4-11. Averaged spectrum of RFD across the macro ATR-FTIR image obtained in three repeated measurements.
3000
-280
0 cm
-1
1500
-135
0 cm
-1
1350
-130
0 cm
-1
25 0
4.5 -0.1
1180
-110
0 cm
-1
1060
-100
0 cm
-1
Measurement 1 Measurement 2 Measurement 3
15 0
3 -1
1.5 -0.5
oxal
ate
carb
onat
e su
lpha
te
sulfo
xide

Chapter 4: Development of ATR-FTIR imaging approach on carbonaceous materials
- 120 -
RFD was measured using the micro ATR-FTIR imaging and the result is shown in
Figure 4-12. The measured area of this approach is ca. 63 μm × 63 μm, which is about
100 times smaller than the measured area of the macro ATR approach. The higher
spatial resolution of the micro ATR imaging approach reveals even finer details of the
sample allowing smaller domains of components to be revealed and a more
representative spectrum of a component can be obtained.
In order to obtain a representative spectrum of the asphaltene component, a micro
ATR-FTIR measurement where the contributions from the inorganic species are at
their lowest is shown in Figure 4-12. The image showing the distribution of the CHx
stretching modes in Figure 4-12a indicated that good contact between the sample and
ATR crystal was established for the measurement. The distributions of carbonates,
oxalates and sulphates in RFD are presented in Figure 4-12b, Figure 4-12c and Figure
4-12d respectively. The whole data set, comprised of 4096 spectra, was averaged and
the spectrum is as shown in Figure 4-12e. This spectrum, when compared to the
averaged spectrum from the macro ATR imaging approach of RFD, has shown that
there is a reduction of the absorbance of the bands at 1640 cm-1, 1330 cm-1 and 1150
cm-1, which indicates that an area with lower concentrations of these inorganic
components was measured. A spectrum (red) was extracted from a location of the
image with a low concentration of the inorganic components and this was compared
to the spectrum (blue) of the laboratory-extracted asphaltenes, ASP-M, as shown in
Figure 4-12e. It can be observed that the extracted spectrum has almost no
contribution from the absorption bands of the other inorganic components and is very
similar to the spectrum of the extracted asphaltenes. Therefore, with micro ATR-FTIR
imaging, a more representative spectrum of the asphaltene component in deposited
foulants can be obtained. This result has demonstrated that spectroscopic information
of the asphaltenic component in the heterogenenous deposits can be acquired easily
and analysed with the imaging system. Otherwise, routine extraction processes, such
as sohxlet extraction, would have to be carried out in order for the asphaltene fraction
in the deposit to be analysed through conventional analytical techniques.
From the discussion in Section 4.2.3.2, six chemically different compounds, namely,
the asphaltenic component, carbonates, sulphates, sulfoxides and two different types
of oxalates were observed in this sample. Five micro ATR-FTIR images were selected
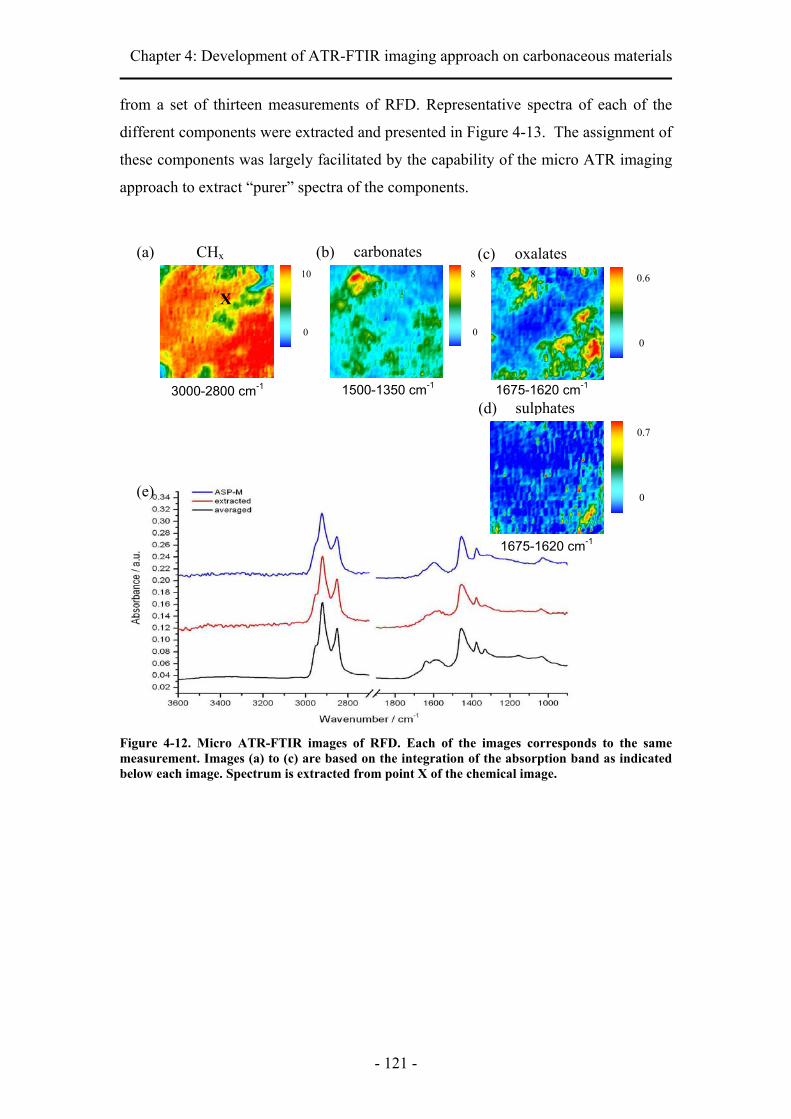
Chapter 4: Development of ATR-FTIR imaging approach on carbonaceous materials
- 121 -
from a set of thirteen measurements of RFD. Representative spectra of each of the
different components were extracted and presented in Figure 4-13. The assignment of
these components was largely facilitated by the capability of the micro ATR imaging
approach to extract “purer” spectra of the components.
Figure 4-12. Micro ATR-FTIR images of RFD. Each of the images corresponds to the same measurement. Images (a) to (c) are based on the integration of the absorption band as indicated below each image. Spectrum is extracted from point X of the chemical image.
(e) 0
0.7
1675-1620 cm-1
0
0.6
oxalates (c)
1500-1350 cm-1 1675-1620 cm-1
0
10 CHx (a)
3000-2800 cm-1
X
0
8
carbonates(b)
sulphates (d)

Chapter 4: Development of ATR-FTIR imaging approach on carbonaceous materials
- 122 -
Figure 4-13. Micro ATR-FTIR images of RFD. Each of the images corresponds to a different measurement. Images (a) to (e) are based on the integration of the absorption band as indicated at the side of each image. Images (a) and (c) are results from Figure 4-9. Spectrum is extracted from point X of the chemical image beside it.
0
3
0
8
0
2
0
1
0
6 15
00-1
350
cm-1
carbonates
1675
-162
0 cm
-1
1630
-158
0 cm
-1
1180
-110
0 cm
-1
1080
-100
0 cm
-1
oxalates I
oxalates II
sulphates
sulfoxides(e)
(d)
(c)
(b)
(a)
X
X
X
X
X
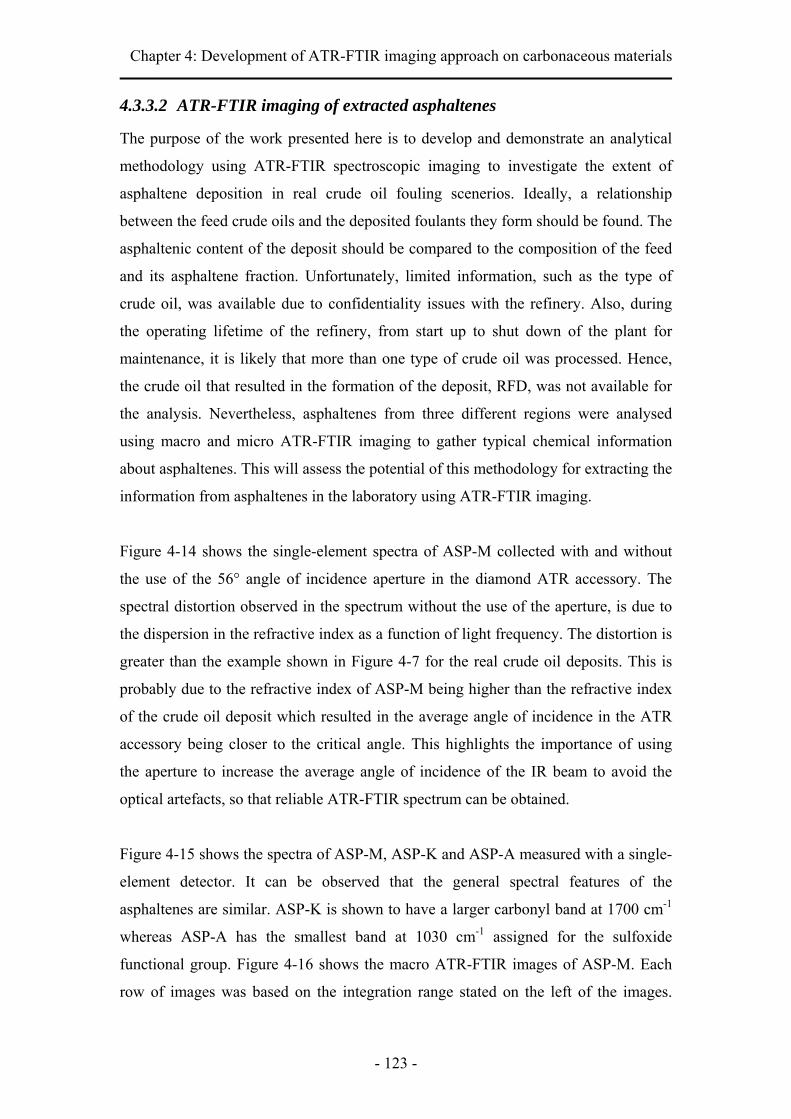
Chapter 4: Development of ATR-FTIR imaging approach on carbonaceous materials
- 123 -
4.3.3.2 ATR-FTIR imaging of extracted asphaltenes
The purpose of the work presented here is to develop and demonstrate an analytical
methodology using ATR-FTIR spectroscopic imaging to investigate the extent of
asphaltene deposition in real crude oil fouling scenerios. Ideally, a relationship
between the feed crude oils and the deposited foulants they form should be found. The
asphaltenic content of the deposit should be compared to the composition of the feed
and its asphaltene fraction. Unfortunately, limited information, such as the type of
crude oil, was available due to confidentiality issues with the refinery. Also, during
the operating lifetime of the refinery, from start up to shut down of the plant for
maintenance, it is likely that more than one type of crude oil was processed. Hence,
the crude oil that resulted in the formation of the deposit, RFD, was not available for
the analysis. Nevertheless, asphaltenes from three different regions were analysed
using macro and micro ATR-FTIR imaging to gather typical chemical information
about asphaltenes. This will assess the potential of this methodology for extracting the
information from asphaltenes in the laboratory using ATR-FTIR imaging.
Figure 4-14 shows the single-element spectra of ASP-M collected with and without
the use of the 56° angle of incidence aperture in the diamond ATR accessory. The
spectral distortion observed in the spectrum without the use of the aperture, is due to
the dispersion in the refractive index as a function of light frequency. The distortion is
greater than the example shown in Figure 4-7 for the real crude oil deposits. This is
probably due to the refractive index of ASP-M being higher than the refractive index
of the crude oil deposit which resulted in the average angle of incidence in the ATR
accessory being closer to the critical angle. This highlights the importance of using
the aperture to increase the average angle of incidence of the IR beam to avoid the
optical artefacts, so that reliable ATR-FTIR spectrum can be obtained.
Figure 4-15 shows the spectra of ASP-M, ASP-K and ASP-A measured with a single-
element detector. It can be observed that the general spectral features of the
asphaltenes are similar. ASP-K is shown to have a larger carbonyl band at 1700 cm-1
whereas ASP-A has the smallest band at 1030 cm-1 assigned for the sulfoxide
functional group. Figure 4-16 shows the macro ATR-FTIR images of ASP-M. Each
row of images was based on the integration range stated on the left of the images.

Chapter 4: Development of ATR-FTIR imaging approach on carbonaceous materials
- 124 -
Various integration ranges were used to generate the images and they mostly show a
homogeneous distribution. However, at least two chemically different components
were observed. The row of images based on the absorbance of the shifted band at
1900 cm-1, as shown in Figure 4-16c, revealed the distribution of “coke-like”
materials in the asphaltenes. This suggests that ordered graphitic structures exist in
asphaltenes and are found in clusters of diameter ca. 20-30 μm. The top middle
sections of the images, where they are boxed in Figure 4-16c, are image artefacts and
they should be ignored.
Interestingly, a small area of the sample has shown a strong absorbance band in the
1175-960 cm-1 region. Figure 4-16d shows the images based on this band. A spectrum
is extracted from the red region of the image as indicated by the red arrow. This
chemical species can also be observed in other repeat measurements using the macro
ATR approach and thus is not a contamination that occurred during the sampling
process. The band at 1175-960 cm-1 is a characteristic band of cellulose226 which is a
linear polymer of D-glucose units linked by glycosidic bonds. One possible material
that bares similar spectral features is the vitrinite compound, which is one of the main
constituents of kerogens.219, 227, 228 Vitrinite compounds are derived from plants and
thus contain the cellulose functional group. They have been found in crude oil229 and
are common in organic source rocks.230
Two other spectra were extracted from the green region and blue region of the image
at locations indicated by the green and blue arrows respectively. The shape of the
spectral band in the 1100-1000 cm-1 region extracted from the red and green region
are different, suggesting that the two spectra were extracted from areas with two
chemically different species. The green spectrum in the 1100-1000 cm-1 region is still
representative of the sulfoxide functional group. As the image generated is based on
the integration range set, the distribution shown in the image may represent chemical
components with overlapping bands as in this case. Therefore, it is always important
to refer to the spectra data to validate the image generated. The averaged spectrum of
the spectral data set of that measurement was also presented in the plot. The spectrum
shows that the vitrinite compounds would not have been easily identifiable by
conventional FTIR spectroscopy using a single-element detector. One would simply
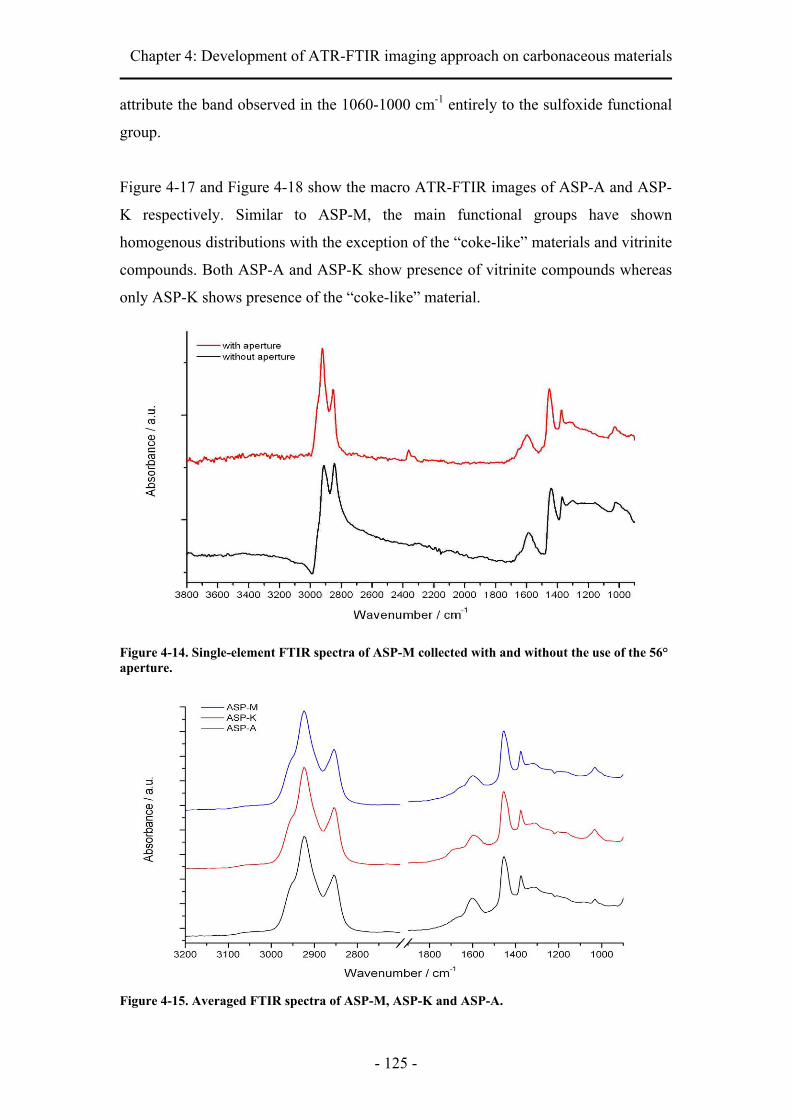
Chapter 4: Development of ATR-FTIR imaging approach on carbonaceous materials
- 125 -
attribute the band observed in the 1060-1000 cm-1 entirely to the sulfoxide functional
group.
Figure 4-17 and Figure 4-18 show the macro ATR-FTIR images of ASP-A and ASP-
K respectively. Similar to ASP-M, the main functional groups have shown
homogenous distributions with the exception of the “coke-like” materials and vitrinite
compounds. Both ASP-A and ASP-K show presence of vitrinite compounds whereas
only ASP-K shows presence of the “coke-like” material.
Figure 4-14. Single-element FTIR spectra of ASP-M collected with and without the use of the 56° aperture.
Figure 4-15. Averaged FTIR spectra of ASP-M, ASP-K and ASP-A.
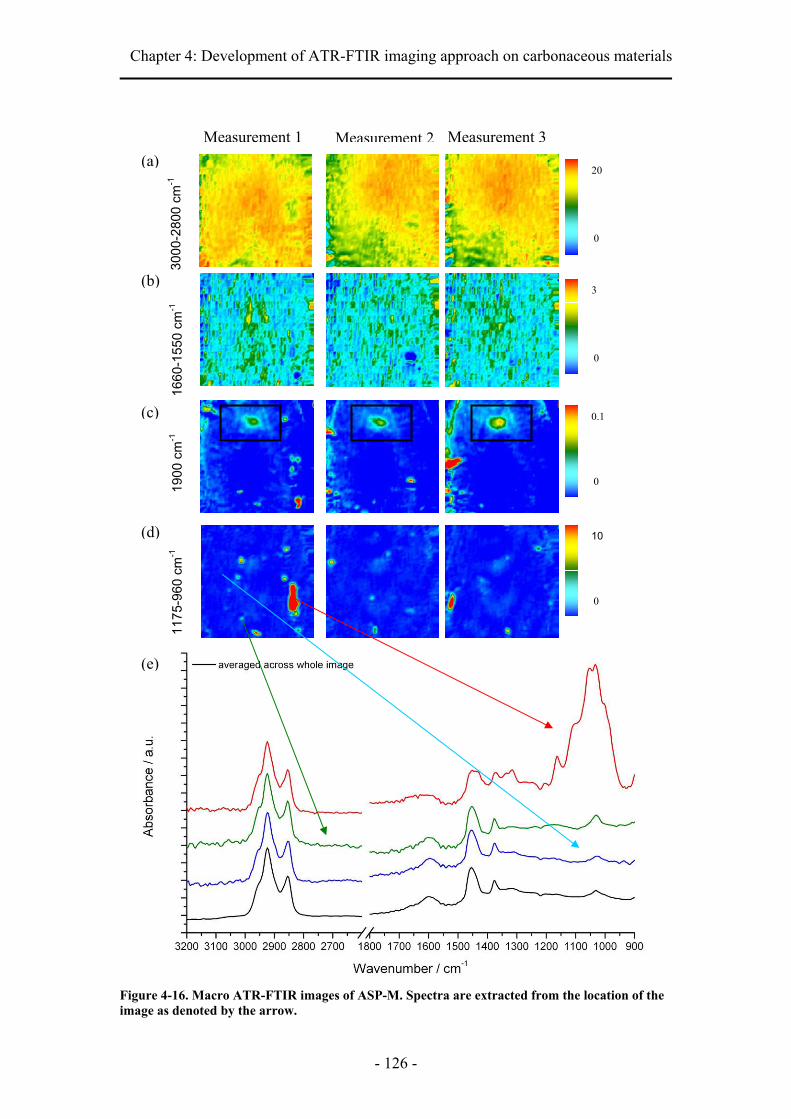
Chapter 4: Development of ATR-FTIR imaging approach on carbonaceous materials
- 126 -
Figure 4-16. Macro ATR-FTIR images of ASP-M. Spectra are extracted from the location of the image as denoted by the arrow.
3000
-280
0 cm
-1
1660
-155
0 cm
-1
0
20
0
3
1175
-960
cm
-1
1900
cm
-1
0
0.1
0
10
Measurement 1 Measurement 2 Measurement 3
(b)
(a)
(d)
(c)
(e)
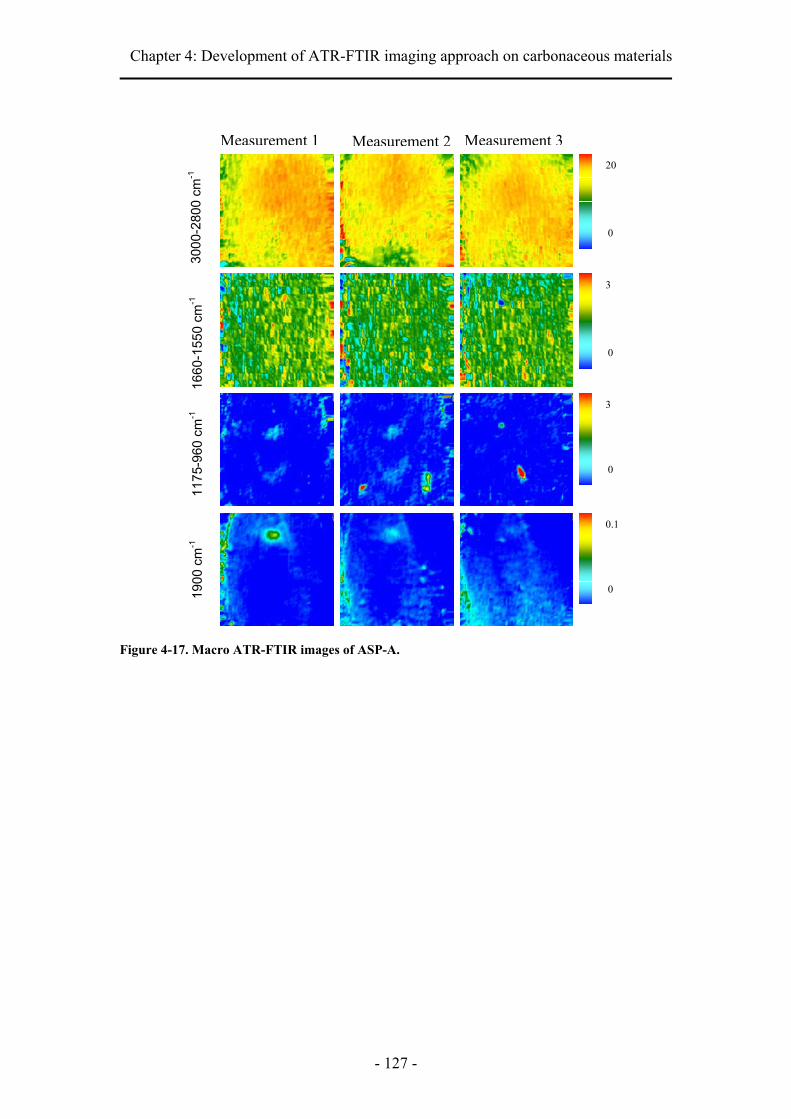
Chapter 4: Development of ATR-FTIR imaging approach on carbonaceous materials
- 127 -
Figure 4-17. Macro ATR-FTIR images of ASP-A.
3000
-280
0 cm
-1
1660
-155
0 cm
-1
0
20
0
3
0
3
0
0.1
1175
-960
cm
-1
1900
cm
-1
Measurement 1 Measurement 2 Measurement 3

Chapter 4: Development of ATR-FTIR imaging approach on carbonaceous materials
- 128 -
Figure 4-18. Macro ATR-FTIR images of ASP-K.
Micro ATR-FTIR imaging measurements were carried on the extracted asphaltenes.
Figure 4-19, Figure 4-20 and Figure 4-21 show the micro ATR-FTIR images of ASP-
M, ASP-A and ASP-K respectively. ASP-M and ASP-K show a presence of the
vitrinite compounds but not ASP-A. In macro ATR imaging mode, ASP-M shows
more “coke-like” materials compared to ASP-A and ASP-K. However, in micro ATR
imaging mode, all three asphaltenes show the presence of this material. This suggests
that “coke-like” materials exist in ASP-A and ASP-K in smaller domains compared to
ASP-M.
No other distinct distributions of chemical components were observed in the micro
ATR approach where it provides a FOV of 63 μm × 63 μm and spatial resolution of 2-
3000
-280
0 cm
-1
1660
-155
0 cm
-1
0
20
0
3
0
3
0
0.1
1175
-960
cm
-1
1900
cm
-1
Measurement 1 Measurement 2 Measurement 3
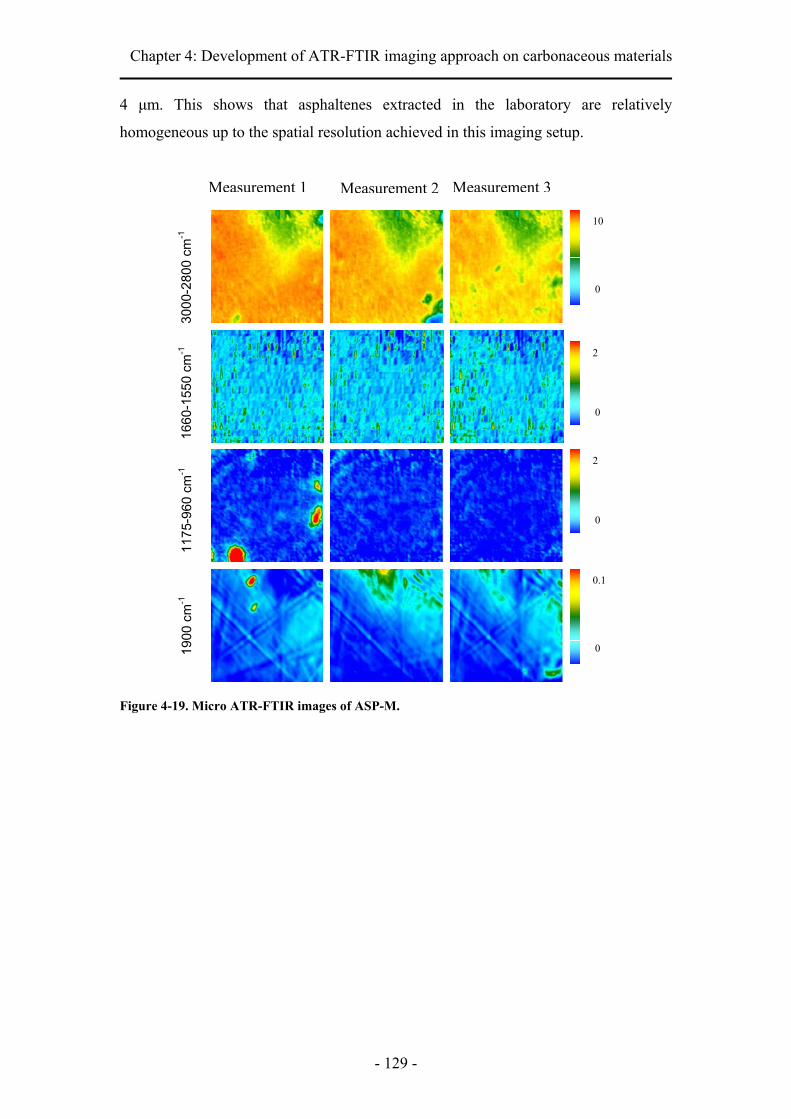
Chapter 4: Development of ATR-FTIR imaging approach on carbonaceous materials
- 129 -
4 μm. This shows that asphaltenes extracted in the laboratory are relatively
homogeneous up to the spatial resolution achieved in this imaging setup.
Figure 4-19. Micro ATR-FTIR images of ASP-M.
0
10
0
0.1
0
2
1175
-960
cm
-1
1900
cm
-1
1660
-155
0 cm
-1
3000
-280
0 cm
-1
0
2
Measurement 1 Measurement 2 Measurement 3

Chapter 4: Development of ATR-FTIR imaging approach on carbonaceous materials
- 130 -
Figure 4-20. Micro ATR-FTIR images of ASP-A.
0
10
0
2
1660
-155
0 cm
-1
3000
-280
0 cm
-1
0
0.1
1175
-960
cm
-1
1900
cm
-1
0
2
Measurement 1 Measurement 2 Measurement 3

Chapter 4: Development of ATR-FTIR imaging approach on carbonaceous materials
- 131 -
Figure 4-21. Micro ATR-FTIR images of ASP-K.
4.3.4 Conclusion
A detailed chemical analysis of RFD was made using ATR-FTIR imaging. The
visualisation of the different chemical components in RFD has shown that the sample
is extremely heterogeneous and the FOV of a single macro ATR-FTIR imaging
measurement is not sufficient to illustrate the true distribution of the different
chemical components of the measured sample. From the repeated measurements,
seven chemically different components were found in RFD. Representative spectra of
asphaltenes, carbonates, two different forms of oxalates, sulphates and sulfoxides
were extracted and shown using the micro ATR-FTIR imaging approach. Macro and
micro ATR-FTIR images of laboratory extracted asphaltenes were obtained for the
first time. ATR-FTIR images of asphaltenes extracted from three different crude oils
were analysed and compared. Clusters of two chemically different compounds,
3000
-280
0 cm
-1
1630
-155
0 cm
-1
0
10
0
1.2
0
2
0
0.1
1175
-960
cm
-1
1900
cm
-1
Measurement 1 Measurement 2 Measurement 3

Chapter 4: Development of ATR-FTIR imaging approach on carbonaceous materials
- 132 -
namely, “coke-like” materials and possibly, vitrinite compounds were observed in
these samples. This work has also demonstrated a methodology to compare,
spectroscopically, the asphaltenic component in a heterogenenous deposit with
laboratory-extracted asphaltenes using ATR-FTIR imaging approach so that the
significance of asphaltene deposition in crude oil deposits can be investigated.
ATR-FTIR imaging allows the visualisation of different chemical components in a
heterogeneous sample. By combining both macro ATR and micro ATR-FTIR
spectroscopic imaging, the complex crude oil deposits and extracted asphaltenes can
be better characterised. From the chemical images, relevant spectroscopic information,
representing the chemical species of interest can be extracted and analysed. ATR-
FTIR imaging provides an important tool in the chemical characterisation of fouling
materials which will aid in understanding the fundamentals of crude oil fouling.

Chapter 4: Development of ATR-FTIR imaging approach on carbonaceous materials
- 133 -
4.4 Developing a statistical and particle analysis approach to ATR-
FTIR images of crude oil deposits
4.4.1 Introduction
Macro and micro ATR-FTIR imaging, with the FOVs of 610 µm × 530 µm and 63
µm × 63 µm respectively, have shown important information about the spatial
distribution of different components in the deposits. The chemical images have also
shown that crude oil deposits are extremely heterogeneous and the measured area of
one macro ATR-FTIR image may not be enough to represent the overall distribution
of the components. The objective of the work presented in this section here is to
examine the number of images needed in order to have a statistically significant
amount of data for the representation of the distribution of different components in a
sample.
Particle size analysis will be carried out on two components found in real deposited
foulants, namely, oxalates and sulphates to demonstrate quantifiable parameters such
as the fraction of the total imaged area where a particular component is detected and
the mean equivalent diameter of the particles. The mean equivalent diameter
represents the mean diameter of approximated circles for the location of each particle.
In order to assess the number of images needed for obtaining a consistent distribution
of the component, particle analysis was performed on a progressively increased
number of images from a single image, two images, up to fourteen images. The
percentage image area covered by the component and the mean equivalent diameter of
the particles, and their corresponding standard deviation, averaged with different
numbers of images were compared.
4.4.2 Experimental
4.4.2.1 ATR-FTIR spectroscopic imaging
Macro ATR-FTIR images were measured with the diamond ATR accessory (Imaging
Golden Gate™) placed in a the large sample compartment of the Varian FTIR
imaging system as described in Section 3.1. The condenser lens of the ATR accessory
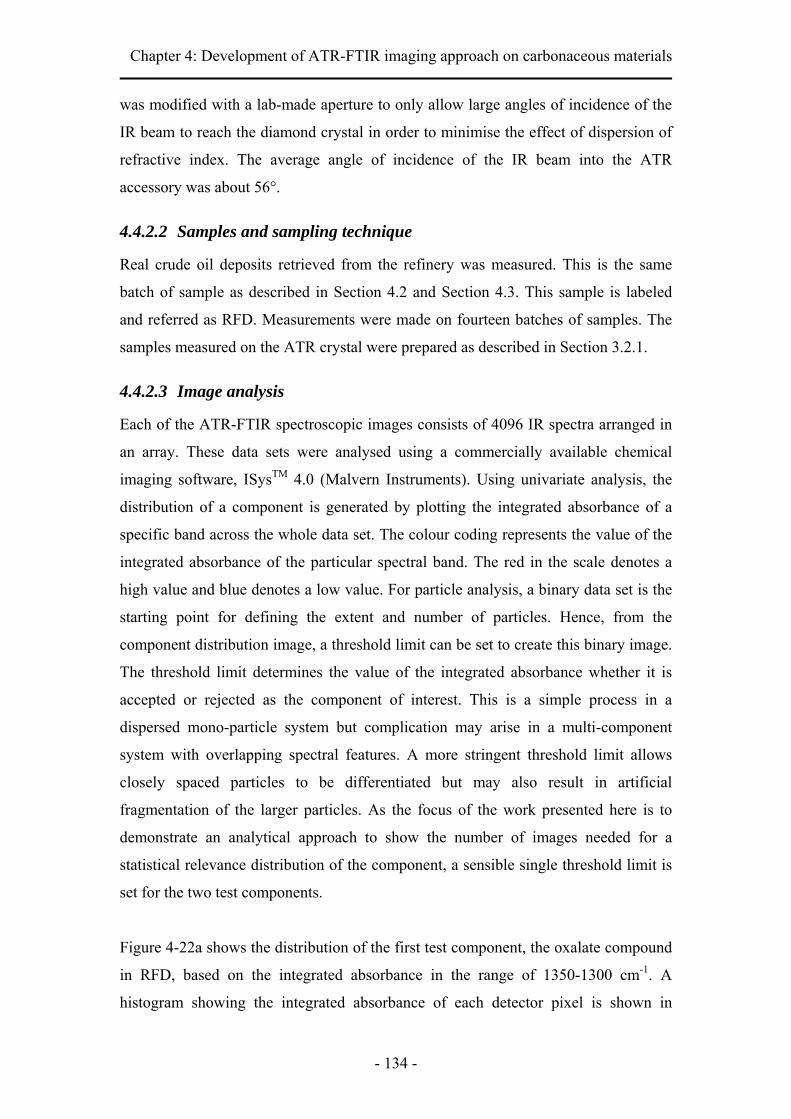
Chapter 4: Development of ATR-FTIR imaging approach on carbonaceous materials
- 134 -
was modified with a lab-made aperture to only allow large angles of incidence of the
IR beam to reach the diamond crystal in order to minimise the effect of dispersion of
refractive index. The average angle of incidence of the IR beam into the ATR
accessory was about 56°.
4.4.2.2 Samples and sampling technique
Real crude oil deposits retrieved from the refinery was measured. This is the same
batch of sample as described in Section 4.2 and Section 4.3. This sample is labeled
and referred as RFD. Measurements were made on fourteen batches of samples. The
samples measured on the ATR crystal were prepared as described in Section 3.2.1.
4.4.2.3 Image analysis
Each of the ATR-FTIR spectroscopic images consists of 4096 IR spectra arranged in
an array. These data sets were analysed using a commercially available chemical
imaging software, ISysTM 4.0 (Malvern Instruments). Using univariate analysis, the
distribution of a component is generated by plotting the integrated absorbance of a
specific band across the whole data set. The colour coding represents the value of the
integrated absorbance of the particular spectral band. The red in the scale denotes a
high value and blue denotes a low value. For particle analysis, a binary data set is the
starting point for defining the extent and number of particles. Hence, from the
component distribution image, a threshold limit can be set to create this binary image.
The threshold limit determines the value of the integrated absorbance whether it is
accepted or rejected as the component of interest. This is a simple process in a
dispersed mono-particle system but complication may arise in a multi-component
system with overlapping spectral features. A more stringent threshold limit allows
closely spaced particles to be differentiated but may also result in artificial
fragmentation of the larger particles. As the focus of the work presented here is to
demonstrate an analytical approach to show the number of images needed for a
statistical relevance distribution of the component, a sensible single threshold limit is
set for the two test components.
Figure 4-22a shows the distribution of the first test component, the oxalate compound
in RFD, based on the integrated absorbance in the range of 1350-1300 cm-1. A
histogram showing the integrated absorbance of each detector pixel is shown in

Chapter 4: Development of ATR-FTIR imaging approach on carbonaceous materials
- 135 -
Figure 4-22c. Three spectra were extracted from high, medium and low value of the
distribution image at location denoted by the arrow and presented in Figure 4-22b.
The spectrum extracted from the low region, represented by the blue spectrum, does
not show a significant presence of the characteristic bands of oxalate compounds at
1635 cm-1 and 1330 cm-1, therefore this region should be excluded from the binary
image. The threshold limit can then be adjusted such that only the spatial domain of
interest is selected. Contours are drawn on the distribution image, as shown in Figure
4-22a, based on the threshold limit of 0.5-1.5 cm-1 of the integrated absorbance. The
integrated absorbance has a unit of cm-1 as it is a product of a dimensionless
absorbance on the y-axis with the wavenumber on the x-axis. The resulting binary
image is then created as shown in Figure 4-22d. A similar procedure for the second
test component, the sulphate compounds, was carried out. A threshold limit of 0.6-3.0
cm-1 of the integrated absorbance was selected. The distribution image of sulphate and
the resulting binary image are shown in Figure 4-23.
Figure 4-22. Panel a) shows the distribution of oxalates based on the integrated absorbance in the range of 1350-1300 cm-1. The accepted domain of interest is surrounded by blue contours. Panel b) shows the spectra extracted from accepted and rejected area of the distribution image from location denoted by the arrows. Panel c) shows the integrated absorbance of each detector pixel. Panel d) is the binary image created with the threshold limit of 0.5-1.5 cm-1 of the distribution image.
accepted
accepted
rejected
a b
c d
Chapter 4: Development of ATR-FTIR imaging approach on carbonaceous materials
- 136 -
Figure 4-23. Panel a) shows the distribution of sulphates based on the integrated absorbance in the range of 1180-1100 cm-1. The accepted domain of interest is surrounded by blue contours. Panel b) shows the spectra extracted from accepted and rejected area of the distribution image from location denoted by the arrows. Panel c) shows the integrated absorbance of each detector pixel. Panel d) is the binary image created with the threshold limit of 0.6-3 cm-1 of the distribution image.
4.4.3 Results and discussion
Figure 4-24 shows the fourteen distribution images of oxalate compound distribution
and their converted binary images. The order of the images was random as the ATR-
FTIR measurement was carried out in random. Figure 4-25 shows the percentage area
of RFD covered with oxalate compound and its standard deviation with different
number of chemical images analysed. One image analysed means that the particle
statistic result was calculated on just Image 1 in Figure 4-24. Five images analysed
means that the result was calculated based on cumulative information from Images 1
to 5. The chart in Figure 4-25 shows that if four images were taken to represent the
distribution of the oxalate in the sample, it would have been assumed that 42 % of the
sampled area was covered with oxalate compound. However, percentage area covered
decreases with more images analysed and it stabilises at around 28 % with nine
accepted
accepted
rejected
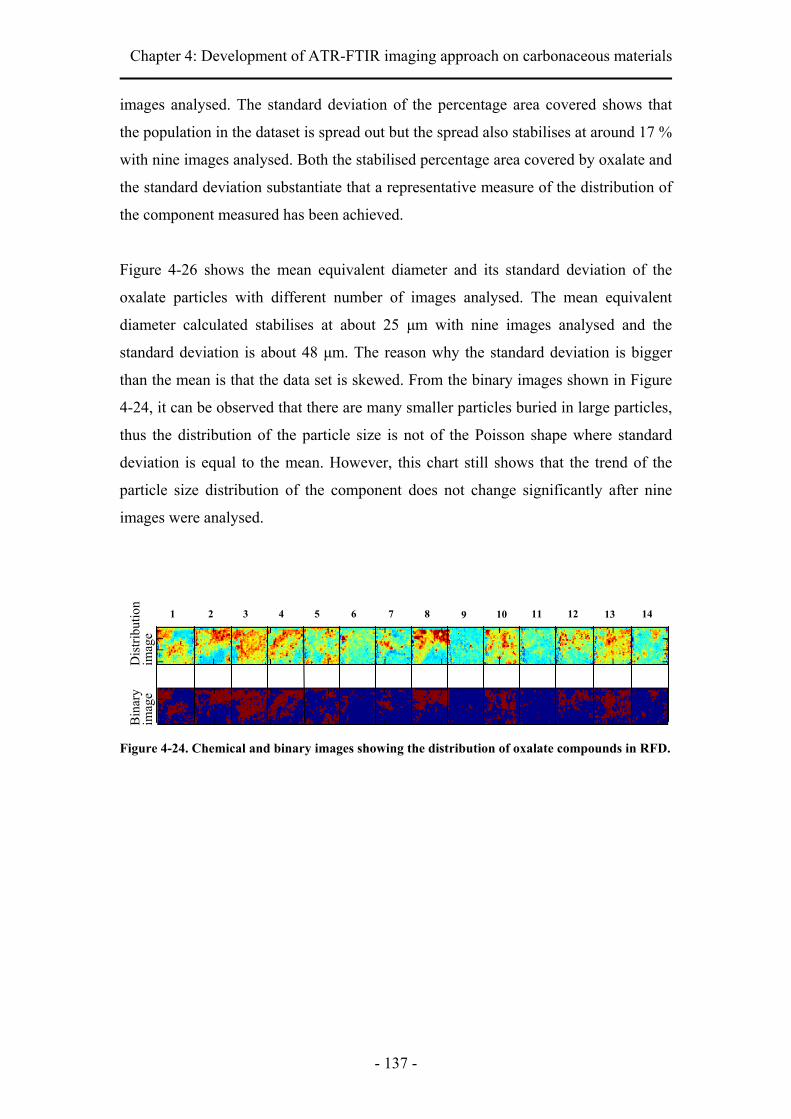
Chapter 4: Development of ATR-FTIR imaging approach on carbonaceous materials
- 137 -
images analysed. The standard deviation of the percentage area covered shows that
the population in the dataset is spread out but the spread also stabilises at around 17 %
with nine images analysed. Both the stabilised percentage area covered by oxalate and
the standard deviation substantiate that a representative measure of the distribution of
the component measured has been achieved.
Figure 4-26 shows the mean equivalent diameter and its standard deviation of the
oxalate particles with different number of images analysed. The mean equivalent
diameter calculated stabilises at about 25 μm with nine images analysed and the
standard deviation is about 48 μm. The reason why the standard deviation is bigger
than the mean is that the data set is skewed. From the binary images shown in Figure
4-24, it can be observed that there are many smaller particles buried in large particles,
thus the distribution of the particle size is not of the Poisson shape where standard
deviation is equal to the mean. However, this chart still shows that the trend of the
particle size distribution of the component does not change significantly after nine
images were analysed.
Figure 4-24. Chemical and binary images showing the distribution of oxalate compounds in RFD.
1 2 3 4 5 6 7 8 9 10 11 12 13 14
Bin
ary
imag
e D
istri
butio
n im
age
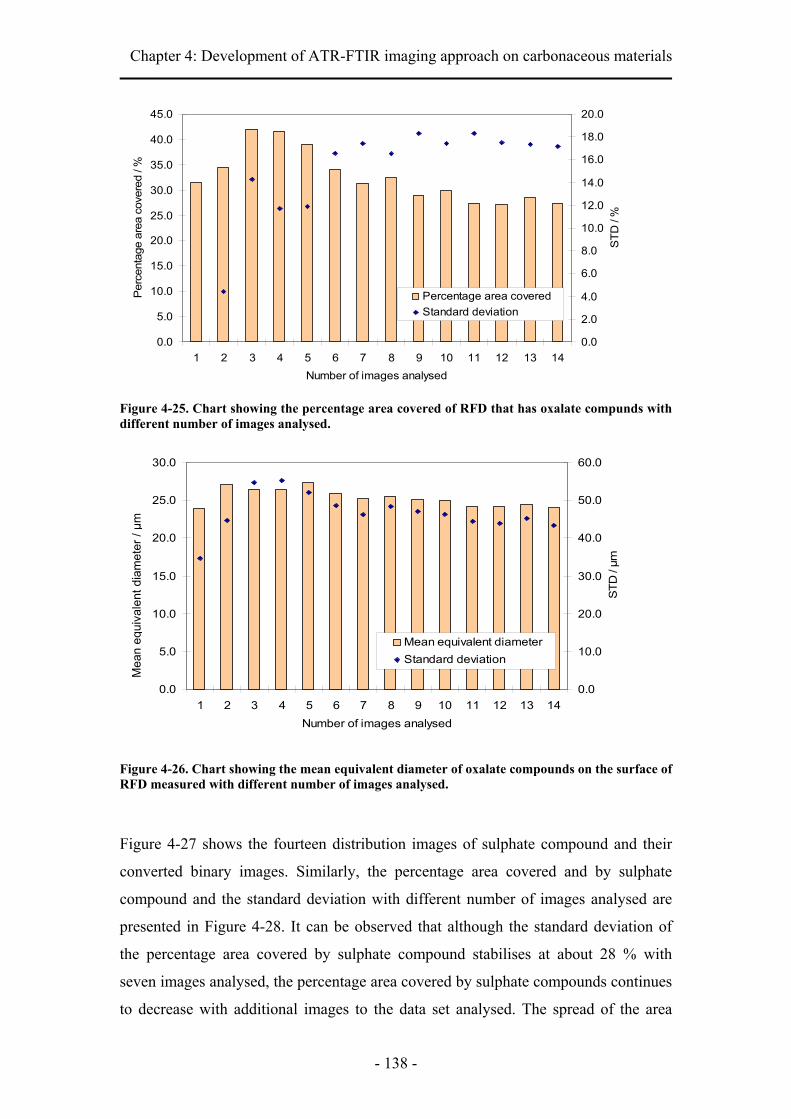
Chapter 4: Development of ATR-FTIR imaging approach on carbonaceous materials
- 138 -
Figure 4-25. Chart showing the percentage area covered of RFD that has oxalate compunds with different number of images analysed.
Figure 4-26. Chart showing the mean equivalent diameter of oxalate compounds on the surface of RFD measured with different number of images analysed.
Figure 4-27 shows the fourteen distribution images of sulphate compound and their
converted binary images. Similarly, the percentage area covered and by sulphate
compound and the standard deviation with different number of images analysed are
presented in Figure 4-28. It can be observed that although the standard deviation of
the percentage area covered by sulphate compound stabilises at about 28 % with
seven images analysed, the percentage area covered by sulphate compounds continues
to decrease with additional images to the data set analysed. The spread of the area
0.0
5.0
10.0
15.0
20.0
25.0
30.0
1 2 3 4 5 6 7 8 9 10 11 12 13 14Number of images analysed
Mea
n eq
uiva
lent
dia
met
er / μm
0.0
10.0
20.0
30.0
40.0
50.0
60.0
STD
/ μm
Mean equivalent diameterStandard deviation
Mea
n eq
uiva
lent
dia
met
er / μm
0.0
5.0
10.0
15.0
20.0
25.0
30.0
35.0
40.0
45.0
1 2 3 4 5 6 7 8 9 10 11 12 13 14Number of images analysed
Per
cent
age
area
cov
ered
/ %
0.0
2.0
4.0
6.0
8.0
10.0
12.0
14.0
16.0
18.0
20.0
STD
/ %
Percentage area coveredStandard deviation

Chapter 4: Development of ATR-FTIR imaging approach on carbonaceous materials
- 139 -
stays the same but the mean percentage area covered by the component still fluctuates
with more images analysed. Similarly, the mean equivalent diameter of the sulphate
particles calculated and its standard deviation with different number of images
analysed, shown in Figure 4-29, do not show a stabilising trend. This shows that even
with a data set of fourteen images, an equivalent sampled area of 4.5 mm2, a
representative distribution of the sulphate compound was not yet achieved. Hence, for
a data set to be a statistically significant representation of the distribution of the
sulphate compound, more images would have to be measured.
Figure 4-27. Chemical and binary images showing the distribution of sulphate compounds in RFD.
Figure 4-28. Chart showing the percentage area covered of RFD that has sulphates compounds with different number of images analysed.
1 2 3 4 5 6 7 8 9 10 11 12 13 14
Bin
ary
imag
e D
istri
butio
n im
age
0.0
10.0
20.0
30.0
40.0
50.0
60.0
1 2 3 4 5 6 7 8 9 10 11 12 13 14Number of images analysed
Per
cent
age
area
cov
ered
/ %
0.0
5.0
10.0
15.0
20.0
25.0
30.0
35.0S
TD /
%
Percentage area coveredStandard deviation
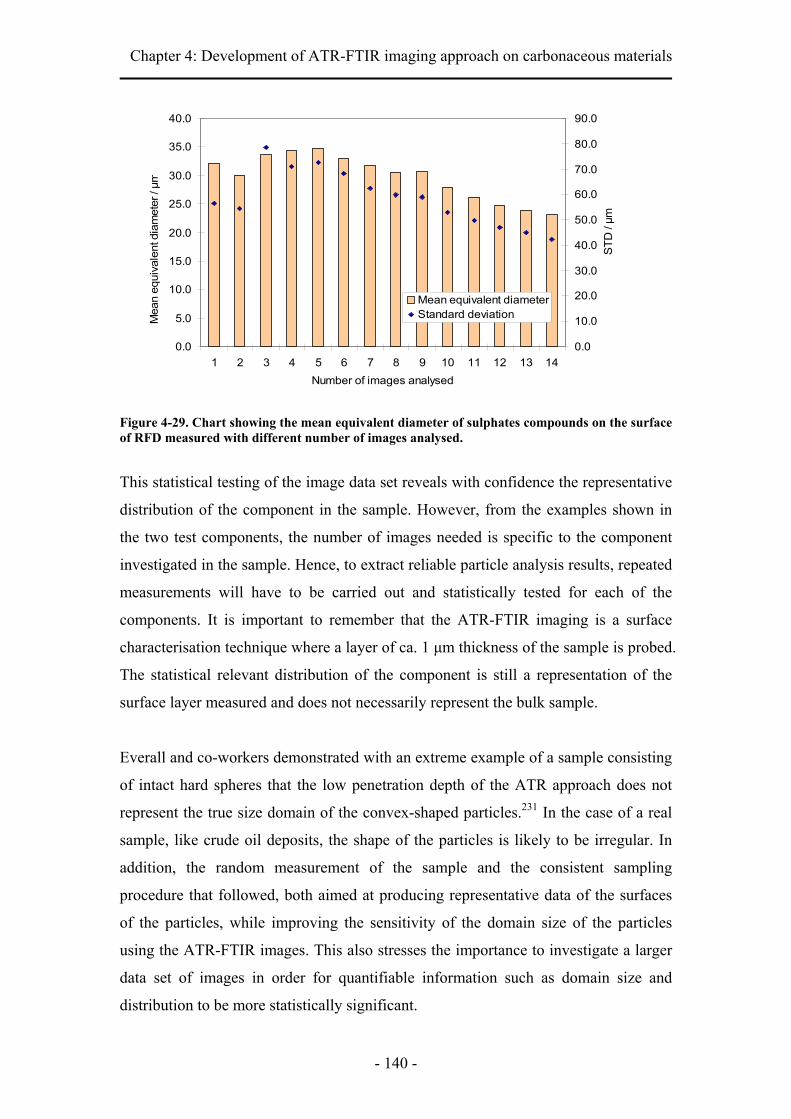
Chapter 4: Development of ATR-FTIR imaging approach on carbonaceous materials
- 140 -
Figure 4-29. Chart showing the mean equivalent diameter of sulphates compounds on the surface of RFD measured with different number of images analysed.
This statistical testing of the image data set reveals with confidence the representative
distribution of the component in the sample. However, from the examples shown in
the two test components, the number of images needed is specific to the component
investigated in the sample. Hence, to extract reliable particle analysis results, repeated
measurements will have to be carried out and statistically tested for each of the
components. It is important to remember that the ATR-FTIR imaging is a surface
characterisation technique where a layer of ca. 1 μm thickness of the sample is probed.
The statistical relevant distribution of the component is still a representation of the
surface layer measured and does not necessarily represent the bulk sample.
Everall and co-workers demonstrated with an extreme example of a sample consisting
of intact hard spheres that the low penetration depth of the ATR approach does not
represent the true size domain of the convex-shaped particles.231 In the case of a real
sample, like crude oil deposits, the shape of the particles is likely to be irregular. In
addition, the random measurement of the sample and the consistent sampling
procedure that followed, both aimed at producing representative data of the surfaces
of the particles, while improving the sensitivity of the domain size of the particles
using the ATR-FTIR images. This also stresses the importance to investigate a larger
data set of images in order for quantifiable information such as domain size and
distribution to be more statistically significant.
0.0
5.0
10.0
15.0
20.0
25.0
30.0
35.0
40.0
1 2 3 4 5 6 7 8 9 10 11 12 13 14Number of images analysed
Mea
n eq
uiva
lent
dia
met
er / μm
0.0
10.0
20.0
30.0
40.0
50.0
60.0
70.0
80.0
90.0
STD
/ μm
Mean equivalent diameterStandard deviation

Chapter 4: Development of ATR-FTIR imaging approach on carbonaceous materials
- 141 -
4.4.4 Conclusion
This study has successfully shown a statistical testing approach to determine how
large a data set (the number of chemical images analysed) is needed to show a
representative distribution of a particular component in the sample. The first test
component was the oxalate compound in RFD. It was shown that the analysis of nine
macro ATR-FTIR images was enough to quantify parameters such as fraction of the
imaged area with the component present and the mean equivalent diameter of the
particles with statistical confidence. They have been found to be 28 % and 25 μm
respectively. Analysing more images does not improve the mean or the standard
deviation calculated. The second test component showed an example where more
images were needed before these parameters can be determined reliably as even with
fourteen images analysed, the trend of the distribution was still not consistent.
In summary, quantifiable parameters regarding the chemical species in fouling
materials such as the domain size and distribution are important when it comes to
classification of the deposit and the association of different types of fouling
mechanism. Distribution of these particle sizes may be correlated to the type of crude
oil or operating conditions which may result in different degree of fouling. Apart from
getting the percentage of components on the surface of the sample, it also provide a
mean particle size of the components and the standard deviation of these particle sizes
which can only be obtained when imaging is applied. ATR-FTIR imaging has been
demonstrated to be able to provide important spatial and chemical information of the
deposited foulants. Crude oil deposits are often extremely heterogeneous due to the
complex nature of the fouling mechanisms. The statistical testing method developed
here allows representative parameters to be determined from a set of obtained
chemical images.
Chapter 4: Development of ATR-FTIR imaging approach on carbonaceous materials
- 142 -
4.5 Application of ATR-FTIR imaging to study the heating of crude
oil
4.5.1 Introduction
This section aims to develop an approach using ATR-FTIR imaging to analyse the
chemical changes in crude oil during heating. A novel application of using a diamond
ATR accessory to chemically image in situ the precipitation process of crude oil
fouling at high temperatures is introduced. This opportunity which has been brought
about by the flexibility of the diamond ATR accessory (Section 2.6.7), allows the
chemical transformation of the deposition process in crude oil to be monitored and
potentially be used to determine the onset of fouling spectroscopically.
The heat-treated sample was also analysed with micro ATR-FTIR imaging. This
allows the characterisation of the particulates formed in deposits which may not have
been resolved by macro ATR-FTIR imaging. Factor analysis (FA), a type of
multivariate imaging data analysis method, was also applied to a micro ATR-FTIR
image to spatially and spectrally differentiate components in the particulate deposit
which cannot be achieved via the univariate analysis owing to the overlapping
spectral features in the IR spectrum.
4.5.2 Experimental
4.5.2.1 Samples
Crude-P is a blend of six different crude oils. It contains about 3.1 % by mass of
asphaltenes following the ASTM standard procedure (D3279)46. The elemental
analysis of the blended crude oil and its extracted asphaltenes is presented in Table
4-2.

Chapter 4: Development of ATR-FTIR imaging approach on carbonaceous materials
- 143 -
Table 4-2. Elemental analysis of Crude-P and ASP-P in weight percentage.
4.5.2.2 In situ heating of crude oil studied with ATR-FTIR imaging
The in situ experiment was carried out using an FTIR imaging system in the macro
approach. The diamond ATR accessory, supercritical fluid analyser from Specac Ltd,
was used together with a high temperature cell. The schematic diagram of the high
temperature cell is shown in Figure 4-30. The cell was sealed with a
poly(tetrafluoroethylene) (PTFE) spacer against the tungsten carbide disk, and
downward force to form the seal was exerted by using the gate of the ATR accessory
to lock the cell in position. The temperature of the high-pressure cell can be adjusted
using the temperature control unit connected to the top plate of the ATR accessory.
About 10 mg of Crude-P was deposited on the top surface of the diamond crystal and
the cell was sealed. A small flow of nitrogen gas was then passed through the cell for
an hour to purge the remaining air in the cell. The valves were then closed to seal the
cell from the environment The temperature of the cell was adjusted by steps of 25 °C
with a thermal equilibrium time of 30 minutes at each change. The sample was heated
to 200 °C and maintained at this point for four hours before cooling back to 25 °C.
The macro ATR-FTIR images were collected at different temperatures and time
intervals with 32 co-additions, a spectral range of 3900-900 cm-1 and a spectral
resolution of 8 cm-1.
Sample % of Crude1 C H N Stotal O C/H2 C/O3
Crude-P - 84.34 11.48 0.88 2.6 0.7 0.6122 160.648ASP-P 3.1 85.44 7.76 0.83 4.83 1.14 0.9175 99.930
1 Weight in wt. %2 Carbon/hydrogen atomic ratio3 Carbon oxygen atomic ratio

Chapter 4: Development of ATR-FTIR imaging approach on carbonaceous materials
- 144 -
Figure 4-30. Schematic diagram of the high temperature cell used.
4.5.2.3 Analysis of crude oil particulates using micro ATR-FTIR imaging
The cell was removed from the ATR accessory after the heating experiment. A
spatula was used to remove part of the Crude-P sample from the top of the diamond
crystal and the sample was smeared on a barium fluoride, BaF2, window. A BaF2
window was chosen as it is IR transparent in the spectral range measured by the FPA
detector. Areas of interest of the sample were selected and analysed using micro
ATR-FTIR imaging as described in Section 3.2.2. The micro ATR-FTIR images were
captured with 200 co-additions, a spectral range of 3900-900 cm-1 and a spectral
resolution of 8 cm-1.
4.5.2.4 Factor analysis of micro ATR-FTIR images
FA was carried out using a commercially available chemical imaging software,
ISysTM 4.0 (Malvern Instruments). The data set was truncated to the spectral range of
1800-950 cm-1 and a linear baseline was drawn to prevent spurious background
effects in the calculation. The score segregation routine was performed. The score
segregation acceleration parameter was set at 10 and only the unipolar positive
loadings were considered.
4.5.3 Results and discussion
4.5.3.1 In situ studies of heating of crude oil
The time-temperature effect on crude oil has been monitored in situ for the first time
using ATR-FTIR imaging. FTIR images, capturing the changes in the distribution of
chemical components in oil samples during the heating process, are presented in
IR beam
diamonddetector
PTFE ring
sample film
to heat controller
high temperature cell
tungsten carbide disc
N2
valve valve
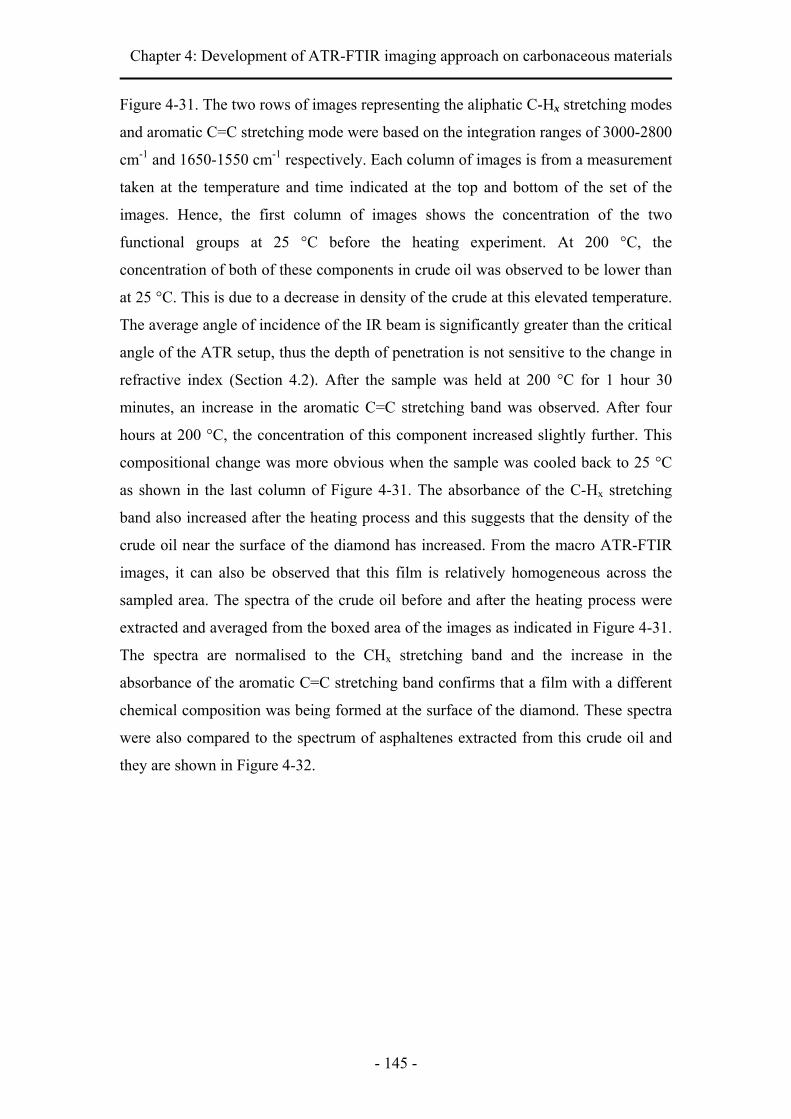
Chapter 4: Development of ATR-FTIR imaging approach on carbonaceous materials
- 145 -
Figure 4-31. The two rows of images representing the aliphatic C-Hx stretching modes
and aromatic C=C stretching mode were based on the integration ranges of 3000-2800
cm-1 and 1650-1550 cm-1 respectively. Each column of images is from a measurement
taken at the temperature and time indicated at the top and bottom of the set of the
images. Hence, the first column of images shows the concentration of the two
functional groups at 25 °C before the heating experiment. At 200 °C, the
concentration of both of these components in crude oil was observed to be lower than
at 25 °C. This is due to a decrease in density of the crude at this elevated temperature.
The average angle of incidence of the IR beam is significantly greater than the critical
angle of the ATR setup, thus the depth of penetration is not sensitive to the change in
refractive index (Section 4.2). After the sample was held at 200 °C for 1 hour 30
minutes, an increase in the aromatic C=C stretching band was observed. After four
hours at 200 °C, the concentration of this component increased slightly further. This
compositional change was more obvious when the sample was cooled back to 25 °C
as shown in the last column of Figure 4-31. The absorbance of the C-Hx stretching
band also increased after the heating process and this suggests that the density of the
crude oil near the surface of the diamond has increased. From the macro ATR-FTIR
images, it can also be observed that this film is relatively homogeneous across the
sampled area. The spectra of the crude oil before and after the heating process were
extracted and averaged from the boxed area of the images as indicated in Figure 4-31.
The spectra are normalised to the CHx stretching band and the increase in the
absorbance of the aromatic C=C stretching band confirms that a film with a different
chemical composition was being formed at the surface of the diamond. These spectra
were also compared to the spectrum of asphaltenes extracted from this crude oil and
they are shown in Figure 4-32.

Chapter 4: Development of ATR-FTIR imaging approach on carbonaceous materials
- 146 -
Figure 4-31. ATR-FTIR images of P crude during heating and cooling of the experiment.
Figure 4-32. Averaged spectra of the measured sample before and after the heating process.
Two observations can be made from the spectra of the sample before and after the
heating process. First, is the increase in absorbance band corresponding to the
aromatic C=C stretching mode and second is the increased absorbance in the 1400-
900 cm-1 spectral region. Both are characteristic traits of the spectrum of asphaltenes
(black spectrum). Hence, spectral changes observed in the crude oil during the heating
process suggest that asphaltenes precipitate from the crude oil and form a film on the
25 °C 200 °C 200 °C 25 °C
8
3000
-280
0 cm
-1 28
1650
-155
0 cm
-1
1.1
-0.1
after heating
4 hr at temperature
before heating
0 hr at temperature
1 hr 30 min at temperature
200 °C
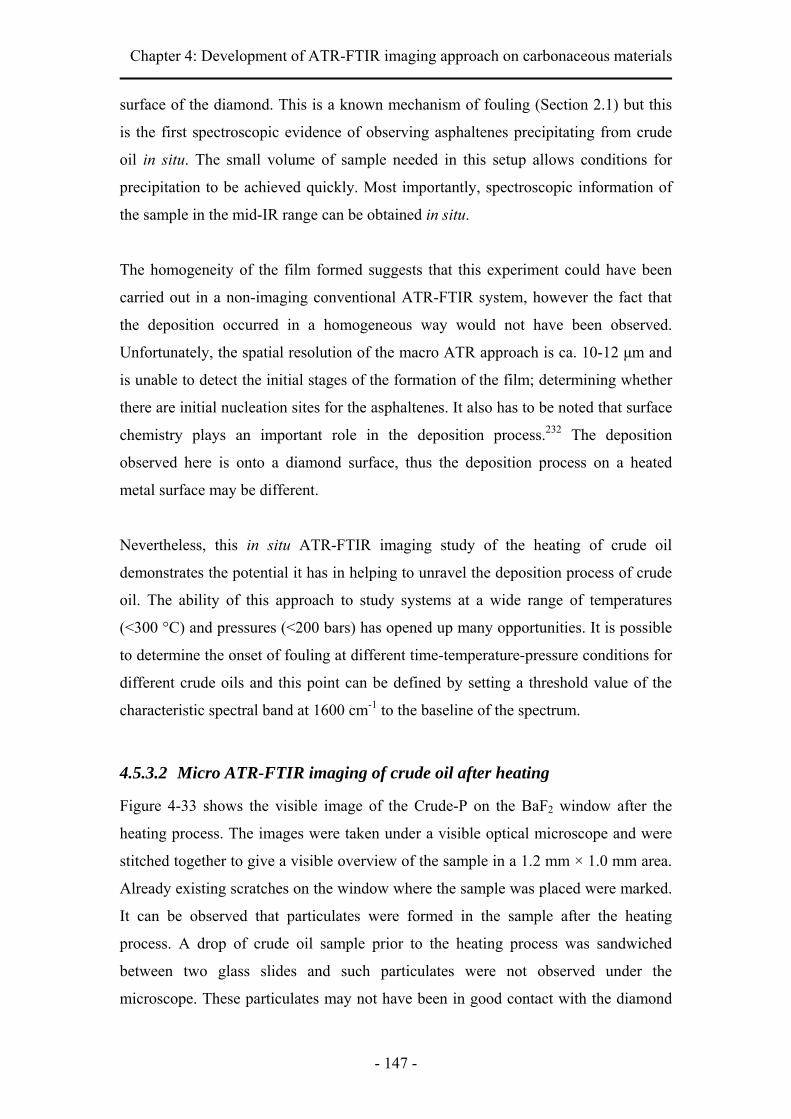
Chapter 4: Development of ATR-FTIR imaging approach on carbonaceous materials
- 147 -
surface of the diamond. This is a known mechanism of fouling (Section 2.1) but this
is the first spectroscopic evidence of observing asphaltenes precipitating from crude
oil in situ. The small volume of sample needed in this setup allows conditions for
precipitation to be achieved quickly. Most importantly, spectroscopic information of
the sample in the mid-IR range can be obtained in situ.
The homogeneity of the film formed suggests that this experiment could have been
carried out in a non-imaging conventional ATR-FTIR system, however the fact that
the deposition occurred in a homogeneous way would not have been observed.
Unfortunately, the spatial resolution of the macro ATR approach is ca. 10-12 μm and
is unable to detect the initial stages of the formation of the film; determining whether
there are initial nucleation sites for the asphaltenes. It also has to be noted that surface
chemistry plays an important role in the deposition process.232 The deposition
observed here is onto a diamond surface, thus the deposition process on a heated
metal surface may be different.
Nevertheless, this in situ ATR-FTIR imaging study of the heating of crude oil
demonstrates the potential it has in helping to unravel the deposition process of crude
oil. The ability of this approach to study systems at a wide range of temperatures
(<300 °C) and pressures (<200 bars) has opened up many opportunities. It is possible
to determine the onset of fouling at different time-temperature-pressure conditions for
different crude oils and this point can be defined by setting a threshold value of the
characteristic spectral band at 1600 cm-1 to the baseline of the spectrum.
4.5.3.2 Micro ATR-FTIR imaging of crude oil after heating
Figure 4-33 shows the visible image of the Crude-P on the BaF2 window after the
heating process. The images were taken under a visible optical microscope and were
stitched together to give a visible overview of the sample in a 1.2 mm × 1.0 mm area.
Already existing scratches on the window where the sample was placed were marked.
It can be observed that particulates were formed in the sample after the heating
process. A drop of crude oil sample prior to the heating process was sandwiched
between two glass slides and such particulates were not observed under the
microscope. These particulates may not have been in good contact with the diamond

Chapter 4: Development of ATR-FTIR imaging approach on carbonaceous materials
- 148 -
crystal and hence may not have been observed in the macro ATR-FTIR imaging.
Micro ATR-FTIR imaging allows these areas, where the particulates are found, to be
selected and analysed. FTIR images from four of these areas, Area 1 to 4, are
presented and explained in more detail.
Figure 4-34a shows the visible image of Area 1 and the box represents the measured
area of the micro ATR-FTIR measurement. The chemical image, as shown in Figure
4-34b, is based on the integrated absorbance in the range of 3000-2800 cm-1 and
shows the distribution of the crude oil in the measured area. The chemical image of
the particulate, based on the integrated absorbance in the range of 1145-965 cm-1, is
shown in Figure 4-34c. The spectra of the crude oil and particulate were extracted
from area denoted by the arrow and presented as Figure 4-34d and Figure 4-34e
respectively. The spectrum of the particulate, Figure 4-34e, closely resembles the
spectrum of kaolinite. 233, 234 The band at 3695 cm-1 can be assigned to the inner
surface ν(O-H) and the bands at 1032 cm-1 and 1007 cm-1 can be assigned to ν(Si-O-
Si).233 Kaolinite is a layered silicate mineral. It is possible that such minerals were in
the crude oil and during the heating process, leading to the silicates crystallising out
of the crude oil.
Figure 4-33. Visible image of crude oil on BaF2 window after heating.
scratches on window
100 μm
1
2
3
4
1.2 mm
selected area for micro ATR-FTIR measurement
1.0 mm

Chapter 4: Development of ATR-FTIR imaging approach on carbonaceous materials
- 149 -
Figure 4-34. a)Visible image and micro FTIR-ATR images of Area 1 showing the distribution of the integrated absorbance of b) crude oil in the range of 3000-2800 cm-1 and c) particulate in the range of 1145-965 cm-1. Spectra representing the d) crude oil and e) particulate are presented.
In Area 2, a different component was observed. The FTIR image in Figure 4-35 was
based on the increase in absorbance at 1900 cm-1. This material is similar to the
“coke-like” material observed in the real deposit from the refinery (Section 4.2) and
extracted asphaltenes (Section 4.3). This suggests that this component which
precipitates out of the crude oil on heating is likely to be associated with asphaltene
deposition since they have a similar solubility class (Section 4.3). Although an
asphaltenic film was detected on the surface of the diamond during the in situ heating
study using macro ATR-FTIR imaging, it was not possible to retrieve this layer of
deposit on the diamond for micro ATR-FTIR imaging. It was visually impossible to
differentiate this film from the crude oil. Micro ATR-FTIR measurements were
confined to particulates that can be localised visually.
1145
-965
cm
-1
0
30
00
30
00
30
00
12
00
12
00
12
0
3000
-280
0 cm
-1
a) b) c)
d) e)
10 μm

Chapter 4: Development of ATR-FTIR imaging approach on carbonaceous materials
- 150 -
Figure 4-35. a)Visible image and b)micro FTIR-ATR image of Area 2 showing the distribution of “coke-like” material based on the shift in the baseline absorbance at 1900 cm-1. A spectrum from this particulate is shown in panel c).
Figure 4-36 shows the visible image and micro ATR-FTIR images of Area 3. The
spectrum extracted from the particulate in this area, as shown in Figure 4-36d, closely
resembles the spectrum of the amide functional group.235 Figure 4-36b shows the
distribution of this amide functional group based on the integrated absorbance at
1700-1600 cm-1. A cluster of a chemically different component was also observed in
the middle of the particulate and the image showing the distribution of this component
was based on the integrated absorbance at 1200-910 cm-1 (Figure 4-36c). This cluster
can be assigned to the sulfoxide functional group (Section 4.2.3.3). Nitrogen species
are readily found in crude oil and asphaltenes and they mostly exist in heterocyclic
forms.20 Mitra-Kirley and co-workers236 have used XANES to show that pyrrolic
nitrogen and pyridinic nitrogen are the two major types nitrogen found in asphaltenes.
In crude oil, more forms of aromatic nitrogen species are found and the amide species
is one of them237. In addition, amides are stable nitrogen species due to its resonance
stabilisation effect and some of the nitrogen species may have reacted in the presence
of traces of oxygen and formed the more stable amide linkages during the heating
process. Several other areas of the sample have also shown the presence of this
material thus indicating that this is a common constituent of deposits in this
experimental setup.
Shi
ft at
190
0 cm
-1
0
0.2
00
0.2
00
0.2
00
0.2
0
a) b)
c)
10 μm
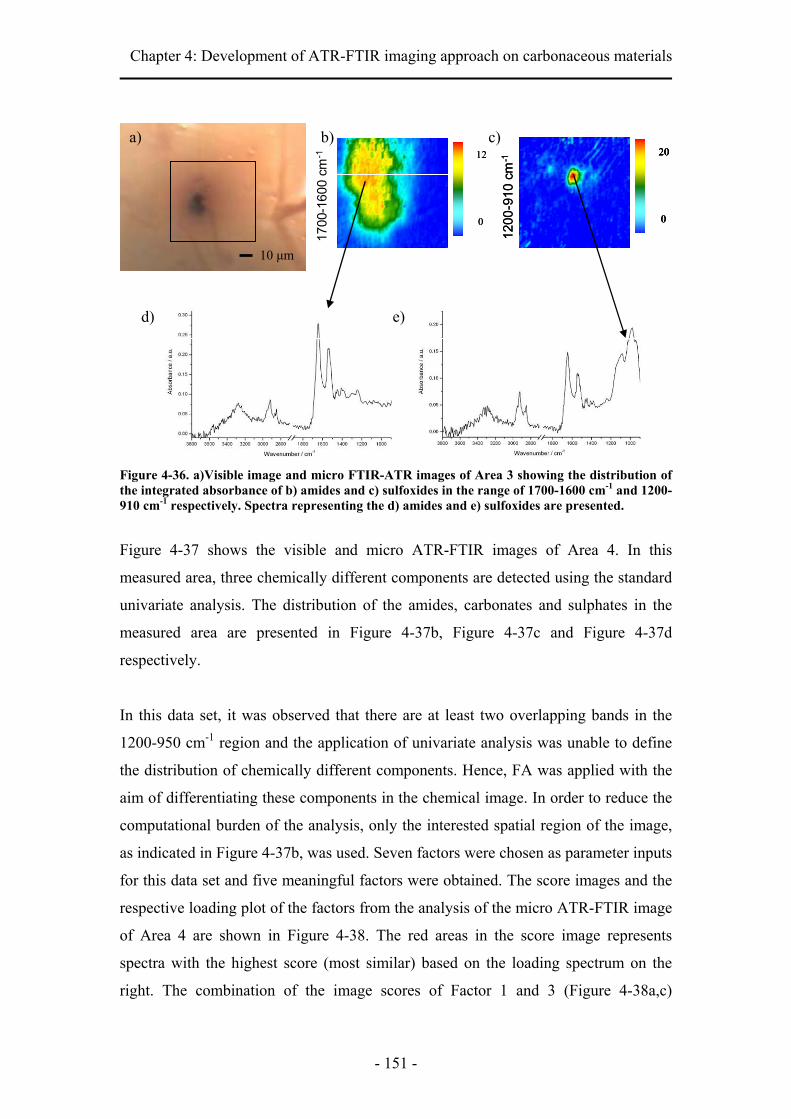
Chapter 4: Development of ATR-FTIR imaging approach on carbonaceous materials
- 151 -
Figure 4-36. a)Visible image and micro FTIR-ATR images of Area 3 showing the distribution of the integrated absorbance of b) amides and c) sulfoxides in the range of 1700-1600 cm-1 and 1200-910 cm-1 respectively. Spectra representing the d) amides and e) sulfoxides are presented.
Figure 4-37 shows the visible and micro ATR-FTIR images of Area 4. In this
measured area, three chemically different components are detected using the standard
univariate analysis. The distribution of the amides, carbonates and sulphates in the
measured area are presented in Figure 4-37b, Figure 4-37c and Figure 4-37d
respectively.
In this data set, it was observed that there are at least two overlapping bands in the
1200-950 cm-1 region and the application of univariate analysis was unable to define
the distribution of chemically different components. Hence, FA was applied with the
aim of differentiating these components in the chemical image. In order to reduce the
computational burden of the analysis, only the interested spatial region of the image,
as indicated in Figure 4-37b, was used. Seven factors were chosen as parameter inputs
for this data set and five meaningful factors were obtained. The score images and the
respective loading plot of the factors from the analysis of the micro ATR-FTIR image
of Area 4 are shown in Figure 4-38. The red areas in the score image represents
spectra with the highest score (most similar) based on the loading spectrum on the
right. The combination of the image scores of Factor 1 and 3 (Figure 4-38a,c)
1700
-160
0 cm
- 1
0
12
0
12
0
20
0
20
0
20
0
20
1200
-910
cm
-112
00-9
10 c
m-1
a) b) c)
d) e)
10 μm

Chapter 4: Development of ATR-FTIR imaging approach on carbonaceous materials
- 152 -
complements the univariate image in Figure 4-37b which shows the distribution of the
amides. Judging from the corresponding loading spectra, the FA algorithm has
differentiated them as two different factors because of the variation in the baseline
near 1300 cm-1. Factor 5 (Figure 4-38d) clearly shows the distribution of the
carbonates and this complements very well with the image generated through
univariate means as shown in Figure 4-37c. The benefit of multivariate analysis
becomes clear when the score images of Factor 2 (Figure 4-38b) and Factor 8 (Figure
4-38e) are compared. Two spatially distinct distributions with different but
overlapping absorption spectra were identified. From the loading spectra, Factor 2 can
be assigned to sulphates (Section 4.3.3.1) and Factor 8 to vitrinite compounds
(Section 4.3.3.2). The band at 1175-960 cm-1 is a characteristic band of cellulose
which is a constituent of vitrinite compounds. Similar to the “coke-like” material, this
vitrinite compound was also found in extracted asphaltenes (Section 4.3.3.2). Upon
heating, the vitrinite compound precipitated out of the crude oil. This demonstrates
that components may be overlooked if only univariate analysis of the FTIR images is
applied, especially when samples are complex and unknown.
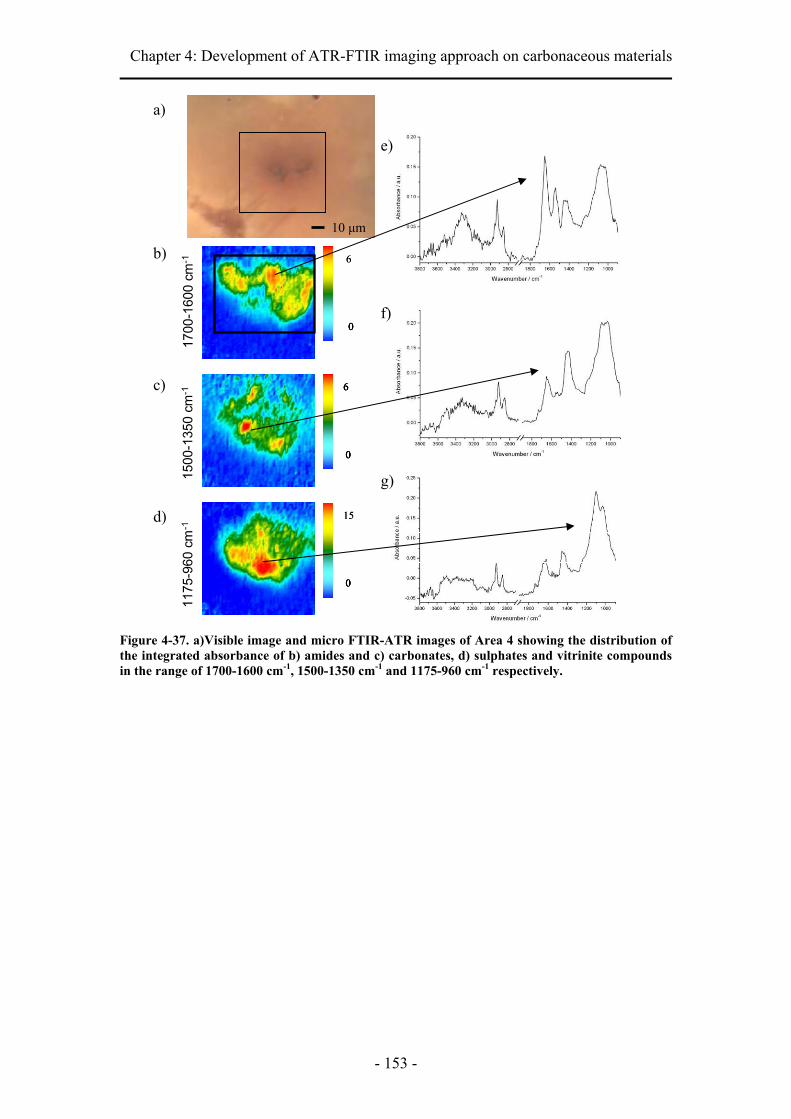
Chapter 4: Development of ATR-FTIR imaging approach on carbonaceous materials
- 153 -
Figure 4-37. a)Visible image and micro FTIR-ATR images of Area 4 showing the distribution of the integrated absorbance of b) amides and c) carbonates, d) sulphates and vitrinite compounds in the range of 1700-1600 cm-1, 1500-1350 cm-1 and 1175-960 cm-1 respectively.
1700
-160
0 cm
-115
00-1
350
cm-1
0
6
00
6
0
0
6
0
6
0
6
0
6
1175
-960
cm
-1
0
15
00
15
0
a)
b)
c)
d)
e)
f)
g)
10 μm
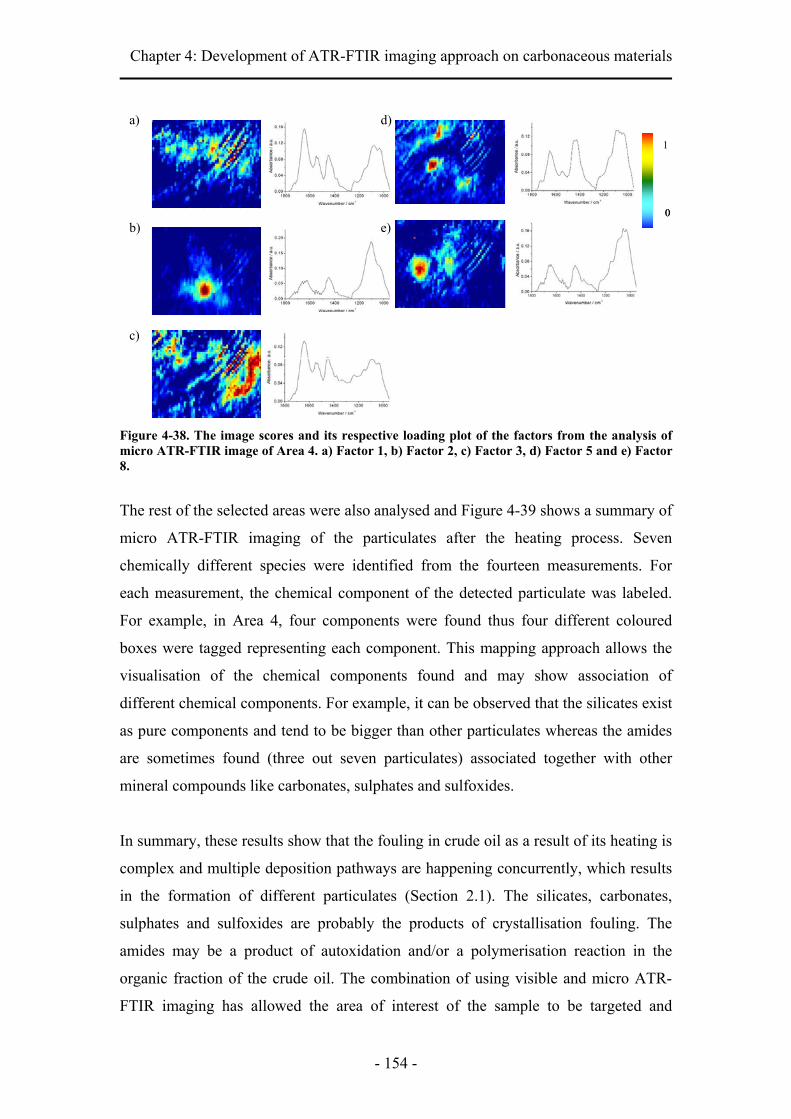
Chapter 4: Development of ATR-FTIR imaging approach on carbonaceous materials
- 154 -
Figure 4-38. The image scores and its respective loading plot of the factors from the analysis of micro ATR-FTIR image of Area 4. a) Factor 1, b) Factor 2, c) Factor 3, d) Factor 5 and e) Factor 8.
The rest of the selected areas were also analysed and Figure 4-39 shows a summary of
micro ATR-FTIR imaging of the particulates after the heating process. Seven
chemically different species were identified from the fourteen measurements. For
each measurement, the chemical component of the detected particulate was labeled.
For example, in Area 4, four components were found thus four different coloured
boxes were tagged representing each component. This mapping approach allows the
visualisation of the chemical components found and may show association of
different chemical components. For example, it can be observed that the silicates exist
as pure components and tend to be bigger than other particulates whereas the amides
are sometimes found (three out seven particulates) associated together with other
mineral compounds like carbonates, sulphates and sulfoxides.
In summary, these results show that the fouling in crude oil as a result of its heating is
complex and multiple deposition pathways are happening concurrently, which results
in the formation of different particulates (Section 2.1). The silicates, carbonates,
sulphates and sulfoxides are probably the products of crystallisation fouling. The
amides may be a product of autoxidation and/or a polymerisation reaction in the
organic fraction of the crude oil. The combination of using visible and micro ATR-
FTIR imaging has allowed the area of interest of the sample to be targeted and
0
1
0
a)
b)
c)
d)
e)
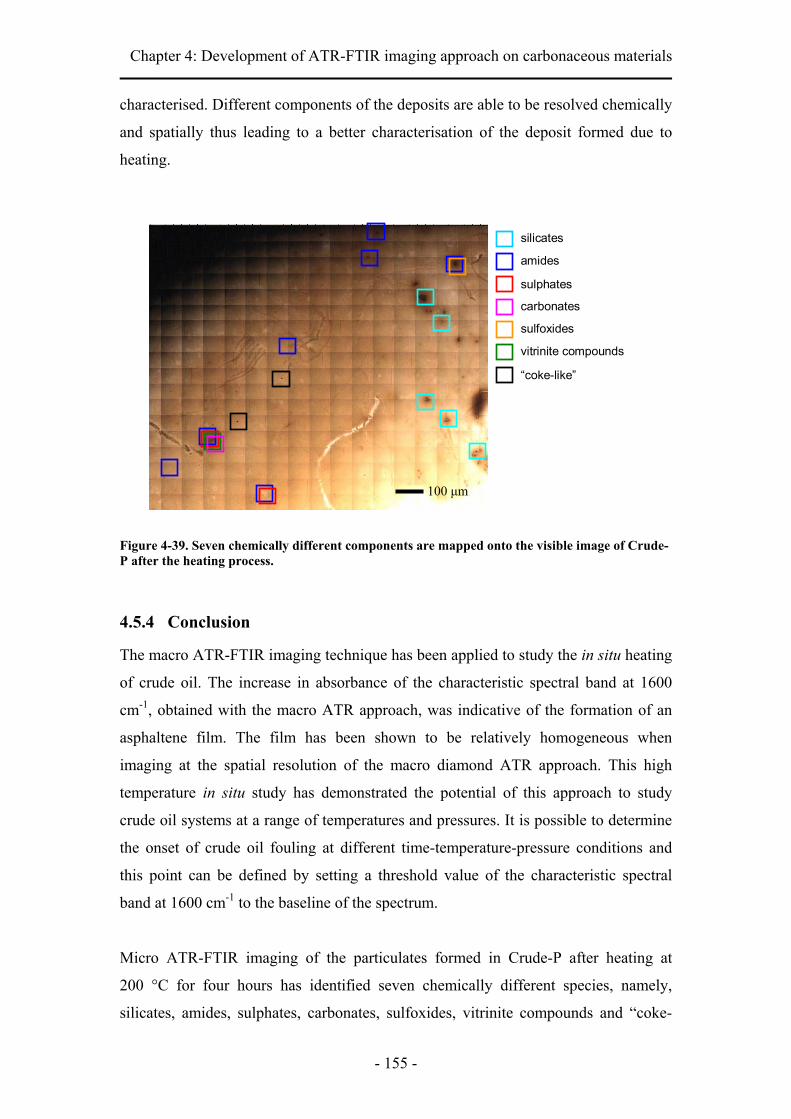
Chapter 4: Development of ATR-FTIR imaging approach on carbonaceous materials
- 155 -
characterised. Different components of the deposits are able to be resolved chemically
and spatially thus leading to a better characterisation of the deposit formed due to
heating.
Figure 4-39. Seven chemically different components are mapped onto the visible image of Crude-P after the heating process.
4.5.4 Conclusion
The macro ATR-FTIR imaging technique has been applied to study the in situ heating
of crude oil. The increase in absorbance of the characteristic spectral band at 1600
cm-1, obtained with the macro ATR approach, was indicative of the formation of an
asphaltene film. The film has been shown to be relatively homogeneous when
imaging at the spatial resolution of the macro diamond ATR approach. This high
temperature in situ study has demonstrated the potential of this approach to study
crude oil systems at a range of temperatures and pressures. It is possible to determine
the onset of crude oil fouling at different time-temperature-pressure conditions and
this point can be defined by setting a threshold value of the characteristic spectral
band at 1600 cm-1 to the baseline of the spectrum.
Micro ATR-FTIR imaging of the particulates formed in Crude-P after heating at
200 °C for four hours has identified seven chemically different species, namely,
silicates, amides, sulphates, carbonates, sulfoxides, vitrinite compounds and “coke-
silicates
amides
“coke-like”
sulphates
carbonates
sulfoxides
vitrinite compounds
100 μm

Chapter 4: Development of ATR-FTIR imaging approach on carbonaceous materials
- 156 -
like” materials. These particulates formed may be products of the different fouling
mechanisms.
This study has demonstrated that the different mechanisms of deposition;
crystallisation fouling, autoxidation/polymerisation fouling and asphaltene deposition
in crude oil, can be monitored by combining the two imaging approaches. Macro
ATR-FTIR imaging is able to detect the formation of an asphaltene film in situ and
micro ATR-FTIR imaging is able to characterise the particulates formed after the
heating. Hence, ATR-FTIR imaging has shown great potential in the ability to
monitor the precipitation of deposits due to heating and to better understand the
fundamentals of crude oil fouling.
- 157 -
CHAPTER FIVE
SORPTION OF CO2 BY ATR-FTIR
SPECTROSCOPY

Chapter 5: Sorption of CO2 by ATR-FTIR Spectroscopy
- 158 -
5 Sorption of CO2 by ATR-FTIR Spectroscopy
5.1 Introduction
Asphaltene properties such as gas sorption and swelling can be used in understanding
the structure of these complex molecules. Jaoui and co-workers238 have compared the
adsorption isotherms of phenol and 4-chlorophenol on extracted asphaltenes and
asphaltenes deposited on silica to investigate differences in their molecular
organisation. Carbognani and Rogel239 demonstrated an approach which uses swelling
studies to characterise asphaltenes. Also, the sorption properties of CO2 and other
light alkanes on asphaltenes were investigated by Dmitrievskii and co-workers240 to
aid the estimating of the level of reserves of gas-condensate fields.
ATR-FTIR spectroscopy has been used in obtaining both gas sorption and swelling
data simultaneously for polymers158, 241, ionic liquids242 and for coal materials243. In
order to assess the suitability of ATR-FTIR spectroscopy to study crude oil/CO2 phase
behaviour and the effect of CO2 on asphaltene instability and precipitation in crude
oils, an asphaltene and CO2 system is first investigated. This also has relevance to the
use of high-pressure CO2 for enhanced oil recovery and CO2 storage.
5.2 Experimental
5.2.1 Materials
Asphaltenes, ASP-A, extracted from crude oil, following the ASTM standard
procedure (D3279)46 were studied in this set of experiments. PEG 600 was purchased
from Sigma Aldrich and the HPLC grade chloroform was purchased from BDH. CO2
with a purity of 99.9 % was supplied by BOC and used without any further
purification.
5.2.2 Equipment
ATR-FTIR spectra were collected using an Equinox 55 FTIR spectrometer (Bruker
Optics, Germany) with an MCT detector. Samples were measured with a heated
Chapter 5: Sorption of CO2 by ATR-FTIR Spectroscopy
- 159 -
diamond ATR accessory, Golden Gate™ (Specac, Ltd., UK) in the main bench of the
spectrometer. The top plate of the ATR accessory is connected to a heat controller
where the required temperature can be set to ± 1 °C. The spectra were obtained with
20 scans for a reasonable SNR with a 2 cm-1 spectral resolution in the 3950-600 cm-1
range.
The transmission FTIR spectra were collected in a system comprised of an IFS66
FTIR spectrometer, an IR microscope (IRscope II) and an MCT detector from Bruker
Optics, Germany. The spectra were obtained with 100 coadded scans and a spectral
resolution of 8 cm-1 in the 3950-1500 cm-1 range.
The AFM measurement was carried out using an NTEGRA series scanning probe
microscope in the upright configuration (NT-MDT, Russia). Semi-contact mode was
used with a nose-type cantilever in an optical head to capture an AFM image of size
20 μm × 20 μm in 256 steps for each axis.
The calibration of the angle of incidence of the IR beam was carried out using the
Omni-Cell (Specac, UK) with a 25 micrometer Mylar spacer. The transmission cell
was filled PEG 600 and an FTIR spectrum of the sample was obtained using the
Equinox 55 spectrometer as shown in Figure 5-2.
For the experiments under pressurised CO2, a specially designed high-pressure cell
was used together with the heated diamond ATR accessory as shown in Figure 5-1.
This setup has been described in detail before.244 The pressure of CO2 was controlled
by a syringe pump (Teledyne 500D, Isco, USA).

Chapter 5: Sorption of CO2 by ATR-FTIR Spectroscopy
- 160 -
Figure 5-1. Schematic diagram of high pressure cell equipped on diamond ATR accessory.
Figure 5-2. Omni-Cell used in transmission measurement to calibrate the average angle of incidence of the ATR accessory.
Force
IR beam Diamond Detector
PTFE ring Sample film
CO2 CO2
CaF2 windows
Luer plug
Filling port
25 μm spacer
Sample
IR beam
Quick release nut
To MCT detector
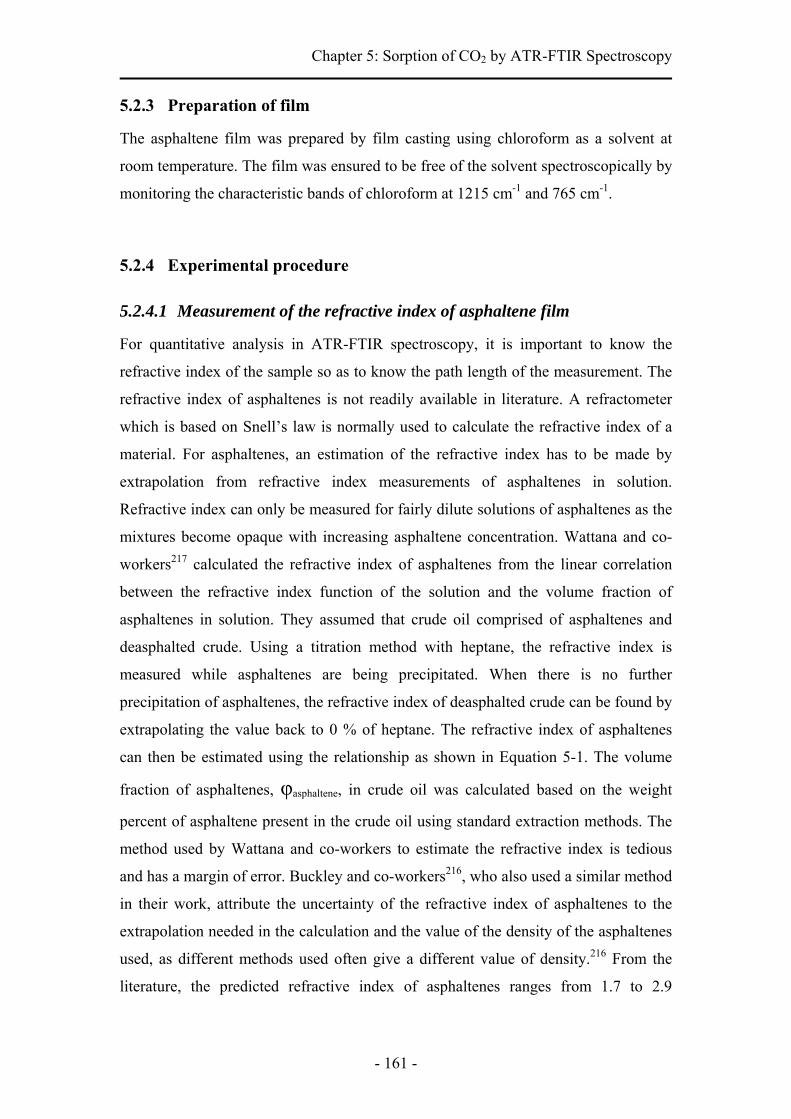
Chapter 5: Sorption of CO2 by ATR-FTIR Spectroscopy
- 161 -
5.2.3 Preparation of film
The asphaltene film was prepared by film casting using chloroform as a solvent at
room temperature. The film was ensured to be free of the solvent spectroscopically by
monitoring the characteristic bands of chloroform at 1215 cm-1 and 765 cm-1.
5.2.4 Experimental procedure
5.2.4.1 Measurement of the refractive index of asphaltene film
For quantitative analysis in ATR-FTIR spectroscopy, it is important to know the
refractive index of the sample so as to know the path length of the measurement. The
refractive index of asphaltenes is not readily available in literature. A refractometer
which is based on Snell’s law is normally used to calculate the refractive index of a
material. For asphaltenes, an estimation of the refractive index has to be made by
extrapolation from refractive index measurements of asphaltenes in solution.
Refractive index can only be measured for fairly dilute solutions of asphaltenes as the
mixtures become opaque with increasing asphaltene concentration. Wattana and co-
workers217 calculated the refractive index of asphaltenes from the linear correlation
between the refractive index function of the solution and the volume fraction of
asphaltenes in solution. They assumed that crude oil comprised of asphaltenes and
deasphalted crude. Using a titration method with heptane, the refractive index is
measured while asphaltenes are being precipitated. When there is no further
precipitation of asphaltenes, the refractive index of deasphalted crude can be found by
extrapolating the value back to 0 % of heptane. The refractive index of asphaltenes
can then be estimated using the relationship as shown in Equation 5-1. The volume
fraction of asphaltenes, φasphaltene, in crude oil was calculated based on the weight
percent of asphaltene present in the crude oil using standard extraction methods. The
method used by Wattana and co-workers to estimate the refractive index is tedious
and has a margin of error. Buckley and co-workers216, who also used a similar method
in their work, attribute the uncertainty of the refractive index of asphaltenes to the
extrapolation needed in the calculation and the value of the density of the asphaltenes
used, as different methods used often give a different value of density.216 From the
literature, the predicted refractive index of asphaltenes ranges from 1.7 to 2.9

Chapter 5: Sorption of CO2 by ATR-FTIR Spectroscopy
- 162 -
depending on the type of crude oil it was extracted from and how the experiment was
carried out.216, 217, 245, 246
)( dcrudedeasphaltecrudeasphaltene
dcrudedeasphalteasphaltene nnφ
nn -1
+= Equation 5-1
The effective path length in ATR, which follows Equation 2-9, is dependent on the
wavelength of light, the refractive index of the ATR crystal, the refractive index of the
sample and the angle of incidence of the incoming IR radiation. Hence, when the
angle of incidence of the system is known, the ATR absorbance of a film can be
compared to the absorbance of a film with known thickness, measured in transmission,
to calculate the refractive index of the material. The thickness of the film in the ATR
measurement has to be greater than the effective path length for Equation 2-9 to be
valid. In the case of a thin film, there are three media involved in the path of the
evanescence wave thus the equation used to calculate the effective path length will be
different.
5.2.4.2 Measurement of CO2 sorption in asphaltene film
The high-pressure cell was positioned on top of the diamond ATR crystal. The cell
was sealed by exerting a force from the top of the cell, pressing the PTFE ring which
acted as a seal for the system. The temperature of the diamond was set to 35 °C by a
heat controller which was connected to the ATR accessory. The high-pressure cell
was purged with a small flow of CO2 from the syringe pump to remove any air in the
cell. The pressure of the system was then raised by closing the outlet valve and
regulating the inlet flow of the CO2 gas. The system was left to equilibrate and FTIR
spectroscopic measurements were taken. Equilibrium was known to be reached when
there were no more changes to the absorbance of the bands in the recorded spectrum.
Measurements were carried out at 35 °C in the pressure range of 1-75 bar. The
sorption of CO2 was calculated based on the absorbance of the spectral band of CO2
in the 2340-2325 cm-1 region and the swelling of the asphaltene film was calculated

Chapter 5: Sorption of CO2 by ATR-FTIR Spectroscopy
- 163 -
based on the absorbance of asymmetric C-H stretching band of methylene groups at
2920 cm-1.
5.3 Results and discussion
5.3.1 Calibrating the angle of incidence of an ATR diamond accessory
The effective path length of ATR measurement depends on the angle of incidence of
the incoming IR beam and this angle depends on the alignment of the ATR accessory
on the spectrometer bench. Hence, for quantitative measurements, it is important to
calibrate the system to calculate the average angle of incidence of the incoming IR
beam. The transmission and ATR-FTIR spectra of PEG 600 are shown in Figure 5-3.
The distortions of the largest two spectral bands in the transmission spectrum are due
to saturation of the MCT detector. The band at 2870 cm-1 is assigned to the C-H
stretching mode and the band at 1100 cm-1 is assigned to the C-O-C bending mode of
PEG. The absorbance values for the rest of the bands are below 1.0 and thus are
unaffected by the saturation of the detector. The band at 1350 cm-1 is used to calibrate
the angle of the incidence of the ATR diamond accessory. As stated by the Beer-
Lambert law shown in Equation 2-5, the absorbance is directly proportional to the
thickness of the sample, the molar absorptivity and concentration of the species. The
molar absorptivity and the concentration of PEG 600 are constant, thus absorbance is
just a function of effective path length of the sample measured. A linear calibration
curve can be created using an FTIR spectroscopic measurement of the polymer in
transmission mode with a known path length. From the absorbance value of the
polymer in measured in ATR mode, the effective path length can then be calculated.
Using the effective path length at a specific wave length described in Equation 2-9,
the angle of the incidence of the incoming IR beam can be calculated if the refractive
index of the sample is known. In this experiment, the refractive index of pure PEG
600 is given as 1.467, 247 thus using the absorbance of the band at 1350
cm-1 from the ATR spectrum, the average angle of incidence can be calculated and
this value is shown in Table 5-1.

Chapter 5: Sorption of CO2 by ATR-FTIR Spectroscopy
- 164 -
Figure 5-3. Transmission and ATR-FTIR spectra of PEG 600.
Table 5-1. Calculation of the angle of incidence of the diamond ATR accessory. Transmission ATR Absorbance / a.u. 0.9904 0.0835 Path length / μm 25 2.1108 Refractive index of PEG 600 1.467 1.467 Refractive index of ATR crystal - 2.42 Wavenumber / cm-1 1350 1350 Depth of penetration / μm - 1.10 Angle of incidence / ° - 48.0
5.3.2 Measurement of the refractive index of asphaltene film
In order to calculate the refractive index of asphaltenes, the absorbance of the material
with a known thickness is needed. Asphaltenes cannot be easily prepared in a
transmission cell with a known path length, like the Omni-cell used previously, as
chloroform is needed to dissolve the material. Hence, an asphaltene film is cast on a
quartz window instead. A quartz window is chosen for its hardness (7.0 on the Mohs
scale). The edge of the film may not have uniform thickness and may in fact be
thicker than the centre of the film due to the nature of film formation. Hence, part of
the film was removed using a sharp-tipped spatula. A flat area was selected visually
under the microscope so that an AFM measurement could be performed near the
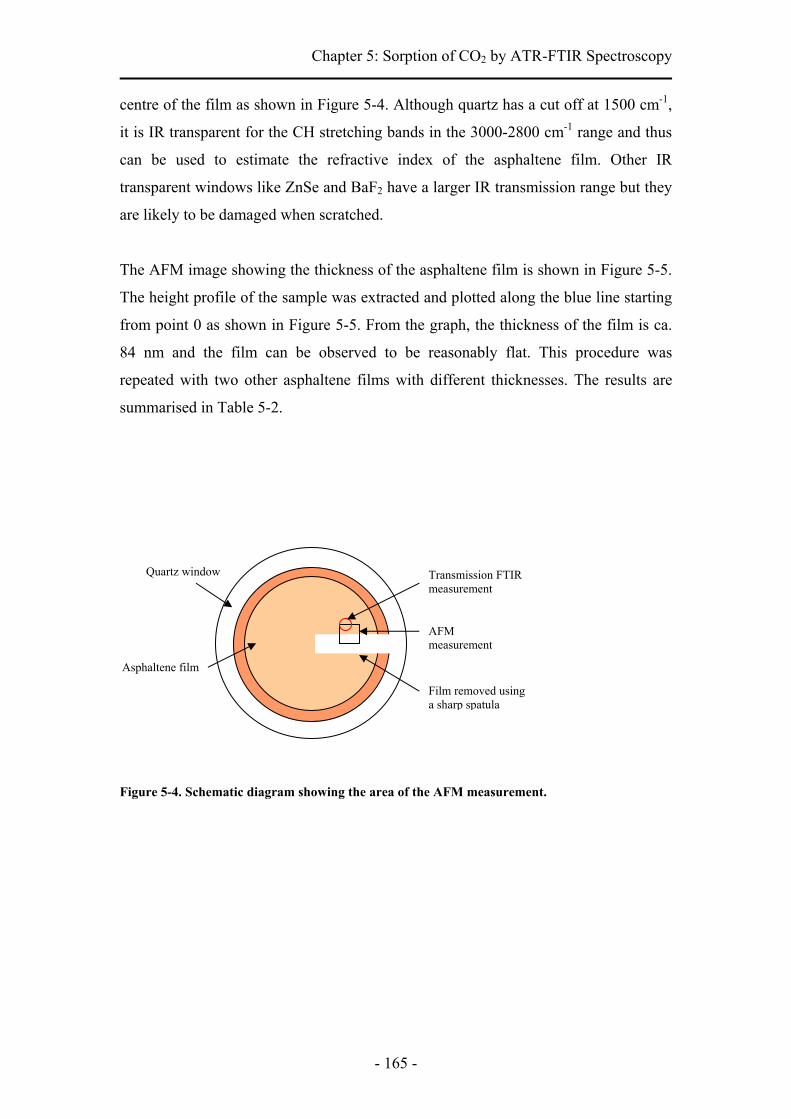
Chapter 5: Sorption of CO2 by ATR-FTIR Spectroscopy
- 165 -
centre of the film as shown in Figure 5-4. Although quartz has a cut off at 1500 cm-1,
it is IR transparent for the CH stretching bands in the 3000-2800 cm-1 range and thus
can be used to estimate the refractive index of the asphaltene film. Other IR
transparent windows like ZnSe and BaF2 have a larger IR transmission range but they
are likely to be damaged when scratched.
The AFM image showing the thickness of the asphaltene film is shown in Figure 5-5.
The height profile of the sample was extracted and plotted along the blue line starting
from point 0 as shown in Figure 5-5. From the graph, the thickness of the film is ca.
84 nm and the film can be observed to be reasonably flat. This procedure was
repeated with two other asphaltene films with different thicknesses. The results are
summarised in Table 5-2.
Figure 5-4. Schematic diagram showing the area of the AFM measurement.
Film removed using a sharp spatula
Quartz window
Asphaltene film
AFM measurement
Transmission FTIR measurement

Chapter 5: Sorption of CO2 by ATR-FTIR Spectroscopy
- 166 -
Figure 5-5. AFM image and extracted height profile showing the thickness the asphaltene film. The FTIR spectroscopic measurement in transmission was carried out using the MCT
detector on the microscope so that a smaller area of the sample was measured. The
MCT detector gives a better SNR compared to the DTGS detector so a smaller
aperture can be used for a reasonable acquisition time and the IR microscope allows a
selected area of the sample to be measured. An aperture of diameter 170 μm was used
and a flat area near the location of the AFM measurement was selected for the
transmission IR measurement. Three different areas of each of the three films with
different thicknesses were measured and the FTIR spectra averaged. The height
absorbance of the νasy(CH) band of the methylene functional group at 2920 cm-1 was
used for the calibration. Using the thickness of the film from the AFM measurements,
the effective path length against the IR absorbance of the νasy(CH) band can be plotted
and this is shown in Figure 5-6. This plot is extrapolated to the absorbance measured
in the ATR approach so that the effective path length of the ATR measurement can be
known. The refractive index of the asphaltene film can then be calculated using the
60
80
100
120
140
160
180
0 0.5 1 1.5 2 2.5 3 3.5 4 4.5 5
Plane / μm
Hei
ght /
nm dy = 84 nm
dx = 2.15 μm
film
0
low
high

Chapter 5: Sorption of CO2 by ATR-FTIR Spectroscopy
- 167 -
effective path length equation described in Equation 2-9. These values are
summarised and presented in Table 5-2.
The refractive index of the asphaltene film calculated by this technique is ca. 1.7 and
this value of the refractive index of asphaltenes is in the range of 1.7 to 2.9 as
estimated in the literature.216, 217 This method proposed is a relatively simple method
to estimate the refractive index of a material as long as the effective path length of
light can be determined in ATR-FTIR spectroscopy. This can be a quicker and more
accurate method to estimate the refractive index of opaque materials like asphaltenes.
Traditional methods used have large margins of error as not only an extrapolation is
needed, assumptions such as no volume change on mixing during the titration are also
needed. Thus this margin of error can be about ca. ± 25 % of the calculated value.217
The FTIR spectroscopic approach in transmission mode allows the calibration curve
to be built and the intrinsic optical properties of the ATR mode allow the refractive
index of the material to be calculated.
Figure 5-6. Plot of effective path length against IR absorbance height at 2920 cm-1 for the asphaltene film.
0.000
0.300
0.600
0.900
1.200
1.500
1.800
2.100
2.400
0 0.02 0.04 0.06 0.08 0.1 0.12 0.14 0.16 0.18 0.2 0.22 0.24 0.26 0.28 0.3
Absorbance / a.u.
Path
leng
th / μm
Transmission measurement
ATR measurement
Calibration line

Chapter 5: Sorption of CO2 by ATR-FTIR Spectroscopy
- 168 -
Table 5-2. Calculation of the refractive index of asphaltene film. Transmission ATR Absorbance / a.u. 0.0110 0.0670 0.1410 0.2650 Path length / μm 6.2 x 10⁻² 5.9 x 10⁻¹ 1.2 2.402 Depth of penetration / μm - - - 0.914 Angle of incidence / ° - - - 48.0 Wavenumber / cm-1 2920 2920 2920 2920 Refractive index of ATR crystal - - - 2.42 Calculated refractive index of film - - - 1.70
5.3.3 Sorption of CO2 using ATR-FTIR spectroscopy
After the angle of incidence of the incoming IR radiation and the refractive index of
the asphaltene film are both known, the quantification of CO2 sorption can then be
carried out. Figure 5-7 showed the full ATR-FTIR spectrum of the asphaltene film
after exposure to CO2 at 1 bar, 25 bar, 50 bar and 75 bar. The arrows denoted the
decrease or increase of the absorbance bands with increasing pressure of CO2.
The absorbance of the spectral band at 2920 cm-1 was used to monitor the swelling of
the asphaltene film after exposure to CO2 at different pressure. With increasing
pressure, the film swells which resulted in a decrease in absorbance of this spectral
band of the sample. Flichy and co-workers158 have shown that the change in refractive
index of the material because of CO2 sorption and swelling is small in a similar
experimental setup. Hence, it is assumed in this work that the refractive index of the
material does not change with swelling, resulting in the sampling volume of the
measurement remaining the same during the process. With the increased in volume
due to swelling, the density of the film decreased, thus the absorbance of the film,
which was denoted by the band at 2920 cm-1, decreased (Figure 5-8). Swelling can be
described by Equation 5-2.158 I0 and I are the absorbance of the bands before and
during exposure to CO2. de0 and de are the effective path lengths of light before and
during exposure to CO2. It was assumed that there was no change in refractive index
on swelling thus Equation 5-2 can be simplified to Equation 5-4. The degree of
swelling of the asphaltene film caused by CO2 sorption at different pressures of
asphaltene film was plotted and shown in Figure 5-9. The result shows that the
asphaltene film swells linearly to about 116 % of its initial volume at 75 bar of CO2 at
35 °C. Carbognani and Rogel239 have studied the swelling of crude oil asphaltenes
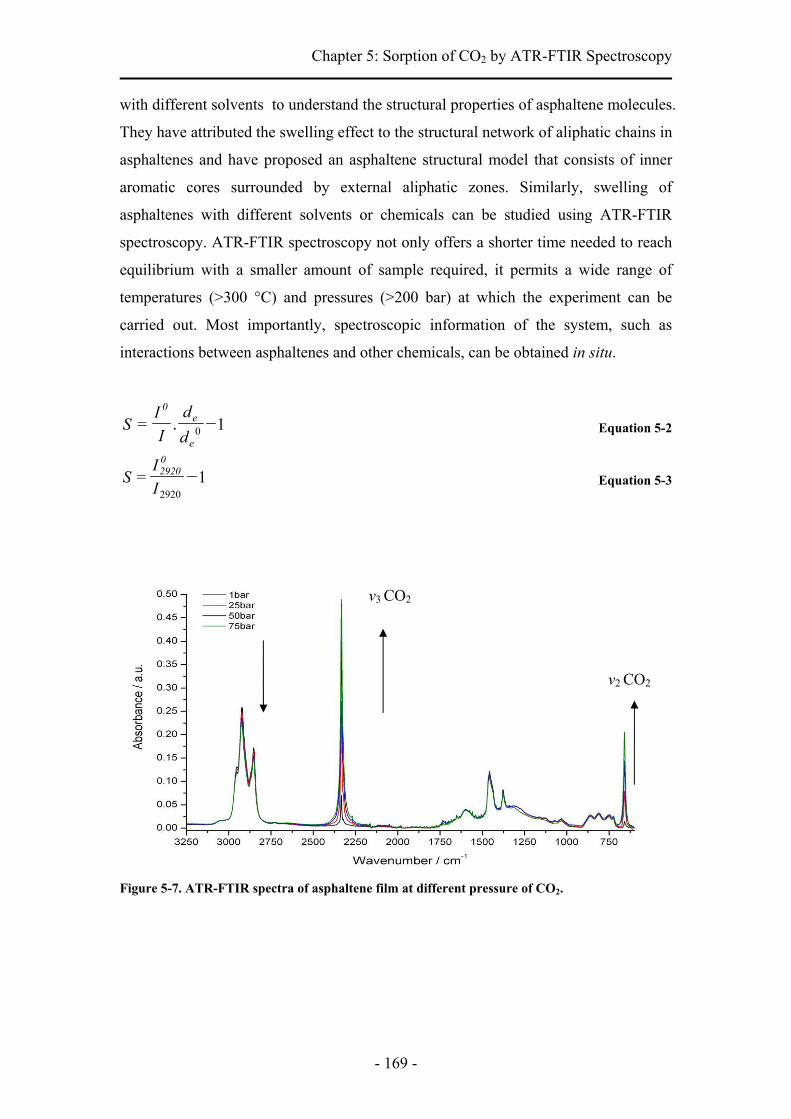
Chapter 5: Sorption of CO2 by ATR-FTIR Spectroscopy
- 169 -
with different solvents to understand the structural properties of asphaltene molecules.
They have attributed the swelling effect to the structural network of aliphatic chains in
asphaltenes and have proposed an asphaltene structural model that consists of inner
aromatic cores surrounded by external aliphatic zones. Similarly, swelling of
asphaltenes with different solvents or chemicals can be studied using ATR-FTIR
spectroscopy. ATR-FTIR spectroscopy not only offers a shorter time needed to reach
equilibrium with a smaller amount of sample required, it permits a wide range of
temperatures (>300 °C) and pressures (>200 bar) at which the experiment can be
carried out. Most importantly, spectroscopic information of the system, such as
interactions between asphaltenes and other chemicals, can be obtained in situ.
1= 0e
e0
dd
II
S . Equation 5-2
1=2920I
IS
02920
Equation 5-3
Figure 5-7. ATR-FTIR spectra of asphaltene film at different pressure of CO2.
ν3 CO2
ν2 CO2

Chapter 5: Sorption of CO2 by ATR-FTIR Spectroscopy
- 170 -
Figure 5-8. ATR-FTIR spectra of asphaltene film in the 3100-2650 cm-1 range showing the swelling effect after exposure to CO2.
Figure 5-9. Percentage of swelling of asphaltene film as a function of CO2 pressure at 35 °C.
The sorption of CO2 in the asphaltene film, taking the swelling effect into account,
can be quantified according to the equation as shown in Equation 5-4.158 The
concentration, 3-cm gCOc2
, of CO2 was calculated based on the height absorbance of
the CO2 band at 2335 cm-1 as shown in Figure 5-10. From the literature248, the density
0
2
4
6
8
10
12
14
16
18
0 5 10 15 20 25 30 35 40 45 50 55 60 65 70 75 80
Pressure / bar
% S
wel
ling
CO2 adsorption

Chapter 5: Sorption of CO2 by ATR-FTIR Spectroscopy
- 171 -
of the asphaltenes, ρasp, was found to be in the range of 1.15-1.25 g.cm-3, thus the
median value of 1.2 g.cm-3 was used in the analysis in this work. Error bars are shown
in Figure 5-11 to illustrate the sensitivity of the value of the density of the material
used on the amount of adsorbed CO2. The result showed that with increasing pressure,
the amount of CO2 adsorbed increased. The rate of increase is higher at lower
pressure and seemingly approaches a plateau at higher pressure. This is because there
are more readily available spaces (like “free volume”) in the beginning for the CO2
sorption in the material. Eventually, most of the spaces will be occupied, thus not
much additional CO2 will be readily sorbed even at higher pressure.
))(
(+1
+=
2
2
Sρ
c
cCO mass %
aspcm gCO
cm gCO2
3-
3-
Equation 5-4
Figure 5-10. ATR-FTIR spectra showing the evolution of CO2 bands with increasing pressure.
ν3 CO2
ν2 CO2

Chapter 5: Sorption of CO2 by ATR-FTIR Spectroscopy
- 172 -
Figure 5-11. Sorption of CO2 in asphaltene film in mmol.g-1 and % mass of CO2 at 35 °C.
Figure 5-12. Sorption of CO2 obtained from the ATR-FTIR method at 35 °C compared with literature data240 at different density of CO2.
One other work on the sorption of CO2 onto asphaltenes was found in the literature.
Dmitrievskii and co-workers240 use a volumetric method to measure the sorption
isoterms of CO2 on asphaltenes at 70 °C. As that experiment was carried out at a
0.00
0.50
1.00
1.50
2.00
2.50
3.00
1 25 50 75
Pressure / bar
CO
2 ads
orbe
d / m
mol
.g-1
0.0
1.0
2.0
3.0
4.0
5.0
6.0
7.0
8.0
% m
ass
CO 2
mmol/g%mass CO2
0.00
0.50
1.00
1.50
2.00
2.50
3.00
0 50 100 150 200 250 300
Density of CO2 / kg.m -3
CO
2 ads
orbe
d / m
mol
.g-1
Reference
Data
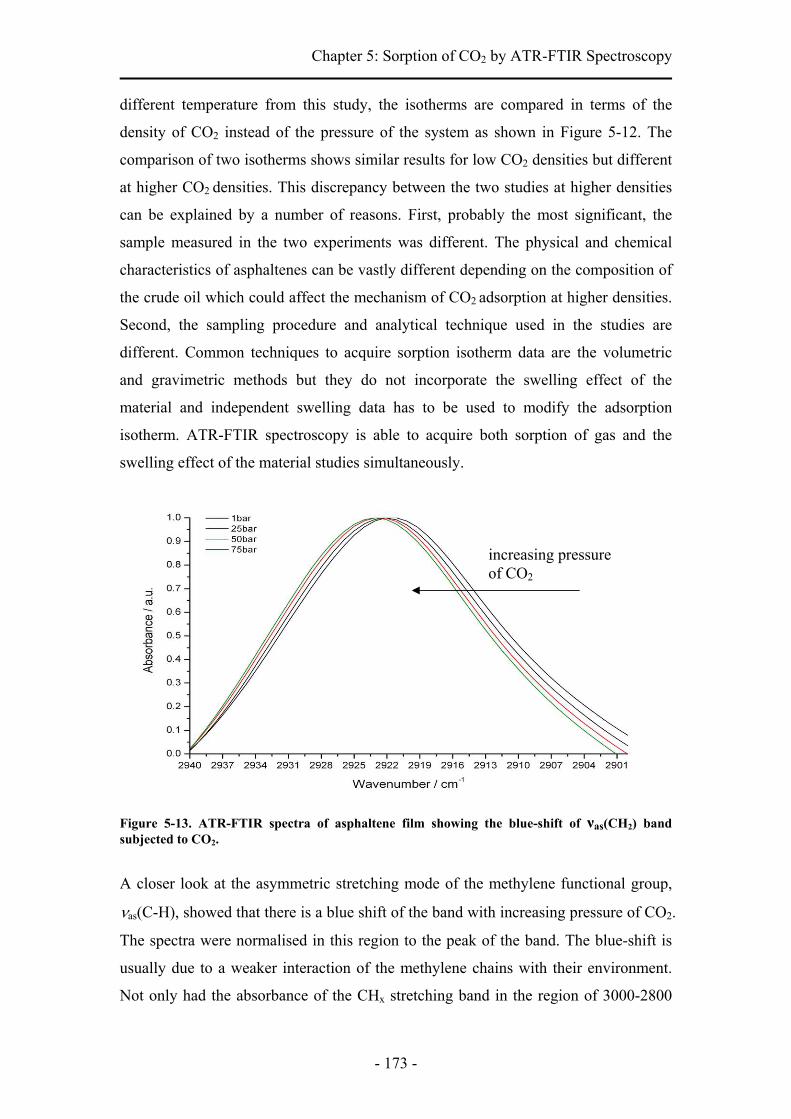
Chapter 5: Sorption of CO2 by ATR-FTIR Spectroscopy
- 173 -
different temperature from this study, the isotherms are compared in terms of the
density of CO2 instead of the pressure of the system as shown in Figure 5-12. The
comparison of two isotherms shows similar results for low CO2 densities but different
at higher CO2 densities. This discrepancy between the two studies at higher densities
can be explained by a number of reasons. First, probably the most significant, the
sample measured in the two experiments was different. The physical and chemical
characteristics of asphaltenes can be vastly different depending on the composition of
the crude oil which could affect the mechanism of CO2 adsorption at higher densities.
Second, the sampling procedure and analytical technique used in the studies are
different. Common techniques to acquire sorption isotherm data are the volumetric
and gravimetric methods but they do not incorporate the swelling effect of the
material and independent swelling data has to be used to modify the adsorption
isotherm. ATR-FTIR spectroscopy is able to acquire both sorption of gas and the
swelling effect of the material studies simultaneously.
Figure 5-13. ATR-FTIR spectra of asphaltene film showing the blue-shift of νas(CH2) band subjected to CO2.
A closer look at the asymmetric stretching mode of the methylene functional group,
νas(C-H), showed that there is a blue shift of the band with increasing pressure of CO2.
The spectra were normalised in this region to the peak of the band. The blue-shift is
usually due to a weaker interaction of the methylene chains with their environment.
Not only had the absorbance of the CHx stretching band in the region of 3000-2800
increasing pressure of CO2
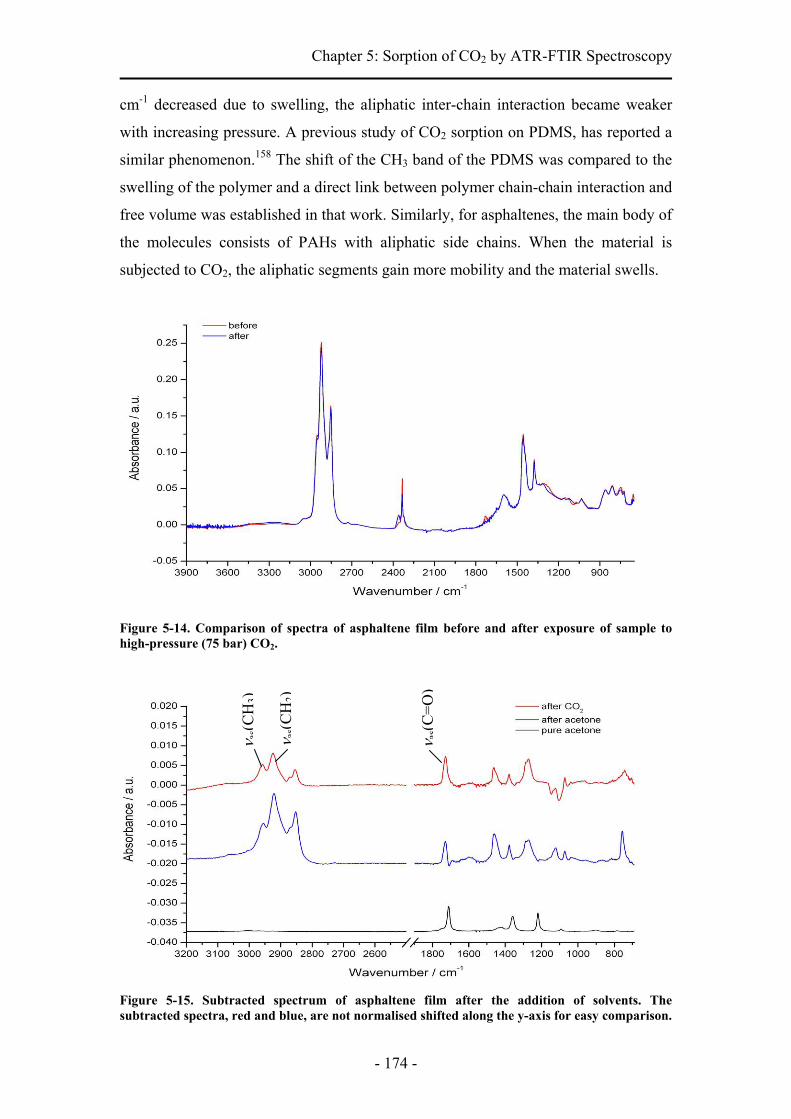
Chapter 5: Sorption of CO2 by ATR-FTIR Spectroscopy
- 174 -
cm-1 decreased due to swelling, the aliphatic inter-chain interaction became weaker
with increasing pressure. A previous study of CO2 sorption on PDMS, has reported a
similar phenomenon.158 The shift of the CH3 band of the PDMS was compared to the
swelling of the polymer and a direct link between polymer chain-chain interaction and
free volume was established in that work. Similarly, for asphaltenes, the main body of
the molecules consists of PAHs with aliphatic side chains. When the material is
subjected to CO2, the aliphatic segments gain more mobility and the material swells.
Figure 5-14. Comparison of spectra of asphaltene film before and after exposure of sample to high-pressure (75 bar) CO2.
Figure 5-15. Subtracted spectrum of asphaltene film after the addition of solvents. The subtracted spectra, red and blue, are not normalised shifted along the y-axis for easy comparison.
ν as(C
H3)
ν as(C
H2)
ν as(C
=O)
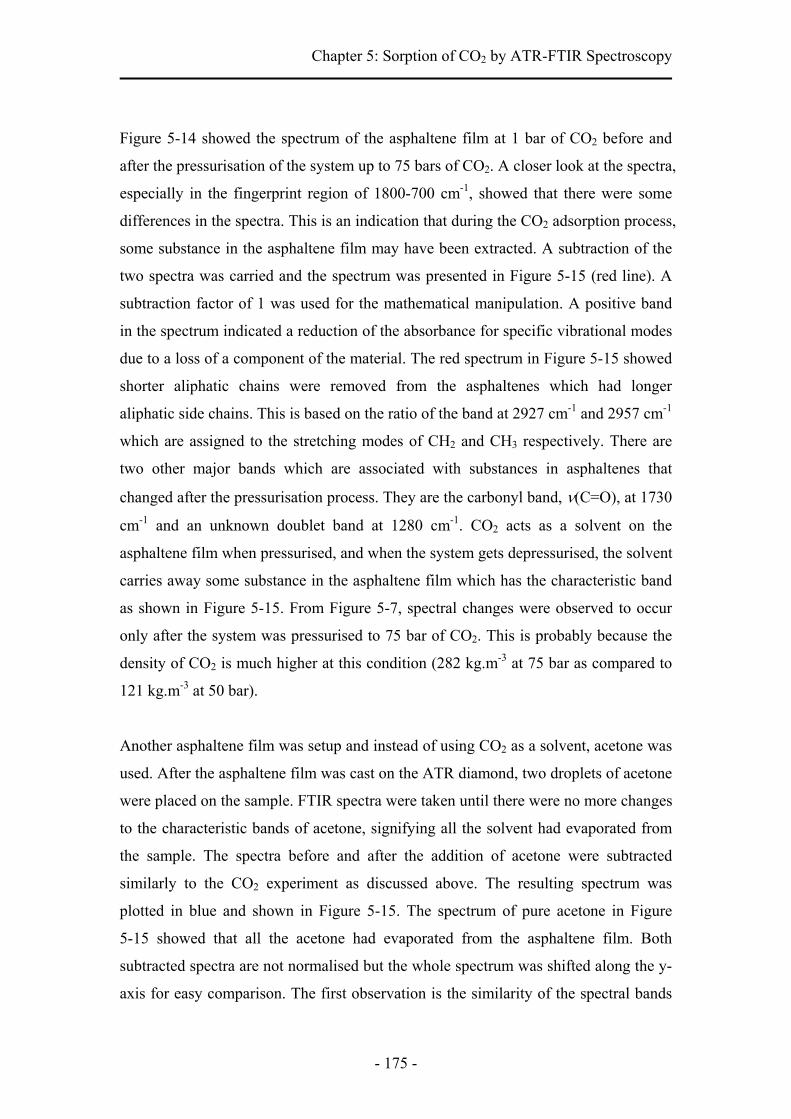
Chapter 5: Sorption of CO2 by ATR-FTIR Spectroscopy
- 175 -
Figure 5-14 showed the spectrum of the asphaltene film at 1 bar of CO2 before and
after the pressurisation of the system up to 75 bars of CO2. A closer look at the spectra,
especially in the fingerprint region of 1800-700 cm-1, showed that there were some
differences in the spectra. This is an indication that during the CO2 adsorption process,
some substance in the asphaltene film may have been extracted. A subtraction of the
two spectra was carried and the spectrum was presented in Figure 5-15 (red line). A
subtraction factor of 1 was used for the mathematical manipulation. A positive band
in the spectrum indicated a reduction of the absorbance for specific vibrational modes
due to a loss of a component of the material. The red spectrum in Figure 5-15 showed
shorter aliphatic chains were removed from the asphaltenes which had longer
aliphatic side chains. This is based on the ratio of the band at 2927 cm-1 and 2957 cm-1
which are assigned to the stretching modes of CH2 and CH3 respectively. There are
two other major bands which are associated with substances in asphaltenes that
changed after the pressurisation process. They are the carbonyl band, ν(C=O), at 1730
cm-1 and an unknown doublet band at 1280 cm-1. CO2 acts as a solvent on the
asphaltene film when pressurised, and when the system gets depressurised, the solvent
carries away some substance in the asphaltene film which has the characteristic band
as shown in Figure 5-15. From Figure 5-7, spectral changes were observed to occur
only after the system was pressurised to 75 bar of CO2. This is probably because the
density of CO2 is much higher at this condition (282 kg.m-3 at 75 bar as compared to
121 kg.m-3 at 50 bar).
Another asphaltene film was setup and instead of using CO2 as a solvent, acetone was
used. After the asphaltene film was cast on the ATR diamond, two droplets of acetone
were placed on the sample. FTIR spectra were taken until there were no more changes
to the characteristic bands of acetone, signifying all the solvent had evaporated from
the sample. The spectra before and after the addition of acetone were subtracted
similarly to the CO2 experiment as discussed above. The resulting spectrum was
plotted in blue and shown in Figure 5-15. The spectrum of pure acetone in Figure
5-15 showed that all the acetone had evaporated from the asphaltene film. Both
subtracted spectra are not normalised but the whole spectrum was shifted along the y-
axis for easy comparison. The first observation is the similarity of the spectral bands

Chapter 5: Sorption of CO2 by ATR-FTIR Spectroscopy
- 176 -
of the substance that were extracted by CO2 and acetone. The CH2 and CH3 stretching
bands in the 3000-2800 cm-1, the CH2 and CH3 bending modes at 1460 cm-1 and 1377
cm-1, the carbonyl band at 1730 cm-1 and even the unknown band at 1280 cm-1 are
found on both subtracted spectra. Both solvents affected the absorbance of the
carbonyl functional group in asphaltenes and are able to extract molecules with this
chemical group from the bulk material. In the aromatic out-of-place C-H deformation
region, 900-700 cm-1, there were no bands found at 865 cm-1 and 815 cm-1 which are
assigned to the aromatic C-H deformation of an isolated hydrogen atom and two
adjacent hydrogens respectively. Only the band at 750 cm-1, which is assigned to
aromatic C-H deformation of four adjacent hydrogens, was observed. This suggests
that only small PAHs molecules were extracted. Thus the fraction of asphaltene
extracted by both CO2 under pressure and acetone has aliphatic side chains, carbonyl
groups and consist of smaller aromatic molecules compared to an average asphaltene
molecule. Trapping of molecules by asphaltenes has been known72, 249, 250 and this
phenomenon has been considered in the modelling of the structure of asphaltenes.39
This result shows that ATR-FTIR spectroscopy is able to monitor the removal of
trapped molecules from asphaltenes and thus may provide insight into origins of
trapped substances. This extracted material has a band at 2920 cm-1 which overlaps
with the band that was used in the calculation of the amount of swelling of the
asphaltene film. However, this extraction was only observed at high-pressure of CO2
(75 bars) as it was evidenced by other spectral bands and the amount of material
extracted was rather small, thus it was assumed that spectral overlap between those
bands did not affect the calculated value of swelling.
5.4 Conclusion
Relatively simple and reliable approaches of using FTIR spectroscopy in transmission
and in ATR modes have been used to calculate the refractive index of asphaltene film.
The calculated refractive index of asphaltenes has a value of 1.7 and is in the range of
values reported in literature. The refractive index of the film is used in quantitative
analysis of the sorption of CO2 in asphaltene films using ATR-FTIR spectroscopy.
This spectroscopic approach using the diamond ATR accessory allows quantification
of the sorption of gas and swelling of the material while providing information about
the interactions between the film and CO2. The in situ measurements also show that

Chapter 5: Sorption of CO2 by ATR-FTIR Spectroscopy
- 177 -
some substance was extracted from the asphaltene film only at high pressure CO2
when its density is high. Gas sorption, swelling of asphaltenes and trapping of
molecules in asphaltenes are phenomena which are important in describing the
structure of asphaltenes. ATR-FTIR spectroscopy with its chemical specificity has
been shown to be able to provide additional information regarding these phenomena.
- 178 -
CHAPTER SIX
INVESTIGATING THE CARBON
STRUCTURES OF CARBONACEOUS
MATERIALS COMBINING RAMAN
AND FTIR SPECTROSCOPY

Chapter 6: Investigating the carbon structures of carbonaceous materials combining Raman and FTIR spectroscopy
- 179 -
6 Investigating the carbon structures of carbonaceous
materials combining Raman and FTIR spectroscopy
6.1 Introduction
Deposit foulants and asphaltenes are typically complex mixtures with high contents of
PAHs. In this chapter, Raman microspectroscopy and FTIR spectroscopy are applied
to study the carbon structures of deposited foulants and asphaltenes. In the first
section, the effects of different Raman excitation wavelengths are explored in order to
select the most suitable excitation wavelength for Raman microspectroscopic
measurements of asphaltenic-type carbonaceous materials. In the second section, the
Raman spectra of different carbonaceous materials were compared. As the
applications of Raman microspectroscopy to asphaltenes and deposited foulants are
limited, structural parameters derived from the Raman spectra of asphaltenes and
deposits were compared with different order classes of other important carbonaceous
materials like pitch asphaltenes and coal chars heat-treated at different high-
temperatures. Coal tar pitch has a wide range of applications in electrodes, carbon
brushes, etc. Coal chars are widely studied as their combustion and gasification
reactivities in the blast furnace are closely related to its carbon structures. In the last
section of the Raman spectroscopic analysis, a classification method is applied to
rapidly differentiate the carbon structures in asphaltenes and deposits. The aim of this
work is to be able to link the carbon structures of the deposits to different time-
temperature histories, which could be extended to study the ageing effects of deposits
in heat exchangers.
For the ATR-FTIR spectroscopic study presented in this chapter, the emphasis is on
the 900-700 cm-1 spectral region where information regarding the out-of-plane
deformation of the aromatic C-H groups of the sample can be obtained. This gives
information regarding the size and shape of the PAHs in the carbonaceous materials.

Chapter 6: Investigating the carbon structures of carbonaceous materials combining Raman and FTIR spectroscopy
- 180 -
6.2 Experimental
6.2.1 Samples
The petroleum asphaltenes were from four different geographical regions from which
samples were known to foul when processed. The petroleum asphaltenes were
extracted following the ASTM standard procedure (D3279).46 They have been labeled
ASP-M, ASP-K, ASP-P and ASP-O respectively. The deposits, labeled as RFD, were
obtained from a pre-heat train of a distillation column in a refinery with inlet and
outlet temperatures at around 158 °C and 166 °C respectively. The coal tar pitch
asphaltenes were separated by solvent solubility from a pitch from the high-
temperature coking of coal. The details of the preparation technique have been
described before.251 The coal char samples were derived from a typical injectant coal
in a blast furnace. The samples were heated with a nitrogen purge at 30 °C per minute
and held at 900 °C, 1300 °C and 1500 °C, respectively, for 5 min. They are labeled as
C-900, C-1300 and C-1500.
6.2.2 Raman spectroscopy of carbonaceous materials
Two Raman systems were employed for studying the effect of the excitation
wavelength. For the 1064 nm excitation wavelength experiment, the FT-Raman
system was used. The spectrum was measured using the Equinox 55 spectrometer
from Bruker coupled with an FRA 106 Raman module equipped with a Ge detector
and a 1064 nm Nd:YAG laser. The spectral resolution used was 4 cm-1 and 500 scans
were carried out for each measurement. The laser power was set at 50 mW and the
laser spot size on the sample was ca. 100 μm. The sample was crushed and
compressed in an aluminium sample holder. The sample holder was then placed in the
sample compartment of the system.
For the 541.5 nm and 785 nm excitation wavelength measurements, the dispersive
Raman confocal microscope (Renishaw, plc) was used. The 514.5 nm argon ion laser
has a maximum output power of 20 mW and a laser spot size of ca. 1 μm. The 785 nm
diode laser has a maximum output power of 300 mW and it is a line laser with size ca.
2 μm by 20 μm. The lasers were focused onto the sample using a 50× objective at
ambient conditions and the spectra were measured with a collection time of 60s and
Chapter 6: Investigating the carbon structures of carbonaceous materials combining Raman and FTIR spectroscopy
- 181 -
10 co-additions at 10 % of the laser power from 1800 cm-1 to 1000 cm-1. The samples
were prepared as described in Section 3.2.2; a visually acceptable flat area was
selected for the Raman spectroscopic measurements. The lowest laser power was
selected to avoid photochemical damages to the sample. This was checked by looking
for visual and spectroscopic changes over the period of laser irradiation.
6.2.3 ATR-FTIR spectroscopy of carbonaceous materials
The IR analysis was performed using an Equinox 55 FTIR spectrometer (Bruker
Optics, Germany). The diamond ATR Golden Gate™ accessory (Specac Ltd.) which
utilises an ATR diamond crystal was used for the measurements. The condenser lens
in the ATR accessory was modified with a lab-made aperture to give an average angle
of incidence of the IR beam of about 56 °. The single-element MCT detector was used
for these measurements. The spectra were obtained with 256 scans and a spectral
resolution of 4 cm-1 in the spectral range of 3950-700 cm-1. The sample was prepared
as described in Section 3.2.1
6.3 Results and discussion
6.3.1 Comparing different Raman excitation wavelength
The Raman spectra of asphaltenes measured with different laser excitation
wavelengths are assessed. The G band at about 1600 cm-1 is assigned to the E2g C-C
stretching mode of a graphite crystal. The D band can be assigned to the breathing
mode of A1g symmetry involving phonons between the K and M zone boundaries
(Section 2.7.4). Both the Raman response of the D band198 and the amount of
fluorescence from the sample252, are sensitive to the excitation wavelength of the laser.
Hence for reliable analysis of the Raman spectra, it is important to select the most
suitable excitation wavelength where post-experimental spectral processing can be
minimised. Figure 6-1 shows Raman spectra of ASP-K using the 514.5 nm and 785
nm from the dispersive Raman system and the 1064 nm from the FT-Raman system.
The spectra have been expanded and shifted in the y direction for easy comparison,
thus the intensity in the figure does not reflect the actual measured intensity of each
spectrum. It can be observed that all three excitation wavelengths used exhibit a

Chapter 6: Investigating the carbon structures of carbonaceous materials combining Raman and FTIR spectroscopy
- 182 -
fluorescence background from the sample. It can be observed that the G and D bands
are the most defined when using a Raman laser with excitation at a wavelength of
514.5 nm. Quirico and co-workers252 have compared the application of 632.8 nm,
514.5 nm and 457.9 nm excitation lasers to coal samples and similarly, they found the
lowest fluorescence background with the 514.5 nm excitation laser. FT-Raman
spectroscopy has been applied to samples to avoid fluorescence (Section 2.7.3) and
has been used to characterise different types of carbonaceous materials201, 202, 253, 254.
However, it was not suitable for the measurement of the asphaltenic materials as the
fluorescence signal was large, thus hiding the signal from the D and the G bands of
the carbon structures. This may be related to the sampling volume of the two systems.
In the dispersive Raman system equipped with the 785 nm and 541.5 nm excitation
lasers, a microscope objective is used thus measuring a very small volume of the
sample. In the FT-Raman system, the laser spot focused on the sample has a diameter
of ca. 100 μm. Raman signal from a greater volume of sample, including fluorescence
that may result from different components in this sampling volume, contributes to the
measured spectrum. Consequently, the 514.5 nm excitation laser is selected for the
Raman spectroscopic measurements for the remaining study. As the fluorescence
signal is still present using the 514 nm excitation, a linear baseline correction needs to
be performed on the spectrum between 1800 and 1000 cm-1 as shown in Figure 6-1
Figure 6-1. The effect of excitation wavelength (1064 nm, 785 nm and 514.5 nm) on the Raman spectrum of ASP-K.
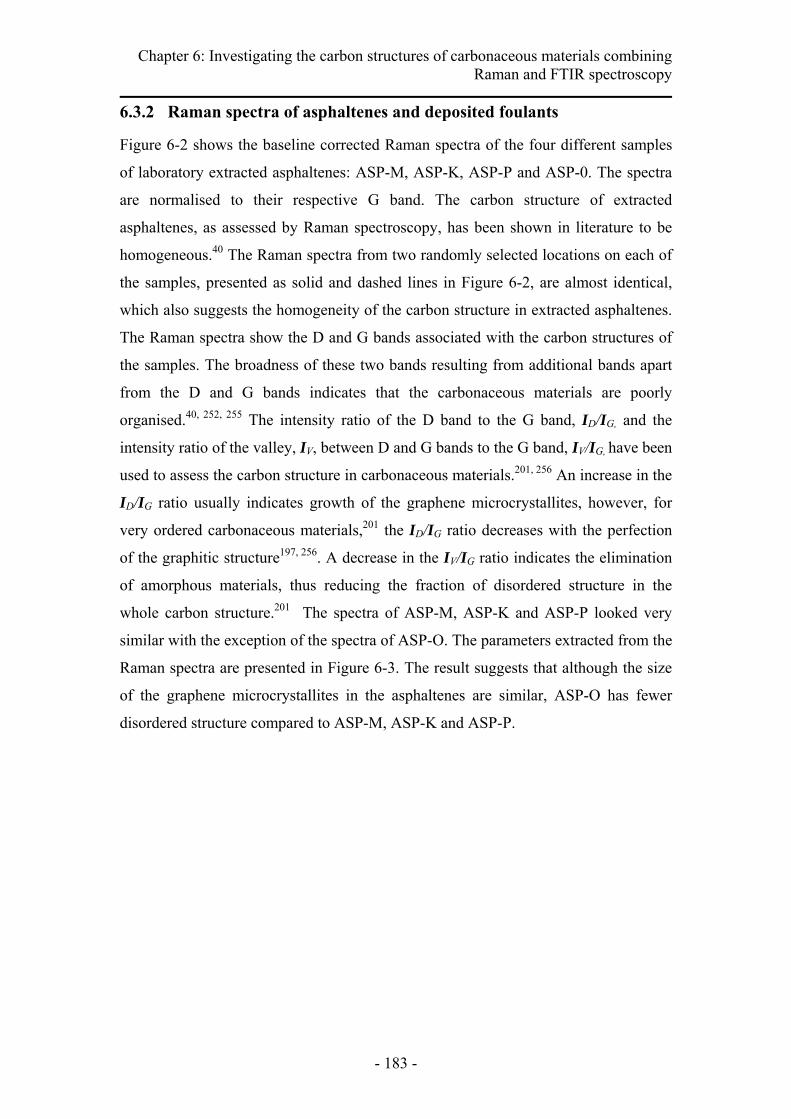
Chapter 6: Investigating the carbon structures of carbonaceous materials combining Raman and FTIR spectroscopy
- 183 -
6.3.2 Raman spectra of asphaltenes and deposited foulants
Figure 6-2 shows the baseline corrected Raman spectra of the four different samples
of laboratory extracted asphaltenes: ASP-M, ASP-K, ASP-P and ASP-0. The spectra
are normalised to their respective G band. The carbon structure of extracted
asphaltenes, as assessed by Raman spectroscopy, has been shown in literature to be
homogeneous.40 The Raman spectra from two randomly selected locations on each of
the samples, presented as solid and dashed lines in Figure 6-2, are almost identical,
which also suggests the homogeneity of the carbon structure in extracted asphaltenes.
The Raman spectra show the D and G bands associated with the carbon structures of
the samples. The broadness of these two bands resulting from additional bands apart
from the D and G bands indicates that the carbonaceous materials are poorly
organised.40, 252, 255 The intensity ratio of the D band to the G band, ID/IG, and the
intensity ratio of the valley, IV, between D and G bands to the G band, IV/IG, have been
used to assess the carbon structure in carbonaceous materials.201, 256 An increase in the
ID/IG ratio usually indicates growth of the graphene microcrystallites, however, for
very ordered carbonaceous materials,201 the ID/IG ratio decreases with the perfection
of the graphitic structure197, 256. A decrease in the IV/IG ratio indicates the elimination
of amorphous materials, thus reducing the fraction of disordered structure in the
whole carbon structure.201 The spectra of ASP-M, ASP-K and ASP-P looked very
similar with the exception of the spectra of ASP-O. The parameters extracted from the
Raman spectra are presented in Figure 6-3. The result suggests that although the size
of the graphene microcrystallites in the asphaltenes are similar, ASP-O has fewer
disordered structure compared to ASP-M, ASP-K and ASP-P.
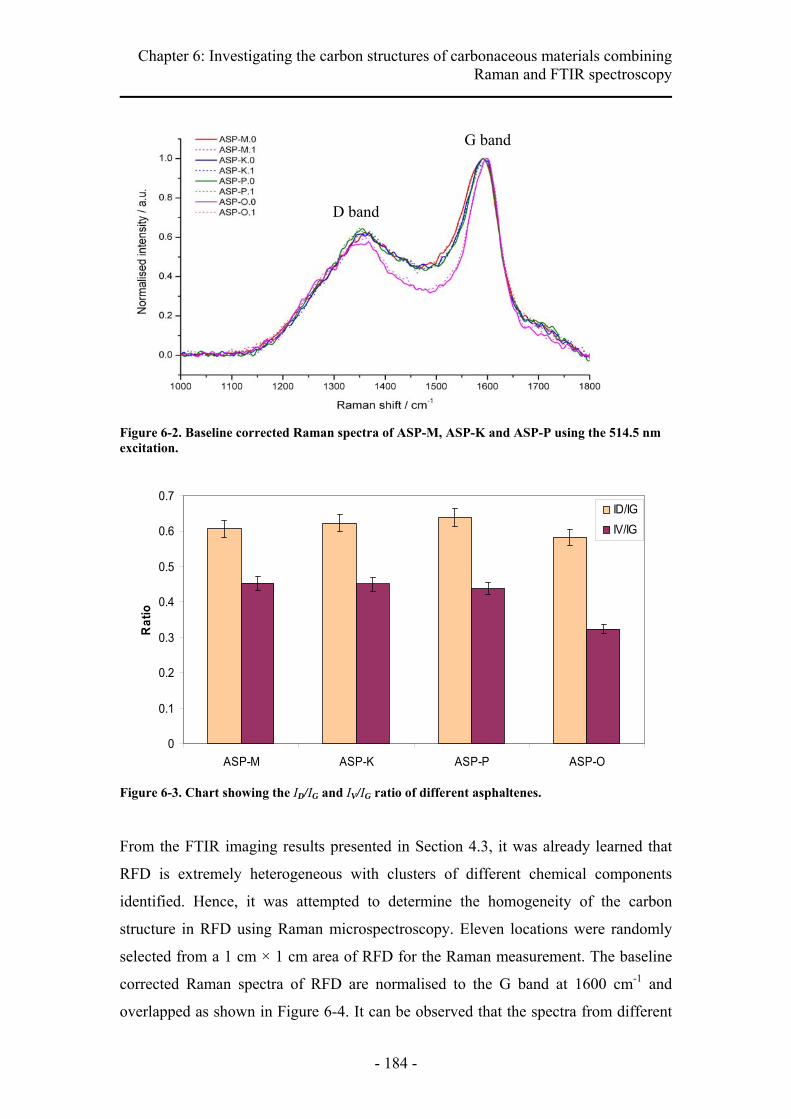
Chapter 6: Investigating the carbon structures of carbonaceous materials combining Raman and FTIR spectroscopy
- 184 -
Figure 6-2. Baseline corrected Raman spectra of ASP-M, ASP-K and ASP-P using the 514.5 nm excitation.
Figure 6-3. Chart showing the ID/IG and IV/IG ratio of different asphaltenes. From the FTIR imaging results presented in Section 4.3, it was already learned that
RFD is extremely heterogeneous with clusters of different chemical components
identified. Hence, it was attempted to determine the homogeneity of the carbon
structure in RFD using Raman microspectroscopy. Eleven locations were randomly
selected from a 1 cm × 1 cm area of RFD for the Raman measurement. The baseline
corrected Raman spectra of RFD are normalised to the G band at 1600 cm-1 and
overlapped as shown in Figure 6-4. It can be observed that the spectra from different
0
0.1
0.2
0.3
0.4
0.5
0.6
0.7
ASP-M ASP-K ASP-P ASP-O
Rat
io
ID/IGIV/IG
G band
D band

Chapter 6: Investigating the carbon structures of carbonaceous materials combining Raman and FTIR spectroscopy
- 185 -
locations of the sample, M1 to M11, are almost identical. This suggests that the
carbon structure across the sampled area of RFD is relatively homogeneous at the
scale of the experiment. The heterogeneities of other chemical components, such as
carbonates, oxalates, sulphates and sulfoxides detected by FTIR imaging are not
observed here. Due to the PAHs content of the sample, the D and the G bands are
much more intense than the bands expected from other functional groups. Some of
these bands may be hidden by the fluorescence signal, thus are not observed in the
Raman spectra of RFD. Nevertheless, the focus of this work is to assess the carbon
structures in RFD. The eleven spectra measured from the different locations on the
sample showed that the bands at 1350 cm-1 and 1600 cm-1 are from the D and G bands,
thus representing the carbon structure of RFD. The band at 1150 cm-1 is only
observed when the carbonaceous materials are spatially poorly organised.40
Figure 6-4. Raman spectra measured across the surface of RFD. M1 to M11 are randomly selected locations of a 1 cm × 1 cm sampled area of RFD.
Figure 6-5 shows Raman spectra of the different order class of carbonaceous materials.
The spectra were baseline corrected and normalised to their respective G band. The
ID/IG and IV/IG ratios derived from the Raman spectra of the different carbonaceous
materials are shown in Figure 6-6.

Chapter 6: Investigating the carbon structures of carbonaceous materials combining Raman and FTIR spectroscopy
- 186 -
The Raman spectra of P-ASP, C-900, C-1300 and C-1500 were also measured with
the 514.5 nm excitation laser. Firstly, the temperature treated injectant coal char
samples are compared. The higher ID/IG ratio indicates that the size of graphene
microcrystallites in the C-1500 are bigger then those in C-900. The lower IV/IG ratio
indicates that C-1500 has a less disordered carbon structure than in C-900. These
correspond to, as expected, the fact that the higher temperature favours the
graphitisation of the coal char. The results shows similar trends to injectant coal char
as reported in literature201 and confirm the assessment of the carbon structures in these
carbonaceous materials. Secondly, the petroleum asphaltenes, ASP-M, ASP-K, ASP-
P and ASP-O, are compared to the pitch asphaltenes, P-ASP. From Figure 6-6, P-ASP
is observed to have smaller graphene microcrystallites but a more ordered carbon
structure than petroleum asphaltenes. This is also in agreement with the literature
where asphaltenes derived from coal were suggested to have smaller average
molecular weights and smaller PAHs than petroleum derived asphaltenes.251, 257
Finally, for the carbon structures of RFD, it can be observed from the ID/IG and IV/IG
ratio that it is actually more similar to the carbon structure of P-ASP than to the
petroleum asphaltenes (ASP-M, ASP-K, ASP-P and ASP-O). The graphene
microcrystallites are the smallest among the carbonaceous materials measured but it
has one of the lowest proportions of amorphous materials which suggests it is one of
the least disordered structure compared to the rest. The more ordered carbon
structures compared to petroleum asphaltenes may be due to the ageing effect of the
deposit in the heat exchanger. An aged deposit tends to develop more polyaromatic
and graphitic structures.225
6.3.3 Classification of carbonaceous materials using Raman
microspectroscopy
The analysis of the ID/IG and IV/IG ratio derived from the Raman spectra has been
shown to be useful in understanding the structure of the carbonaceous materials.
Figure 6-7 shows the ID/IG vs IV/IG mapping of the different carbonaceous materials
analysed in this work. This allows the classification of different carbonaceous
materials. The carbon structure of the deposited foulants can be easily compared to
carbon structure of other better known (structurally) carbonaceous materials. The
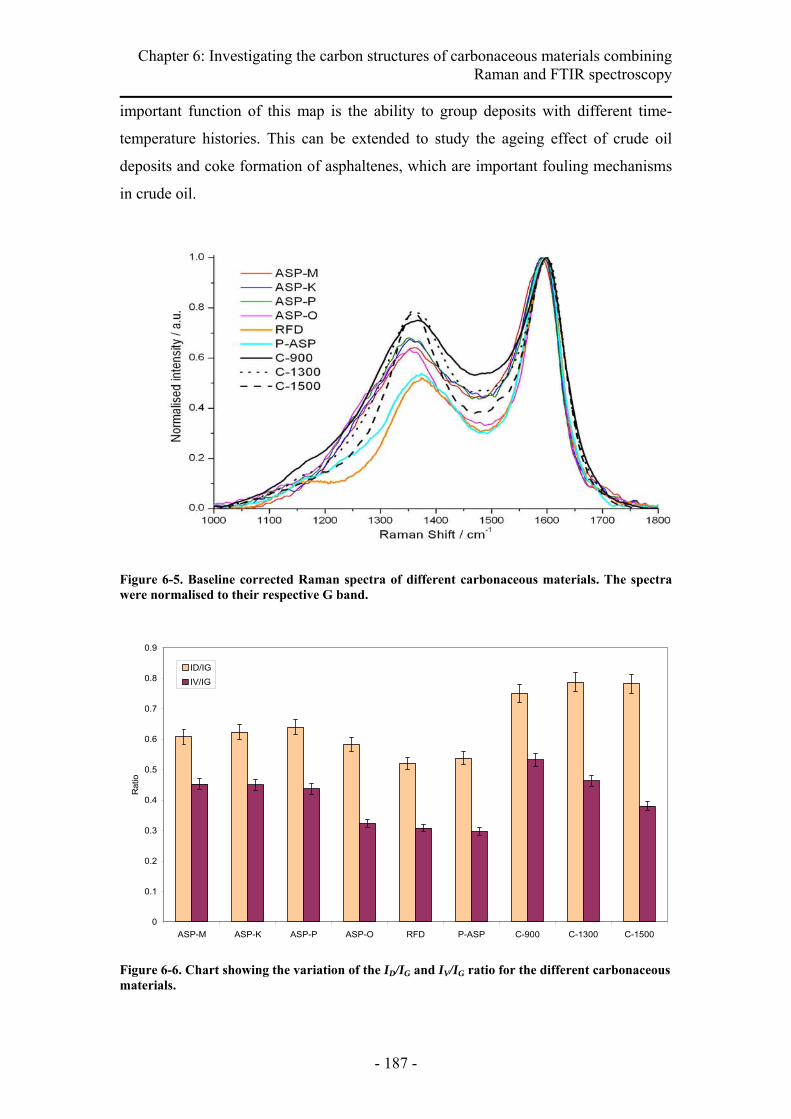
Chapter 6: Investigating the carbon structures of carbonaceous materials combining Raman and FTIR spectroscopy
- 187 -
important function of this map is the ability to group deposits with different time-
temperature histories. This can be extended to study the ageing effect of crude oil
deposits and coke formation of asphaltenes, which are important fouling mechanisms
in crude oil.
Figure 6-5. Baseline corrected Raman spectra of different carbonaceous materials. The spectra were normalised to their respective G band.
Figure 6-6. Chart showing the variation of the ID/IG and IV/IG ratio for the different carbonaceous materials.
0
0.1
0.2
0.3
0.4
0.5
0.6
0.7
0.8
0.9
ASP-M ASP-K ASP-P ASP-O RFD P-ASP C-900 C-1300 C-1500
Rat
io
ID/IGIV/IG
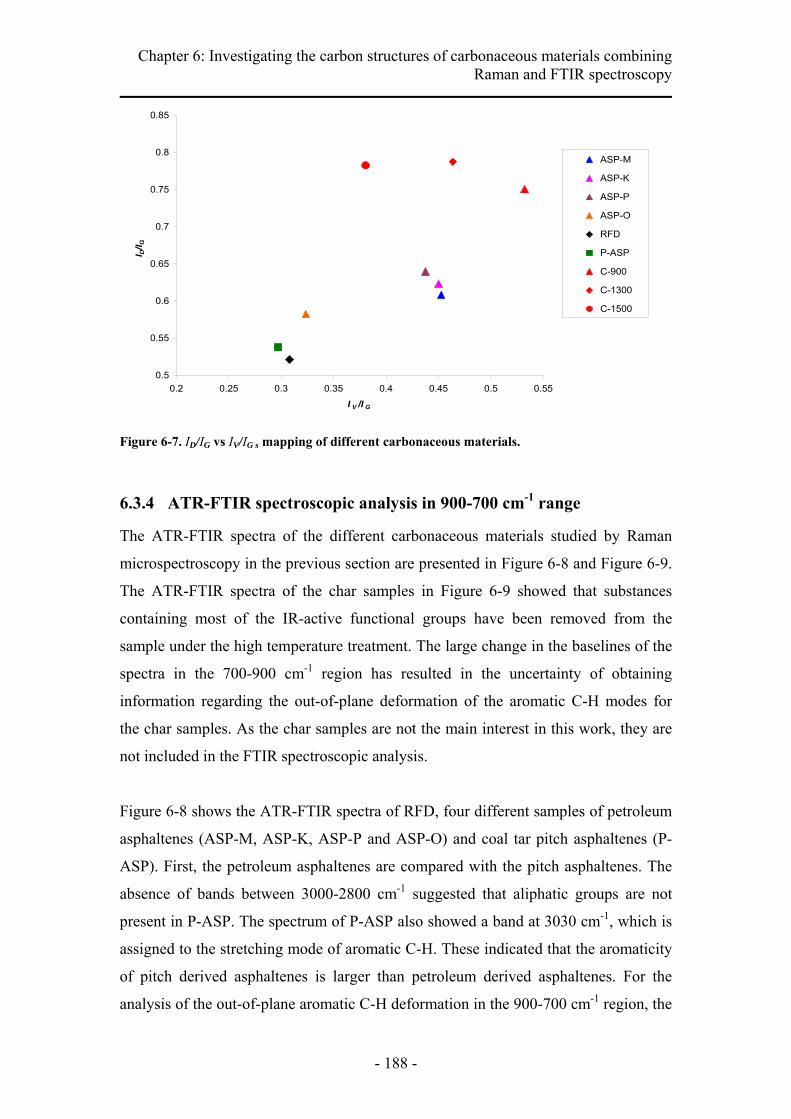
Chapter 6: Investigating the carbon structures of carbonaceous materials combining Raman and FTIR spectroscopy
- 188 -
Figure 6-7. ID/IG vs IV/IG s mapping of different carbonaceous materials.
6.3.4 ATR-FTIR spectroscopic analysis in 900-700 cm-1 range
The ATR-FTIR spectra of the different carbonaceous materials studied by Raman
microspectroscopy in the previous section are presented in Figure 6-8 and Figure 6-9.
The ATR-FTIR spectra of the char samples in Figure 6-9 showed that substances
containing most of the IR-active functional groups have been removed from the
sample under the high temperature treatment. The large change in the baselines of the
spectra in the 700-900 cm-1 region has resulted in the uncertainty of obtaining
information regarding the out-of-plane deformation of the aromatic C-H modes for
the char samples. As the char samples are not the main interest in this work, they are
not included in the FTIR spectroscopic analysis.
Figure 6-8 shows the ATR-FTIR spectra of RFD, four different samples of petroleum
asphaltenes (ASP-M, ASP-K, ASP-P and ASP-O) and coal tar pitch asphaltenes (P-
ASP). First, the petroleum asphaltenes are compared with the pitch asphaltenes. The
absence of bands between 3000-2800 cm-1 suggested that aliphatic groups are not
present in P-ASP. The spectrum of P-ASP also showed a band at 3030 cm-1, which is
assigned to the stretching mode of aromatic C-H. These indicated that the aromaticity
of pitch derived asphaltenes is larger than petroleum derived asphaltenes. For the
analysis of the out-of-plane aromatic C-H deformation in the 900-700 cm-1 region, the
0.5
0.55
0.6
0.65
0.7
0.75
0.8
0.85
0.2 0.25 0.3 0.35 0.4 0.45 0.5 0.55
I V /I G
I D/I G
ASP-M
ASP-K
ASP-P
ASP-O
RFD
P-ASP
C-900
C-1300
C-1500

Chapter 6: Investigating the carbon structures of carbonaceous materials combining Raman and FTIR spectroscopy
- 189 -
ATR-FTIR spectra were baseline corrected and curve fitted with three Gaussian
functions at 865 cm-1, 815 cm-1 and 745 cm-1 corresponding to the vibrations of
isolated aromatic hydrogens (1H), two adjacent hydrogens (2H) and four adjacent
hydrogens (4H) respectively. For a qualitative comparison, the maximum absorbance
height of each band was used. Figure 6-10 shows the percentage of 1H, 2H and 4H
based on the absorbance from the fitted curves. A calibration can be made with
samples of known aromatic structures and the degree of aromatic ring condensation
can be quantified. However, this is not covered here as the aim of the study is to
demonstrate how information from Raman spectroscopy and ATR-FTIR spectroscopy
in the 900-700 cm-1 spectral region can be used to characterise the carbon structures in
carbonaceous materials. Figure 6-10 shows that the percentage of different adjacent
aromatic hydrogens in ASP-M, ASP-K, ASP-P and ASP-O are very much similar
thus indicating little difference in the average aromatic structures of petroleum
asphaltenes measured. The number of adjacent hydrogens per aromatic ring not only
provides an estimate of the degree of aromatic substitution and condensation, it also
provides information on the size and shape of the PAHs.
A larger proportion of 1H supports the structure of a longer PAH structure. It has been
debated whether the generalised shape of asphaltenes is of a continental model where
it has a PAH core with peripheral aliphatic chains or an archipelago model where
aliphatic chains interconnect groups of small aromatic regions.258 The proportion of
1H compared to other adjacent aromatic C-H observed in this work is significant, thus
suggesting that the shape of an average asphaltene is more similar to a wide
continental model than the archipelago model. Comparing the petroleum asphaltenes
to pitch asphaltenes, it can be observed that P-ASP has a larger proportion of 4H and
a smaller proportion of 1H. This suggests that the PAHs in P-ASP are smaller than the
PAHs in petroleum asphaltenes and exist as small “islands”. A schematic diagram,
adopted from the work of Bauschlicher and co-workers259, showing how the different
aromatic C-H deformation bands affect the shape of the PAHs is shown in Figure
6-11.
The ATR-FTIR spectrum of RFD is also presented in Figure 6-8. It can be observed
that the shape of the bands found in the 900-700 cm-1 region is different from the rest
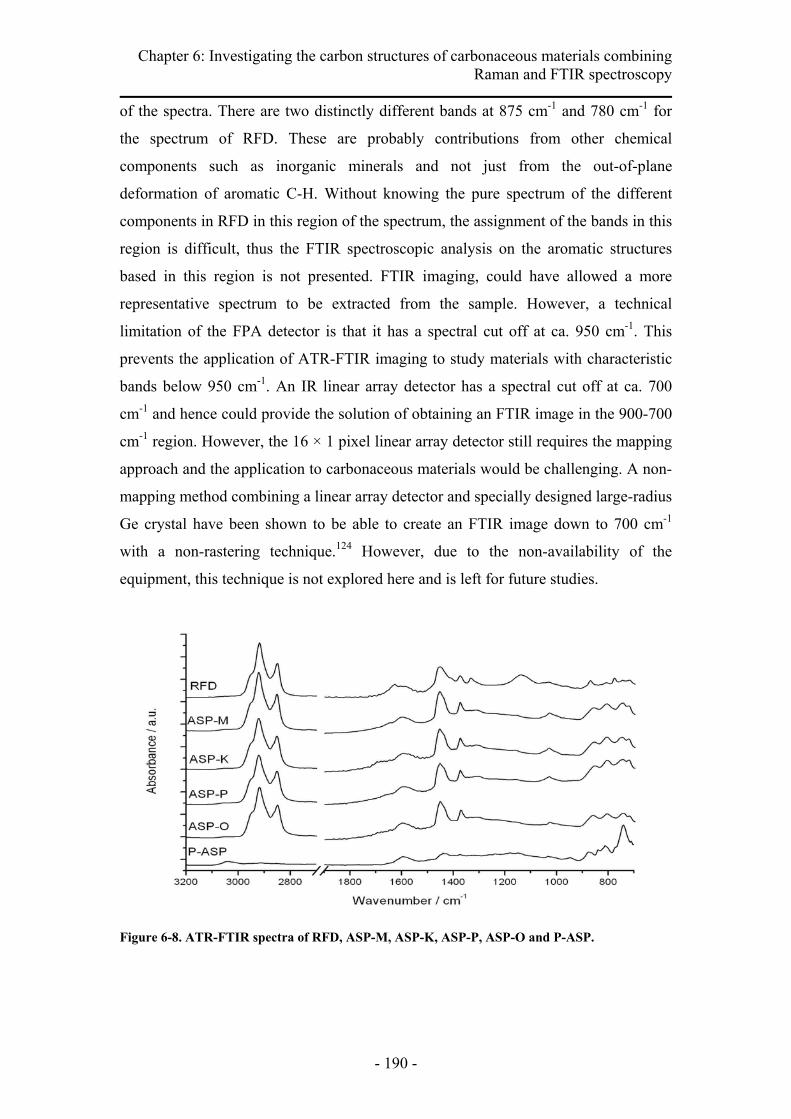
Chapter 6: Investigating the carbon structures of carbonaceous materials combining Raman and FTIR spectroscopy
- 190 -
of the spectra. There are two distinctly different bands at 875 cm-1 and 780 cm-1 for
the spectrum of RFD. These are probably contributions from other chemical
components such as inorganic minerals and not just from the out-of-plane
deformation of aromatic C-H. Without knowing the pure spectrum of the different
components in RFD in this region of the spectrum, the assignment of the bands in this
region is difficult, thus the FTIR spectroscopic analysis on the aromatic structures
based in this region is not presented. FTIR imaging, could have allowed a more
representative spectrum to be extracted from the sample. However, a technical
limitation of the FPA detector is that it has a spectral cut off at ca. 950 cm-1. This
prevents the application of ATR-FTIR imaging to study materials with characteristic
bands below 950 cm-1. An IR linear array detector has a spectral cut off at ca. 700
cm-1 and hence could provide the solution of obtaining an FTIR image in the 900-700
cm-1 region. However, the 16 × 1 pixel linear array detector still requires the mapping
approach and the application to carbonaceous materials would be challenging. A non-
mapping method combining a linear array detector and specially designed large-radius
Ge crystal have been shown to be able to create an FTIR image down to 700 cm-1
with a non-rastering technique.124 However, due to the non-availability of the
equipment, this technique is not explored here and is left for future studies.
Figure 6-8. ATR-FTIR spectra of RFD, ASP-M, ASP-K, ASP-P, ASP-O and P-ASP.

Chapter 6: Investigating the carbon structures of carbonaceous materials combining Raman and FTIR spectroscopy
- 191 -
Figure 6-9. ATR-FTIR spectra of C-900, C-1300 and C-1500.
Figure 6-10. The percentage of different aromatic C-H out-of-plane deformation bands in asphaltenes.
0%10%20%30%40%50%60%70%80%90%
100%
ASP-M ASP-K ASP-P ASP-O P-ASP
% b
ased
on
abso
rban
ce
4 adjacent hydrogen 2 adjacent hydrogen isolated hydrogen
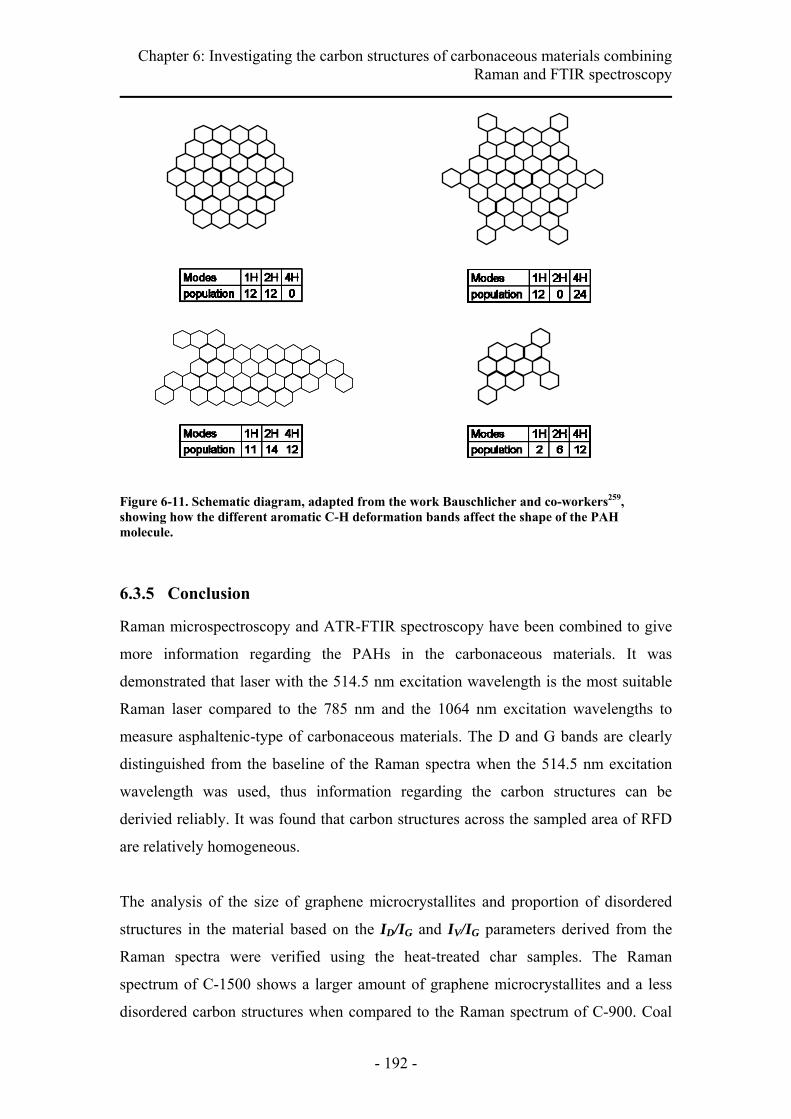
Chapter 6: Investigating the carbon structures of carbonaceous materials combining Raman and FTIR spectroscopy
- 192 -
Figure 6-11. Schematic diagram, adapted from the work Bauschlicher and co-workers259, showing how the different aromatic C-H deformation bands affect the shape of the PAH molecule.
6.3.5 Conclusion
Raman microspectroscopy and ATR-FTIR spectroscopy have been combined to give
more information regarding the PAHs in the carbonaceous materials. It was
demonstrated that laser with the 514.5 nm excitation wavelength is the most suitable
Raman laser compared to the 785 nm and the 1064 nm excitation wavelengths to
measure asphaltenic-type of carbonaceous materials. The D and G bands are clearly
distinguished from the baseline of the Raman spectra when the 514.5 nm excitation
wavelength was used, thus information regarding the carbon structures can be
derivied reliably. It was found that carbon structures across the sampled area of RFD
are relatively homogeneous.
The analysis of the size of graphene microcrystallites and proportion of disordered
structures in the material based on the ID/IG and IV/IG parameters derived from the
Raman spectra were verified using the heat-treated char samples. The Raman
spectrum of C-1500 shows a larger amount of graphene microcrystallites and a less
disordered carbon structures when compared to the Raman spectrum of C-900. Coal
Chapter 6: Investigating the carbon structures of carbonaceous materials combining Raman and FTIR spectroscopy
- 193 -
tar pitch asphaltenes were shown to have smaller graphene microcrystallites but a
more ordered carbon structures when compared to petroleum asphaltenes. The
analysis on RFD shows that it has carbon structures more similar to pitch asphaltenes
than to petroleum asphaltenes. The more ordered structures observed in RFD may be
due to ageing of the deposit in the heat exchangers.
Using a ID/IG vs IV/IG mapping method, the carbonaceous organisation of deposited
foulants and asphaltenes can be compared with different order classes of
carbonaceous materials. This allows deposits with different time-temperature histories
to be classified so that evolution of the carbon structure can be monitored rapidly.
Potentially, this can be use to study the ageing of deposits and coke formation of
asphaltenes.
The degree of condensation and degree of substitution of PAHs can be obtained by
ATR-FTIR spectroscopy in the spectral region of 900-700 cm-1. The relative peak
heights of different aromatic CH deformation bands were used to provide information
regarding the size and shape of the PAHs in carbonaceous materials. The ATR-FTIR
spectra of petroleum asphaltenes suggest that the shape of an average asphaltene is
more similar to a wide continental model than the archipelago model. It was also
found that the PAHs in pitch asphaltenes are smaller and exist in “islands”.
Unfortunately, the analysis of RFD in this region could not be carried out due to the
spectral contamination in this region by other chemical components in the sample.
In summary, the complementary used of Raman and FTIR spectroscopy has been
shown to be useful in characterising the carbon structures in asphaltenes. Raman
spectroscopy provides information regarding to the size of the PAHs and the order of
the carbon structures while ATR-FTIR spectroscopy provides the degree of
substitution and condensation of the PAHs. A better understanding of the PAHs in
asphaltenes, and deposited foulants can be obtained using such a combined approach.

- 194 -
CHAPTER SEVEN
CONCLUSIONS AND
FUTURE WORKS

7.Conclusions and future workure work
- 195 -
7 Conclusions and future work
7.1 Conclusions
The results presented in this thesis contribute towards the understanding of crude oil
fouling in heat exchanges. Rapid and reliable approaches for the characterisation of
deposited foulants and other related carbonaceous materials, such as asphaltenes, have
been developed using advanced vibrational spectroscopic techniques such as FTIR
imaging and Raman microspectroscopy.
An emerging and powerful imaging technology based on FTIR spectroscopy has been
applied for the first time to the characterisation of deposited foulants and asphaltenes.
ATR-FTIR spectroscopic imaging has the advantage of being a non-destructive
analytical technique and most importantly, is able to provide both chemical and
spatial information from a sample. The small penetration depth of the evanescence
wave of the ATR approach makes it a convenient sampling method with little or no
sample preparation and allows it to be applied to highly absorbing materials such as
carbonaceous hydrocarbons.
One of the advancements in the thesis was the development of a movable aperture to
control the angle of incidence in the versatile diamond ATR accessory. It has been
used to correct the distortion of spectral bands due to the dispersion of the refractive
index which allows reliable IR spectral information to be obtained from high
refractive index materials. This is particularly useful for the application of ATR-FTIR
spectroscopy to materials such as crude oil deposits and asphaltenes which have
relatively high refractive indices.
This development facilitated the acquisition of ATR-FTIR images of real crude oil
deposits from the refinery and laboratory-extracted asphaltenes. The novel
applications of combining macro and micro ATR modes in FTIR imaging to these
materials, with the fields of view of 610 µm × 530 µm and 63 µm × 63 µm
respectively, yielded important information about the spatial distribution of different
components in the deposits. The macro ATR imaging approach provides a larger field
of view which can be used to obtain the overall distribution of different components

7.Conclusions and future workure work
- 196 -
in the measured sample. The enhanced spatial resolution of the micro ATR approach
allows a closer look of the sample and a more representative spectrum of a particular
component to be extracted. Using the ATR-FTIR imaging approaches in both micro
and macro modes it was shown that the deposited foulants were extremely
heterogeneous and it was possible to identify clusters of chemically different
compounds in crude oil deposits such as asphaltenes, carbonates, sulphates, sulfoxides,
oxalates and even “coke-like” materials.
Asphaltenes extracted from crude oil from three different geographical locations were
also studied. Two chemically different compounds, namely, “coke-like” materials and
possibly vitrinite compounds were observed. These results suggest that these
components are likely to be associated with asphaltenes in crude oil and they are
found in similar solubility class to asphaltenes.
The real crude oil deposit studied was largely heterogeneous. A statistical testing
method was developed to address how large a data set (the number of chemical
images analysed per sample) is needed to represent the measured sample. This allows
reliable quantifiable parameters such as particle domain size and distribution
regarding the chemical species in deposited foulants to be obtained from the FTIR
images. Such particle statistics can be used to classify the deposits resulting from
different operating conditions and potentially a correlation can be obtained with a
larger number of samples.
ATR-FTIR spectroscopic imaging has been applied in situ to study heating of crude
oil. Compositional change was observed with the macro ATR approach when the
system was heated to 200 °C. The increase in absorbance of the characteristic spectral
band at 1600 cm-1 was indicative of the formation of an asphaltene film. Micro ATR-
FTIR imaging of the particulates formed in the crude oil after heating has identified
seven chemically different species, namely, silicates, amides, sulphates, carbonates,
sulfoxides, vitrinite compounds and “coke-like” materials. The silicates, carbonates,
sulphates and sulfoxides are probably the products of crystallisation fouling. The
amides may be a product of autoxidation and/or polymerisation reactions in the
organic fraction of crude oil. This study has demonstrated that the different
mechanisms of deposition; crystallisation fouling, autoxidation/polymerisation
7.Conclusions and future workure work
- 197 -
fouling and asphaltene deposition in crude oil, can be monitored by combining the
two imaging approaches.
A new application of studying CO2 sorption in asphaltenes using ATR-FTIR
spectroscopy has also been demonstrated. Related asphaltene phenomena important in
describing the structure of asphaltenes, such as gas sorption, swelling of asphaltenes
and trapping of molecules in asphaltenes were monitored using ATR-FTIR
spectroscopy. The in situ measurements also show that some substances were
extracted from the asphaltene film only at high pressure of CO2 (75 bar).
The complementary use of Raman and FTIR spectroscopy has been demonstrated to
characterise the carbon structures in asphaltenes. Information regarding the carbon
structure of the carbonaceous materials can be derived from the G and D bands of the
Raman spectra. The analysis of the size of graphene microcrystallites and proportion
of disordered structures in the material based on the ID/IG and IV/IG parameters
derived from the Raman spectra were verified using the heat-treated char samples.
Coal tar pitch asphaltenes were shown to have smaller graphene microcrystallites but
more ordered carbon structures when compared to petroleum asphaltenes. The
analysis on RFD showed that it has carbon structures more similar to pitch
asphaltenes than to petroleum asphaltenes. The more ordered structures observed in
RFD may be linked to the ageing effects on the deposit in heat exchangers. Using the
ID/IG vs IV/IG mapping method, the carbonaceous organisation of deposited foulants
and asphaltenes has been compared with different order classes of carbonaceous
materials. This allows deposits with different time-temperature histories to be
classified so that the evolution of the carbon structures can be monitored rapidly. The
degree of condensation and substitution of PAHs has been obtained by ATR-FTIR
spectroscopy in the 900-700 cm-1 region. The relative peak heights of different
aromatic CH deformation bands were used to provide information regarding the size
and shape of the PAHs in carbonaceous materials. The ATR-FTIR spectra of
petroleum asphaltenes suggest that the shape of an average asphaltene is more similar
to a wide continental model than the archipelago model. It was also found that the
PAHs in pitch asphaltenes are smaller and exist in “islands”.

7.Conclusions and future workure work
- 198 -
In summary, the high chemical specificity, imaging capability and fast acquisition
times offered by the advanced vibrational spectroscopic techniques utilised have
shown significant potential for a systematic characterisation approach of the chemical
and physical behaviour of the complex materials such as crude oil deposits and
asphaltenes. The overall aim of this study is to improve the understanding of crude oil
fouling in heat exchangers by providing information obtained by advanced
spectroscopic methods. This would require linking such information to the data
obtained by other techniques and the modelling of heat-transfer processes and phase
behaviour of these complex systems. Nevertheless, information obtained in this thesis
would serve as a mean for providing the required data towards this overall goal.
7.2 Future work
The applications of advanced vibrational techniques and the methodologies developed
in this thesis have introduced a platform where new research opportunities using
spectroscopy can be explored further to provide extended insight into the origin of
deposition in crude oil fouling. This could assist the oil industry to mitigate fouling
hence minimising its impact in both economic and environmental terms.
Recommendations for future research on crude oil fouling that can be carried out as a
continuation of the thesis are outlined below.
• ATR-FTIR imaging could be applied to a number of real deposits from
different origins. The particle analysis of the different components derived
from the chemical images could be correlated to the type of crude oil and
operating conditions used for the process. A bigger data set would allow
trends of different fouling mechanisms to be observed, thus leading to the
prediction of fouling in crude oil.
• The heating of crude oil systems in situ with ATR-FTIR imaging could be
carried out at different conditions to study the effects of time-temperature-
pressure on the fouling rates and fouling mechanisms that dominate in the
system. A new high temperature cell could be designed to provide more
realistic operating temperatures, similar to the pre-heat train heat exchangers
(230-300 °C).

7.Conclusions and future workure work
- 199 -
• A high temperature and pressure ATR accessory with a stirrer is available
commercially. This could be used to study in situ how shear stress affects the
deposition rate in crude oil under a controlled environment.
• Surface chemistry plays a significant role in the fouling process. One
possibility would be to carry out the heating experiment ex situ to investigate,
using the developed spectroscopic methodology, how different surface
characteristics affect deposition in crude oil. The other approach would be to
deposit nanosized islands of different metals on the ATR crystal to mimic the
surface of the heat exchangers. This investigation could be extended to surface
modification studies to prevent deposition in crude oil systems.
• The study of the phase behaviour of asphaltenes in crude oil exposed to
different light gases (N2, CO2, methane, ethane, etc) could be carried out using
ATR-FTIR spectroscopy. The data could be used to improve thermodynamic
models in predicting asphaltene stability in crude oil during different
production operations.
• FTIR imaging with a linear array detector has the advantage of a larger
spectral range, down to 700 cm-1. This spectral range contains valuable
information regarding the carbon structures and minerals which are often
found together with the deposited foulants. This imaging setup could be
applied to enhance the characterisation of fouling materials using vibrational
spectroscopy.
• The methodology developed combining Raman microspectroscopy and FTIR
spectroscopy to characterise carbon structures in fouling materials could be
applied to the study of coke formation and the ageing effect of the deposits.
The ageing phenomenon is important in the study of crude oil fouling as
deposits in the heat exchangers are often on stream for many months.
• Tip-enhanced Raman spectroscopy (TERS), which combines AFM with
Raman microspectroscopy, has been shown to be able to obtain spectroscopic

7.Conclusions and future workure work
- 200 -
information with nanometer spatial resolution.70 Mechanical and chemical
information of nanoaggregates of asphaltenes or even individual large
molecules of asphaltenes (6 to 20 nm)36 could obtained simultanousely. One
possible application would be to study the influence of resin on the
aggregation of asphaltenes. Asphaltenes tend to aggregate and bind to resins.36,
38, 66 Ese and co-workers66 have shown that different sized aggregates were
formed from different resin to asphaltene ratio mixture. Spectroscopic
information of these nanoaggregates could provide additional information to
help understand their molecular assembly and therefore the role of resins in
the stabilisation of asphaltene molecules in crude oil.
• ATR-FTIR imaging has been successfully applied for high-throughput studies
where many samples can be measured simultaneously.129, 143, 162, 260 Potentially,
this approach allows multiple crude oil samples to be investigated under
controlled conditions. A multi-channel metal grid could be made for the
diamond ATR accessory to isolate the crude oil samples. The realisation of
this technology may allow links between feed composition, operating
conditions and fouling to be ascertained rapidly.
REFERENCES
- 201 -
REFERENCES
1. IEA Oil market report (March). http://omrpublic.iea.org/omrarchive/13mar09full.pdf (01/04/2009),
2. OPEC Monthly oil market report (September). http://www.opec.org/home/ (15/10/07),
3. Panchal, C. B.; Huangfu, E. P., Effects of mitigating fouling on the energy efficiency of crude-oil distillation. Heat Transfer Engineering 2000, 21, (3), 3-9.
4. Baudelet, C. A.; Krueger, A. W., A practical approach to fouling mitigation in refinery units: the spirelf. 1st edition ed.; AIChE Spring National Meeting: Houston, Texas, 1999.
5. Muller-Steinhagen, H., Fouling of heat-exchanger surfaces. Chemistry & Industry 1995, (5), 171-175.
6. Espstein, N., Thinking about heat transfer fouling: a 5 x 5 matrix. Heat Transfer Engineering 1983, 4, (1), 43-56.
7. Takemoto, T.; Crittenden, B. D.; Kolaczkowski, S. T., Interpretation of fouling data in industrial shell and tube heat exchangers. Chemical Engineering Research & Design 1999, 77, (A8), 769-778.
8. Sheikh, A. K.; Zubair, S. M.; Haq, M. U.; Budair, M. O., Reliability-based maintenance strategies for heat exchangers subject to fouling. Journal of Energy Resources Technology-Transactions of the Asme 1996, 118, (4), 306-312.
9. Crittenden, B. D.; Kolaczkowski, S. T.; Downey, I. L., Fouling of crude-oil preheat exchangers. Chemical Engineering Research & Design 1992, 70, (A6), 547-557.
10. CROF Crude Oil Fouling. http://www3.imperial.ac.uk/crudeoilfouling (19/09/09),
11. Watkinson, A. P.; Wilson, D. I., Chemical reaction fouling: A review. Experimental Thermal and Fluid Science 1997, 14, (4), 361-374.
12. Muller-Steinhagen, H., Heat Exchanger Fouling. 1 ed.; IChemE: Rugby, 2000.
13. Wilson, D. I.; Watkinson, A. P., Model experiments of autoxidation reaction fouling .1. mechanisms. Chemical Engineering Research & Design 1995, 73, (A1), 59-68.
14. Wilson, D. I.; Watkinson, A. P., Study of autoxidation reaction fouling in heat exchangers. Canadian Journal of Chemical Engineering 1996, 74, (2), 236-246.
15. Crittenden, B. D.; Hout, S. A.; Alderman, N. J., Model experiments of chemical-reaction fouling. Chemical Engineering Research & Design 1987, 65, (2), 165-170.

REFERENCES
- 202 -
16. Srinivasan, M.; Watkinson, A. P., Fouling of some Canadian crude oils. Heat Transfer Engineering 2005, 26, (1), 7-14.
17. Dickakian, G.; Seay, S., Asphaltene precipitation primary crude exchanger fouling mechanism. Oil & Gas Journal 1988, 86, (10), 47-50.
18. Wiehe, I. A., A phase-separation kinetic-model for coke formation. Industrial & Engineering Chemistry Research 1993, 32, (11), 2447-2454.
19. Savage, P. E.; Klein, M. T.; Kukes, S. G., Asphaltene reaction pathways .1. thermolysis. Industrial & Engineering Chemistry Process Design and Development 1985, 24, (4), 1169-1174.
20. Speight, J. G., The chemistry and technology of petroleum. 3 ed.; Marcel Dekker: New York, 1999.
21. Pfeiffer, J. P.; Saal, R. N. J., Asphaltic bitumen as colloid system. Journal of Physical Chemistry 1940; Vol. 44, 139-149.
22. Andersen, S. I.; Birdi, K. S., Aggregation of asphaltenes as determined by calorimetry. Journal of Colloid and Interface Science 1991, 142, (2), 497-502.
23. Mohammed, R. A.; Bailey, A. I.; Luckham, P. F.; Taylor, S. E., Dewatering of crude-oil emulsions .2. interfacial properties of the asphaltic constituents of crude-oil. Colloids and Surfaces a-Physicochemical and Engineering Aspects 1993, 80, (2-3), 237-242.
24. Sirota, E. B., Physical structure of asphaltenes. Energy & Fuels 2005, 19, (4), 1290-1296.
25. Sirota, E. B.; Lin, M. Y., Physical behavior of asphaltenes. Energy & Fuels 2007, 21, (5), 2809-2815.
26. Speight, J. G.; Long, R. B.; Trowbridge, T. D., Factors influencing the separation of asphaltenes from heavy petroleum feedstocks. Fuel 1984, 63, (5), 616-620.
27. Waller, P. R.; Williams, A.; Bartle, K. D., The structural nature and solubility of residual fuel-oil fractions. Fuel 1989, 68, (4), 520-526.
28. Schabron, J. F.; Speight, J. G. In The solubility and three-dimensional structure of asphaltenes, International Meeting on Petroleum Phase Behavior, Houston, Texas, Mar 09-13, 1997; Marcel Dekker Inc: Houston, Texas, 1997; 361-375.
29. Groenzin, H.; Mullins, O. C., Molecular size and structure of asphaltenes from various sources. Energy & Fuels 2000, 14, (3), 677-684.
30. Ancheyta, J.; Centeno, G.; Trejo, F.; Marroquin, G.; Garcia, J. A.; Tenorio, E.; Torres, A., Extraction and characterization of asphaltenes from different crude oils and solvents. Energy & Fuels 2002, 16, (5), 1121-1127.

REFERENCES
- 203 -
31. Strausz, O. P.; Mojelsky, T. W.; Faraji, F.; Lown, E. M.; Peng, P. In Additional structural details on Athabasca asphaltene and their ramifications, Symposium on Advances in the Chemistry of Asphaltene and Related Substances at the 5th North American Chemical Congress, Cancun, Mexico, Nov 11-15, 1997; Amer Chemical Soc: Cancun, Mexico, 1997; 207-227.
32. Speight, J. G., Petroleum asphaltenes - Part 1 - Asphaltenes, resins and the structure of petroleum. Oil & Gas Science and Technology-Revue De L Institut Francais Du Petrole 2004, 59, (5), 467-477.
33. Leontaritis, K. J., Asphaltene deposition: a comprehensive description of problem manifestations and modeling approachs. SPE production operations symposium 1989, (SPE 18892).
34. Herod, A. A.; Bartle, K. D.; Kandiyoti, R., Characterization of heavy hydrocarbons by chromatographic and mass spectrometric methods: an overview. Energy & Fuels 2007, 21, (4), 2176-2203.
35. Behrouzi, M.; Luckham, P. F., Limitations of size-exclusion chromatography in analyzing petroleum asphaltenes: A proof by atomic force Microscopy. Energy & Fuels 2008, 22, (3), 1792-1798.
36. Ravey, J. C.; Ducouret, G.; Espinat, D., Asphaltene macrostructure by small-angle neutron-scattering. Fuel 1988, 67, (11), 1560-1567.
37. Rodgers, R. P.; Marshall, A. G., Petroleomics: advanced characterization of petroleum-derived materials by Fourier transform ion cyclotron resonance mass spectrometry (FT-ICR MS). In Asphaltenes, heavy oils, and petroleomics, Mullins, O. C.; Sheu, E. Y.; Hammami, A.; Marshall, A. G., Eds. Springer: New York, 2007; p 63.
38. Strausz, O. P.; Peng, P.; Murgich, J., About the colloidal nature of asphaltenes and the MW of covalent monomeric units. Energy & Fuels 2002, 16, (4), 809-822.
39. Acevedo, S.; Castro, A.; Negrin, J. G.; Fernandez, A.; Escobar, G.; Piscitelli, V., Relations between asphaltene structures and their physical and chemical properties: The rosary-type structure. Energy & Fuels 2007, 21, (4), 2165-2175.
40. Bouhadda, Y.; Bormann, D.; Sheu, E.; Bendedouch, D.; Krallafa, A.; Daaou, M., Characterization of Algerian Hassi-Messaoud asphaltene structure using Raman spectrometry and X-ray diffraction. Fuel 2007, 86, (12-13), 1855-1864.
41. Shirokoff, J. W.; Siddiqui, M. N.; Ali, M. F., Characterization of the structure of Saudi crude asphaltenes by X-ray diffraction. Energy & Fuels 1997, 11, (3), 561-565.
42. Gonzalez, D. L.; Ting, P. D.; Hirasaki, G. J.; Chapman, W. G., Prediction of asphaltene instability under gas injection with the PC-SAFT equation of state. Energy & Fuels 2005, 19, (4), 1230-1234.
43. Verdier, S.; Carrier, H.; Andersen, S. I.; Daridon, J. L., Study of pressure and temperature effects on asphaltene stability in presence of CO2. Energy & Fuels 2006, 20, (4), 1584-1590.

REFERENCES
- 204 -
44. Mohamed, R. S.; Loh, W.; Ramos, A. C. S.; Delgado, C. C.; Almeida, V. R., Reversibility and inhibition of asphaltene precipitation in Brazilian crude oils. Petroleum Science and Technology 1999, 17, (7-8), 877-896.
45. Lundanes, E.; Greibrokk, T., Separation of fuels, heavy fractions, and crude oils into compound classes - a review. Hrc-Journal of High Resolution Chromatography 1994, 17, (4), 197-202.
46. ASTM-D3279, Standard test method for n-heptane insolubles. ASTM International 2007.
47. Speight, J. G., The molecular nature of petroleum asphaltenes. Arabian Journal for Science and Engineering 1994, 19, (2B), 335-353.
48. Hammami, A.; Ratulowski, J., Precipitation and deposition of asphaltene in production systems: a flow assurance overview. In Asphaltenes, heavy oils, and petroleomics, Mullins, O. C.; Sheu, E. Y.; Hammami, A.; Marshall, A. G., Eds. Springer: New York, 2007.
49. Kaminski, T. J.; Fogler, H. S.; Wolf, N.; Wattana, P.; Mairal, A., Classification of asphaltenes via fractionation and the effect of heteroatom content on dissolution kinetics. Energy & Fuels 2000, 14, (1), 25-30.
50. Buenrostro-Gonzalez, E.; Andersen, S. I.; Garcia-Martinez, J. A.; Lira-Galeana, C., Solubility/molecular structure relationships of asphaltenes in polar and nonpolar media. Energy & Fuels 2002, 16, (3), 732-741.
51. Petoukhov, M. V.; Svergun, D. I., Joint use of small-angle X-ray and neutron scattering to study biological macromolecules in solution. European Biophysics Journal with Biophysics Letters 2006, 35, (7), 567-576.
52. Ramzi, A.; Sutter, M.; Hennink, W. E.; Jiskoot, W., Static light scattering and small-angle neutron scattering study on aggregated recombinant gelatin in aqueous solution. Journal of Pharmaceutical Sciences 2006, 95, (8), 1703-1711.
53. Kaewsaiha, P.; Matsumoto, K.; Matsuoka, H., Sphere-to-rod transition of non-surface-active amphiphilic diblock copolymer micelles: A small-angle neutron scattering study. Langmuir 2007, 23, (18), 9162-9169.
54. Bergmann, U.; Groenzin, H.; Mullins, O. C.; Glatzel, P.; Fetzer, J.; Cramer, S. P., X-ray Raman spectroscopy - A new tool to study local structure of aromatic hydrocarbons and asphaltenes. Petroleum Science and Technology 2004, 22, (7-8), 863-875.
55. Fenistein, D.; Barre, L.; Broseta, D.; Espinat, D.; Livet, A.; Roux, J. N.; Scarsella, M., Viscosimetric and neutron scattering study of asphaltene aggregates in mixed toluene/heptane solvents. Langmuir 1998, 14, (5), 1013-1020.
56. Gharfeh, S.; Yen, A.; Asomaning, S.; Blumer, D., Asphaltene flocculation onset determinations for heavy crude oil and its implications. Petroleum Science and Technology 2004, 22, (7-8), 1055-1072.

REFERENCES
- 205 -
57. Espinat, D.; Fenistein, D.; Barre, L.; Frot, D.; Briolant, Y., Effects of temperature and pressure on asphaltenes agglomeration in toluene. A light, X-ray, and neutron scattering investigation. Energy & Fuels 2004, 18, (5), 1243-1249.
58. Espinat, D.; Ravey, J. C.; Guille, V.; Lambard, J.; Zemb, T.; Cotton, J. P., Colloidal macrostructure of crude-oil studied by neutron and X-ray small-angle scattering techniques. Journal De Physique Iv 1993, 3, (C8), 181-184.
59. Herzog, P.; Tchoubar, D.; Espinat, D., Macrostructure of asphaltene dispersions by small-angle X-ray-scattering. Fuel 1988, 67, (2), 245-250.
60. Savvidis, T. G.; Fenistein, D.; Barre, L.; Behar, E., Aggregated structure of flocculated asphaltenes. Aiche Journal 2001, 47, (1), 206-211.
61. Gawrys, K. L.; Kilpatrick, P. K., Asphaltenic aggregates are polydisperse oblate cylinders. Journal of Colloid and Interface Science 2005, 288, (2), 325-334.
62. Sheu, E. Y., Petroleomics and characterisation of asphaltene aggregates using small angle scattering. In Asphaltenes, heavy oils, and petroleomics, 1 ed.; Mullins, O. C.; Sheu, E. Y.; Hammami, A.; Marshall, A. G., Eds. Springer: New York, 2007.
63. Lord, D. L.; Buckley, J. S. In An AFM study of the morphological features that affect wetting at crude oil-water-mica interfaces, International Workshop on Nanocapillarity: Wetting of Heterogenous Surface and Porous Solid, Princeton, New Jersey, Jun 25-27, 2001; Elsevier Science Bv: Princeton, New Jersey, 2001; 531-546.
64. Zhang, L. Y.; Lawrence, S.; Xu, Z.; Masliyah, J. H., Studies of Athabasca asphaltene Langmuir films at air-water interface. Journal of Colloid and Interface Science 2003, 264, (1), 128-140.
65. Zhang, L. Y.; Xu, Z. H.; Masliyah, J. H., Characterization of adsorbed athabasca asphaltene films at solvent-water interfaces using a Langmuir interfacial trough. Industrial & Engineering Chemistry Research 2005, 44, (5), 1160-1174.
66. Ese, M. H.; Sjoblom, J.; Djuve, J.; Pugh, R., An atomic force microscopy study of asphaltenes on mica surfaces. Influence of added resins and demulsifiers. Colloid and Polymer Science 2000, 278, (6), 532-538.
67. Wang, S. Q.; Liu, J. J.; Zhang, L. Y.; Xu, Z. H.; Masliyah, J., Colloidal Interactions between Asphaltene Surfaces in Toluene. Energy & Fuels 2009, 23, (1), 862-869.
68. Liu, J. J.; Zhang, L. Y.; Xu, Z. H.; Masliyah, J., Colloidal interactions between asphaltene surfaces in aqueous solutions. Langmuir 2006, 22, (4), 1485-1492.
69. Cadena-Nava, R. D.; Cosultchi, A.; Ruiz-Garcia, J., Asphaltene behavior at interfaces. Energy & Fuels 2007, 21, (4), 2129-2137.
70. Pettinger, B.; Ren, B.; Picardi, G.; Schuster, R.; Ertl, G., Nanoscale probing of adsorbed species by tip-enhanced Raman spectroscopy. Physical Review Letters 2004, 92, (9), 096101.
REFERENCES
- 206 -
71. Stockle, R. M.; Suh, Y. D.; Deckert, V.; Zenobi, R., Nanoscale chemical analysis by tip-enhanced Raman spectroscopy. Chemical Physics Letters 2000, 318, (1-3), 131-136.
72. Acevedo, S.; Escobar, G.; Ranaudo, M. A.; Pinate, J.; Amorin, A.; Diaz, M.; Silva, P., Observations about the structure and dispersion of petroleum asphaltenes aggregates obtained from dialysis fractionation and characterization. Energy & Fuels 1997, 11, (4), 774-778.
73. Acevedo, S.; Gutierrez, L. B.; Negrin, G.; Pereira, J. C.; Mendez, B., Molecular weight of petroleum asphaltenes: A comparison between mass spectrometry and vapor pressure osmometry. Energy & Fuels 2005, 19, (4), 1548-1560.
74. Andersen, S. I., Effect of precipitation temperature on the composition of n-heptane asphaltenes. Fuel Science & Technology International 1994, 12, (1), 51-74.
75. Dettman, H.; Inman, A.; Salmon, S.; Scott, K.; Fuhr, B., Chemical characterization of GPC fractions of Athabasca bitumen asphaltenes isolated before and after thermal treatment. Energy & Fuels 2005, 19, (4), 1399-1404.
76. Trejo, F.; Centeno, G.; Ancheyta, J., Precipitation, fractionation and characterization of asphaltenes from heavy and light crude oils. Fuel 2004, 83, (16), 2169-2175.
77. Ignasiak, T. M.; Kotlyar, L.; Longstaffe, F. J.; Strausz, O. P.; Montgomery, D. S., Separation and characterization of clay from Athabasca asphaltene. Fuel 1983, 62, (3), 353-362.
78. Zhang, L. Y.; Lawrence, S.; Xu, Z. H.; Masliyah, J. H., Studies of Athabasca asphaltene Langmuir films at air-water interface. Journal of Colloid and Interface Science 2003, 264, (1), 128-140.
79. Groenzin, H.; Mullins, O. C., Asphaltene molecular size and weight. In Asphaltenes, heavy oils, and petroleomics, 1 ed.; Mullins, O. C.; Sheu, E. Y.; Hammami, A.; Marshall, A. G., Eds. Springer: New York, 2007.
80. Domin, M.; Herod, A.; Kandiyoti, R.; Larsen, J. W.; Lazaro, M. J.; Li, S.; Rahimi, P., A comparative study of bitumen molecular-weight distributions. Energy & Fuels 1999, 13, (3), 552-557.
81. Juyal, P.; Merino-Garcia, D.; Andersen, S. I., Effect on molecular interactions of chemical alteration of petroleum asphaltenes. I. Energy & Fuels 2005, 19, (4), 1272-1281.
82. Al-Muhareb, E.; Morgan, T. J.; Herod, A. A.; Kandiyoti, R., Characterization of petroleum asphaltenes by size exclusion chromatography, UV-fluorescence and mass spectrometry. Petroleum Science and Technology 2007, 25, (1-2), 81-91.
83. Karaca, F.; Islas, C. A.; Millan, M.; Behrouzi, M.; Morgan, T. J.; Herod, A. A.; Kandiyoti, R., The calibration of size exclusion chromatography columns: Molecular
REFERENCES
- 207 -
mass distributions of heavy hydrocarbon liquids. Energy & Fuels 2004, 18, (3), 778-788.
84. Islas, C. A.; Suelves, I.; Millan, M.; Apicella, B.; Lazaro, M. J.; Herod, A. A.; Kandiyoti, R., Matching average masses of pitch fractions of narrow polydispersity, derived from matrix-assisted laser desorption ionisation time-of-flight mass spectrometry, with the polystyrene calibration of SEC. Journal of Separation Science 2003, 26, (15-16), 1422-1428.
85. Millan, M.; Behrouzi, M.; Karaca, F.; Morgan, T. J.; Herod, A. A.; Kandiyoti, R., Characterising high mass materials in heavy oil fractions by size exclusion chromatography and MALDI-mass spectrometry. Catalysis Today 2005, 109, (1-4), 154-161.
86. Badre, S.; Goncalves, C. C.; Norinaga, K.; Gustavson, G.; Mullins, O. C., Molecular size and weight of asphaltene and asphaltene solubility fractions from coals, crude oils and bitumen. Fuel 2006, 85, (1), 1-11.
87. Mullins, O. C., Rebuttal to comment by professors Herod, Kandiyoti, and Bartle on "Molecular size and weight of asphaltene and asphaltene solubility fractions from coals, crude oils and bitumen". Fuel 2007, 86, (1-2), 309-312.
88. Berrueco, C.; Venditti, S.; Morgan, T. J.; Alvarez, P.; Millan, M.; Herod, A. A.; Kandiyoti, R., Calibration of size-exclusion chromatography columns with 1-methyl-2-pyrrolidinone (NMP)/chloroform mixtures as eluent: Applications to petroleum-derived samples. Energy & Fuels 2008, 22, (5), 3265-3274.
89. Artok, L.; Su, Y.; Hirose, Y.; Hosokawa, M.; Murata, S.; Nomura, M., Structure and reactivity of petroleum-derived asphaltene. Energy & Fuels 1999, 13, (2), 287-296.
90. Klein, G. C.; Angstrom, A.; Rodgers, R. P.; Marshall, A. G., Use of saturates/aromatics/resins/asphaltenes (SARA) fractionation to determine matrix effects in crude oil analysis by electrospray ionization Fourier transform ion cyclotron resonance mass spectrometry. Energy & Fuels 2006, 20, (2), 668-672.
91. Rodgers, R. P.; Klein, G. C.; Yen, A. T.; Asomaning, S.; Marshall, A. G., Compositional analysis of petroleum asphaltenes by FT-ICR mass spectrometry. Abstracts of Papers of the American Chemical Society 2006, 231.
92. Bansal, V.; Patel, M. B.; Sarpal, A. S., Structural aspects of crude oil derived asphaltenes by NMR and XRD and spectroscopic techniques. Petroleum Science and Technology 2004, 22, (11-12), 1401-1426.
93. Douda, J.; Alvarez, R.; Bolanos, J. N., Characterization of Maya asphaltene and maltene by means of pyrolysis application. Energy & Fuels 2008, 22, (4), 2619-2628.
94. Morgan, T. J.; George, A.; Davis, D. B.; Herod, A. A.; Kandiyoti, R., Optimization of H-1 and C-13 NMR methods for structural characterization of acetone and pyridine soluble/insoluble fractions of a coal tar pitch. Energy & Fuels 2008, 22, (3), 1824-1835.
REFERENCES
- 208 -
95. Ibrahim, Y. A.; Abdelhameed, M. A.; Al-Sahhaf, T. A.; Fahim, M. A., Structural characterization of different asphaltenes of Kuwaiti origin. Petroleum Science and Technology 2003, 21, (5-6), 825-837.
96. Kister, J.; Pieri, N.; Alvarez, R.; Diez, M. A.; Pis, J. J., Effects of preheating and oxidation on two bituminous coals assessed by synchronous UV fluorescence and FTIR spectroscopy. Energy & Fuels 1996, 10, (4), 948-957.
97. Ostlund, J. A.; Wattana, P.; Nyden, M.; Fogler, H. S., Characterization of fractionated asphaltenes by UV-vis and NMR self-diffusion spectroscopy. Journal of Colloid and Interface Science 2004, 271, (2), 372-380.
98. Morgan, T. J.; Millan, M.; Behrouzi, M.; Herod, A. A.; Kandiyoti, R., On the limitations of UV-fluorescence spectroscopy in the detection of high-mass hydrocarbon molecules. Energy & Fuels 2005, 19, (1), 164-169.
99. Yen, T. F.; Erdman, J. G., Investigation of the structure of petroleum asphaltenes and related substances by infrared analysis. Petroleum Chemistry 1962, 7, (1), 5-18.
100. Coelho, R. R.; Hovell, I.; Monte, M. B. D.; Middea, A.; de Souza, A. L., Characterisation of aliphatic chains in vacuum residues (VRs) of asphaltenes and resins using molecular modelling and FTIR techniques. Fuel Processing Technology 2006, 87, (4), 325-333.
101. Coelho, R. R.; Hovell, I., Characterization of functional groups of asphaltenes in vacuum residues using molecular modelling and FTIR techniques. Petroleum Science and Technology 2007, 25, (1-2), 41-54.
102. Christy, A. A.; Dahl, B.; Kvalheim, O. M., Structural features of resins, asphaltenes and kerogen studied by diffuse reflectance infrared-spectroscopy. Fuel 1989, 68, (4), 430-435.
103. Siddiqui, M. N., Infrared study of hydrogen bond types in asphaltenes. Petroleum Science and Technology 2003, 21, (9-10), 1601-1615.
104. Akrami, H. A.; Yardim, M. F.; Akar, A.; Ekinci, E., FT-ir characterization of pitches derived from Avgamasya asphaltite and Raman-Dincer heavy crude. Fuel 1997, 76, (14-15), 1389-1394.
105. Huang, J., Thermal degradation of asphaltene and infrared characterization of its degraded fractions. Petroleum Science and Technology 2006, 24, (9), 1089-1095.
106. Aquino-Olivos, M. A.; Andersen, S. I.; Lira-Galeana, C., Comparisons between asphaltenes from the dead and live-oil samples of the same crude oils. Petroleum Science and Technology 2003, 21, (5-6), 1017-1041.
107. Carbognani, L.; Espidel, J., Preparative subfractionation of petroleum resins and asphaltenes. II. Characterization of size exclusion chromatography isolated fractions. Petroleum Science and Technology 2003, 21, (11-12), 1705-1720.
REFERENCES
- 209 -
108. Boukir, A.; Guiliano, M.; Doumenq, P.; El Hallaoui, A.; Mille, G., Structural characterization of crude oil asphaltenes by infrared spectroscopy (FTIR). Application to photo-oxidation. Comptes Rendus De L Academie Des Sciences Serie Ii Fascicule C-Chimie 1998, 1, (10), 597-602.
109. Douda, J.; Llanos, M. E.; Alvarez, R.; Bolanos, J. N., Structure of maya asphaltene-resin complexes through the analysis of soxhlet extracted fractions. Energy & Fuels 2004, 18, (3), 736-742.
110. Calemma, V.; Iwanski, P.; Nali, M.; Scotti, R.; Montanari, L., Structural characterization of asphaltenes of different origins. Energy & Fuels 1995, 9, (2), 225-230.
111. Zhang, L. Y.; Lopetinsky, R.; Xu, Z. H.; Masliyah, J. H., Asphaltene monolayers at a toluene/water interface. Energy & Fuels 2005, 19, (4), 1330-1336.
112. Zhang, L. Y.; Xu, Z. H.; Mashyah, J. H., Langmuir and Langmuir-Blodgett films of mixed asphaltene and a demulsifier. Langmuir 2003, 19, (23), 9730-9741.
113. Smith, B. C., Fundamentals of Fourier transform infrared spectroscopy. 1st ed.; CRC: London, 1996.
114. Harrick, N. J., Internal reflection spectroscopy. Third ed.; Harrick Scientific Corporation: New York, 1987; p 327.
115. Harrick, N. J., Internal reflection spectroscopy. 1 ed.; John Wiley & Son, lnc: New York, 1976.
116. Kazarian, S. G.; Higgins, J. S., A closer look at polymers. Chemistry & Industry May.20, 2002, 21-23.
117. Chan, K. L. A.; Kazarian, S. G., New opportunities in micro- and macro-attenuated total reflection infrared spectroscopic imaging: Spatial resolution and sampling versatility. Applied Spectroscopy 2003, 57, (4), 381-389.
118. Sommer, A. J.; Tisinger, L. G.; Marcott, C.; Story, G. M., Attenuated total internal reflection infrared mapping microspectroscopy using an imaging microscope. Applied Spectroscopy 2001, 55, (3), 252-256.
119. Gupper, A.; Wilhelm, P.; Schmied, M.; Kazarian, S. G.; Chan, K. L. A.; Reussner, J., Combined application of imaging methods for the characterisation of a polymer blend. Applied Spectroscopy 2002, 56, (12), 1515.
120. Kazarian, S. G.; Chan, K. L. A., Sampling approaches in Fourier transform infrared imaging applied to polymers. In Characterization of polymer surfaces and this films, Grundke, K.; Stamm, M.; Adler, H. J., Eds. Springer-Verlag Berlin: Dresden, GERMANY, 2006; Vol. 132, 1-6.
121. Esaki, Y.; Nakai, K.; Araga, T., Development of attenuated total reflection prism for IR microscopy and some applications to local analysis. Bunseki Kagaku 1993, 42, (3), 127-132.

REFERENCES
- 210 -
122. Esaki, Y.; Yokokawa, K.; Araga, T. Accessory and crystalline element for attenuated total reflection infrared spectroscopy. US Patent 5216244, 1993.
123. Lewis, L. L.; Sommer, A., J., Attenuated total internal reflection infrared mapping microspectroscopy of soft materials. Applied Spectroscopy 2000, 54, (2), 324-330.
124. Patterson, B. M.; Havrilla, G. J., Attenuated total internal reflection infrared microspectroscopic imaging using a large-radius germanium internal reflection element and a linear array detector. Applied Spectroscopy 2006, 60, (11), 1256-1266.
125. Patterson, B. M.; Havrilla, G. J.; Marcott, C.; Story, G. M., Infrared microspectroscopic imaging using a large radius germanium internal reflection element and a focal plane array detector. Applied Spectroscopy 2007, 61, (11), 1147-1152.
126. Burka, E. M.; Curbelo, R. Imaging ATR spectrometer. US Patent 6141100, 2000.
127. Kazarian, S. G.; Chan, K. L. A., "Chemical photography" of drug release. Macromolecules 2003, 36, 9866-9872.
128. Koenig, J. L., FTIR imaging of polymer dissolution. Advanced Materials 2002, 14, (6), 457-460.
129. Chan, K. L. A.; Kazarian, S. G., Fourier transform infrared imaging for high-throughput analysis of pharmaceutical formulations Journal of Combinatorial Chemistry 2005, 7, (2), 185-189.
130. Kubanek, P.; Busch, O.; Thomson, S.; Schmidt, H. W.; Schuth, F., Imaging reflection IR spectroscopy as a tool to achieve higher integration for high-throughput experimentation in catalysis research. Journal of Combinatorial Chemistry 2004, 6, (3), 420-425.
131. Snively, C. M.; Oskarsdottir, G.; Lauterbach, J., Chemically sensitive parallel analysis of combinatorial catalyst libraries Catalysis Today 2001, 67, (4), 357-368.
132. Snively, C. M.; Oskarsdottir, G.; Lauterbach, J., Parallel analysis of the reaction products from combinatorial catalyst libraries. Angewandte Chemie-International Edition 2001, 40, (16), 3028-3030.
133. Colley, C. S.; Kazarian, S. G.; Weinberg, P. D.; Lever, M. J., Spectroscopic imaging of arteries and atherosclerotic plaques Biopolymers 2004, 74, (4), 328-335.
134. Dehghani, F.; Annabi, N.; Valtchev, P.; Mithieux, S. M.; Weiss, A. S.; Kazarian, S. G.; Tay, F. H., Effect of dense gas CO2 on the coacervation of elastin. Biomacromolecules 2008, 9, (4), 1100-1105.
135. Kazarian, S. G.; Chan, K. L. A., Applications of ATR-FTIR spectroscopic imaging to biomedical samples. Biochimica Et Biophysica Acta-Biomembranes 2006, 1758, (7), 858-867.
REFERENCES
- 211 -
136. Randle, W. L.; Cha, J. M.; Hwang, Y. S.; Chan, K. L. A.; Kazarian, S. G.; Polak, J. M.; Mantalaris, A., Integrated 3-dimensional expansion and osteogenic differentiation of murine embryonic stem cells. Tissue Engineering 2007, 13, (12), 2957-2970.
137. Steiner, G.; Tunc, S.; Maitz, M.; Salzer, R., Conformational changes during protein adsorption. FT-IR spectroscopic imaging of adsorbed fibrinogen layers. Analytical Chemistry 2007, 79, (4), 1311-1316.
138. Chan, K. L. A.; Govada, L.; Bill, R. M.; Chayen, N. E.; Kazarian, S. G., Attenuated Total Reflection-FT-IR Spectroscopic Imaging of Protein Crystallization. Analytical Chemistry 2009, 81, (10), 3769-3775.
139. Gupper, A.; Chan, K. L. A.; Kazarian, S. G., FT-IR imaging of solvent-induced crystallization in polymers Macromolecules 2004, 37, (17), 6498-6503.
140. Gupper, A.; Kazarian, S. G., Study of solvent diffusion and solvent-induced crystallization in syndiotactic polystyrene using FT-IR spectroscopy and imaging Macromolecules 2005, 38, (6), 2327-2332.
141. Ribar, T.; Bhargava, R.; Koenig, J. L., FT-IR imaging of polymer dissolution by solvent mixtures. 1. Solvents. Macromolecules 2000, 33, (23), 8842-8849.
142. Snively, C. M.; Koenig, J. L., Studying anomalous diffusion in a liquid crystal/polymer system using fast FTIR imaging. Journal of Polymer Science B: Polymer Physics 1999, 37, 2261-2268.
143. Andanson, J. M.; Chan, K. L. A.; Kazarian, S. G., High-throughput spectroscopic imaging applied to permeation through the skin. Applied Spectroscopy 2009, 63, (5), 512-517.
144. Artyushkova, K.; Wall, B.; Koenig, J. L.; Fulghum, J. E., Direct correlation of x-ray photoelectron spectroscopy and Fourier transform infrared spectra and images from poly(vinyl chloride)/poly(methyl methacrylate) polymer blends. Journal of Vacuum Science & Technology A 2001, 19, 2791-2799.
145. Bhargava, R.; Wang, S. Q.; Koenig, J. L., FTIR microspectroscopy of polymeric systems. In Liquid Chromatography Ftir Microspectroscopy Microwave Assisted Synthesis, Springer-Verlag Berlin: Berlin, 2003; Vol. 163, 137-191.
146. Miller-Chou, B. A.; Koenig, J. L., A review of polymer dissolution. Progress in Polymer Science 2003, 28, (8), 1223-1270.
147. Koenig, J. L.; Bobiak, J. P., Raman and infrared imaging of dynamic polymer systems. Macromolecular Materials and Engineering 2007, 292, (7), 801-816.
148. Biswal, D.; Hilt, J. Z., Microscale analysis of patterning reactions via FTIR imaging: Application to intelligent hydrogel systems. Polymer 2006, 47, (21), 7355-7360.
REFERENCES
- 212 -
149. Chan, K. L. A.; Kazarian, S. G., Attenuated total reflection-Fourier transform infrared imaging of large areas using inverted prism crystals and combining imaging and mapping. Applied Spectroscopy 2008, 62, (10), 1095-1101.
150. Chan, K. L. A.; Kazarian, S. G., ATR-FTIR spectroscopic imaging with expanded field of view to study formulations and dissolution. Lab on a Chip 2006, 6, (7), 864-870.
151. Chan, K. L. A.; Kazarian, S. G., Attenuated total reflection Fourier transform infrared imaging with variable angles of incidence: A three-dimensional profiling of heterogeneous materials. Applied Spectroscopy 2007, 61, 48-54. 152. Koenig, J. L., Microspectroscopic imaging of polymers. 1st ed.; American Chemical Society: 1998; p 411.
153. Bailey, J. A.; Dyer, R. B.; Graff, D. K.; Schoonover, J. R., High spatial resolution for IR imaging using an IR diode laser. Appl. Spectrosc. 2000, 54, (2), 159-163.
154. Van der Weerd, J.; Kazarian, S. G., Validation of macroscopic attenuated total reflection-Fourier transform infrared imaging to study dissolution of swelling pharmaceutical tablets. Applied Spectroscopy 2004, 58, (12), 1413-1419.
155. Fleming, O. S.; Chan, K. L. A.; Kazarian, S. G., High-pressure CO2-enhanced polymer interdiffusion and dissolution studied with in situ ATR-FTIR spectroscopic imaging. Polymer 2006, 47, (13), 4649-4658.
156. Wessel, E.; Heinsohn, G.; Schmidt-Lewer-Kuehne, H.; Wittern, K. P.; Rapp, C.; Siesler, H. W., Observation of a penetration depth gradient in attenuated total reflection Fourier transform infrared spectroscopic imaging applications. Applied Spectroscopy 2006, 60, (12), 1488-1492.
157. Kazarian, S. G.; Chan, K. L. A.; Tay, F. H., ATR-FTIR imaging for pharmaceutical and polymeric materials: from micro to macro approaches. In Infrared and Raman spectroscopic imaging, Salzer, R.; Siesler, H. W., Eds. Wiley VCH: Weinhiem, 2008; 347-376.
158. Flichy, N. M. B.; Kazarian, S. G.; Lawrence, C. J.; Briscoe, B. J., An ATR-IR study of poly(dimethylsoloxane) under high-pressure carbon dioxide: Simultaneous measurement of sorption and swelling. Journal Physical Chemistry B 2002, 106, 754-759.
159. Chan, K. L. A.; Hammond, S. V.; Kazarian, S. G., Applications of attenuated total reflection infrared spectroscopic imaging to pharmaceutical formulations. Analytical Chemistry 2003, 75, (9), 2140-2146.
160. Chouparova, E.; Lanzirotti, A.; Feng, H.; Jones, K. W.; Marinkovic, N.; Whitson, C.; Philp, P., Characterization of petroleum deposits formed in a producing well by synchrotron radiation-based microanalyses. Energy & Fuels 2004, 18, (4), 1199-1212.

REFERENCES
- 213 -
161. Dumas, P.; Jamin, N.; Teillaud, J. L.; Miller, L. M.; Beccard, B., Imaging capabilities of synchrotron infrared microspectroscopy. Faraday Discuss. 2004, 126, 289-302.
162. Chan, K. L. A.; Kazarian, S. G., Detection of trace materials with Fourier transform infrared spectroscopy using a multi-channel detector. Analyst 2006, 131, (1), 126-131.
163. Chan, K. L. A.; Kazarian, S. G.; Mavraki, A.; Williams, D. R., Fourier transform infrared imaging of human hair with a high spatial resolution without the use of a synchrotron. Applied Spectroscopy 2005, 59, (2), 149-155.
164. Kazarian, S. G.; Chan, K. L. A.; Maquet, V.; Boccaccini, A. R., Characterisation of bioactive and resorbable polyactide/bioglass® composites by FTIR spectroscopic imaging. Biomaterials 2004, 25, (18), 3931-3938.
165. Ricci, C.; Bloxham, S.; Kazarian, S. G., ATR-FTIR imaging of albumen photographic prints. Journal of Cultural Heritage 2007, 8, (4), 387-395.
166. Goodall, R. A.; Hall, J.; Sharer, R. J.; Traxler, L.; Rintoul, L.; Fredericks, P. M., Micro-attenuated total reflection spectral Imaging in archaeology: Application to maya paint and plaster wall decorations. Applied Spectroscopy 2008, 62, (1), 10-16.
167. Everall, N. J.; Bibby, A., Improvements in the use of attenuated total reflection Fourier transform infrared dichroism for measuring surface orientation in polymers. Applied Spectroscopy 1997, 51, 1083-1091.
168. Kazarian, S. G.; Brantley, N. H.; Eckert, C. A., Applications of vibrational spectroscopy to characterise poly(ethylene terephthalate) processed with supercritical CO2. Vibrational Specroscopy 1999, 19, 277-283.
169. Kazarian, S. G.; Flichy, N. M. B.; Coombs, D.; Poulter, G., The potential of ATR-IR spectroscopy in applications to supercritical fluids and liquefied gases. American Laboratory 2001, 33, (16), 44-49.
170. Kazarian, S. G.; Martirosyan, G. G., Spectroscopy of polymer/drug formulations processed with supercritical fluids: in situ ATR-IR and Raman study of impregnation of ibuprofen into PVP. International Journal of Pharmaceutics 2002, 232, 81-90.
171. Kazarian, S. G.; Chan, K. L. A., FTIR imaging of polymeric materials under high pressure carbon dioxide. Macromolecules 2004, 37, (2), 579-584.
172. Thomson, G.; Poulter, G. Spectrometer apparatus. US Patent 2006261274, 2006.
173. Chan, K. L. A.; Kazarian, S. G., New opportunities with micro and macro ATR-IR spectroscopic imaging: spatial resolution and sampling versatility. Applied Spectroscopy 2003, 57, 381-389.

REFERENCES
- 214 -
174. Chan, K. L. A.; Elkhider, N.; Kazarian, S. G., Spectroscopic imaging of compacted pharmaceutical tablets. Chemical Engineering Research & Design 2005, 83, (A11), 1303-1310.
175. Van der Weerd, J.; Kazarian, S. G., Multivaraite movies and their applications in pharmaceutical and polymer dissolution studies. In Techniques and applications of hyperspectral image analysis, 1st ed.; Grahn, H.; Geladi, P., Eds. Wiley: London, 2007.
176. Gendrin, C.; Roggo, Y.; Collet, C., Pharmaceutical applications of vibrational chemical imaging and chemometrics: A review. Journal of Pharmaceutical and Biomedical Analysis 2008, 48, (3), 533-553.
177. Elkhider, N.; Chan, K. L. A.; Kazarian, S. G., Effect of moisture and pressure on tablet compaction studied with FTIR spectroscopic imaging. Journal of Pharmaceutical Sciences 2007, 96, (2), 351-360.
178. Van der Weerd, J., Combined approach of FTIR imaging and conventional dissolution tests applied to drug release Journal of Controlled Release. 2004, 98, (2), 295-305.
179. Van der Weerd, J.; Kazarian, S. G., Release of poorly soluble drugs from HPMC tablets studied by FTIR imaging and flow-through dissolution tests Journal of Pharmaceutical Science 2005, 94, (9), 2096-2109.
180. Bhargava, R., Towards a practical Fourier transform infrared chemical imaging protocol for cancer histopathology. Analytical and Bioanalytical Chemistry 2007, 389, (4), 1155-1169.
181. Kohler, A.; Bertrand, D.; Martens, H.; Hannesson, K.; Kirschner, C.; Ofstad, R., Multivariate image analysis of a set of FTIR microspectroscopy images of aged bovine muscle tissue combining image and design information. Analytical and Bioanalytical Chemistry 2007, 389, (4), 1143-1153.
182. Palombo, F.; Cremers, S. G.; Weinberg, P. D.; Kazarian, S. G., Application of Fourier transform infrared spectroscopic imaging to the study of effects of age and dietary l-arginine on aortic lesion composition in cholesterol-fed rabbits. Journal of the Royal Society Interface 2009, 6, (37), 669-680.
183. Flynn, K.; O'Leary, R.; Lennard, C.; Roux, C.; Reedy, B. J., Forensic applications of infrared chemical imaging: Multi-layered paint chips. Journal of Forensic Sciences 2005, 50, (4), 832-841.
184. Ricci, C.; Phiriyavityopas, P.; Curum, N.; Chan, K. L. A.; Jickells, S.; Kazarian, S. G., Chemical imaging of latent fingerprint residues. Applied Spectroscopy 2007, 61, (5), 514-522.
185. Hannisdal, A.; Hemmingsen, P. V.; Sjoblom, J., Group-type analysis of heavy crude oils using vibrational spectroscopy in combination with multivariate analysis. Industrial & Engineering Chemistry Research 2005, 44, (5), 1349-1357.

REFERENCES
- 215 -
186. Costa, S.; Borowiak-Palen, E.; Kruszynska, M.; Bachmatiuk, A.; Kalenczuk, R. J., Characterization of carbon nanotubes by Raman spectroscopy. Materials Science-Poland 2008, 26, (2), 433-441.
187. Sammon, C.; Hajatdoost, S.; Eaton, P.; Mura, C.; Yarwood, J., Materials analysis using confocal Raman microscopy. Macromolecular Symposia 1999, 141, 247-262.
188. Hajatdoost, S.; Yarwood, J., Depth profiling of poly(methyl methacrylate), poly(vinyl alcohol) laminates by confocal Raman microspectroscopy. Applied Spectroscopy 1996, 50, (5), 558-564.
189. Fleming, O. S.; Kazarian, S. G., Confocal Raman microscopy of morphological changes in poly(ethylene therephthalate) film induced by supercritical CO2. Applied Spectroscopy 2004, 58, 390-394.
190. Everall, N. J., Modeling and measuring the effect of refraction on the depth resolution of confocal Raman microscopy. Applied Spectroscopy 2000, 54, (6), 773-782.
191. Everall, N. J., Confocal Raman microscopy: why the depth resolution and spatial accuracy can be much worse than you think. Applied Spectroscopy 2000, 10, (54), 1515-1520.
192. Everall, N., Depth profining with confocal Raman microscopy, part I. Spectroscopy 2004, 19, (10), 22.
193. Everall, N., Depth profiling with confocal Raman microscopy, part II. Spectroscopy 2004, 19, (11), 16.
194. Everall, N.; Lapham, J.; Adar, F.; Whitley, A.; Lee, E.; Mamedov, S., Optimizing depth resolution in confocal Raman microscopy: A comparison of metallurgical, dry corrected, and oil immersion objectives. Applied Spectroscopy 2007, 61, (3), 251-259.
195. Carabatos-Nedelec, C., Raman scattering of glass. In Handbook of Raman spectroscopy, Lewis, I. R.; Edwards, H. G. M., Eds. Marcel Dekker, Inc.: New York, 2001; 423-468.
196. Asher, S. A.; Johnson, C. R., Raman-spectroscopy of a coal liquid shows that fluorescence interference Is minimized with ultraviolet excitation. Science 1984, 225, (4659), 311-313.
197. Ferrari, A. C.; Robertson, J., Interpretation of Raman spectra of disordered and amorphous carbon. Physical Review B 2000, 61, (20), 14095-14107.
198. Pócsik, I.; Hundhausen, M.; Koós, M.; Ley, L., Origin of the D peak in the Raman spectrum of microcrystalline graphite. Journal of Non-Crystalline Solids 1998, 227-230, (Part 2), 1083-1086.
199. Raman, C. V., The diamond. Proceedings of the India Academy of Science, A 1956, 44, 99-110.

REFERENCES
- 216 -
200. Bouhadda, Y.; Fergoug, T.; Sheu, E. Y.; Bendedouch, D.; Krallafa, A.; Bormann, D.; Boubguira, A., Second order Raman spectra of Algerian Hassi-Messaoud asphaltene. Fuel 2008, 87, (15-16), 3481-3482.
201. Dong, S.; Alvarez, P.; Paterson, N.; Dugwell, D. R.; Kandiyoti, R., Study on the Effect of Heat Treatment and Gasification on the Carbon Structure of Coal Chars and Metallurgical Cokes using Fourier Transform Raman Spectroscopy. Energy & Fuels 2009, 23, 1651-1661.
202. Dong, S.; Paterson, N.; Kazarian, S. G.; Dugwell, D. R.; Kandiyoti, R., Characterization of tuyere-level core-drill coke samples from blast furnace operation. Energy & Fuels 2007, 21, (6), 3446-3454.
203. Sekine, Y.; Ishikawa, K.; Kikuchi, E.; Matsukata, M.; Akimoto, A., Reactivity and structural change of coal char during steam gasification. Fuel 2006, 85, (2), 122-126.
204. van der Weerd, J.; Andrew Chan, K. L.; Kazarian, S. G., An innovative design of compaction cell for in situ FT-IR imaging of tablet dissolution. Vibrational Spectroscopy 2004, 35, (1-2), 9-13.
205. Ekgasit, S.; Ishida, H., Optical depth profiling by attenuated total reflection Fourier tramsformed infrared spectroscopy: A new approach. Applied Spectroscopy 1996, 50, (9), 1187-1195.
206. Ekgasit, S.; Ishida, H., New optical depth-profiling technique by use of the multiple-frequency approach with single ATR FT-IR spectrum: Theoretical development. Applied Spectroscopy 1997, 51, (10), 1488-1495.
207. Fina, L. J., Depth profiling of polymer surfaces with FT-IR spectroscopy. Applied Spectroscopy Rev. 1994, 29, (3&4), 309-365.
208. Fina, L. J.; Gangchi, C., Quantitative depth profiling with Fourier transform infrared spectroscopy. Vibrational. Spectroscopy 1991, 1, 353-361.
209. Kirov, K. R.; Assender, H. E., Quantitative ATR-IR analysis of anisotropic polymer films: extraction of optical constants. Macromolecules 2004, 37, 894-904.
210. Kirov, K. R.; Assender, H. E., Quantitative ATR-IR analysis of anisotropic polymer films: surface structure of commercial PET. Macromolecules 2005, 38, 9258-9265.
211. Shick, R. A.; Koenig, J. L.; Ishida, H., Depth profiling og stratified layers using variable-angle ATR. Applied Spectroscopy 1996, 50, (8), 1082-1088.
212. Shick, R. A.; Koenig, J. L.; Isihida, H., Theoretical development for depth profiling of stratified layers using viariable-angle ATR. Applied Spectroscopy 1993, 47, (8), 1237-1244.
213. Van der Weerd, J.; Chan, K. L. A.; Kazarian, S. G., An innovative design of compaction cell for in situ FTIR imaging of tablet dissolution. Vibrational Spectroscopy 2004, 35, 9-13.

REFERENCES
- 217 -
214. Ricci, C.; Eliasson, C.; Macleod, N. A.; Newton, P. N.; Matousek, P.; Kazarian, S. G., Characterization of genuine and fake artesunate anti-malarial tablets using Fourier transform infrared imaging and spatially offset Raman spectroscopy through blister packs. Analytical and Bioanalytical Chemistry 2007, 389, (5), 1525-1532.
215. Buenrostro-Gonzalez, E.; Espinosa-Pena, M.; Andersen, S. I.; Lira-Galeana, C., Characterization of asphaltenes and resins from problematic Mexican crude oils. Petroleum Science and Technology 2001, 19, (3-4), 299-316.
216. Buckley, J. S.; Hirasaki, G. J.; Liu, Y.; Von Drasek, S.; Wang, J. X.; Gil, B. S., Asphaltene precipitation and solvent properties of crude oils. Petroleum Science and Technology 1998, 16, (3-4), 251-285.
217. Wattana, P.; Wojciechowski, D. J.; Bolanos, G.; Fogler, H. S., Study of asphaltene precipitation using refractive index measurement. Petroleum Science and Technology 2003, 21, (3-4), 591-613.
218. Khadim, M. A.; Sarbar, M. A., Role of asphaltene and resin in oil field emulsions. Journal of Petroleum Science and Engineering 1999, 23, (3-4), 213-221.
219. Lin, R.; Patrick Ritz, G., Studying individual macerals using i.r. microspectrometry, and implications on oil versus gas/condensate proneness and "low-rank" generation. Organic Geochemistry 1993, 20, (6), 695-706.
220. Painter, P. C.; Snyder, R. W.; Starsinic, M.; Coleman, M. M.; Kuehn, D. W.; Davis, A., Concerning the application of FT-IR to the study of coal - a critical-assessment of band assignments and the application of spectral-analysis programs. Applied Spectroscopy 1981, 35, (5), 475-485.
221. Sharma, B. K.; Sharma, C. D.; Tyagi, O. S.; Bhagat, S. D.; Erhan, S. Z., Structural characterization of asphaltenes and ethyl acetate insoluble fractions of petroleum vacuum residues. Petroleum Science and Technology 2007, 25, (1-2), 121-139.
222. Jehlicka, J.; Edwards, H. G. M., Raman spectroscopy as a tool for the non-destructive identification of organic minerals in the geological record. Organic Geochemistry 2008, 39, (4), 371-386.
223. Palombo, F.; Shen, H.; Benguigui, L. E. S.; Kazarian, S. G.; Upmacis, R. K., Micro ATR-FTIR spectroscopic imaging of atherosclerosis: an investigation of the contribution of inducible nitric oxide synthase to lesion composition in ApoE-null mice. Analyst 2009, 134, (6), 1107-1118.
224. Rahmani, S.; McCaffrey, W.; Gray, M. R., Kinetics of solvent interactions with asphaltenes during coke formation. Energy & Fuels 2002, 16, (1), 148-154.
225. Fan, Z. M.; Watkinson, A. P., Aging of carbonaceous deposits from heavy hydrocarbon vapors. Industrial & Engineering Chemistry Research 2006, 45, (18), 6104-6110.

REFERENCES
- 218 -
226. Pandey, K. K., A study of chemical structure of soft and hardwood and wood polymers by FTIR spectroscopy. Journal of Applied Polymer Science 1999, 71, (12), 1969-1975.
227. Schenk, H. J.; Witte, E. G.; Littke, R.; Schwochau, K., Structural modifications of vitrinite and alginite concentrates during pyrolitic maturation at different heating rates. A combined infrared, 13C NMR and microscopical study. Organic Geochemistry 1990, 16, (4-6), 943-950.
228. Sun, X. G., The investigation of chemical structure of coal macerals via transmitted-light FT-IR microspectroscopy. Spectrochimica Acta Part a-Molecular and Biomolecular Spectroscopy 2005, 62, (1-3), 557-564.
229. Yao, S. P.; Zhang, J. R.; Jin, K. L., Organism relics or kerogens in oils as oil-source rock correlation indicator. Science in China Series D-Earth Sciences 1997, 40, (3), 253-258.
230. Ye, J. R.; Qing, H. R.; Bend, S. L.; Gu, H. R., Petroleum systems in the offshore Xihu Basin on the continental shelf of the East China Sea. Aapg Bulletin 2007, 91, (8), 1167-1188.
231. Everall, N. J.; Priestnall, I. M.; Clarke, F.; Jayes, L.; Poulter, G.; Coombs, D.; George, M. W., Preliminary investigations into macroscopic attenuated total reflection-Fourier transform Infrared imaging of intact spherical domains: spatial resolution and image distortion. Applied Spectroscopy 2009, 63, (3), 313-320.
232. Rosales, S.; Machín, I.; Sánchez, M.; Rivas, G.; Ruette, F., Theoretical modeling of molecular interactions of iron with asphaltenes from heavy crude oil. Journal of Molecular Catalysis A: Chemical 2006, 246, (1-2), 146-153.
233. Deng, Y.; Dixon, J. B.; White, G. N., Molecular configurations and orientations of hydrazine between structural layers of kaolinite. Journal of Colloid and Interface Science 2003, 257, (2), 208-227.
234. Madejová, J., FTIR techniques in clay mineral studies. Vibrational Spectroscopy 2003, 31, (1), 1-10.
235. Haris, P. I.; Chapman, D., The conformational-analysis of peptides using Fourier-transform IR spectroscopy. Biopolymers 1995, 37, (4), 251-263.
236. Mitrakirtley, S.; Mullins, O. C.; Vanelp, J.; George, S. J.; Chen, J.; Cramer, S. P., Determination of the nitrogen chemical structures in petroleum asphaltenes using XANES spectroscopy. Journal of the American Chemical Society 1993, 115, (1), 252-258.
237. Altgelt, K. H.; Boduszynski, M. M., Compositional analysis of heavy petroleum fractions. Marcel Dekker Inc.: New York, 1994.
238. Jaoui, M.; Achard, C.; Hasnaoui, N.; Rogalski, M., Adsorption isotherms of phenol and 4-chlorophenol on petroleum asphaltenes. Revue De L Institut Francais Du Petrole 1998, 53, (1), 35-40.

REFERENCES
- 219 -
239. Carbognani, L.; Rogel, E., Solvent swelling of petroleum asphaltenes. Energy & Fuels 2002, 16, (6), 1348-1358.
240. Dmitrievskii, A. N.; Pribylov, A. A.; Skibitskaya, N. A.; Zekel, L. A.; Kubyshkin, A. P.; Shpirt, M. Y., Sorption of butane, propane, ethane, methane, and carbon dioxide on asphaltene. Russian Journal of Physical Chemistry 2006, 80, (7), 1099-1104.
241. Pasquali, I.; Andanson, J.-M.; Kazarian, S. G.; Bettini, R., Measurement of CO2 sorption and PEG 1500 swelling by ATR-IR spectroscopy. The Journal of Supercritical Fluids 2008, 45, (3), 384-390.
242. Andanson, J. M.; Jutz, F.; Baiker, A., Supercritical CO2/ionic liquid systems: what can we extract from infrared and Raman spectra? Journal of Physical Chemistry B 2009, 113, (30), 10249-10254.
243. Goodman, A. L., A comparison study of carbon dioxide adsorption on polydimethylsiloxane, silica gel, and Illinois no. 6 coal using in situ infrared Spectroscopy. Energy & Fuels 2009, 23, (2), 1101-1106.
244. Kazarian, S. G., Polymers and supercritical fluids: Opportunities for vibrational spectroscopy. Macromolecular Symposium 2002, 184, 215-228.
245. Wattana, P.; Fogler, H. S.; Yen, A.; Garcia, M. D.; Carbognani, L., Characterization of polarity-based asphaltene subfractions. Energy & Fuels 2005, 19, (1), 101-110.
246. Turgman-Cohen, S.; Smith, M. B.; Fischer, D. A.; Kilpatrick, P. K.; Genzer, J., Asphaltene adsorption onto self-assembled monolayers of mixed aromatic and aliphatic trichlorosilanes. Langmuir 2009, 25, (11), 6260-6269.
247. Price, J. C., Polyethylene glycol. In Handbook of pharmaceutical excipients, third ed.; Kibbe, A. H., Ed. American pharmaceutical association: Washington, DC, 2000; 392-398.
248. Rogel, E.; Carbognani, L., Density estimation of asphaltenes using molecular dynamics simulations. Energy & Fuels 2003, 17, (2), 378-386.
249. Liao, Z.; Graciaa, A.; Geng, A.; Chrostowska, A.; Creux, P. In A new low-interference characterization method for hydrocarbons occluded inside asphaltene structures, 37th National Congress of the Sociedad-Espanola-Cardiologia, Barcelona, SPAIN, 2001, 2006; Pergamon-Elsevier Science Ltd: Barcelona, SPAIN, 2006; 833-838.
250. Mujica, V.; Nieto, P.; Puerta, L.; Acevedo, S., Caging of molecules by asphaltenes. A model for free radical preservation in crude oils. Energy & Fuels 2000, 14, (3), 632-639.
251. Karaca, F.; Morgan, T. J.; George, A.; Bull, I. D.; Herod, A. A.; Milian, M.; Kandiyoti, R., Molecular mass ranges of coal tar pitch fractions by mass spectrometry and size-exclusion chromatography. Rapid Communications in Mass Spectrometry 2009, 23, (13), 2087-2098.

REFERENCES
- 220 -
252. Quirico, E.; Rouzaud, J.-N.; Bonal, L.; Montagnac, G., Maturation grade of coals as revealed by Raman spectroscopy: Progress and problems. Spectrochimica Acta Part A: Molecular and Biomolecular Spectroscopy 2005, 61, (10), 2368-2377.
253. Li, X. J.; Hayashi, J.; Li, C. Z., FT-Raman spectroscopic study of the evolution of char structure during the pyrolysis of a Victorian brown coal. Fuel 2006, 85, (12-13), 1700-1707.
254. Mennella, V.; Monaco, G.; Colangeli, L.; Bussoletti, E., Raman spectra of carbon-based materials excited at 1064 nm. Carbon 1995, 33, (2), 115-121.
255. Sheng, C., Char structure characterised by Raman spectroscopy and its correlations with combustion reactivity. Fuel 2007, 86, (15), 2316-2324.
256. Kawakami, M.; Karato, T.; Takenaka, T., Structure analysis of coke, wood charcoal and bamboo charcoal by Raman spectroscopy and their reaction rate with CO2. Isij International 2005, 45, (7), 1027-1034.
257. Hortal, A. R.; Hurtado, P.; Martinez-Haya, B.; Mullins, O. C., Molecular-weight distributions of coal and petroleum asphaltenes from laser desorption/ionization experiments. Energy & Fuels 2007, 21, (5), 2863-2868.
258. Sabbaghi, S.; Shariaty-Niassar, M.; Ayatollahi, S.; Jahanmiri, A., Characterization of asphaltene structure using atomic force microscopy. Journal of Microscopy-Oxford 2008, 231, (3), 364-373.
259. Bauschlicher, C. W.; Peeters, E.; Allamandola, L. J., The infrared spectra of very large irregular polycyclic aromatic hydrocarbons(PAHs): observational probes of astronomical PAH geometry, size, and charge. Astrophysical Journal 2009, 697, (1), 311-327.
260. Chan, K. L. A.; Kazarian, S. G., High throughput study of PEG/ibuprofen formulations under controlled environment using FTIR imaging Journal of Combinatorial Chemistry 2006, 8, 26-31.