Characterisation and Performance of Pindan Soils Modified ...
133
School of Civil and Mechanical Engineering Characterisation and Performance of Pindan Soils Modified with Polymer Stabilisers Hyun Kyu Park This thesis is presented for the Degree of Master of Philosophy (Civil Engineering) of Curtin University November 2018
Transcript of Characterisation and Performance of Pindan Soils Modified ...
School of Civil and Mechanical Engineering
Characterisation and Performance of Pindan Soils Modified with
Polymer Stabilisers
Hyun Kyu Park
This thesis is presented for the Degree of
Master of Philosophy (Civil Engineering)
of
Curtin University
November 2018

i
Declaration
To the best of my knowledge and belief this thesis contains no material previously
published by any other person except where due acknowledgment has been made.
This thesis contains no material which has been accepted for the award of any other
degree or diploma in any university.
Signature: … ……
Date: …04/07/2018…

ii
Abstract
Moisture susceptibility of materials or substances are important aspects when
pavements are designed, as moisture can weaken the bonds between aggregates, or
between aggregates and binders. Traditional stabilisation using cement or lime have
significant uncertainty factors, such as mix design, curing process and condition, and
a proper amount of water while mixing and compacting. Therefore, non-traditional
stabilisation has been used popularly and has become increasingly available for
engineering purposes due to its low cost and easy application. Studies of the polymer-
Pindan soil stabilisation have been focused on engineering performances, but
literature shows no information on Pindan particles on micro- and nanoscale. Pindan
is a type of red soil, known as a soft and moisture sensitive soil. Little is known about
the fundamental interaction and stabilisation mechanism of pindan soil with polymers,
which govern mechanical properties. This project focuses on the fundamental
information of Pindan soil and the stabilisation to improve its performance using
polymer stabilisers and determines the chemical and physical bonding mechanisms
associated with polymer stabilisers. Plastic index, specific gravity and particle size
distribution were tested to obtain the basic properties. Compaction, collapsibility,
unconfined compressive strength and California bearing ratio tests were performed to
determine the mechanical properties. The waterproof effect of the polymers on the
stabilised Pindan soil was investigated from capillary rise tests. Furthermore,
chemical and microstructural properties were examined using X-ray diffraction (XRD)
and scanning electron microscope (SEM), and linked with the mechanical properties.
The mechanical behaviour and properties of soil grains were investigated using
nanoindentation tests. Hardness, elastic modulus, and packing density were
determined as 10.6 ± 0.9 GPa, 68.1 ± 12.7 GPa and 0.863 ± 0.032, respectively. Based
on microporomechanics, stiffness and cohesion of Pindan soil are 92.7 GPa and 4.1
GPa, respectively. The fracture toughness of Pindan soil based on the energy
transferred and the measurement of radial and later cracks indentation points are 3.1
± 0.8 MPa m1/2 and 3.7 ± 0.5 MPa m1/2, respectively. Based on the results, the
mechanical properties and microstructure changes show a close relationship.
Basically, it is evident that the failure behaviour, strain and strength as well as the
basic properties are affected and changed by the microstructure change.

iii
Acknowledgements
Firstly, my deep gratitude and appreciation go to my supervisor, Dr. Vanissorn
Vimonsatit for her continuous encouragement and support during my Master’s
degree at Curtin University. I also would like to express my appreciation to my co-
supervisor, Dr Peerapong Jitsangiam for providing continuous guidance for
completing this research. I am really thankful to them.
My special thanks of gratitude also go to Dr Hyuk Lee and Dr Korakod Nusit for
their support and advice with this research. This thesis would not be completed
without their help.
I am also greatly thankful to Mr, Mark Whittaker and Mirzet Sehic for their help with
laboratory work at the Department of Civil Engineering. And, I would like to
acknowledge the assistance and help with their technical advice by Paul Bright and
Siva Thillainath.
Lastly, I would like to express my special thanks to my family for their continuous
support and love to complete this Thesis.
Thanks again to all who helped me in completing my degree.
iv
Contents
1 Introduction ......................................................................................................... 1
1.1 Background................................................................................................... 1
1.2 Location of Pindan Sample .......................................................................... 3
1.2.1 Current Condition.................................................................................. 4
1.3 Research Aim and Objective ........................................................................ 4
1.4 Significance .................................................................................................. 5
1.5 Research Method .......................................................................................... 6
1.6 Thesis Organisation ...................................................................................... 7
2 Literature Review ................................................................................................ 8
2.1 Introduction .................................................................................................. 8
2.2 Soil Formation .............................................................................................. 8
2.3 Pindan Soil.................................................................................................... 9
2.3.1 Location of Pindan ................................................................................ 9
2.3.2 Characteristics of Pindan soil .............................................................. 10
2.3.3 Problems of Pindan soil ...................................................................... 14
2.3.4 Stabilisation of Pindan soil.................................................................. 15
2.4 Unsealed Pavement .................................................................................... 18
2.5 Problematic soil .......................................................................................... 21
2.5.1 Identification of Collapse potential ..................................................... 22
2.5.2 Bonding and Collapsing Mechanism .................................................. 27
2.6 Soil Stabilisation ......................................................................................... 29
2.6.1 Non-traditional soil stabiliser .............................................................. 29
2.6.2 Polymer Stabiliser ............................................................................... 32
2.6.3 Polymer stabilised soil for pavement .................................................. 34
2.7 Summary..................................................................................................... 36

v
3 Preliminary Test ................................................................................................ 38
3.1 Introduction ................................................................................................ 38
3.2 Pindan Properties and classification ........................................................... 39
3.2.1 Index Properties and Classification Test ............................................. 39
3.2.2 Mechanical Properties ......................................................................... 42
3.2.2.1 Compaction Test .......................................................................... 43
3.2.2.2 California Bearing Ratio (CBR) Test .......................................... 45
3.2.3 A Representative of Broome-Pindan Soil ........................................... 47
3.2.4 Collapsible Potential and Texture ....................................................... 48
3.3 Summary..................................................................................................... 51
4 Nanoindentation ................................................................................................ 52
4.1 Introduction ................................................................................................ 52
4.2 Evaluating Indentation Properties of Pindan Soil ...................................... 53
4.3 Experimental Result and Discussion .......................................................... 55
4.4 Summary..................................................................................................... 61
5 Stabilisation of Broom-Pindan .......................................................................... 62
5.1 Introduction ................................................................................................ 62
5.2 Material Preparation ................................................................................... 63
5.3 Modified Compaction Test ......................................................................... 67
5.4 Capillary Rise ............................................................................................. 71
5.5 Unconfined Compressive Strength Test ..................................................... 75
5.6 California Bearing Ratio (CBR) ................................................................. 80
5.7 Chemical and Physical Bonding Mechanism ............................................. 83
5.7.1 Chemical and Microstructural Properties ............................................ 84
5.7.2 Interaction of Microstructural Properties and Mechanical properties . 92
5.8 Chapter Summary ....................................................................................... 94
6 Conclusion and Future Research ....................................................................... 96

vi
6.1 Conclusion .................................................................................................. 96
6.2 Recommendation for future research ......................................................... 97
Appendices ................................................................................................................ 99
Appendix A ........................................................................................................... 99
Appendix B ......................................................................................................... 102
Appendix C ......................................................................................................... 106
Appendix D ......................................................................................................... 111
References ............................................................................................................... 113

vii
List of Figures
Figure 2.1: Distribution map of Red Deep Sand in Western Australia (Schoknecht &
Pathan, 2013)............................................................................................................. 10
Figure 2.2: Strength change of Lateritic Gravel Base on Great Eastern Highway in
Western Australia with Time (adopted after (Main Roads, 2003)) .......................... 16
Figure 2.3: Variation of dry density with moisture content of a range of North West
soils contaning 10 percent Portland cement (Western Australia. Department of
Regional Development and the North West, 1984) .................................................. 16
Figure 2.4: Unsealed road pavement layers (adopted after (Austroads, 2009) ......... 19
Figure 2.5: Suggested Particle Size Distribution Range for Unsealed wearing course
(Austroads, 2009) ...................................................................................................... 20
Figure 2.6: Design Chart for granular pavement (80% confidence) (Austroads, 2009)
................................................................................................................................... 21
Figure 2.7: Classification of collapsible soils (Rogers, 1995) .................................. 23
Figure 2.8: Criterion to identify soil collapsibility (adopted after (Holtz, 1961)) .... 24
Figure 2.9: Typical Consolidation Test Result (ASTM International, 2011b) ......... 25
Figure 2.10: Typical Single oedometer collapse potential test result (Pells et al., 1975)
................................................................................................................................... 25
Figure 2.11: Typical Double oedometer collapse potential test result (Lutenegger &
Saber, 1988) .............................................................................................................. 26
Figure 2.12: Collapse pressure definition (Popescu, 1986) ...................................... 27
Figure 2.13: Typical Bonding structure of collapsible soils (Clemence & Finbarr,
1981) ......................................................................................................................... 28
Figure 2.14: Microstructure of collapsible soils and Clay Bridges from SEM (adopted
after (Haeri et al., 2013), (Jackson et al., 2006). (a) Loose and Open structure. (b)
Cementation of clay matrices form. (c) Clay bridge bonds. ..................................... 28
Figure 2.15: Classification of Polymer-based admixtures (Ohama, 1998) ............... 33
Figure 3.1: Chapter3 Overall Flow Chart ................................................................. 39
Figure 3.2: Particle Size Distribution of Broome-Pindan Soil .................................. 41
Figure 3.3: Compaction Test of Broome-Pindan Soil with Air-voids (Av) curve .... 44
Figure 3.4: Load-Penetration Curves of Broome-Pindan Soil .................................. 45
viii
Figure 3.5: Particle Size Distribution Interval for A Representative Broome-Pindan
Soil ............................................................................................................................ 47
Figure 3.6: Void Ratio vs Applied Stress Test on Unsaturated and Saturated Sample
................................................................................................................................... 49
Figure 3.7: Collapse Index vs Stress ......................................................................... 49
Figure 3.8: Sample of Pindan Soil Located in Broome. (A) Pindan Sand. (B) Pindan
Sand in Water for Specific gravity testing. ............................................................... 50
Figure 3.9: Wet and Dry Broome-Pindan Sand. (A) Optimum Moisture Condition. (B)
Wet Sand. (C) Dry-back after full-saturated. (D) Cracks on sand in dry condition. 50
Figure 4.1 Principles of Indentation Testing (Constantinides et al., 2006)............... 53
Figure 4.2: Typical load – displacement curve for indentation. ............................... 55
Figure 4.3: Statistical Indentation Analysis; Top - cumulative distribution functions
(CDF), Bottom – probability density function of elastic modulus (left) and hardness
(right). ........................................................................................................................ 56
Figure 4.4: Statistical Indentation Analysis; Top - cumulative distribution functions
(CDF), Bottom – probability density function of packing density. .......................... 57
Figure 4.5: Geometrical relationship between the extended radial cracks and the
indentation impression with Berkovich tip ............................................................... 58
Figure 4.6: Inverted 3D image (left) and residual impression (right) ....................... 59
Figure 4.7: Fracture energy graph of linear material (Bazant & Pfeiffer, 1987) ...... 60
Figure 5.1: Microscope Images of Polymers. (A) Polymer A, (B) Polymer C, (C) and
(D) Polymer B. .......................................................................................................... 64
Figure 5.2: Polymer C Active Range Zone. (a) Maximum dry density versus Polymer
content, (b) Degree of Activation for Polymer C. ..................................................... 66
Figure 5.3: Comparison of the untreated sample and the treated samples ................ 68
Figure 5.4: Compaction Test using the Modified Proctor Compaction Method. (a)
Pindan soil, (b) Mixture A, (c) Mixture B, and (d) Mixture C. ................................ 70
Figure 5.5: Capillary Rise of Compacted Samples ................................................... 74
Figure 5.6: Typical Unconfined Compressive Strength Curves of the compacted
samples. (a) 1hour cured samples, (b) 16day cured samples. ................................... 76
Figure 5.7: UCS Results for 1 Hour curing............................................................... 79
Figure 5.8: UCS Results for 16 Day curing .............................................................. 79
Figure 5.9: UCS Samples. (a) Untreated Pindan Sample, (b) Mixture A ................. 80
Figure 5.10: Typical UCS. (a) Unsoaked Condition, (b) Soaked Condition. ........... 82
ix
Figure 5.11: Polymer C for QXRD became a thin film of plastic after dried ........... 84
Figure 5.12: G.P and C.L Sand Grain. (A) G.P Sub-rounded Grain, (B) C.L Sub-
rounded Grain, (C) G.P Microstructure, (D) C.L Microstructure, (E) Magnification of
(C) showing the clear form, (F) Magnification of (D) showing the clear form. ....... 85
Figure 5.13: SEM Images of Mixture A after 16day curing. (A) Bonding of Mixture
A, (B) Magnification of (A) showing the bonding structure. ................................... 86
Figure 5.14: XRD phase analysis of Pindan sand and Mixture A ............................ 87
Figure 5.15: EDS Spectra of the mixture A. (A) EDS on bonding, (B) EDS on Sand
Particle. ...................................................................................................................... 87
Figure 5.16: SEM Images of Mixture B and C after 16day curing. (A) Bonding of
Mixture B, (B) Bonding of Mixture C, (C) Magnification of (A) showing the bonding
structure, (D) Magnification of (B) showing the bonding structure, (E) Magnification
of (C) showing microstructures, (F) Magnification of (C) showing microstructures.
................................................................................................................................... 89
Figure 5.17: EDS Spectra of the mixture B. (A) EDS on bonding, (B) EDS on Sand
Particle. ...................................................................................................................... 90
Figure 5.18: EDS Spectra of the mixture C. (A) EDS on bonding, (B) EDS on Sand
Particle. ...................................................................................................................... 91
Figure 5.19: XRD phase analysis of Pindan sand, Mixture B and C. ....................... 91
Figure 5.20: XRD Phase analysis of Polymers ......................................................... 92
Figure 5.21: CBR Test for the Mixtures with 0.5% and 0.7% of Polymer C ........... 93
x
List of Tables
Table 2.1: Properties of Broome Pindan (adopted after (Emery et al., 2003)) ......... 12
Table 2.2: Guide to Collapse Potential Values (adopted after (Pells, Robertson,
Jennings, & Knight, 1975)) ....................................................................................... 12
Table 2.3: General Definition of Site Classifications (adopted after (Standards
Australia, 2011)) ....................................................................................................... 13
Table 2.4: Unconfined Compression Strength for cement Stabilised Pindan Soils .. 17
Table 2.5: Suggested CBR and Permeability Values for pavement material for
unsealed roads (adopted after (Austroads, 2009)) ..................................................... 20
Table 2.6: Location of Problem soils in Western Australia (adopted after (Davenport,
2007)) ........................................................................................................................ 22
Table 2.7: Proposed stabilisation mechanisms for Non-traditional stabilisation
(adopted after (Tingle et al., 2007)) .......................................................................... 32
Table 3.1: Seven Broome-Pindan samples for Index and Classification Test .......... 40
Table 3.2: Specific gravity and Plasticity index of Broome-Pindan ......................... 41
Table 3.3: Percentage of Gravel, Sand and Silt of Broome-Pindan Soil .................. 42
Table 3.4: Classification of Broome-Pindan soil ...................................................... 42
Table 3.5: Six Broome-Pindan Samples for Compaction Test ................................. 43
Table 3.6: Optimum Moisture Contents (OMC) and Maximum Dry Density (MDD)
of Broome-Pindan Soils ............................................................................................ 44
Table 3.7: California Bearing Ratio (CBR) Test Results for Broome-Pindan soil ... 46
Table 4.1: Properties of Pindan soil grain used in Nanoindentation ......................... 54
Table 5.1: Polymer Information ................................................................................ 64
Table 5.2: Optimum Moisture Contents (OMC) and Maximum Dry Density (MDD)
of Broome-Pindan Soil and Mixtures ....................................................................... 71
Table 5.3: Averages of UCS Results for the 1 hour cured samples .......................... 77
Table 5.4: Averages of UCS Results for the 16 day cured samples ......................... 77
Table 5.5: Averages of the CBR values for saturated and unsaturated samples ....... 81
Table 5.6: Quantitative XRD Analysis for Pindan Sand ........................................... 84

xi
List of Symbols
Symbol Description
CL Cape Levique
GP Gantheaume Point Rd
CR Capillary Rise
CBR California Bearing Ratio
EDS Energy Dispersive X-ray Spectroscopy
SEM Scanning Electron Microscope
UCS Unconfined Compression Strength
XRD X-ray Diffraction
QXRD Quantitative X-ray Diffraction
RVE Representative Volume Element
SC Clayey Sand
SM Silty Sand
Gs Specific Gravity
LL Liquid Limit
PL Plastic Limit
PI Plasticity Index
NP Non-Plastic
Rw Moisture Ratio
OMC Optimum Moisture Content
MDD Maximum Dry Density
LDR Laboratory Density Ratio
Av Air-Voids
Cr Recompression Index
Cc Compression Index
σp Pre-Consolidation Stress
Pcs Limiting pressure in Saturated Condition
Pcn Limiting pressure in Natural Condition
Po Overburden Vertical Pressure
Cp Collapse Potential
xii
e Void Ratio
∆e Difference or Change in Void ratio
e° Initial Void ratio of specimens
Ic Collapse Index
H Hardness
E Elastic modulus
Er Reduced Modulus
E’ Elastic modulus of indenter tip,
Ac Contact Area
hc Contact depth
Pmax Maximum Indentation Load
S Slope of the upper portion of the unloading curve
v’ Poisson’s ratio of indenter tip
vs Poisson’s ratio of sample
ξ Total porosity of material
η Packing density of material
ε Empirical calibration constant
c Radial crack length
Wp Plastic energy
We Elastic energy
Wt Total energy
Wother Another energy
Ufracture Fracture dissipated energy
Kc Fracture toughness
Gc Critical energy
Gf Fracture Energy
Uf Deformation
H Initial Height of Sample
H(t) Capillary Rise with time
h Height of Capillary Rise
S Swelling
γLV Surface tension of the liquid
R Pore radius

xiii
ŋ Shear viscosity of the liquid.
Q Quartz
S Corundum
K Kaolinite
C Calcite
di Characteristic length scale in RVE
hi Indentation depth
ai Indentation radius
Di Characteristic microstructural length scale,
Li RVE of Homogeneous mechanical characteristic size

1
Chapter 1
1 Introduction
1.1 Background
Soils are very complex granular materials with different characteristics and behaviour.
Each soil type has different colour, texture, structure and chemical composition. There
are many factors that have a strong influence on soil properties such as climate, time,
organisms, parent material, topographic and other factors (Jenny, 1994). Soil
properties are important for predicting potential behaviour and understanding its
characteristics. About 60% of the Australian road network is unsealed road and
maintenance costs of the roads are approximately one billion dollars per kilometre per
year in the nation. Unsealed roads generally use natural materials and use on-site soils.
This has a significant impact on cost, environmental and social factors. However,
unsealed roads have high accident risks and operating costs associated with dust,
slippery surface, loose surface and surface maintenance (Sharp & Andrews, 2009).
Pindan Sand-clay is a red soil, known as a soft and moisture sensitive soil and is
mainly found in the Kimberley region of Western Australia. Pindan comes from a
local term used in the Kimberley region to describe the soil of the Kimberley area
(Kenneally, Edinger, & Willing, 1996). Pindan material has a red colour, which is due
to high iron in the soil (Main Roads, 2003). Emery et al. (2003) suggested that the
particle bridges also form from Fe-kaolinite which contains both aluminium oxides
and iron. They described Pindan as a red sand which can be classified as clayey sand
(SC) or silty sand (SM). Pindan is a potentially collapsible soil due to high void ratio,
low density and low water content. Since Pindan is a collapsible soil, it can be easily
changed in volume on relatively high moisture contents and is very destructive to the
pavement structure. However, Pindan has self-cementation capabilities in a dry
condition, which can be used as a material for pavement structures (Emery et al.,
2003). Pindan soils gain substantial strength upon drying and lose strength when wet.
This causes pavement structures on Pindan soil uneven. A Pindan report
(Western Australia. Department of Regional Development and the North West, 1984)

2
investigated over 30 selected Pindan soils in Western Australia. The pindan soil
presents high variability in optimum moisture content, dry density and strength.
Further, according to an engineering report by Sinclair Knight Merz (2009), Broom-
Pindan soils that were classified as a silty clayey sand did not show any collapsibility.
The Kimberley region has a wet season (or called tropical summer season) from
November to April and a dry winter season from April to November. The region
receives over 75% of its rainfall during the wet season and the high concentration of
rain over short periods can damage the pavement structure on moisture sensitive soils
(Sinclair Knight Merz, 2009).
Strength is one of the important components of materials that resist deformation from
imposed stresses (Sharp & Andrews, 2009). In order to increase the capacity of road
pavement, it may be necessary to strengthen the pavement materials. The process of
strengthening the pavement materials by means of additives is known as stabilisation,
of which there are many types. Soil stabilisation methods are typically chemically and
mechanically based. Mechanical stabilisation improves the performance of soils
through the application of compaction or loads to improve the strength. Chemical
stabilisation improves strength by adding chemical stabilisers such as cement, fly ash,
lime and polymer (Welling, 2012).
Cement and lime are well documented for a stabilisation of low plasticity soils and
have been used in various projects that have moisture sensitive soils (Smith &
Sullivan, 2014). Both stabilising agents can improve soil performance. However,
chemically stabilised materials using cement or lime have significant uncertainty
factors, such as proper mix design, curing process and condition, and a proper amount
of water while mixing and compacting. These factors could result in poor
performance of the final product of chemically treated materials. For the fundamental
characteristics of Pindan soils which can provide good strength when subjected to
relatively dry conditions (i.e., moisture contents lower than its optimum moisture
content), this could lead to a viable option of how to fundamentally improve Pindan
soils. If Pindan soils can maintain their dry condition by not allowing them to be
wetted, it can provide sufficient strength to use for construction purposes. With
advancement in soil stabilising technology nowadays, a preferred drying condition of
soils can be maintained by using some polymers as a stabilising agent that can
3
generate, so-called, hydrophobic (water-repellence) properties. The Pindan soils
problem could be fundamentally solved using polymer stabilising binders as internal
waterproofing. So, the dry strength can be retained through any wet condition (Lacey,
2004).
Based on recent studies, a polymer for soil stabilisation has a high resistance to water
and good physical properties. Strength improvement and physical bonding depend on
the ability of the polymer because the aggregate is coated with a film of the polymer
and it provides bonding (Welling, 2012). With the advancement of polymer
technology in which waterproofing properties can be created, such problems with
Pindan soil could be fundamentally resolved by using polymer stabilising binders as
an internal waterproofing (Lacey, 2004). Most of the polymer-Pindan soil
stabilisation studies have been focused on engineering performances of the stabilised
soil. Therefore, there is limited information on Pindan properties for road pavement,
but it has been used as road material in Western Australia. Information about Pindan
particles is also not available on micro- and nanoscale, and little is known about the
fundamental interaction and stabilisation mechanism with polymers, which govern
mechanical properties.
1.2 Location of Pindan Sample
Seven samples of Pindan soil collected locally from two sites in Broom, Kimberly
region, Western Australia, were used in this research. The samples were collected
from the wearing course of unsealed roads, and raw materials were taken from the
bush next roads.
Seven Samples from two locations are:
A) Gantheaume Point Rd
• Raw material
• shoulder and surface material
B) Cape Levique
• Raw Material
• surface material (site1)
• shoulder and surface material (site2)
4
1.2.1 Current Condition
Two unsealed roads that carry reasonable amounts of traffic give the Shire of Broome
problems – Gantheaume Point Road and Cape Levique Road. Both roads are closed
to all traffic when there is any sign of imminent rain. Currently, both roads look like
drains as the only solution to reinstating the road after heavy rain is to cut the wet
material off the surface to expose the dry material below to form a new surface.
Broome has very little rocky material close to town. It has been accessed to a fine
crushed rock that is brought to town from a remote quarry. It is used primarily as the
top 100 mm of base-course for heavy traffic roads and Main Roads use this material
for the main roads into Broome, but it is very expensive to construct roads using these
materials.
It is significant to find a treatment that allows the material that has been cut off the
surface to be recombined with the sandy residue material to form a base course. If
this material remains unsealed, there should be a requirement that any damage could
be repaired by reworking and re-compaction.
1.3 Research Aim and Objective
This study examines the properties of Pindan soils to determine nanostructure,
microstructure, chemical and mechanical properties and evaluates polymer stabilised
Pindan soils to determine the performance of polymer-based products, and the
chemical and microstructural reactions between Pindan and Polymer. This project
also aims to explore an opportunity in stabilising Pindan soils with potential polymers
in order to fundamentally prevent a wetting condition by creating a hydrophobic
property through Pindan soils-polymer mixtures.
The main objectives of this study are;
• To obtain the physical-mechanical, chemical, nanostructural and
microstructural properties of Broome-Pindan soils
• To evaluate the potential of stabilising Pindan soils using polymers based on
the pavement and geotechnical engineering’s perspectives.
• To obtain the chemical and physical bonding mechanisms between Pindan
particles associated with polymer stabilisers.
5
The specific objective of this project is to investigate on:
✓ Characterisation of Broome-Pindan soils.
✓ Production of Pindan soils mixed with polymers.
✓ Bonding mechanisms of polymer-Pindan soil
✓ Effects of polymer-Pindan soil mixtures on the performance of Pindan soil
✓ Effect of different curing times on the compressive and bearing properties of
Polymer modified Pindan soil.
This project mainly focuses on the fundamental information of Pindan soil and the
stabilisation to improve the performance of the Pindan soil using polymer stabilisers
and provides the chemical and physical bonding mechanisms associated with polymer
stabilisers.
The laboratory works are performed to investigate properties of Pindan soils and
effects of polymer types with different polymer contents on the polymer-modified
Pindan soil properties and performance. This project provides all properties of Pindan
soils and a guideline of using polymer in improving Pindan soils to be useable
materials for construction purposes, based on testing undertaken using particular
Pindan soils in Western Australia with altering polymer contents.
1.4 Significance
Pindan sand-clay deposits are common throughout the Kimberley region of WA.
Emery et al. (2003) and Kenneally et al. (1996) described the Pindan soils as a red
moisture sensitive soil and have shown problems when using as compacted fills for
roads and embankments with causes of wetting induced losing bonding strength. The
pavement constructed on problematic soils which bring deformation can cause a
significant failure to structures. Therefore, of key significance in the project is the
generation of a new guideline for use of Pindan soils-polymer stabilised materials for
Australian pavements, based on extensive laboratory and a full consideration of
realistic pavement conditions, and mainly advance the information of Pindan soils.
The main points of significance are as follows:
• Contribute to the evaluation of the fundamental properties of Pindan soils.
• Enhance the polymeric stabilising additive on Strength of Pindan soils.

6
• Understanding the bonding mechanism between soil and various polymers
• Finding the relationship between bonding mechanism and mechanical
properties.
1.5 Research Method
As this project aims to provide useful information in facilitating the establishment of
a reliable design procedure for Pindan soils modified with polymers from a series of
tests which are undertaken. The following outlines the research methodology of this
project. The laboratory experiment consists of producing a number of Pindan soils-
polymer mixture batches with varying polymer contents.
The method for this assessment will be to:
• Prepare test specimens of Pindan soils, using materials commonly found in
Broome, the Kimberley region of Western Australia,
• Investigate the basic properties such as index and classification, and
collapsibility of Broome-Pindan soils,
• Investigate the nanostructures, chemical and microstructural properties of
Pindan soils by Nanoindentation, XRD and SEM respectively,
• Vary polymer contents in Pindan soils and polymer mixtures, to obtain a clear
range of comparative data,
• Determine the suitability of Polymers for the stabilisation of Pindan soil;
Maximum dry density, plasticity index (PI) and moisture content,
• Assess the waterproof effect of the polymers on the stabilised Pindan soil
through the capillary rise test of compacted materials,
• Obtain the compressive and bearing strength of Pindan soils and polymer
modified Pindan soils with respect to polymer contents and curing times
through unconfined compression strength tests (UCS), and California bearing
tests (CBR).
In the experimental work, maximum dry density, plasticity index and optimum
moisture content were undertaken to check the suitability of the polymers for the
stabilisation of Pindan soils. Capillary rise of compacted materials was also performed
for sampling and testing the stabilised Pindan soils to assess the waterproofing effect
7
of the polymers in accordance with testing guideline specified in Australian standard
AS1141.53 (1996a). Double oedometer test was performed to identify the potential
collapsibility of Broome-Pindan. A series of performance tests; unconfined
compression strength tests (UCS), and California bearing tests (CBR) were performed
to evaluate and compare material properties and characteristics with respect to
polymer contents and curing times. Test samples for UCS and CBR tests were
compacted in accordance with sample preparation guidelines specified in AS 5101.4
(2008) and AS 1289.6.1.1 (2014), respectively. Chemical, Microstructure,
nanostructure properties of Pindan soils were also obtained by, XRD, SEM and
Nanoindentation respectively.
1.6 Thesis Organisation
The thesis content is presented in the following chapters;
Chapter 2. Literature Review
Chapter 3 Representative of Broom-Pindan soil
Chapter 4 Nanoindentation of Broom-Pindan
Chapter 5 Chemical and Microstructural properties of Broom-Pindan and Composite
Chapter 6 Stabilisation of Broom-Pindan
Chapter 7 Conclusion and Recommendation
Chapter 2 reviews the literature on the background of Pindan soil, unsealed pavement,
problematic soil and identification of moisture sensitivity for engineering. Chapter 3
provides physical properties of Pindan soils, collapsibility and creating a sample to
represent Broome-Pindan soils for the experiments. Chapters 4 and 5, present an
application of nanotechnology and micro-technology to Broome-Pindan soil,
respectively, for determining Nano-structure, microstructure and chemical structure
of Broome-Pindan soil. Chapter 6 provides polymer information and a series of
performance test results through stabilisation. This chapter also provides links to
stabilisation and curing time, and also provides guidelines to design using Pindan
soil. Conclusion and recommendation are provided in Chapter 7.
8
Chapter 2
2 Literature Review
2.1 Introduction
This chapter provides a review of literature related to Pindan soil and soil stabilisation
with polymers in detail. General topics including unsealed pavement, soil formation,
polymer structures and polymer stabilisation for pavement are also discussed as a
fundamental knowledge of this research. A considerable amount of review on the
various studies has been undertaken on the soil and polymer stabilisation and
properties.
2.2 Soil Formation
There are many different types of soils in the world with different colour, texture,
structure, and chemical composition, each with different characteristics and
behaviours. According to Jenny (1994), the soil classification system has two main
principles: soil characteristics such as colour and texture, and soil formation factors
such as parent material, climate, terrain, time, and organisms.
In the late 1800s, five factors of soil formation were introduced by Dokuchaev as
parent material, climate, topographic, time, and organisms, and the first soil
classification was invented and developed based on these five factors. Soil formations
can also be determined and explained by the five factors (Graham & Indorante, 2017),
(Jenny, 1994). Jenny (1994) referred to these five factors as “p, cl, r, t, o”, respectively,
to show a quantitative correlation between soil properties and soil formation factors
in a mathematical language using mathematical equations in 1941. These
mathematical expressions explained the relationship between soil properties and soil
formation factors and also provided a mathematical relationship between soil
parameters.
The composition of the parent material has the most important effect in the early stage
of soil formation. The geochemical foundation of the soil depends on the chemical
composition and physical properties of parent materials, but over time, the influence
9
is diminishing. The climate over a long time has a strong influence on soil formation.
The effects of weather conditions such as water and temperature have a strong
influence on soil properties. The effect of topography on soil formation also has a
strong influence as it is related to the movements of water. The water velocity and
movement across the surface depend on the land slope that affects erosion, deposition,
accumulation and leaching. The microclimate is also affected by the slope as the
difference of sun angle in relation to the heating of the sun against the soils.
Organisms, vegetation, animals and microbes also play an important role in soil
formation. For example, these organisms can react chemically or directly affect soil
physical properties because dead vegetation produces soil acids and plant roots impact
on soil aggregation. Soil formation requires time to be processed and affected by these
factors. All of these factors occur and behave over time, and more development
happens over a longer period of time. For example, the influence of time changes soil
formation as the climate changes over time. The soil is produced, altered or leached
over time, and the soil formation is determined by the period (Graham & Indorante,
2017), (Singh & Huat, 2004).
2.3 Pindan Soil
Pindan is a name from a local term used in Kimberley region to describe a particular
type of soil in Kimberley. The Aboriginal term of “Pindan” refers to a red soil in the
Pilbara region in Western Australia. This term is also used to describe vegetation of
the Kimberley region and the characteristic red colour of the soil. The local name of
the large pindan soil area is also called “Pindan” or “Pindan country” (Kenneally et
al., 1996), (Smolinski, Galloway, & Laycock, 2016).
2.3.1 Location of Pindan
The Kimberley region has two distinct seasons; wet and dry seasons. The typical wet
season has high rainfall, high humidity and high temperature while the typical dry
season has low rainfall and warm temperature (Smolinski et al., 2016). Papadakis
(1975) and Lowe (2003) described the climate of the Kimberley region as semi-arid
tropical with hot and wet summers and dry winters. The high concentration of rainfall
occurs in a short period during the rainy season and high evaporation rate occurs in
November. The region receives more than 75% of its rainfall during the wet season,
but mostly from Jan to Feb. During this period, heavy rainfall and tropical cyclones

10
from the Indian Ocean can produce extensive flooding (J. N. Jennings, 1975) (Sinclair
Knight Merz, 2009). The land is also affected by the wind of the cyclones. The power
of the cyclone’s wind can cause major damage to the land (Kenneally et al., 1996).
Smolinski et al. (2016) and Kenneally et al. (1996) explained the development of sand
dunes of the Kimberley region. The Kimberley surface is partly covered by the sand
dunes of the Upper Pleistocene developed during periods of low sea level and dry
climates (Smolinski et al., 2016). Kenneally et al. (1996) suggested that Pindan was
developed from a desert dune sandstone during Quaternary period, immature soil
developed in the Pleistocene dunes. The distribution of red deep sand in Western
Australia is shown in Figure 2.1.
Figure 2.1: Distribution map of Red Deep Sand in Western Australia (Schoknecht &
Pathan, 2013)
2.3.2 Characteristics of Pindan soil
Correctly identifying material properties, problems and their causes are significantly
important for road design. The colour of the soil is one of the important soil properties
11
that can be used to identify the soil to determinate its characteristics (Rossel, Minasny,
Roudier, & McBratney, 2006). Soil colour is produced during the weathering process
and is related to temperature and precipitation. Mostly the composition of the soil and
the influence of temperature and precipitation decide the colour of the soil (Balsam,
Ji, & Chen, 2004).
In 1883, Edward Townley Hardman first mentioned “Pindan” in print and describe
the soil as “Pindan ironstone” with a poor hematite but in large quantity (Smolinski
et al., 2016). The colour of soil is influenced by even a small amount of Haematite
(Emery et al., 2003). A geologist, Woodward (1891) stated that “Pindan sands and
gravels are often cemented by oxide of iron” in the geological formation of Pliocene.
Pindan is known as a red sand which is due to the quartz sand particles are coated
with high iron and aluminium hydroxide (Main Roads, 2003), and Smith and Sullivan
(Smith & Sullivan, 2014) proposed that the bridges between soil particles also form
from Fe-kaolinite which contains both iron (Haematite:Fe2O3) and aluminium oxides
(Al(OH)3). When leaching happens during weathering in tropical regions, it results in
the soil highly enriched in iron and aluminium oxides, which makes the soil a deep
red colour (Huat, Gue, & Ali, 2007).
Kenneally et al. (1996) mentioned that Pindan becomes soft and greasy when the
moisture content increases. Airey et al. (2012) explained the process of the chemical
weathering in tropical climates. Due to weathering in tropical, silica is leached from
the soil and leaving only its most of the iron content, which makes the soil highly
concentrated in iron and aluminium oxides. This laterisation process creates the
formation of iron nodules and cemented aggregates and it can lead to soft and high
porous soils. Heelas (2001) also explained this process in the tropical area as using a
term “Ferrallitisation”. Clay particles in soil are broken down into silica and
sesquioxides and the silica is moved downwards under the hot weather while the
sesquioxides remain in the soil, which makes the form of iron oxides and the soil
becomes soft.
Emery et al. (2003) described the properties of Pindan as a high void ratio and low
density in an undisturbed condition, which could easily collapse. They classified
pindan as either clayey sand (SC) or silty sand (SM) according to Standard Australia
AS 1726 -1993. The physical and chemical properties of Pindan from Broome were

12
tested in two distinct types of pindan material; Silty Sand (SM) and Clayey sand (SC)
with an amorphous clay content of 9% and 18% respectively. The general information
on the classification testing results of Broome-Pindan is summarised in Table 2.1.
Double oedometer test of Pindan-Clayey sand (SC) for loading condition from 0 kPa
to 100 kPa showed 9% of the collapse potential, which indicated a “trouble” collapse
potential according to Guide to Collapse Potential Values as shown in Table 2.2. The
Pindan-Silty sand (SM) was not able to be performed due to the characteristic of very
friable in an undisturbed condition. The shear strength increased with increasing in
suction, which means the strength gain of Pindan is also influenced by not only the
bridges between soils, but also by changes in the voids geometry. It has been proven
that the suction of SC-Pindan is higher than SM-Pindan due to its higher clay content
(Emery et al., 2003).
Table 2.1: Properties of Broome Pindan (adopted after (Emery et al., 2003))
Property SM Silty sand SC Clayey sand
Liquid Limit (Cup) NP 18-23
Plasticity Index NP 4-11
Insitu Density (t/m3) 1.39-1.46 1.57-1.59
Maximum dry density
(MDD; modified t/m3)
1.88-2.04 2.08-2.10
Optimum Moisture
Content (OMC)
8.0-8.5 8.0-9.5
Table 2.2: Guide to Collapse Potential Values (adopted after (Pells, Robertson,
Jennings, & Knight, 1975))
Collapse Potential (%) Severity of Collapse Problem
0 – 1 No problem
1 – 5 Moderate trouble
5 – 10 Trouble
10 – 20 Severe trouble
>20 Very severe trouble

13
According to an engineering report by Sinclair Knight Merz (2009), they investigated
typical Pindan soil at Broome and classified it as a silty clayey sand with low plasticity
and has a fine content between 16% to 26% by mass. The sites at Broome were
classified as Class “S” in Australia Standard AS2870 (1996b). This Class “S” is
defined in accordance with Australia standard AS2870 (2011) as, “the soil includes
silts and some clays and expects only slight ground movements from moisture
changes”. It is also said that “sites classified class S may be treated as non-reactive
sites”. The classification regarding the potential amount of the movement is shown in
Table 2.3, which indicates that soil reacts to the increasing moisture content. From
the experiments in this report, the properties of Pindan varied from 4.5 to 13.9 and
from 4 to 30, respectively, for plastic index and CBR values. Class P is for
problematic soils, such as soft clay or silt or loose sands, landslip, mine subsidence,
collapsing soils and soils subject to erosion, reactive sites subject to abnormal
moisture conditions.
Table 2.3: General Definition of Site Classifications (adopted after (Standards
Australia, 2011))
Site Classification Reaction class Characteristic of Movement
from Moisture Change
Class A stable (non-reactive)
No movement
(0 mm)
Class S slightly reactive
May experience only slight
movement
(0 – 20 mm)
Class M moderately reactive
May experience Moderate
movement
(20 – 40 mm)
Class H1 highly reactive
High ground movement
(40 – 60 mm)
Class H2 highly reactive
High ground movement
(60 – 75 mm)
Class E extremely reactive
Extreme ground movement
(>75mm)
Class P problematic soil Problem Site

14
The Pindan has been successfully used as a pavement material in Western Australia,
although limited information exists with pindan properties for road pavement.
Collapsible soils have been stabilised by compacting the soil with high energy. When
Pindan gets wet, it behaves like wet loose sand and has a low strength. However, the
strength increases with high cohesion when the pindan is “dried back” after
compaction. Pindan has self-cementation ability due to the bridging effect of clay
under dry moisture conditions, which can be used as the material of the pavement
layers, but it is a challenge to select the suitable Pindan for a pavement material due
to its variability and difficulties in quality control. It is difficult to detect the suitability
from visual inspection and simple laboratory tests to use Pindan for a pavement
material (Emery et al., 2003).
2.3.3 Problems of Pindan soil
Tropical cyclones with heavy rainfall over short periods during wet seasons can
damage the pavement structure and even the sealed roads are often flooded in the
Kimberley region (Sinclair Knight Merz, 2009). It is widely recognised that the
impact of water damage on pavement needs to be considered when designing roads
to minimise moisture damage to pavement structures. It affects service life and
contributes to durability problems. However, It is almost impossible to prevent water
coming into the pavement structure as water can enter from many different sources,
such as groundwater, snow and rain. Up to 40% of the rainfall gets into the pavement
structure (ARA Inc, 2004). The effect on the pavement may show in various ways
such as collapsing or expanding which can damage the pavement structure due to
shrink-swell behaviour. Failure issues due to volume changes under pavement can be
identified using material properties. Moisture also affects the bonding mechanism
between the soil particles and between the pavement layers and makes the binding
soft and weak (Gaaver, 2012). Kenneally et al. (1996) described the problem of
Pindan as they become soft and greasy after water immersion and erode rapidly.
Emery et al. (2003) also described Pindan as a red collapsible soil that can be densified
under high enough load at a high moisture condition due to its high void ratio and low
density, while unsaturated soils can be used in the pavement layer without a
significant change in volume.

15
Thousands of problematic soils are across the world, which can be collapsing soils,
expansive soils, loose sands, soft soils or soils subject to erosion. Pindan has two
characteristics of softening and/or collapsibility under saturated conditions. Pindan is
a moisture sensitive soil which earns its title by collapsing and losing strength when
subjected to moisture ingress and it is very destructive to the pavement structure as
collapsible soils can be easily changed in volume on moisture content, resulting in
deformations that can cause uneven and even failure of the pavement structure on this
soil (Emery et al., 2003), (Gaaver, 2012), (Kenneally et al., 1996).
The Kimberley region is a very large land and has a huge road network with a small
population. Therefore, it is necessary to consider the cost savings by using local
natural materials for roads. However, little research has been done on Pindan
properties and problems of Pindan material. The Pindan material has been generally
used for roads with low to medium traffic and it has also been successfully used on
roads where many heavy vehicles travel in Western Australia (WA). However, the
Pindan material used for the heavily trafficked roads must be constructed with
correctly applied principles (Cocks et al., 2015).
2.3.4 Stabilisation of Pindan soil
Some of the gravels used as base-course materials in Western Australia are capable
of self-stabilisation. As can be seen in Figure 2.2, the potential of increasing the
strength of the lateritic gravel was proven in the 1989 data. Hamory and Ladner (1976)
conducted Clegg impact tests to measure the potential strength gain over time using
lateritic gravels on the Great Eastern Highway in Western Australia. Similarly,
Kilvington and Hamory (1986) obtained the potential strength gain over time from
calcrete and lateritic gravel base courses in the Kimberley region. The self-bonding
over time was also presented in the red clayey sand (also known as Pindan) used as
the base course on the Hamelin Denham Road in Western Australia (Main Roads,
2003).
A Pindan report (Western Australia. Department of Regional Development and the
North West, 1984) provided information on Pindan soils proposed for use in making
bricks by stabilising Pindan soil with cement. The strength tests were carried out on
more than 30 selected Pindan soils of the North West Australia. They provided the
properties of Pindan soils from Broome, Derby, Fitzroy Crossing, Pandanus Park,

16
Figure 2.2: Strength change of Lateritic Gravel Base on Great Eastern Highway in
Western Australia with Time (adopted after (Main Roads, 2003))
Wyndham, Carnarvon, Kununurra, Karratha and Port Hedland area. The samples
from Broome, Derby, Fitzroy Crossing and Pandanus Park are basically similar in the
mineralogical compositions from the basic properties of Pindan soils. The results of
stabilised soils with a cement are as shown in Figure 2.3, the moisture-density graph
showed very different results even in samples from the same area. Sample number 1
from the Derby area and the sample number 6 from the Fitzroy Crossing area show
very different results in relation to moisture content and dry density of stabilised soil.
The graph indicated that the dry density of Sample number 6 seems to be not affected
by the moisture content while Sample number 1 had such a big effect on the moisture
content. Even Samples 1 and 2 from the Derby area (but different locations in the
Derby area) also show different relationships. The difference between the optimum
moisture content and the maximum dry density between the Pindan samples is very
large.
Figure 2.3: Variation of dry density with moisture content of a range of North West
soils contaning 10 percent Portland cement (Western Australia. Department of
Regional Development and the North West, 1984)

17
Not only the relationship between the dry density and moisture content of stabilised
Pindan soils was different and also the results of Unconfined Compression Strength
(UCS) test show a big difference in strength even between samples from the same
area as shown in Table 2.4. This table clearly illustrates the high variability of the
Pindan soils in strength.
Table 2.4: Unconfined Compression Strength for cement Stabilised Pindan Soils
(adopted after ((Western Australia. Department of Regional Development and the
North West, 1984))
Average Unconfined Compression Strength (MPa)
Dry Curing Period
Soil
Identification
No
curing
14days 11weeks 24 weeks 50 weeks
Broome
A 15.1 27.7 28.6 25.4 25.5
B 14.5 24.8 26.5 23.4 27.8
C 17.7 29.3 31.4 27.5 33.0
Derby
A 28.8 34.6 40.6 33.9 40.4
B 11.0 18.5 20.2 15.8 21.8
C 12.1 23.1 22.8 18.3 2.2
D 18.1 29.0 29. 26.5 31.3
E 16.8 29.6 31.2 27.5 28.8
Fitzroy
Crossing
A 14.9 30.7 30.6 26.5 30.4
B 14.8 21.6 24.0 23.7 24.4
C 2.2 3.9 4.1 3.9 4.1
D 14.6 15.1 16.4 15.9 16.9
Wyndham
A 7.0 9.3 9.6 7.2 5.7
B 4.9 5.0 4.1 3.1 3.3
C 5.2 10.2 9.5 7.3 9.3
Kununurra
A 12.4 24.9 23.6 21.9 26.1
B 8.5 9.9 11.9 8.2 9.1
Pandanus Park
A 18.4 32.0 30.6 27.2 32.8

18
Smith and Sullivan (2014) provided information on Pindan soils proposed for use on
embankments structures in Pilbara, North Western Australia. Using highly erodible
soils for the embankments structures, is a challenge and required to be controlled by
appropriate embankment design and construction processes. They described Pindan
soils as a material highly susceptible to erosion, therefore, they focused on erosion
controls. Low-plasticity soils such as Pindan has been well studied and documented
with stabilisation binders such as cement and lime. Emery et al. (2003) investigated
on Pindan soils for the Broome Airport. In this study, cement, lime and bitumen
emulsion stabilisers were compared. The cement and lime stabilised samples with low
percentages of stabilisers provided satisfactory results but lost strength due to
carbonation.
2.4 Unsealed Pavement
Approximately 60% of the Australian road network is unsealed roads. The role of the
unsealed road network in Australia is very important for rural or local communities,
mining and timber industries. It is also used as a transportation route for products and
supplies. Therefore, improving the performance of unsealed road is an important issue
in Australia. Stabilisation of unsealed road would result in safety, economic
maintenance and ride quality (R. Andrews & Duffy, 2008). Unsealed roads typically
carry light vehicles and about 10% are heavy vehicles, except for mine haul roads.
Low volume rural roads are often built using locally available materials due to
economic considerations, and the maintenance of roads can be done easily and
quickly into service after damage (i.e. flooding) (Cocks et al., 2015), (Ferry, 1998).
Therefore, locally available materials suitable for pavements are a valuable resource
in Western Australia. A good understanding of fundamental pavement materials is
important for the construction of unsealed pavement and they need to tested and well
managed to make good quality pavements in rural areas (Cocks et al., 2015).
There are four pavement layers in unsealed road structures as shown in Figure 2.4.
Wearing course needs to be maintained when its thickness is reduced due to losing its
fine materials as dust. Generally, in situ soils are used for the subgrade layer, and base
layer protects against subgrade deformation (Austroads, 2009). Failures of the
pavement can be due to the weakness in road pavement structures; surface, base,
subbase or subgrade. Especially, unsealed pavements are susceptible to water and

19
Figure 2.4: Unsealed road pavement layers (adopted after (Austroads, 2009)
erosion, so the materials for unsealed pavement are important and their properties
must be examined to avoid potential problems (Cocks et al., 2015).Sediments
produced from unsealed roads are caused by so many factors such as rainfall, wind,
characteristics of surface materials, traffic volume and road slope. (Fu, Newham, &
Ramos-Scharron, 2010). All materials on unsealed roads, which are susceptible to
erosion must be protected through stabilisation. Soil erosion on pavement surfaces,
resulting from water, is an issue in the unsealed pavement (Kemp, 2004). Half the
wear loss from unsealed roads is due to climate-related without any traffic and up to
60% of sediments from unsealed roads is fine particles (e.g. clay and silt).
Maintenance is, therefore, often required due to climatic erosion and vehicle attrition
on unsealed pavements (Ferry, 1998), (Kemp, 2004). Some of the local materials for
roads are required high serviceability even with low traffic. The principal factors such
as stability, resistance to wear, impermeability and workability are considered as
affecting the performance quality in relation to unsealed roads. These factors are also
related to safety issues such as dust, poor resistance, tyre wear and vehicle damages
with flying stones (Austroads, 2009).
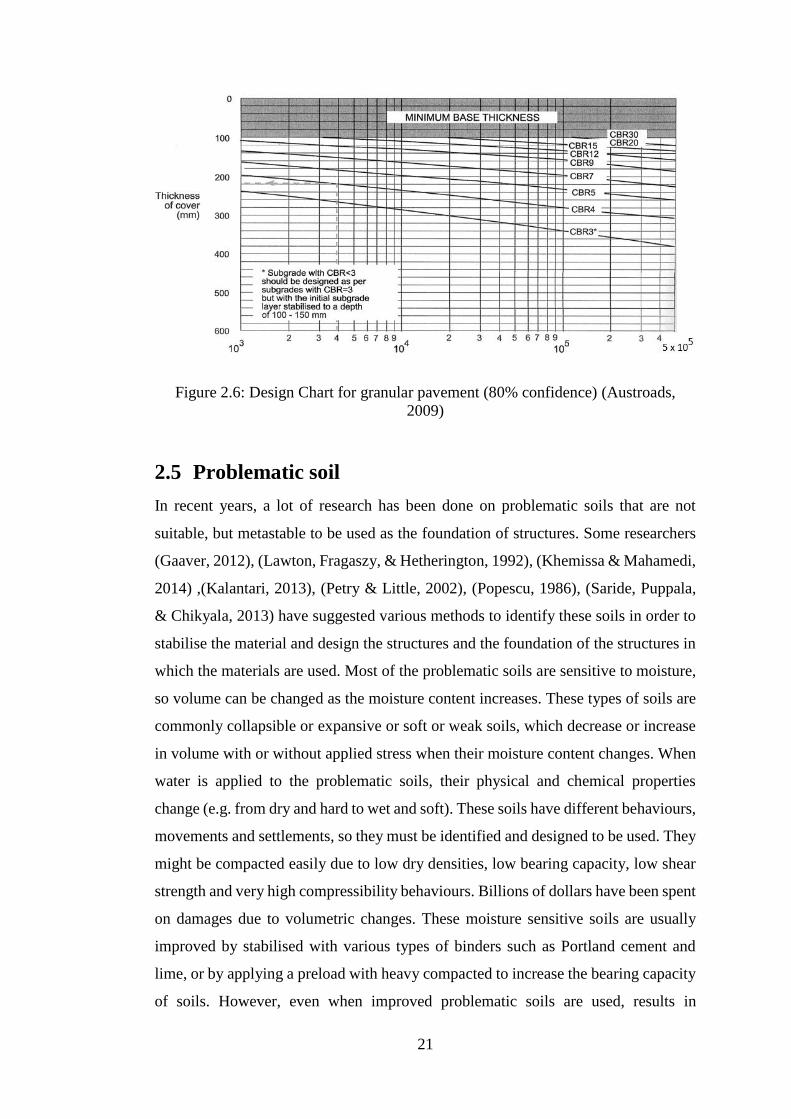
Guide to Pavement Technology Part 6: Unsealed Pavements by Austroads (2009)
provides a considerable volume of information on unsealed pavement with relevant
technical information to guide the principles of unsealed road designs. As a guide,
Table 2.5 suggests the minimum CBR values and the maximum permeability values

20
associated with the selected materials for unsealed roads. The recommended particle
size distribution range for unsealed wearing course is shown in Figure 2.5 below. The
design chart for granular pavements presented in Figure 2.6 represents a minimum
structural thickness regarding the subgrade to protect from deformation during its life.
The thickness of the subgrade is governed by CBR values and the minimum thickness
of the base is 100mm. These information addresses unsealed pavement road materials
and designs.
Table 2.5: Suggested CBR and Permeability Values for pavement material for
unsealed roads (adopted after (Austroads, 2009))
Pavement layer Minimum Typical
CBR Value
(Soaked)
Suggested Maximum
Permeability (m/s)
Wearing Course 40% 1 x 10⁻⁴
Base 50% 1 x 10⁻³
Subbase 30%
Figure 2.5: Suggested Particle Size Distribution Range for Unsealed wearing course
(Austroads, 2009)
21
Figure 2.6: Design Chart for granular pavement (80% confidence) (Austroads,
2009)
2.5 Problematic soil
In recent years, a lot of research has been done on problematic soils that are not
suitable, but metastable to be used as the foundation of structures. Some researchers
(Gaaver, 2012), (Lawton, Fragaszy, & Hetherington, 1992), (Khemissa & Mahamedi,
2014) ,(Kalantari, 2013), (Petry & Little, 2002), (Popescu, 1986), (Saride, Puppala,
& Chikyala, 2013) have suggested various methods to identify these soils in order to
stabilise the material and design the structures and the foundation of the structures in
which the materials are used. Most of the problematic soils are sensitive to moisture,
so volume can be changed as the moisture content increases. These types of soils are
commonly collapsible or expansive or soft or weak soils, which decrease or increase
in volume with or without applied stress when their moisture content changes. When
water is applied to the problematic soils, their physical and chemical properties
change (e.g. from dry and hard to wet and soft). These soils have different behaviours,
movements and settlements, so they must be identified and designed to be used. They
might be compacted easily due to low dry densities, low bearing capacity, low shear
strength and very high compressibility behaviours. Billions of dollars have been spent
on damages due to volumetric changes. These moisture sensitive soils are usually
improved by stabilised with various types of binders such as Portland cement and
lime, or by applying a preload with heavy compacted to increase the bearing capacity
of soils. However, even when improved problematic soils are used, results in

22
volumetric change due to lack of information on the soils and sometimes the
improvement of these soils are not properly achieved or disappears quickly over time.
Davenport (2007) investigated problematic soils throughout Western Australia (WA)
in 2007 and identified the locations of the soils as shown in Table 2.6. It was also
noted that the expansive clay soils commonly contain clay minerals of the smectite
group and the collapsing soils have a structure of partly saturated open-voided soils.
Both soil types have high moisture sensitivity to volume. When partly saturated with
an open structure, significant changes in volume occur with or without external forces
(Vázquez, Justo, & Durand, 2013).
Table 2.6: Location of Problem soils in Western Australia (adopted after
(Davenport, 2007))
Expansive Soils Location in WA Collapsible Soil Location in WA
Armadale, Boulder, Bunbury, Collie,
Coolgardie, Dalwallinu, Geraldton,
Gooseberry Hill, Jerramungup,
Kalgoorlie, Katanning, Kununurra,
Lake King, Mundijong, Moora,
Newman, Ongerup, Perth
metropolitan area (Kalamunda,
Midland, Guilford, Swanview,
Maylands, Kenwick, Maddington,
Viveash), Ravensthorpe.
Balladonia, Broome, Cranbrook,
Derby, Geraldton, Karratha, Newman,
Perth coastal area, Port Hedland.
2.5.1 Identification of Collapse potential
Collapsible soils are one of the problematic soils and are defined as unsaturated soils
that are stable and able to withstand relatively high pressures, but quickly become
dense due to moisture intrusion. Collapsible soils are soils that when water is added
they collapse at constant stress, which causes volume reduction. Identifying
collapsible soils and predicting the potential collapsing behaviour are significantly
important. Some laboratory tests have been proposed to detect collapsing behaviour
(Gaaver, 2012).
Roger (1995) presented a general category of collapsible soils, which is either from
compacted soils or natural soils as shown in Figure 2.7. Natural soils are formed
during weathering process of parent rocks. Loess is an Aeolian deposit that normally

23
exhibits collapsing behaviour. Some alluvial soils that normally formed by water flow
(e.g. flash flood) have the high collapsible potential. Also, Compacted soils may show
collapsing behaviour (El Howayek, Huang, Bisnett, & Santagata, 2011). The potential
for collapsing behaviour is also present in other soils when saturated, the soils that are
“derived from volcanic tuff, gypsum, loose sands cemented by soluble salts,
dispersive clays, and sodium-rich montmorillonite clays” (Clemence & Finbarr,
1981).
Predicting the collapsing potential through natural dry density and liquid limit (LL)
was proposed in some papers (H. J. Gibbs & Holland, 1960), (Holtz, 1961), (H. J.
Gibbs, 1961), (H. Gibbs & Bara, 1962) and was confirmed by Basma and Kallas
(2004) and Gaaver (2012). They suggested that the density and liquid limit of
collapsible soils can be used to measure the collapse potential which can be estimated
from Figure 2.8. It can be used for all types of soil to evaluate collapsibility through
simple tests. This method is based on the void ratio which can keep the moisture
content at full saturation since the void ratio is sufficient for collapsing. When the
specific gravity of the soil is above the line, the soil may be susceptible to collapse
when saturated as collapsibility increases with respect to dry density decreases. It has
also represented that the area under the curve signifies the soil with no collapsibility.
Figure 2.7: Classification of collapsible soils (Rogers, 1995)

24
Figure 2.8: Criterion to identify soil collapsibility (adopted after (Holtz, 1961))
The standard oedometer test is performed on an undistributed sample of saturated soil
as shown in Figure 2.9 in relation to vertical static load and void ratio. The first curve
begins to flat and the point at which this flat curve ends is the preconsolidation
pressure and as the preconsolidation pressure passes, the slope of the curve steeply
declines. Compression index can be obtained from this steep curve section. Apart of
evaluating the collapse potential through the single oedometer test, another procedure
of a single oedometer method was suggested in 1975. By observing the single
oedometer test, the collapse potential can be obtained as presented in Figure 2.10.
Gradually increase the load on the sample up to a specific stress (about 200kPa) and
allow the sample to remain in the water for 24hrs and continue to load the sample
until the maximum load (Kalantari, 2013). Jennings and Knight (1957) proposed the
double oedometer test as an alternative method. Two oedometer tests were conducted
for each specimen in pre-saturated condition and natural moisture content condition.
The distance between the two curves of the oedometer test results presented in Figure
2.11 can predict the collapse potential.

25
Figure 2.9: Typical Consolidation Test Result (ASTM International, 2011b)
Table 2.2, which provides a relative indication, can be used to indicate the degree of
severity for collapsible soils from the results of the double oedometer test. Figure 2.10
and Figure 2.11 display typical single and double oedometer test results for
collapsible soils in relation to void ratio and effective stress to predict collapse
potential. Both methods are based on the void ratio and assuming that the void ratio
is the same when the soil is wet, regardless of whether it is before or after the effective
stress (Popescu, 1986).
Figure 2.10: Typical Single oedometer collapse potential test result (Pells et al.,
1975)

26
Figure 2.11: Typical Double oedometer collapse potential test result (Lutenegger &
Saber, 1988)
Popescu (1986) defined the collapse potential using the double oedometer test, where
Pcs and Pcn are the limiting pressure at which collapsing increases considerably for the
samples performed respectively at saturated and natural conditions as presented in
Figure 2.12. When the stress at Pcn is higher than the stress at Pcs, the soil refers to the
collapsible soil. Truly collapsible soils and conditionally collapsible soils are
distinguished using pressures Pcs and Po, where Po is the overburden vertical pressure.
If the pressure Po is higher than the pressure Pcs, it signifies that the soil has a certain
degree of collapsibility defined as “truly collapsible”. And when the pressure Po is
lower than the pressure Pcs, it signifies the soil defined as “conditionally collapsible”
that possess a certain degree of collapsibility but supports a certain level of stress
upon wetting. If the pressure Pcs is higher than the pressure Po, the soils are able to
withstand the pressure without collapsing upon saturation until the pressure Po is
higher than the pressure Pcs.
The collapse deformation begins from a small stress value, called the collapse
pressure. After the collapse pressure point, the deformation due to water is
significantly increased and then a fairly constant value is obtained.

27
Figure 2.12: Collapse pressure definition (Popescu, 1986)
2.5.2 Bonding and Collapsing Mechanism
According to Barden et al., Dudley and Mitchell, the collapse occurred in four factors
(Elkady, 2002). The soil would be an open structure and partially unstable, and a high
enough applied load that develops to be metastable. And a bonding or cementing
agent to stabilise the soil, which leads to collapse upon wetting, and water that reduces
the strength of bonding or cementing agents. There are a number of bonding forms
due to self-cementation or physical or chemical attraction. They can be simple
capillary forces with a fine silt binder or clay bridges or soluble salts or chemical
cementing binders such as calcium carbonate and iron oxide. The physical bonding is
weakened by moisture, and the capillary suction loses its strength as soon as water is
added. Figure 2.13 illustrates the typical bonding structures of collapsible soils, and
the structure of undisturbed collapsible soils and clay bridges from Scanning Electron
Microscope (SEM) pictures are provided in Figure 2.14. It provides a representative
structure and clay bonding of unsaturated collapsible soils. Figure 2.14(A) indicates
the open structure with a loose arrangement and Figure 2.14(B) and (C) indicate the
inner particles bonded by clay bridges. The sand grains are not fully coated with clays
but the particles are still connected with clay bonding (Haeri, Garakani, Khosravi, &
Meehan, 2013), (El Howayek et al., 2011).

28
Figure 2.13: Typical Bonding structure of collapsible soils (Clemence & Finbarr,
1981)
Figure 2.14: Microstructure of collapsible soils and Clay Bridges from SEM
(adopted after (Haeri et al., 2013), (Jackson et al., 2006). (a) Loose and Open
structure. (b) Cementation of clay matrices form. (c) Clay bridge bonds.

29
2.6 Soil Stabilisation
Numerous soil types demonstrate problems due to their characteristics and behaviours
such as swelling, dispersion, softness, collapse and weak strength. There are a number
of problematic soils that need to be stabilised to be used. Soil stabilisation has been
discussed and researched for solving soil problems. Soil stabilisers are used to
increase strength and durability, and to reduce sediment (erosion), dust, and
maintenance requirements to meet the requirements of engineering projects. Many
stabilisers have been used to improve soil performance with mechanical or chemical
stabilisation. Soil treatment using products such as sulphur cement, lime, polymers,
cement, electrolytes, enzymes, chlorides, clay, resin, fly ash and some combination
of these have been commonly used in the past. The stability and strength of soils are
always considered in design and construction. There are a number of methods for soil
stabilisation can be selected depending on the soil properties and conditions of the
construction site. There are three stabilisations; mechanical, chemical and
geosynthetic soil stabilisation. Mechanical stabilisation generally has two different
methods of replacing or mixing the problematics soils with suitable soils, and another
method is compacting on the soil to improve strength, compression, water absorption,
permeability and stress-strain characteristics. And, chemical soil stabilisation
produces new properties by mixing some chemical compounds in the problematic
soils. Geo-synthetic soil stabilisation includes geogrids, geowebs and geotextiles and
is used to upgrade highway sub-grade conditions (Mohamed & El Gamal, 2012),
(Huat et al., 2007).
There are traditional stabilisations such as cement, lime, fly ash and asphalt, which
require high cost, large amounts and long curing times. And non-tradition
stabilisations such as polymers, electrolytes, tree resins, salts, mineral pitches,
enzymes and petroleum emulsions, which need to be more researched due to lack of
information while traditional stabilisation has been well researched and widely used.
(Santoni, Tingle, & Nieves, 2005), (Mohamed & El Gamal, 2012), (Tingle, Newman,
Larson, Weiss, & Rushing, 2007).
2.6.1 Non-traditional soil stabiliser
Engineers have tried to produce soil improvement using different methods over the
years. Typically, lime, Portland cement and fly ash are widely used and are considered

30
as traditional stabilisers which are generally based on cation exchange or pozzolanic
reactions (Little & Nair, 2009). However, the traditional stabilisers such as cement
and lime have been proven in many studies to have major disadvantages such as
carbonation, sulphate attack and various environment impacts (Jawad, Taha, Majeed,
& Khan, 2014).
Non-traditional stabilisation is one of the most important methods used recently.
Non-traditional stabilisers have been used and developed for soil stabilisation
purposes due to low cost, short curing time and ease of application compared to
traditional stabilisation. Non-traditional stabilisers, such as polymer and copolymer
based products and calcium chloride, sodium chloride and fibre reinforcement, have
been used. Non-traditional pavement stabilisation has been popularly used in recent
years, but most of the non-traditional stabilisers are based on a variety of chemical
agents and been modified based on market tendency and, therefore, there is not much
information on recent products due to frequent modifications of chemical formulas
(Santoni et al., 2005). And, unlike traditional stabilisers, little literature has been
conducted on the mechanism of non-traditional stabilisers, since most of them focus
on the performance evaluation on non-traditional stabilisation (Tingle et al., 2007).
Table 2.7 proposed by Tingle et al. (2007) presents a summary of stabilisation
mechanism for seven non-traditional additives. Ionic stabilisers react slowly and are
material-dependent, and salts stabilisers require humidity to be active. Polymer
stabilisers are effective in sandy soils and organic stabilisers make the bonds between
fine particles and larger aggregates to interlink. Biological stabilisers are one of the
chemical binders that require a high content of clay. Clay additives also make bonds
between soil particles (B. Andrews, 2006), (Tingle et al., 2007).
Santoni et al. (2005) stabilised a silty sand (SM) using nine non-traditional stabilisers,
two traditional stabilisers and two accelerator products to enhance the strength of the
soil. Two accelerator products; a Cement and a Polymer are designed to accelerate
for helping the strength improvement quickly during the stabilisation process. They
evaluated strength improvement related curing times and focused on increased early
strength using non-traditional stabilisers with accelerate products to reduce cure times.
A tree resin, a silicate, a lignosulfonate and six different polymers are used as non-
traditional stabilisers, and an acrylic polymer and a Type I Portland cement product
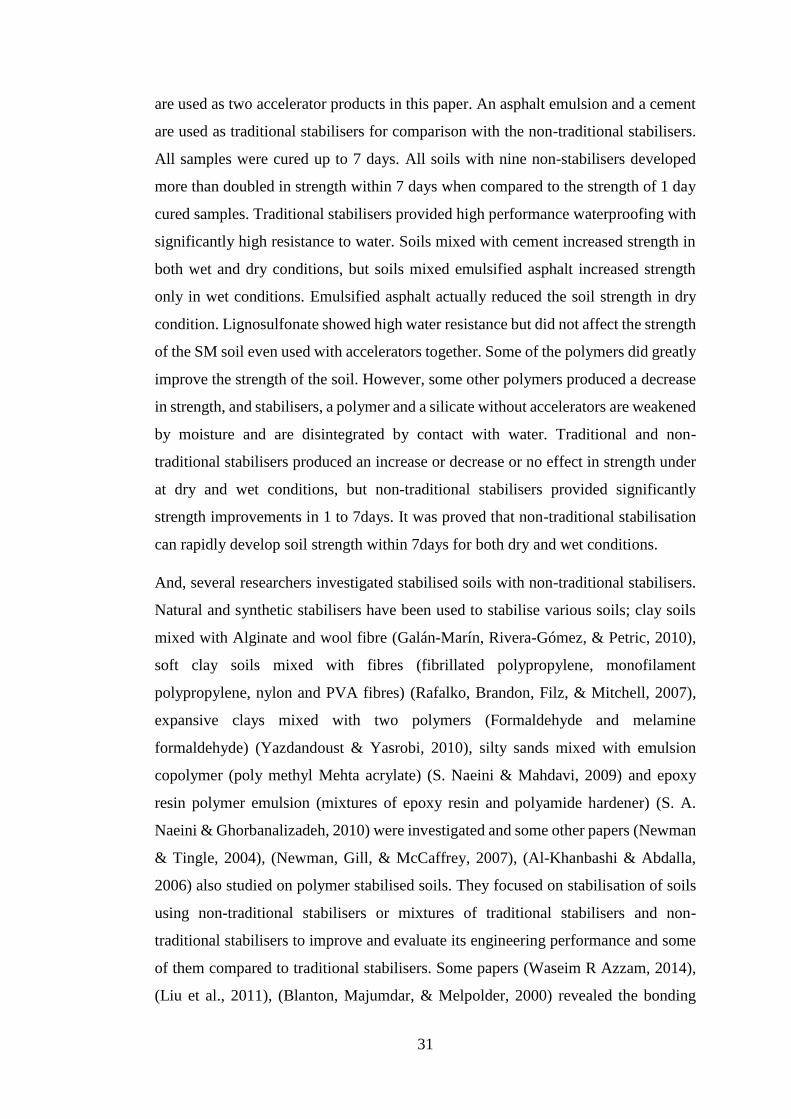
31
are used as two accelerator products in this paper. An asphalt emulsion and a cement
are used as traditional stabilisers for comparison with the non-traditional stabilisers.
All samples were cured up to 7 days. All soils with nine non-stabilisers developed
more than doubled in strength within 7 days when compared to the strength of 1 day
cured samples. Traditional stabilisers provided high performance waterproofing with
significantly high resistance to water. Soils mixed with cement increased strength in
both wet and dry conditions, but soils mixed emulsified asphalt increased strength
only in wet conditions. Emulsified asphalt actually reduced the soil strength in dry
condition. Lignosulfonate showed high water resistance but did not affect the strength
of the SM soil even used with accelerators together. Some of the polymers did greatly
improve the strength of the soil. However, some other polymers produced a decrease
in strength, and stabilisers, a polymer and a silicate without accelerators are weakened
by moisture and are disintegrated by contact with water. Traditional and non-
traditional stabilisers produced an increase or decrease or no effect in strength under
at dry and wet conditions, but non-traditional stabilisers provided significantly
strength improvements in 1 to 7days. It was proved that non-traditional stabilisation
can rapidly develop soil strength within 7days for both dry and wet conditions.
And, several researchers investigated stabilised soils with non-traditional stabilisers.
Natural and synthetic stabilisers have been used to stabilise various soils; clay soils
mixed with Alginate and wool fibre (Galán-Marín, Rivera-Gómez, & Petric, 2010),
soft clay soils mixed with fibres (fibrillated polypropylene, monofilament
polypropylene, nylon and PVA fibres) (Rafalko, Brandon, Filz, & Mitchell, 2007),
expansive clays mixed with two polymers (Formaldehyde and melamine
formaldehyde) (Yazdandoust & Yasrobi, 2010), silty sands mixed with emulsion
copolymer (poly methyl Mehta acrylate) (S. Naeini & Mahdavi, 2009) and epoxy
resin polymer emulsion (mixtures of epoxy resin and polyamide hardener) (S. A.
Naeini & Ghorbanalizadeh, 2010) were investigated and some other papers (Newman
& Tingle, 2004), (Newman, Gill, & McCaffrey, 2007), (Al-Khanbashi & Abdalla,
2006) also studied on polymer stabilised soils. They focused on stabilisation of soils
using non-traditional stabilisers or mixtures of traditional stabilisers and non-
traditional stabilisers to improve and evaluate its engineering performance and some
of them compared to traditional stabilisers. Some papers (Waseim R Azzam, 2014),
(Liu et al., 2011), (Blanton, Majumdar, & Melpolder, 2000) revealed the bonding

32
structures between the soil particles and between the soil particles and stabilisers.
However, most of the above-mentioned studies focused on engineering performances
such as shear, flexural, compressive strength and swelling potential.
Table 2.7: Proposed stabilisation mechanisms for Non-traditional stabilisation
(adopted after (Tingle et al., 2007))
Stabilisation Additive Stabilisation Mechanism Additional Information
Ionic Cationic exchange and
flocculation
Altering the electrolyte
concentration of the
pore fluid
Enzymes Organic molecule
encapsulation
Variations in the soil-
specific reactions
Lignosulfonates Physical
bonding/cementation
Coating individual soil
particles
Salts Hygroscopy/cation
exchange and
flocculation/crystallisation
and cementation
Keep the soils moist
that from environment,
which
increases effective
particle size by surface
tension
Petroleum Resins Physical
bonding/cementation
Coating individual soil
particles
Polymers Physical
bonding/cementation
Coating individual fine
soil particles
Tree resins Physical
bonding/cementation
Coating individual soil
particles
2.6.2 Polymer Stabiliser
Polymer is a material consisting of macromolecules that made up of repeating
monomers bonded together by covalent bonds. The characteristics of the polymer
depend on the mixture of monomers (molecules). There are various types of polymers
that may be natural or synthetic. In general, polymers can be classified based on
structures or molecular forces or made of polymerisation or origin of source. The
structural characteristics of the polymers (i.e. polymer chains) can be linear or
branched or cross-linked or networked, which is related to material properties (Kumar
& Gupta, 2003). Yoshihiko Ohama (1998) provided a classification of polymer-based
admixtures as shown in Figure 2.15. He studied about polymer modified mortars and

33
concrete. A polymer-based admixture is an admixture which contains a polymeric
compound as a main element effective for improving the properties of concrete.
Generally, most of the produced polymers are homopolymers. The polymer latexes
are copolymers that composed of two or more different monomers.
Polymer stabilisation has been increased and researched to solve soil problems and to
find technological applications. Numerous researches have been done on polymer
modified soil stabilisation using various polymers in different types of soils.
Shirsavkar and Koranne (2010) investigated on the soil modified with natural
polymers such as molasses. The results showed that the natural polymers reduced the
plasticity index and increased the maximum dry density and California Bearing Ratio
of the soil. Natural polymers have a great potential to be used as road stabilisers. For
example, there is an industrial waste such as molasses used in the above paper.
Figure 2.15: Classification of Polymer-based admixtures (Ohama, 1998)
Polymer soil stabilisation experiments has been performed using waterborne
polymers (S. A. Naeini, Naderinia, & Izadi, 2012), polymeric materials (Moustafa,

34
Bazaraa, & Nour El Din, 1981), polymer grids (Miura, Sakai, Taesiri, Yamanouchi,
& Yasuhara, 1990), synthetic polymers (Homauoni & Yasrobi, 2011), (Zandieh &
Yasrobi, 2010) and polymer based mixtures (Ateş, 2013). The polymers were applied
to various soils and examined using physical and mechanical tests. It was observed
that the polymers are very varied in the applicability and performance and that the
amount of polymer is significantly important when determining strength. The
performance of polymers varied greatly depending on the type of soil. Some of the
polymers worked well only in specific soil types, but most of the polymers showed
successful results in the strength experiments.
Polymers have been widely used to stabilise the lack of suitable soils. The use of
polymer stabilisers for soil improvement is growing rapidly. However, since little
research has been documented on interaction or reaction between polymer and soil,
the application of polymers is limited due to the lack of information on the
relationship between polymer and soil (Ateş, 2013), (Waseim R Azzam, 2014),
(Waseim Ragab Azzam, 2014).
2.6.3 Polymer stabilised soil for pavement
Polymers are used in a variety of ways for road stabilisation reasons and can be used
for dust suppression or soil stabilisation or performance improvement. Some
polymers have been provided excellent performance as stabilisers for pavement
constructions. The use of polymers is not only good for cost but also for performance.
Srinath et al. (2012) stabilised gravel-sand-silt-clay mixtures (GM-GC) containing
less than 2% (by volume) of Palygorskite clay with three different water-soluble
polymers. Untreated soils and treated soils were tested and polymer modified soils
were compared with the Portland cement (Type 1) treated soils using mechanical and
microstructural properties. The performance analysis results of polymer stabilised
soils showed higher UCS, stiffness and toughness compared to Portland cement
stabilised soils.
Polymer-modified asphalts have been successfully used on heavy-duty vehicle routes
such as airports and vehicle weigh stations. Ramasamooj (2001) tested for jointed
rigid airport pavements using polymer composites. The E-glass polyesters provided
good flexibility and fatigue resistance with high tensile strength. Yildirim (2007)
reviewed polymer modified asphalt binders such as rubber, styrene-butadiene-styrene

35
(SBR), styrene-butadiene-rubber (SBS) and Elvaloy® to research the rheological
properties of polymers used as asphalt binders. The polymers modified pavements
have been shown to be highly resistance to rutting and thermal cracking, and to reduce
fatigue damage and stripping. Some other researchers (Lynde & Brooks, 2005),
(Tayfur, Ozen, & Aksoy, 2007), (Al-Hadidy & Yi-qiu, 2009), (Lu, Soenen, Heyrman,
& Redelius, 2013) used polymers as an additive in asphalt road construction. They
focused on improving the service life (durability) of asphalt pavements and the impact
of polymers on the stripping resistance of asphalt pavements in the field. The polymer
provided a good aging resistance, and improved shear resistance and durability with
higher resistance to rutting and cracking. Polymer modified binders tend to improve
viscosity and elastic recovery. Compatibility between an asphalt and a modifier can
cause poor performance. Improvement of elastic recovery, softening point, ductility
and cohesive strength in the pavement design are the main objectives of the polymer
modified binders. In fact, asphalts modified with different polymers can behave very
differently, even when developed or altered for modified binders. They may come out
very differently in a force ductility test and measurements of softening point and
elastic recovery.
It has been proved that the polymers can improve soil mechanical properties such as
strength. On unsealed roads, however, dust and soil loss are another matter because
road dust and soil loss affect safety, dust control and soil loss prevention are issues
that need to be considered with unsealed roads. Most of the soils lost from the road
are fine aggregates that provide a bond between larger particles. Loosing fine
aggregates cause the road roughness and the incidence of vehicle damage to increase.
Polymer additives used for roads have been applied on unsealed roads to reduce dust
levels and erosion and improve resistance to water. Dust control can be achieved by
stabilising with synthetic polymer emulsions, for example, polymer dispersions,
(Shirsavkar & Koranne, 2010). Waterproofing is one of the best ways to stabilise the
soil. This is because the bond between the soil particles is weakened by water and the
soil particles become softer when wetted. The polymer can provide “internal
waterproofing” which reduces the general softening and lubrication of the incoming
moisture in the granular pavement (Lacey, 2004).

36
2.7 Summary
Pindan is a local term used to describe the soil of the Kimberley, a type of red soil
known as a moisture-sensitive soil in the Kimberley area. The characteristics of
Pindan soil produce the greatest susceptibility to densification during wetting. Pindan
presents high variability in strength and collapsibility even in similar properties. Some
Pindan samples from other locations in the Kimberley region have similar properties,
but they showed different strengths and collapsibility and also even occurred in
samples from other locations in the same area. The Kimberley region has two distinct
seasons; wet and dry season. Typical wet periods have high rainfall, high humidity
and high temperature, and sometimes even tropical cyclones. These tropical cyclones
cause damage to the road when accompanied by heavy rain for a short time.
Pavement structures may come in contact with water from rain or snow or
groundwater. The moisture weakens the bonds between aggregates or between
aggregates and binders. Moisture damages on pavement structures can cause
unexpected collapse or expansive issues due to large volume changes under the
pavement, which result uneven pavement surfaces. To prevent the moisture damages
in pavements, it is important to consider the moisture susceptibility of materials or
substances when pavements are designed and built. The failure issues due to volume
changes under the pavement can be identified using material properties. In particular,
unsealed pavements are susceptible to water and erosion, so the materials for the
unsealed pavement are important and their properties must be examined to prevent
potential problems. Improvements to unsealed road networks would solve the issues
of lower safety, performance and high maintenance costs.
Soil classification systems can provide information about types of soils, which can
predict their properties and behaviours on the fields. The shrink-swell capacity of soils,
which can damage roads and structures, can be predicted by the expected behaviours
of the soil using the classification systems. The determination of collapsible soil can
be completed by analysing the information of the soil in terms of dry density, liquid
limits, single and double oedometer methods can be used to identify the collapsibility
of the soil.
Non-traditional stabilisation has been used popularly and has become increasingly
available for engineering purposes as an alternative to traditional stabilisation due to

37
its low cost and easy application. Polymer modified soils are present in a number of
conducted studies. Most polymers have been successful in improving soil strength,
waterproofing and dust suppression. And, polymer modification roads in high-stress
locations have been successfully used.
However, most of the researches are limited to physical and mechanical performance
and there is no information about Pindan particles. A single particle of Pindan needs
to be identified to found out the properties of Pindan particles. In order to improve
the performance of unsealed pavement roads, it is necessary to identify the properties
of problematic soils and Polymers, and research the pavement stabilisation. Research
on Pindan soils and polymer stabilised Pindan soils need to be more conducted due to
the lack of information to be used for pavement structures.

38
Chapter 3
3 Preliminary Test
3.1 Introduction
Pindan soils used in this study are located in Broome within the Kimberley region of
Western Australia. This chapter contains preliminary tests to obtain a representative
sample of Broom-Pindan soils and investigate the properties of collapsibility of the
Pindan soil. The preliminary tests include particle size distribution, index, specific
gravity, collapsibility, texture, standard compaction and California Bearing Ratio
(CBR) tests. Particle size distribution and index testing are performed to identify the
classification of the Pindan soil samples and to compare the samples collected from
different locations. Standard compaction and CBR tests are performed to compare the
mechanical properties of the samples, and double oedometer test is carried out to
identify the potential collapsibility of the Broome-Pindan soil since the Pindan soils
exhibit high variability in strength and collapsibility according to literature reviews
(Emery et al., 2003), (Sinclair Knight Merz, 2009), (Western Australia. Department
of Regional Development and the North West, 1984). This chapter proves and
provides the representative sample of Broom-Pindan samples.
There were two validations in order to combine the Pindan samples for making a
representative sample of Broome-Pindan soils. The basic properties and basic
mechanical properties of the samples were used to combine the samples. The
proposed methodology in this chapter is shown in Figure 3.1. All samples and
mixtures were compared as well as comparison of two area samples; Gantheaume
Point Rd (G.P) and Cape Levique (C.L). All samples were compared and combined
through classification tests, and the raw materials and mixtures were compared
through compaction tests to combine them together. G.P samples and C.L samples
were compared by CBR tests to obtain a representative sample. The samples were
verified using two validation properties, physical and mechanical properties, through
several experiments to determine whether they can be combined as a representative
sample of Broome-Pindan soils.
39
Figure 3.1: Chapter3 Overall Flow Chart
3.2 Pindan Properties and classification
Soils can be divided into classification categories based on basic physical
characteristics such as index properties. Soil classification systems generally group
soils together with similar properties into relatively broad categories because soils
have a variety of characteristic and behaviours. The basic mechanical properties of
the Broome Pindan samples can be obtained by performing the compaction and
California Bearing Ratio (CBR) tests.
3.2.1 Index Properties and Classification Test
The results of index and classification tests are provided in this chapter. Specific
gravity and Atterberg limit tests were carried out according to AS 1289.3.5.1 (2006)
and ASTM D4318 (2010), respectively. Particle size distribution was performed in
accordance with AS 1289.3.6.1 (2009) and classified according to the Unified soil
classification system ASTM D2487 (2011a). The tests were determined from
disturbed soil samples. Seven Pindan samples collected locally in two sites of Broome
shown in Table 3.1 were used for the index and classification tests.
Stage 1 - Classification Test
• Plasticity Index (PI)
•Specific Gravity (GS)
•Particle Size Distribution
Stage 2 - Standard Compaction and CBR Test
• Optimum Moisture Content (OMC)
• Maximum Dry Density (MDD)
• CBR Strengh Value
Stage 3 - Obtain A Representative Broome-Pindan Sample
Stage 4 - Texture and Double oedometer Test
• Collpasibility and Texture

40
Table 3.1: Seven Broome-Pindan samples for Index and Classification Test
Collected location
Gantheaume Point Rd (G.P) Cape Levique (C.L)
Raw material Raw material
Shoulder Surface (site1)
Surface Shoulder (site2)
Surface (site2)
Specific gravity testing to determine the particle density of Pindan samples is
calculated based on void ratio, degree of saturation and temperature. Specific gravity
is required to calculate soil porosity. The plasticity index (PI) is calculated based on
the difference between the liquid limit (LL) and the plastic limit (PL). The plasticity
index (PI) is obtained by the following relationship provided by ASTM D4318 (2010):
PI = 𝐿𝐿 − 𝑃𝐿 (3.2.1)
where PI is the plasticity index, LL is the liquid limit and PL is the plastic limit of the
soil. The soil is considered as Non-Plastic (NP) if the plastic limit is zero or has a
negative number or if the plastic limit or liquid limit cannot be determined. Shrinkage
limit (SL), liquid limit (LL) and plastic limit (PL) of fine grained soils can be
determined through the Atterberg limit test that based on the moisture content of the
soil. The results of the specific gravity and plasticity index of the seven Broome-
Pindan samples are shown in Table 3.2. Liquid limit of the samples could not be
determined, therefore, the Broome-Pindan soils are considered as non-plastic. Pindan
soils have a specific gravity ranging from 2.57 to 2.61, which means that Pindan soils
contains a large amount of porous particles. Broome-Pindan soils are non-plastic soils
based on the plasticity index, which means that it generally tends to have little silt or
clay.
Quantitative determination by sieve analysis was used in this study. This system is
used to determine soil gradations. The particle size distribution of the seven samples
for Broome-Pindan soils is presented in Figure 3.2. Soils can be classified by their
physical and chemical composition, but they are more influenced by their physical
properties (e.g. size). Chemical analysis of soils is not essential for soil classification.

41
Table 3.2: Specific gravity and Plasticity index of Broome-Pindan
Pindan Soil Specific Gravity (Gs) Plasticity Index (PI)
G.P Raw 2.60
Non-Plastic
G.P Surface 2.60
G.P Shoulder 2.57
C.L Raw 2.61
C.L Surface 1 2.59
C.L Surface 2 2.59
C.L Shoulder 2.58
In this study, the samples were classified according to their particle size distribution
and plasticity. Table 3.3 provides the percentage of gravel, sand and silt of the seven
samples based on the Unified soil classification system ASTM D2487 (2011a). The
classification of the Broome-Pindan soils was derived from the particle size
distribution as shown in Table 3.4. The seven Broome-Pindan samples are classified
as silty sand (SM) according to the Unified soil classification system ASTM D2487
(2011a). The Broome-Pindan samples are in the same classification category,
therefore, the samples can be grouped into a single sample.
Figure 3.2: Particle Size Distribution of Broome-Pindan Soil

42
Table 3.3: Percentage of Gravel, Sand and Silt of Broome-Pindan Soil
Component G.P
Raw
G.P
Surface
G.P
Shoulder
C.L
Raw
C.L
Surface
1
C.L
Surface
2
C.L
Shoulder
2
Gravel % 9.31 2.55 0.01 0.16 2.11 0.02 0.01
Sand % 86.65 93.99 96.7 93.81 96.36 98.03 94.29
Silt % 4.04 3.46 3.29 6.03 1.53 1.95 5.70
Table 3.4: Classification of Broome-Pindan soil
Soil Classification
G.P Raw
Silty Sand (SM)
G.P Surface
G.P Shoulder
C.L Raw
C.L Surface 1
C.L Surface 2
C.L Shoulder
3.2.2 Mechanical Properties
Since they belong to the same classification category, the Broome-Pindan samples
can be grouped together, but even if they have similar basic properties, Pindan soils
may show different strengths according to a report (Western Australia. Department
of Regional Development and the North West, 1984). In this chapter, more tests such
as compaction and strength tests are carried out to compare the basic mechanical
properties of Broome-Pindan samples in order to obtain a representative Broome-
Pindan sample.
The bearing capacity of soils has been used to design pavement structures. The
California Bearing Ratio (CBR) test is developed by California state highway
Department. It is a simple test for evaluating the mechanical strength of soils using
its resistance against the pushed plunger. It is also used in a quick and inexpensive
method instead of a Triaxial test to evaluate the resilient modulus of soils. The CBR
test was performed according to AS 1289.6.1.1 (2014) using the standard proctor
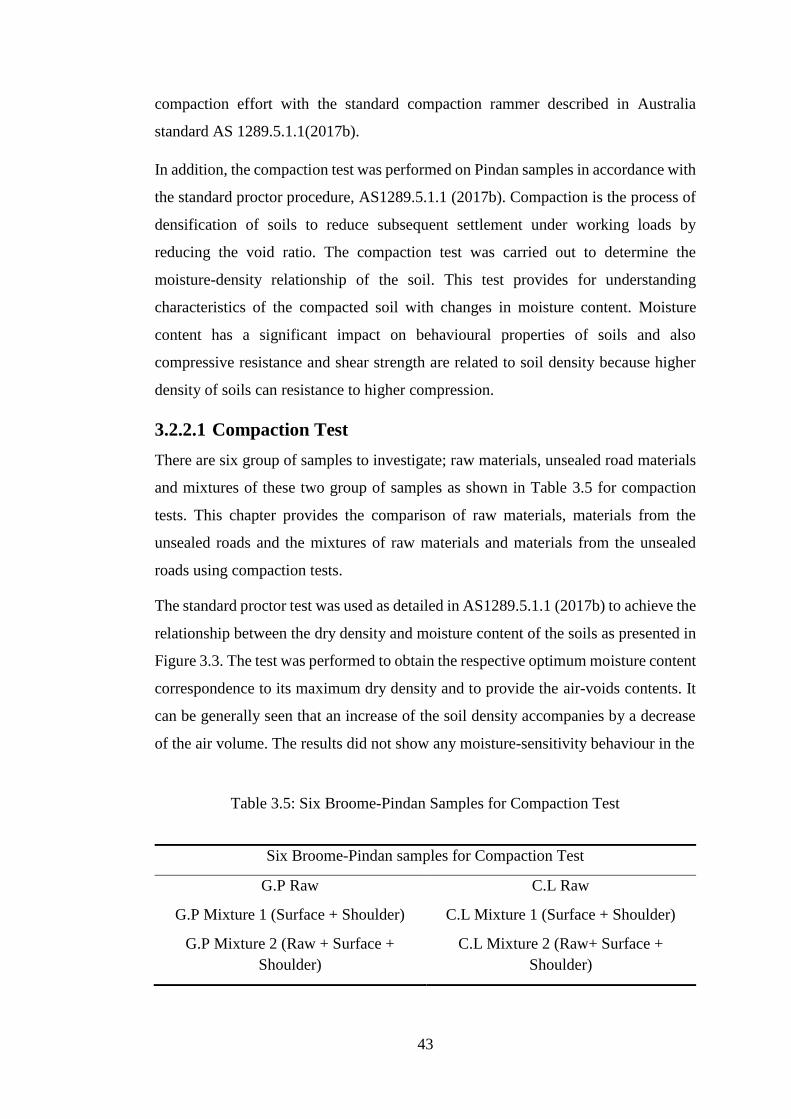
43
compaction effort with the standard compaction rammer described in Australia
standard AS 1289.5.1.1(2017b).
In addition, the compaction test was performed on Pindan samples in accordance with
the standard proctor procedure, AS1289.5.1.1 (2017b). Compaction is the process of
densification of soils to reduce subsequent settlement under working loads by
reducing the void ratio. The compaction test was carried out to determine the
moisture-density relationship of the soil. This test provides for understanding
characteristics of the compacted soil with changes in moisture content. Moisture
content has a significant impact on behavioural properties of soils and also
compressive resistance and shear strength are related to soil density because higher
density of soils can resistance to higher compression.
3.2.2.1 Compaction Test
There are six group of samples to investigate; raw materials, unsealed road materials
and mixtures of these two group of samples as shown in Table 3.5 for compaction
tests. This chapter provides the comparison of raw materials, materials from the
unsealed roads and the mixtures of raw materials and materials from the unsealed
roads using compaction tests.
The standard proctor test was used as detailed in AS1289.5.1.1 (2017b) to achieve the
relationship between the dry density and moisture content of the soils as presented in
Figure 3.3. The test was performed to obtain the respective optimum moisture content
correspondence to its maximum dry density and to provide the air-voids contents. It
can be generally seen that an increase of the soil density accompanies by a decrease
of the air volume. The results did not show any moisture-sensitivity behaviour in the
Table 3.5: Six Broome-Pindan Samples for Compaction Test
Six Broome-Pindan samples for Compaction Test
G.P Raw C.L Raw
G.P Mixture 1 (Surface + Shoulder) C.L Mixture 1 (Surface + Shoulder)
G.P Mixture 2 (Raw + Surface +
Shoulder)
C.L Mixture 2 (Raw+ Surface +
Shoulder)

44
Figure 3.3: Compaction Test of Broome-Pindan Soil with Air-voids (Av) curve
Table 3.6: Optimum Moisture Contents (OMC) and Maximum Dry Density (MDD)
of Broome-Pindan Soils
Standard Proctor Compaction Test
Sample OMC (%) MDD (KN/m3)
G.P Raw 10.8 17.7
G.P Mixture 1 11.2 17.6
G.P Mixture 2 10.8 17.7
C.L Raw 10.0 17.9
C.L Mixture 1 9.8 18.1
C.L Mixture 2 10.2 18.1
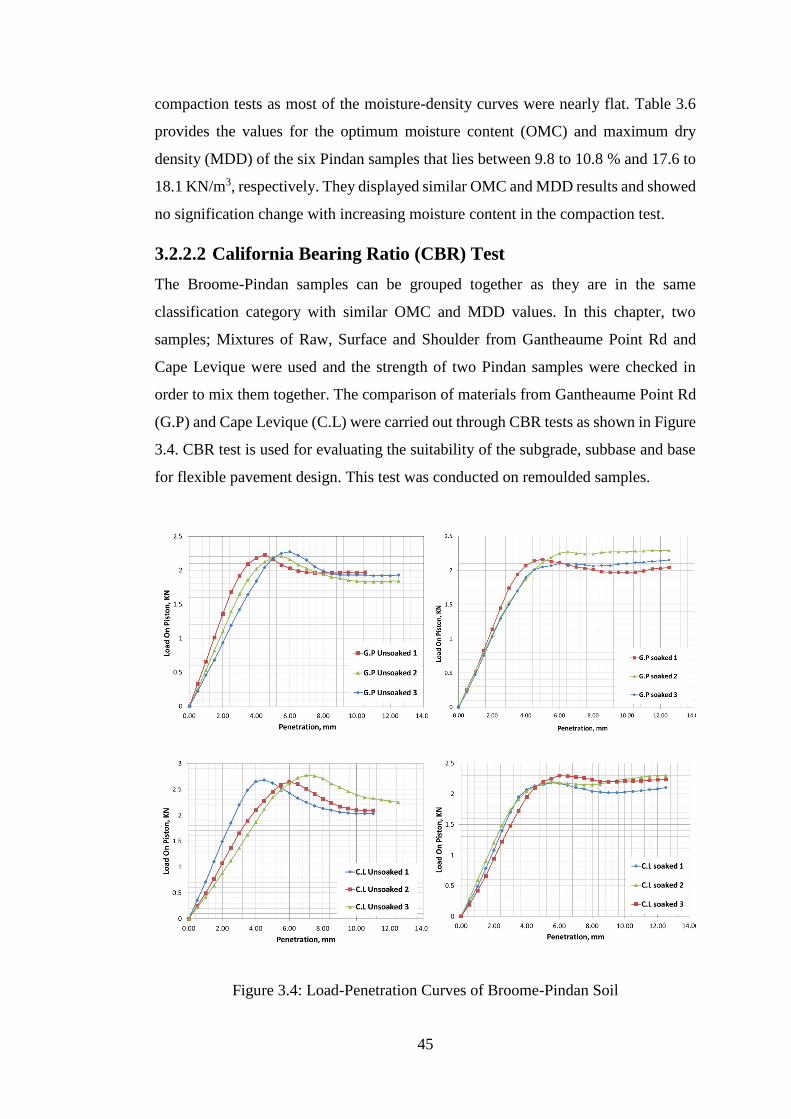
45
compaction tests as most of the moisture-density curves were nearly flat. Table 3.6
provides the values for the optimum moisture content (OMC) and maximum dry
density (MDD) of the six Pindan samples that lies between 9.8 to 10.8 % and 17.6 to
18.1 KN/m3, respectively. They displayed similar OMC and MDD results and showed
no signification change with increasing moisture content in the compaction test.
3.2.2.2 California Bearing Ratio (CBR) Test
The Broome-Pindan samples can be grouped together as they are in the same
classification category with similar OMC and MDD values. In this chapter, two
samples; Mixtures of Raw, Surface and Shoulder from Gantheaume Point Rd and
Cape Levique were used and the strength of two Pindan samples were checked in
order to mix them together. The comparison of materials from Gantheaume Point Rd
(G.P) and Cape Levique (C.L) were carried out through CBR tests as shown in Figure
3.4. CBR test is used for evaluating the suitability of the subgrade, subbase and base
for flexible pavement design. This test was conducted on remoulded samples.
Figure 3.4: Load-Penetration Curves of Broome-Pindan Soil

46
The graphical representation in Figure 3.4 established the relationship between the
penetration and the load on a piston for the Broome-Pindan samples. These tests were
performed immediately after compaction for unsoaked samples. For soaked samples,
the samples were soaked for 4 days in water after compaction, and then a penetration
test was conducted. All samples were compacted to exceed 95% of the standard
proctor maximum dry density (MDD). Table 3.7 provides CBR values for the
unsoaked and soaked samples, and swelling percentage for the soaked samples. The
laboratory density ratio (LDR) of the specimens is also provided in the table, which
are the achieved dry density ratio in the laboratory. The relative compaction was to
be 95% to 98% of MDD for all test. The CBR values were calculated for penetration
of 2.5mm and 5mm. The CBR values in Table 3.7 were selected with a greater value
of either the CBR value at 2.5mm or 5mm. The CBR tests on the unsoaked Broome-
Pindan samples result in the range CBR 11.01 – 12.72% for G.P samples and CBR
Table 3.7: California Bearing Ratio (CBR) Test Results for Broome-Pindan soil
Sample No. CBR (%) Swell (%) Dry Density before
Soaking (g/cm3) LDR (%)
G.P - Unsoaked Condition
1 12.72
N/A
1.75 96.8
2 11.06 1.77 97.9
3 11.01 1.75 97.0
Average 11.60
G.P - Soaked Condition
1 10.98 -0.08 1.76 97.3
2 10.66 -0.11 1.75 97.2
3 10.35 -0.06 1.75 96.8
Average 10.66
C.L - Unsoaked Condition
1 14.00
N/A
1.79 97.2
2 12.40 1.79 96.8
3 11.82 1.77 95.9
Average 12.74
C.L - Soaked Condition
1 10.86 0 1.78 96.7
2 11.29 -0.08 1.79 96.9
3 11.11 -0.15 1.77 95.9
Average 11.09

47
11.82 – 14.00% for C.L samples and on soaked samples result in CBR 10.35 – 10.98%
for G.P samples and CBR 10.86 – 11.29% for C.L samples. Based on CBR test results,
the Broome-Pindan soils are able to use as a road material for pavement structures of
subgrade, subbase and base at both dry and wet conditions.
3.2.3 A Representative of Broome-Pindan Soil
The specimen must be representative of the soils from which they were taken. Figure
3.5 represents the particle size distribution interval of the Broome-Pindan samples
collected from different location in Broome, which represents the particle size
distribution interval of representative samples. It has proven to be able to combine the
Broome-Pindan samples as they have similar properties and behaviours. This chapter
further provides information on the texture of Broome-Pindan soils and the collapse
potential of a representative Broome-Pindan soil sample.
Figure 3.5: Particle Size Distribution Interval for A Representative Broome-Pindan
Soil

48
3.2.4 Collapsible Potential and Texture
Pindan located in Broome has been studied by a few researchers. According to
Kenneally et al. (1996), Pindan becomes soft and greasy when pindan is wet and
Emery et al. (2003) described Pindan as a collapsible soil but an engineering report
by Sinclair Knight Merz (2009) classified Pindan located in Broome as a slightly-
reactive or non-reactive site in relation to increasing moisture content. This chapter
investigates the texture information and collapsible potential of a representative
Broome-Pindan sample used in this study.
The double odometer method was used for determining the Broome-Pindan soil
collapse potential. Each sample was used in a dry and fully saturated conditions,
respectively. The test was performed based on ASTM D2435/2435M (2011b) with
particles less than 2.36mm in soil samples. The sample was saturated for 24hours to
make the soaked condition while the other is kept at its natural moisture content. The
consolidometer was placed in the loading machine applied with 6kPa seating pressure.
The results were recorded for each increment at 6, 12.5, 25, 50, 100, 200, 400 and
800kPa. The samples were tested in remoulded condition as it is very difficult to keep
the undisturbed condition in the laboratory. Emery et al. (2003) also mentioned the
Pindan samples classified as silty sand (SM) could not be tested due to the
characteristic of very friable in an undisturbed condition. The results of the double
oedometer test are presented in Figure 3.6 for unsaturated and saturated samples. For
the unsaturated and saturated samples, a large change in the void ratio was initiated
in the double oedometer test at vertical stresses of 200kPa and 100kPa, respectively.
The results were plotted using corrected data for ease of comparison. The results in
Figure 3.6 clearly show that the soaked condition of the sample experienced higher
void ratio than the unsoaked condition. The saturated specimen was weakened by
water and more densified due to reducing the frictional and bonding strengths of soils.
The result in Figure 3.7 shows the collapse index versus the applied stress calculated
based on the graph in Figure 3.6 using the following Equation (3.2.2) (Pells et al.,
1975):
Cp =
∆𝑒
1+𝑒° × 100 (3.2.2)
where Cp is collapse potential, ∆e is difference or change in void ratio between dry
and wet specimens and e° is initial void ratio of specimens.

49
Figure 3.6: Void Ratio vs Applied Stress Test on Unsaturated and Saturated Sample
Figure 3.7: Collapse Index vs Stress
In the double oedometer test, the collapse index between the two samples was rapidly
increased between 100KPa and 200KPa, and the largest collapse index of 1.24%
between two samples was recorded at 800KPa. The collapse index of 1.24%
corresponds to a moderate trouble soil (i.e. a slightly collapsible soil) according to
Table 2.2 guide to collapse potential values. The results of the double oedometer test
on Broome-Pindan specimens did not display any significant collapsibility (i.e.
collapse potential). The specimens showed similar behaviour to Pindan soils located
in Broome reported in the engineering report of Sinclair Knight Merz (2009) as they
classified the soil as slightly-reactive or non-reactive with respect to water content.
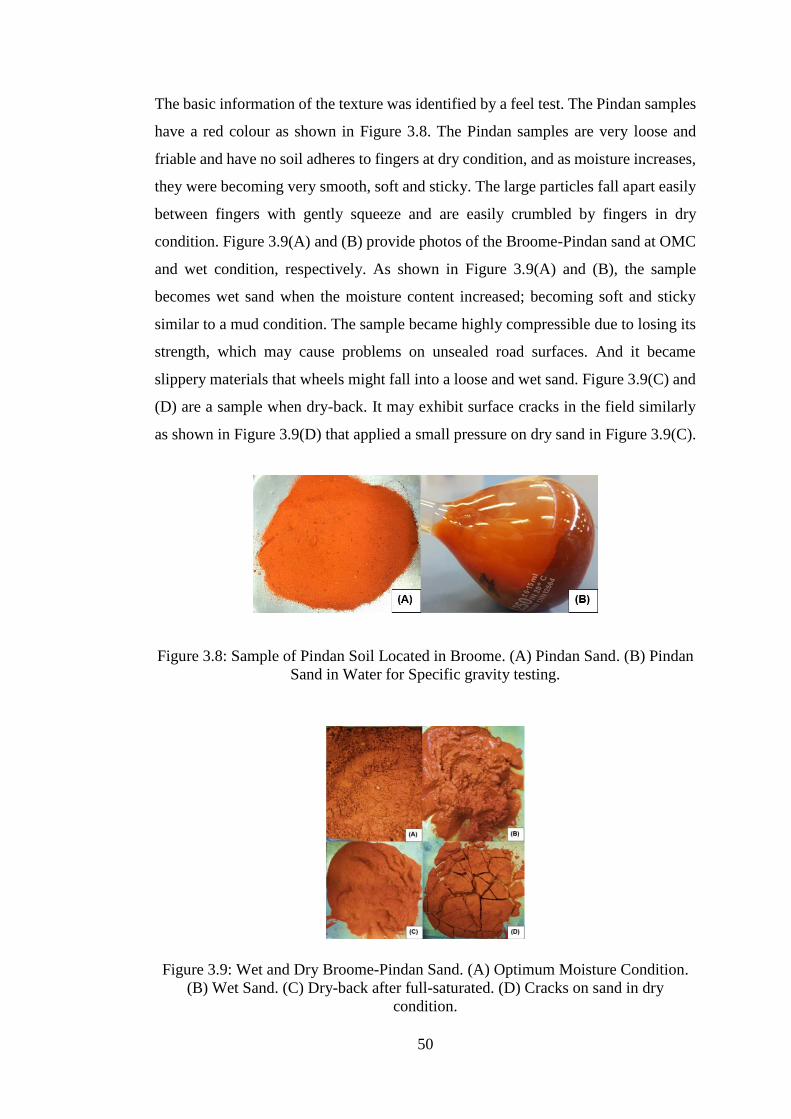
50
The basic information of the texture was identified by a feel test. The Pindan samples
have a red colour as shown in Figure 3.8. The Pindan samples are very loose and
friable and have no soil adheres to fingers at dry condition, and as moisture increases,
they were becoming very smooth, soft and sticky. The large particles fall apart easily
between fingers with gently squeeze and are easily crumbled by fingers in dry
condition. Figure 3.9(A) and (B) provide photos of the Broome-Pindan sand at OMC
and wet condition, respectively. As shown in Figure 3.9(A) and (B), the sample
becomes wet sand when the moisture content increased; becoming soft and sticky
similar to a mud condition. The sample became highly compressible due to losing its
strength, which may cause problems on unsealed road surfaces. And it became
slippery materials that wheels might fall into a loose and wet sand. Figure 3.9(C) and
(D) are a sample when dry-back. It may exhibit surface cracks in the field similarly
as shown in Figure 3.9(D) that applied a small pressure on dry sand in Figure 3.9(C).
Figure 3.8: Sample of Pindan Soil Located in Broome. (A) Pindan Sand. (B) Pindan
Sand in Water for Specific gravity testing.
Figure 3.9: Wet and Dry Broome-Pindan Sand. (A) Optimum Moisture Condition.
(B) Wet Sand. (C) Dry-back after full-saturated. (D) Cracks on sand in dry
condition.

51
Double oedometer test results for Broome-Pindan specimens display the level of
collapsible potential in a low degree so the materials are able to use as a pavement
structure material, but the soil needs to be stabilised for use as a surface material of
unsealed roads.
3.3 Summary
Index and classification tests to identify the basic properties of the Broome-Pindan
soil and strength tests to determine engineering design parameters are carried out, and
texture and collapsibility tests are also investigated in this chapter. The laboratory
tests indicated that the Pindan samples are Silty Sand (SM) contains 0.1-9.31% gravel,
86.65-98.03% sand and 1.53-6.03% silty and clay contents with the plasticity index
of non-plastic. The samples were verified and combined by index, classification,
compaction and CBR tests to produce a representative soil of Broome-Pindan soils.
All tests were used to compare the different samples and provided basic information
of the samples. The samples were compacted to be greater than 95% of standard
proctor maximum dry density for CBR and collapsibility tests. It is noted that
moisture-sensitivity behaviour did not be presented in the compaction and CBR tests.
Based on CBR test results, the Broome-Pindan soil can be used as a road material for
base, subbase and subgrade pavement structures in both dry and wet conditions. The
strength of Broome-Pindan samples is high enough for pavement design with a low
collapse potential in the result of the double oedometer test. However, based on
texture of the soil, it may cause a problem on the surface of the unsealed roads as it
became soft and lost strength when water was added. The soil is highly compressible
in a wet condition, and the soil was easily crumbed due to high friability at dry
moisture condition. The compacted pindan soil showed satisfactory strength in
confined conditions, but it may not have satisfactory strength without being stabilised
in unconfined conditions.

52
Chapter 4
4 Nanoindentation
4.1 Introduction
The soil characteristics of the site are one of the most important factors for road
construction. However, in order to know the properties of the soil properly, sometimes
it is necessary to do some in situ field testings for the properties in natural state.
Therefore, the standard soil investigation methods such as the standard penetration
test (SPT) and pressuremeter are widely used, but they are not simple experiments.
Nanoindentation can provide the properties of individual phases of materials in the
in-situ condition. Many researchers (Constantinides, Chandran, Ulm, & Van Vliet,
2006), (Constantinides & Ulm, 2007), (Bobko & Ulm, 2008), (Ulm et al., 2007), (Lee,
Vimonsatit, & Chindaprasirt, 2016), (Borodich, Keer, & Korach, 2003), (Durst,
Göken, & Vehoff, 2004), (Durst, Backes, Franke, & Göken, 2006), (Mondal, Shah,
& Marks, 2007) have studied the nanoindentation method to verify the method with
properties of microstructure using multiscale mechanical modelling. Constantinides,
Chandran, Ulm, & Van Vliet (2006) has also verified the nanoindentation analysis of
composite microstructure and mechanics using “continuum indentation analysis”. To
use his proposed methodology, the indentation depth needs to be chosen carefully.
Representative volume Element (RVE) is one of the most significant elements of the
continuum indentation analysis to provide information about heterogeneous materials.
The condition of RVE of continuum approach for homogeneous materials is that the
characteristic of the material at a length scale of Li must confirm to the length scale
separability condition as (Constantinides et al., 2006):
di << Li<< (hi, ai, Di) (4.1.1)
when di, hi, ai and Di are the characteristic length scale of the local heterogeneities in
RVE, the indentation depth, the indentation radius and characteristic microstructural
length scale, respectively. Figure 4.1 illustrates the principles of indentation testing
in relation to Equation 4.1.1.
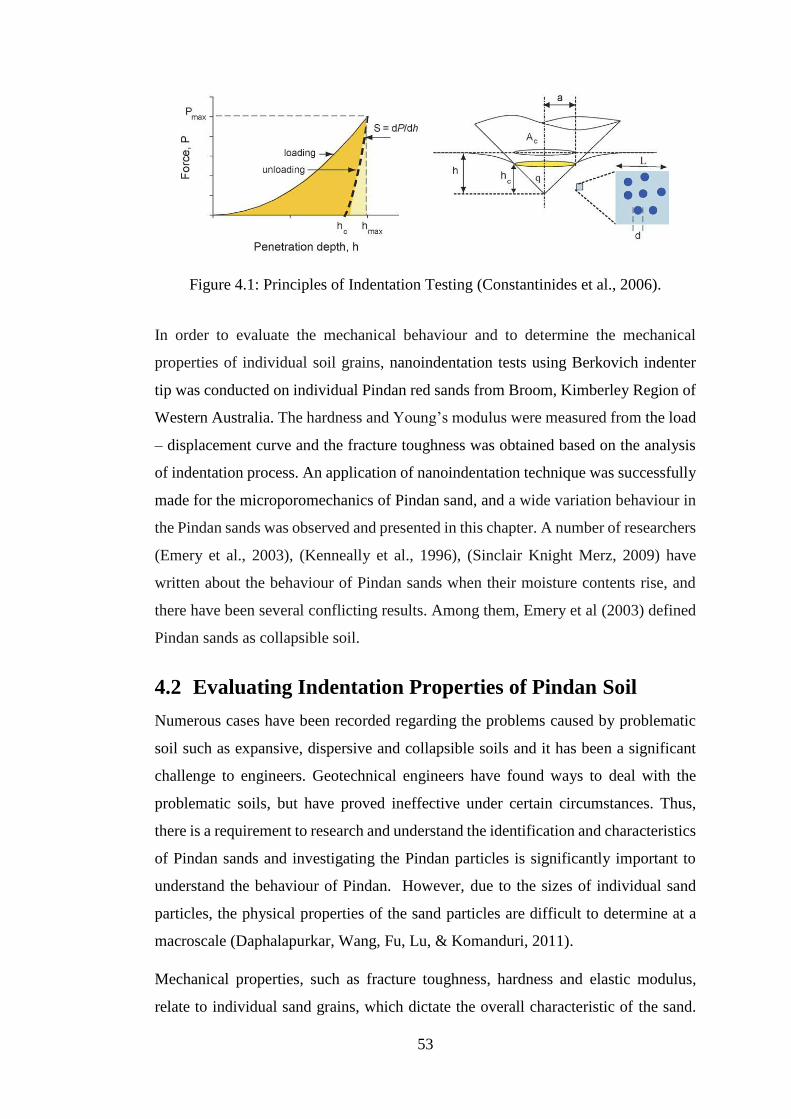
53
Figure 4.1: Principles of Indentation Testing (Constantinides et al., 2006).
In order to evaluate the mechanical behaviour and to determine the mechanical
properties of individual soil grains, nanoindentation tests using Berkovich indenter
tip was conducted on individual Pindan red sands from Broom, Kimberley Region of
Western Australia. The hardness and Young’s modulus were measured from the load
– displacement curve and the fracture toughness was obtained based on the analysis
of indentation process. An application of nanoindentation technique was successfully
made for the microporomechanics of Pindan sand, and a wide variation behaviour in
the Pindan sands was observed and presented in this chapter. A number of researchers
(Emery et al., 2003), (Kenneally et al., 1996), (Sinclair Knight Merz, 2009) have
written about the behaviour of Pindan sands when their moisture contents rise, and
there have been several conflicting results. Among them, Emery et al (2003) defined
Pindan sands as collapsible soil.
4.2 Evaluating Indentation Properties of Pindan Soil
Numerous cases have been recorded regarding the problems caused by problematic
soil such as expansive, dispersive and collapsible soils and it has been a significant
challenge to engineers. Geotechnical engineers have found ways to deal with the
problematic soils, but have proved ineffective under certain circumstances. Thus,
there is a requirement to research and understand the identification and characteristics
of Pindan sands and investigating the Pindan particles is significantly important to
understand the behaviour of Pindan. However, due to the sizes of individual sand
particles, the physical properties of the sand particles are difficult to determine at a
macroscale (Daphalapurkar, Wang, Fu, Lu, & Komanduri, 2011).
Mechanical properties, such as fracture toughness, hardness and elastic modulus,
relate to individual sand grains, which dictate the overall characteristic of the sand.
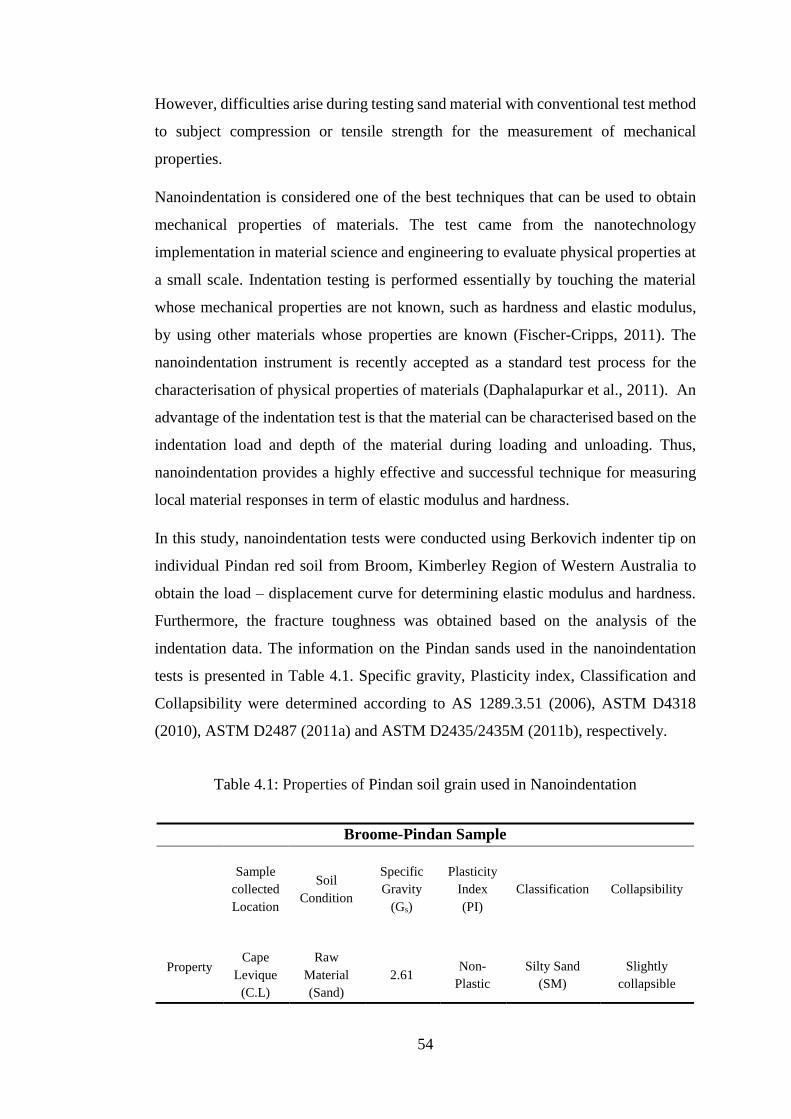
54
However, difficulties arise during testing sand material with conventional test method
to subject compression or tensile strength for the measurement of mechanical
properties.
Nanoindentation is considered one of the best techniques that can be used to obtain
mechanical properties of materials. The test came from the nanotechnology
implementation in material science and engineering to evaluate physical properties at
a small scale. Indentation testing is performed essentially by touching the material
whose mechanical properties are not known, such as hardness and elastic modulus,
by using other materials whose properties are known (Fischer-Cripps, 2011). The
nanoindentation instrument is recently accepted as a standard test process for the
characterisation of physical properties of materials (Daphalapurkar et al., 2011). An
advantage of the indentation test is that the material can be characterised based on the
indentation load and depth of the material during loading and unloading. Thus,
nanoindentation provides a highly effective and successful technique for measuring
local material responses in term of elastic modulus and hardness.
In this study, nanoindentation tests were conducted using Berkovich indenter tip on
individual Pindan red soil from Broom, Kimberley Region of Western Australia to
obtain the load – displacement curve for determining elastic modulus and hardness.
Furthermore, the fracture toughness was obtained based on the analysis of the
indentation data. The information on the Pindan sands used in the nanoindentation
tests is presented in Table 4.1. Specific gravity, Plasticity index, Classification and
Collapsibility were determined according to AS 1289.3.51 (2006), ASTM D4318
(2010), ASTM D2487 (2011a) and ASTM D2435/2435M (2011b), respectively.
Table 4.1: Properties of Pindan soil grain used in Nanoindentation
Broome-Pindan Sample
Sample
collected
Location
Soil
Condition
Specific
Gravity
(Gs)
Plasticity
Index
(PI)
Classification Collapsibility
Property Cape
Levique
(C.L)
Raw
Material
(Sand)
2.61 Non-
Plastic
Silty Sand
(SM)
Slightly
collapsible

55
4.3 Experimental Result and Discussion
A sample of sand was cast with epoxy matrix then was grinded and polished to reduce
the surface roughness (Bobko & Ulm, 2008). The mechanical properties such as
hardness (H) and elastic modulus (E) of the sand grain based on contact mechanics of
nanoindentation as can be found in some literatures (Cheng & Cheng, 2004;
Constantinides & Ulm, 2007; Fischer-Cripps, 2011; Lee et al., 2016; Warren C Oliver
& Pharr, 2004):
𝐻 =𝑃𝑚𝑎𝑥
𝐴𝐶 (4.3.1a)
𝐸𝑟 =√𝜋
2
𝑆
𝐴𝑐 (4.3.1b)
Where Ac is the projected contact area corresponding the contact depth (hc), Pmax is
the maximum indentation load, and 𝑆 = 𝑑𝑃/𝑑ℎ is the slope of the upper portion of
the unloading curve as shown in Figure 4.2. The reduced modulus Er can be expressed
as elastic modulus of sample (E) as:
1
𝐸𝑟=
1 − 𝑣𝑠
𝐸+
1 − 𝑣′2
𝐸′ (4.3.2)
where v’, vs and E’ are Poisson’s ratio of indenter tip and sample, and the elastic
modulus of indenter tip, respectively.
Figure 4.2: Typical load – displacement curve for indentation.

56
For the measurement of hardness and elastic modulus of sand grain, nanoindentation
test was carried out with XP system and Poisson’s ratio of 0.25 was assumed. Thus,
Equation (4.3.1) to (4.3.2) was applied to determine the hardness and elastic modulus
of the samples. According to deconvolution technique from literature (Lee et al.,
2016), hardness and elastic modulus complete as presented in Figure 4.3. From the
deconvolution results, the elastic modulus and hardness values for Pindan sand were
observed as 68.1 ± 12.7 GPa and 10.6 ± 0.9 GPa, respectively. The elastic modulus
of Pindan sand, however, is lower than the elastic modulus of quartz, which has an
elastic modulus of around 124 GPa with indentation test (Warren Carl Oliver & Pharr,
1992). It can be encouraged by a different material constituent in Pindan sand.
Similarly, the stiffness and hardness-packing density scaling were employed on
Pindan sand (Lee et al., 2016). The results of sand particle properties were obtained
that stiffness and cohesion were 92.7 GPa, 4.1 GPa, respectively. The packing density
Figure 4.3: Statistical Indentation Analysis; Top - cumulative distribution functions
(CDF), Bottom – probability density function of elastic modulus (left) and hardness
(right).

57
of the sample was determined as 0.863 ± 0.032 as shown in Figure 4.4. From the
results of the packing density distribution, it is possible to evaluate the total porosity
of the material using the relationship between the packing density and the total
porosity summarised by Ulm et al. (Ulm et al., 2007) as:
𝜉 = ∑(1 − 𝜂) (4.3.3)
where ξ and η are total porosity and packing density of material. Application of
Equation (4.3.3) to Pindan sand yields ξ = 0.137. This way of determining the porosity
using statistical technique provides a new non-invasive approach which, otherwise,
would be difficult to estimate the porosity of ground materials using a classical
method (Ulm et al., 2007).
Figure 4.4: Statistical Indentation Analysis; Top - cumulative distribution functions
(CDF), Bottom – probability density function of packing density.
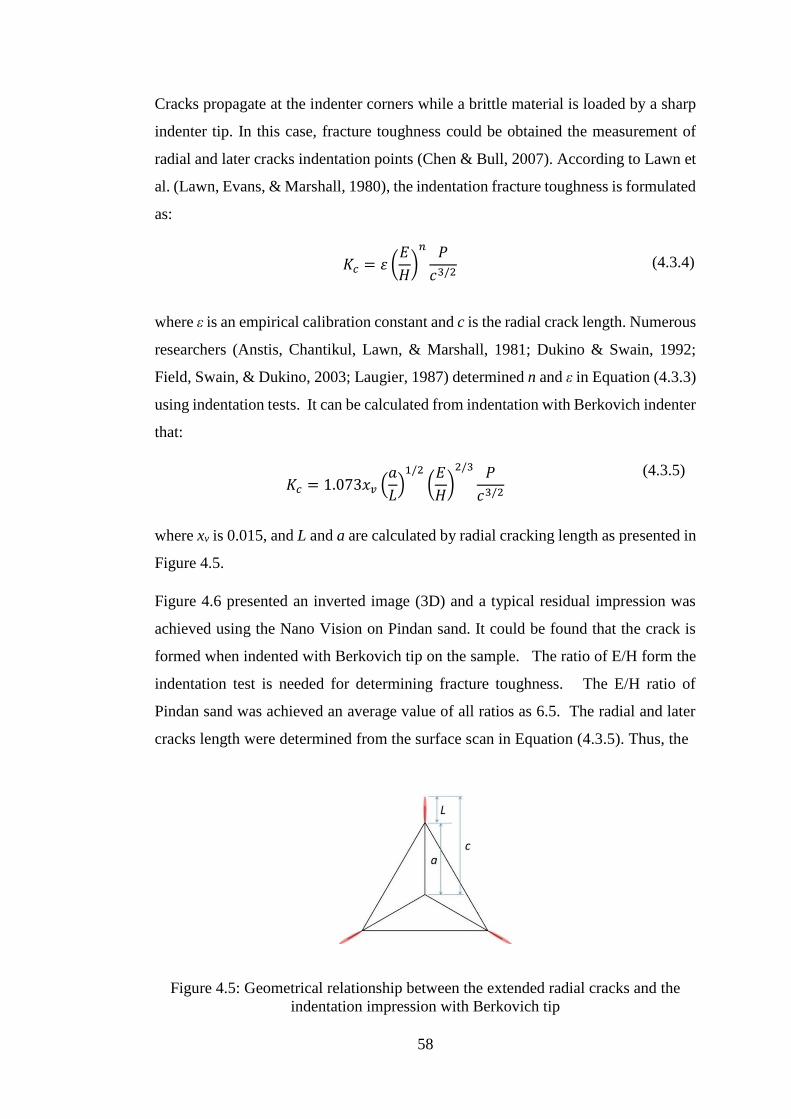
58
Cracks propagate at the indenter corners while a brittle material is loaded by a sharp
indenter tip. In this case, fracture toughness could be obtained the measurement of
radial and later cracks indentation points (Chen & Bull, 2007). According to Lawn et
al. (Lawn, Evans, & Marshall, 1980), the indentation fracture toughness is formulated
as:
𝐾𝑐 = 𝜀 (𝐸
𝐻)
𝑛 𝑃
𝑐3/2 (4.3.4)
where ε is an empirical calibration constant and c is the radial crack length. Numerous
researchers (Anstis, Chantikul, Lawn, & Marshall, 1981; Dukino & Swain, 1992;
Field, Swain, & Dukino, 2003; Laugier, 1987) determined n and ε in Equation (4.3.3)
using indentation tests. It can be calculated from indentation with Berkovich indenter
that:
𝐾𝑐 = 1.073𝑥𝑣 (𝑎
𝐿)
1/2
(𝐸
𝐻)
2/3 𝑃
𝑐3/2
(4.3.5)
where xv is 0.015, and L and a are calculated by radial cracking length as presented in
Figure 4.5.
Figure 4.6 presented an inverted image (3D) and a typical residual impression was
achieved using the Nano Vision on Pindan sand. It could be found that the crack is
formed when indented with Berkovich tip on the sample. The ratio of E/H form the
indentation test is needed for determining fracture toughness. The E/H ratio of
Pindan sand was achieved an average value of all ratios as 6.5. The radial and later
cracks length were determined from the surface scan in Equation (4.3.5). Thus, the
Figure 4.5: Geometrical relationship between the extended radial cracks and the
indentation impression with Berkovich tip

59
Figure 4.6: Inverted 3D image (left) and residual impression (right)
obtained median value of the fracture toughness of Pindan sand was 3.7 ± 0.5 MPa
m1/2.
Similarly, the indentation load-displacement curve can be taken into account when
considering the energy delivered during loading and unloading (Warren Carl Oliver
& Pharr, 1992). The area under the load (Ploading) and unloading (Punloading) versus the
indentation displacement (h) curves represents the plastic energy (Wp) and elastic
energy (We). The total energy (Wt) is the sum of Wp and We, or the total area under the
load-displacement curve. By fitting the loading and unloading curve with power load
function (Warren C Oliver & Pharr, 2004), Wt and We can be obtained as:
𝑊𝑡 = ∫ 𝑃𝑙𝑜𝑎𝑑𝑖𝑛𝑔𝑑ℎℎ𝑚𝑎𝑥
0
(4.3.6a)
𝑊𝑒 = ∫ 𝑃𝑢𝑛𝑙𝑜𝑎𝑑𝑖𝑛𝑔𝑑ℎℎ𝑚𝑎𝑥
ℎ𝑟
(4.3.6b)
The relationship between Wp/Wt and hr/hmax can be expressed as (Chen & Bull, 2007;
Cheng & Cheng, 2004):
𝑊𝑝
𝑊𝑡= 1 − [
1−3(ℎ𝑟
ℎ𝑚𝑎𝑥)
2+2(
ℎ𝑟ℎ𝑚𝑎𝑥
)3
1−(ℎ𝑟
ℎ𝑚𝑎𝑥)
2 ] (4.3.7)
The total indentation work Wt can be determined from:
𝑊𝑡 = 𝑊𝑝 + 𝑈𝑓𝑟𝑎𝑐𝑡𝑢𝑟𝑒 + 𝑊𝑒 + 𝑊𝑜𝑡ℎ𝑒𝑟 (4.3.8)
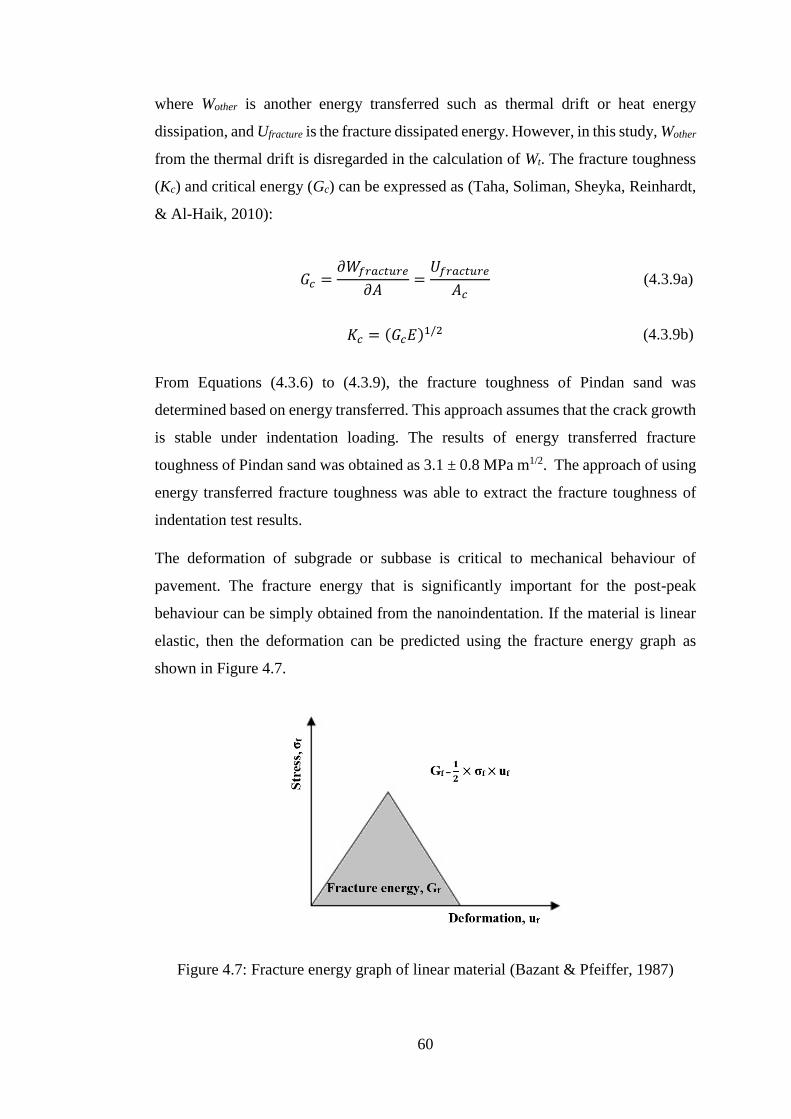
60
where Wother is another energy transferred such as thermal drift or heat energy
dissipation, and Ufracture is the fracture dissipated energy. However, in this study, Wother
from the thermal drift is disregarded in the calculation of Wt. The fracture toughness
(Kc) and critical energy (Gc) can be expressed as (Taha, Soliman, Sheyka, Reinhardt,
& Al-Haik, 2010):
𝐺𝑐 =𝜕𝑊𝑓𝑟𝑎𝑐𝑡𝑢𝑟𝑒
𝜕𝐴=
𝑈𝑓𝑟𝑎𝑐𝑡𝑢𝑟𝑒
𝐴𝑐 (4.3.9a)
𝐾𝑐 = (𝐺𝑐𝐸)1/2 (4.3.9b)
From Equations (4.3.6) to (4.3.9), the fracture toughness of Pindan sand was
determined based on energy transferred. This approach assumes that the crack growth
is stable under indentation loading. The results of energy transferred fracture
toughness of Pindan sand was obtained as 3.1 ± 0.8 MPa m1/2. The approach of using
energy transferred fracture toughness was able to extract the fracture toughness of
indentation test results.
The deformation of subgrade or subbase is critical to mechanical behaviour of
pavement. The fracture energy that is significantly important for the post-peak
behaviour can be simply obtained from the nanoindentation. If the material is linear
elastic, then the deformation can be predicted using the fracture energy graph as
shown in Figure 4.7.
Figure 4.7: Fracture energy graph of linear material (Bazant & Pfeiffer, 1987)

61
4.4 Summary
The results are based on nanoindentation experiments on Pindan sand. Based on the
results of this investigation, the following conclusion can be made:
1) An application of nanoindentation technique is successfully applied to the
microporomechanics of Pindan sand. Statistical analysis based on
deconvolution technique is performed to obtain the physical properties of
Pindan.
2) Hardness, elastic modulus, and packing density of Pindan sand are
determined as 10.6 ± 0.9 GPa, 68.1 ± 12.7 GPa and 0.863 ± 0.032,
respectively. Based on microporomechanics, stiffness and cohesion are
obtained as 92.7 GPa and 4.1 GPa, respectively.
3) The results of the fracture toughness of Pindan sand based on the energy
transferred and the measurement of radial and later cracks indentation points
are obtained as 3.1 ± 0.8 MPa m1/2 and 3.7 ± 0.5 MPa m1/2, respectively. The
difference between the two results is because other energy (Wother) was
ignored in the calculation of the total indentation work (Wt).

62
Chapter 5
5 Stabilisation of Broom-Pindan
5.1 Introduction
Strength is one of the critical components of a material and one of the essential
elements in road design to resist the stresses imposed and prevent deformation (Sharp
& Andrews, 2009). Sometimes it is necessary to strengthen the ability of the road
material to build roads. Depending on soil characteristics or construction site
conditions, soil stabilisation methods can be selected. There are generally two
stabilisations that are commonly used for soil stabilisation. Mechanical stabilisation
enhances soil strength by applying loads to the soil, and chemical stabilization
improves soil strength by using chemical stabilisers such as cement, lime, fly ash and
polymers. The process of strengthening road materials with additives is called
stabilisation. According to recent studies, polymers for soil stabilisation provide a
high water resistance and good physical properties. Polymers play an important role
in coating and bonding aggregates, therefore the polymer’s ability is directly applied
to enhance strength and physical bonding (Welling, 2012).
Pindan has limited information on the fundamental interaction with polymers and on
the stabilisation mechanism and properties for road pavement. Soils from Broom,
commonly known as Pindan, are tested with Polymers as the stabilising agent. Three
polymer commercial products from Australia are used in the study. There are several
important processes for sample testing; selection of suitable polymers, appropriate
amount of polymer and water, the mixing and curing process, and appropriate
methods for testing of stabilised materials.
In this chapter, the properties of Pindan soil were examined to determine its
microstructure, chemical and mechanical properties, and Pindan soils stabilised with
polymer stabilisers were evaluated to determine the performance of polymer-based
products, and the chemical and microstructural reactions between Pindan and
Polymer. The bonding mechanisms and the effects of polymer on Pindan soils were
investigated using the production of Broome-Pindan soils stabilised with polymers.
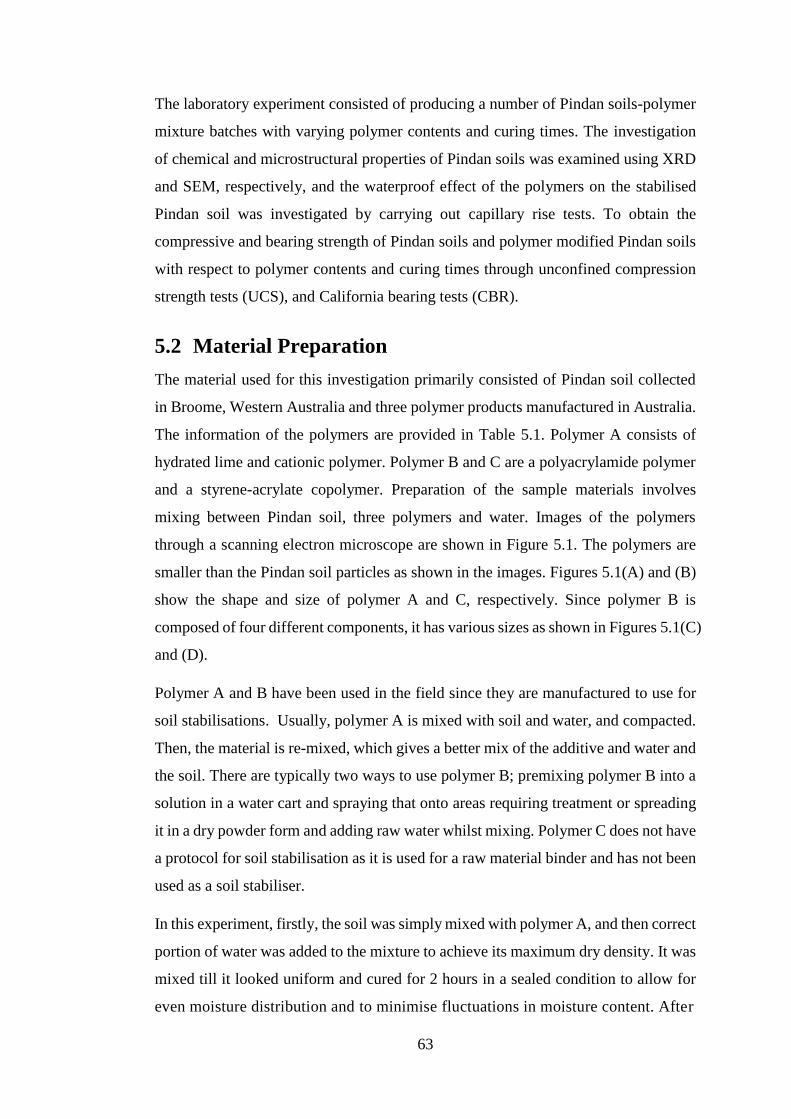
63
The laboratory experiment consisted of producing a number of Pindan soils-polymer
mixture batches with varying polymer contents and curing times. The investigation
of chemical and microstructural properties of Pindan soils was examined using XRD
and SEM, respectively, and the waterproof effect of the polymers on the stabilised
Pindan soil was investigated by carrying out capillary rise tests. To obtain the
compressive and bearing strength of Pindan soils and polymer modified Pindan soils
with respect to polymer contents and curing times through unconfined compression
strength tests (UCS), and California bearing tests (CBR).
5.2 Material Preparation
The material used for this investigation primarily consisted of Pindan soil collected
in Broome, Western Australia and three polymer products manufactured in Australia.
The information of the polymers are provided in Table 5.1. Polymer A consists of
hydrated lime and cationic polymer. Polymer B and C are a polyacrylamide polymer
and a styrene-acrylate copolymer. Preparation of the sample materials involves
mixing between Pindan soil, three polymers and water. Images of the polymers
through a scanning electron microscope are shown in Figure 5.1. The polymers are
smaller than the Pindan soil particles as shown in the images. Figures 5.1(A) and (B)
show the shape and size of polymer A and C, respectively. Since polymer B is
composed of four different components, it has various sizes as shown in Figures 5.1(C)
and (D).
Polymer A and B have been used in the field since they are manufactured to use for
soil stabilisations. Usually, polymer A is mixed with soil and water, and compacted.
Then, the material is re-mixed, which gives a better mix of the additive and water and
the soil. There are typically two ways to use polymer B; premixing polymer B into a
solution in a water cart and spraying that onto areas requiring treatment or spreading
it in a dry powder form and adding raw water whilst mixing. Polymer C does not have
a protocol for soil stabilisation as it is used for a raw material binder and has not been
used as a soil stabiliser.
In this experiment, firstly, the soil was simply mixed with polymer A, and then correct
portion of water was added to the mixture to achieve its maximum dry density. It was
mixed till it looked uniform and cured for 2 hours in a sealed condition to allow for
even moisture distribution and to minimise fluctuations in moisture content. After

64
Table 5.1: Polymer Information
Polymer A Polymer B Polymer C
Recommended
Use Soil stabiliser Soil stabiliser
raw material
binder
manufacturers'
recommended
dosage
1.5% 0.002% N/P
Polymer Active
Range 1.0% - 3.0% 0.001% - 0.003% 0.5% - 1.0%
Polymer Type
Cationic Polymer
(with Hydrated
Lime)
Anionic
Polyacrylamides
Styrene - Acrylate
Copolymer
Form Powder Powder Powder
solubility in water Insoluble Miscible dispersible
Figure 5.1: Microscope Images of Polymers. (A) Polymer A, (B) Polymer C, (C)
and (D) Polymer B.
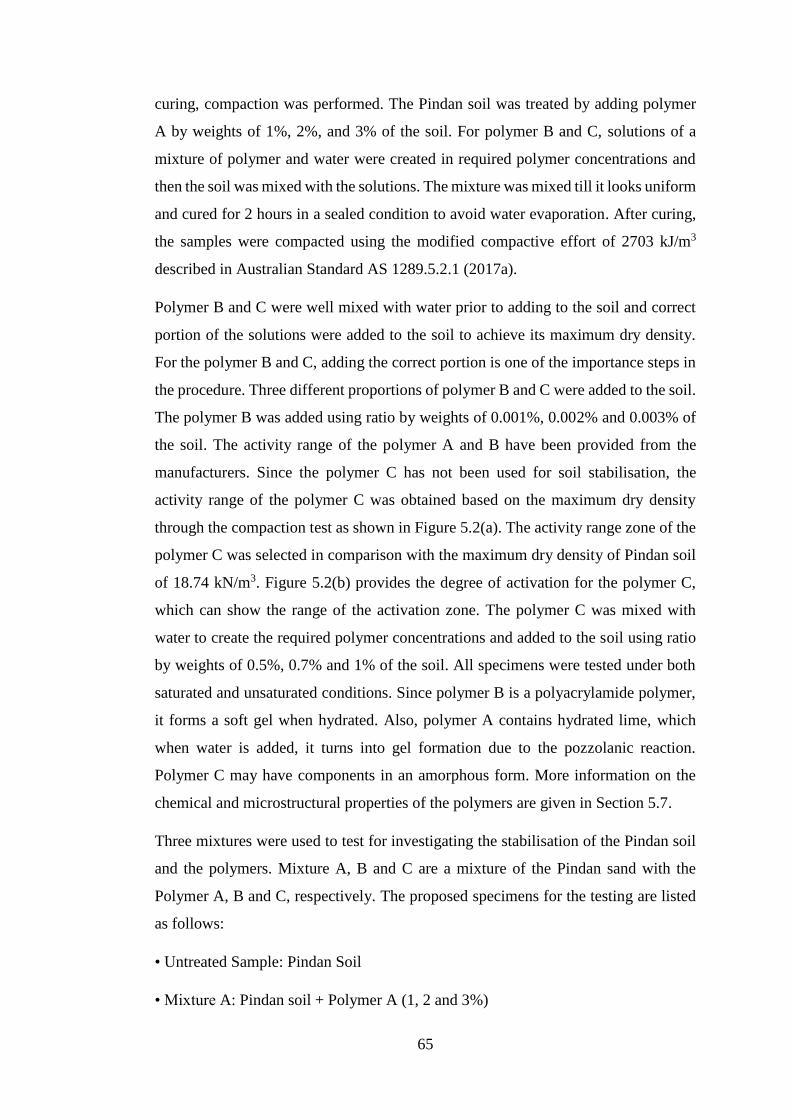
65
curing, compaction was performed. The Pindan soil was treated by adding polymer
A by weights of 1%, 2%, and 3% of the soil. For polymer B and C, solutions of a
mixture of polymer and water were created in required polymer concentrations and
then the soil was mixed with the solutions. The mixture was mixed till it looks uniform
and cured for 2 hours in a sealed condition to avoid water evaporation. After curing,
the samples were compacted using the modified compactive effort of 2703 kJ/m3
described in Australian Standard AS 1289.5.2.1 (2017a).
Polymer B and C were well mixed with water prior to adding to the soil and correct
portion of the solutions were added to the soil to achieve its maximum dry density.
For the polymer B and C, adding the correct portion is one of the importance steps in
the procedure. Three different proportions of polymer B and C were added to the soil.
The polymer B was added using ratio by weights of 0.001%, 0.002% and 0.003% of
the soil. The activity range of the polymer A and B have been provided from the
manufacturers. Since the polymer C has not been used for soil stabilisation, the
activity range of the polymer C was obtained based on the maximum dry density
through the compaction test as shown in Figure 5.2(a). The activity range zone of the
polymer C was selected in comparison with the maximum dry density of Pindan soil
of 18.74 kN/m3. Figure 5.2(b) provides the degree of activation for the polymer C,
which can show the range of the activation zone. The polymer C was mixed with
water to create the required polymer concentrations and added to the soil using ratio
by weights of 0.5%, 0.7% and 1% of the soil. All specimens were tested under both
saturated and unsaturated conditions. Since polymer B is a polyacrylamide polymer,
it forms a soft gel when hydrated. Also, polymer A contains hydrated lime, which
when water is added, it turns into gel formation due to the pozzolanic reaction.
Polymer C may have components in an amorphous form. More information on the
chemical and microstructural properties of the polymers are given in Section 5.7.
Three mixtures were used to test for investigating the stabilisation of the Pindan soil
and the polymers. Mixture A, B and C are a mixture of the Pindan sand with the
Polymer A, B and C, respectively. The proposed specimens for the testing are listed
as follows:
• Untreated Sample: Pindan Soil
• Mixture A: Pindan soil + Polymer A (1, 2 and 3%)

66
• Mixture B: Pindan soil + Polymer B (0.001, 0.002 and 0.003%)
• Mixture C: Pindan soil + Polymer C (0.5, 0.7 and 1%)
The specimens were prepared by well mixing the Pindan soil with the desired
percentage of the polymers in the mixtures for the treated sample. The samples were
compacted for the relative compaction values of 93% and 98% of maximum dry
density at its optimum moisture content using the modified proctor compaction
method for CBR and UCS tests, respectively. Experiments of compaction, strengths,
XRD and SEM were conducted to investigate the properties of Pindan soil, and the
results were compared to find out the interaction of between the physical properties
and the microstructural properties.
(a)
(b)
Figure 5.2: Polymer C Active Range Zone. (a) Maximum dry density versus
Polymer content, (b) Degree of Activation for Polymer C.

67
5.3 Modified Compaction Test
Earthwork is important when designing the pavement structures, because the
behaviour of the unsealed road depends on the behaviour of the deposits of soil.
Compaction is applied to improve the engineering properties of road materials and to
withstand repeated loads from vehicles. Soil compaction is the process of increasing
the soil density by reducing the space between soil particles by applying force.
Reduction of pore space is accompanied by increase in soil density, and in laboratory
conditions, an increase in soil density is generally seen as an increase in soil strength
due to adding more soil. Adding water during the compaction process allows soil
particles to slip more easily, which cause more reducing pore spaces and increasing
density and soil strength. According to Rahman et al. (2011), the relative compaction
of more than 95% of the standard proctor compaction test in the road construction is
usable for heavy vehicle and 90 to 95% for all other vehicles. In this chapter,
compaction tests provide the optimum moisture content (OMC) and maximum dry
unit weight (MDD) of the Pindan soil with and without polymer stabilisers added.
Dry unit weights are obtained at various moisture contests, and the OMC and MDD
properties are obtained by plotting the compaction curves. The OMC obtained from
the compaction curves was used in the unconfined compressive strength test and the
California bearing ratio test.
The soil was mixed with polymer A, and then the correct portion of water was added.
For polymers B and C, solutions of the mixture of the polymer and water were created
and added to the soil. The mixture was mixed until the colour of the mixture looks
uniform and cured for 2 hours in a sealed condition. A cylindrical metal mould of an
internal dimeter of 105mm and effective height of 115.5mm, and a rammer were
prepared in accordance with AS 1289.5.2.1 (2017). After curing, the samples were
compacted in five layers at 25 blows per layer using the modified compactive effort
(2703 kJ/m3) as described in Australian Standard AS 1289.5.2.1 (2017a). The
modified proctor test was used to determine the dry density in various moisture
contents for the Pindan soil and the mixtures. Figure 5.3 illustrates the compaction
curves within the same scale to compare the untreated and treated samples. The results
of the modified proctor compaction test for the Pindan soil and the mixtures A, B and
C are presented in Figures 5.4(a), (b), (c) and (d), respectively. Table 5.2 provides the

68
optimum moisture contents and maximum dry density values obtained from the
moisture-density relationship curve of the compacted samples.
As can be seen in Figure 5.3, the effect of adding the polymers on the moisture-density
relationship for the Pindan soil can be assessed through the compaction test results.
Comparing the optimum moisture content (OMC) and maximum dry density (MDD)
between the untreated sample and all mixtures, all polymers reduced OMC and
increased MDD values. The mixture can reduce the required water content to achieve
the maximum dry density, which is desirable for the construction of the Kimberley
region. However, the dry unit weigh was getting rapidly reduced after each OMC and
the dry density decreased to or below the dry unit weigh of the untreated sample. The
changes in OMC and MDD of mixture C were significantly large when compared to
other samples. Mixture C minimized the OMC and indicated the maximum MDD.
However, as shown in the graph in Figure 5.3, the MDD of the mixture C after the
OMC point dropped sharply and recorded the lowest value in the MDD. When using
polymers for soil stabilisation, it may not be desirable to use more water than
necessary, especially when polymer C is used, MDD and strength might be greatly
affected by the amount of water. The increase in density is probably because the
polymers filled the pore space and reduced the porosity of the treated samples. This
is explained further with SEM images in Section 5.7.
Figure 5.3: Comparison of the untreated sample and the treated samples
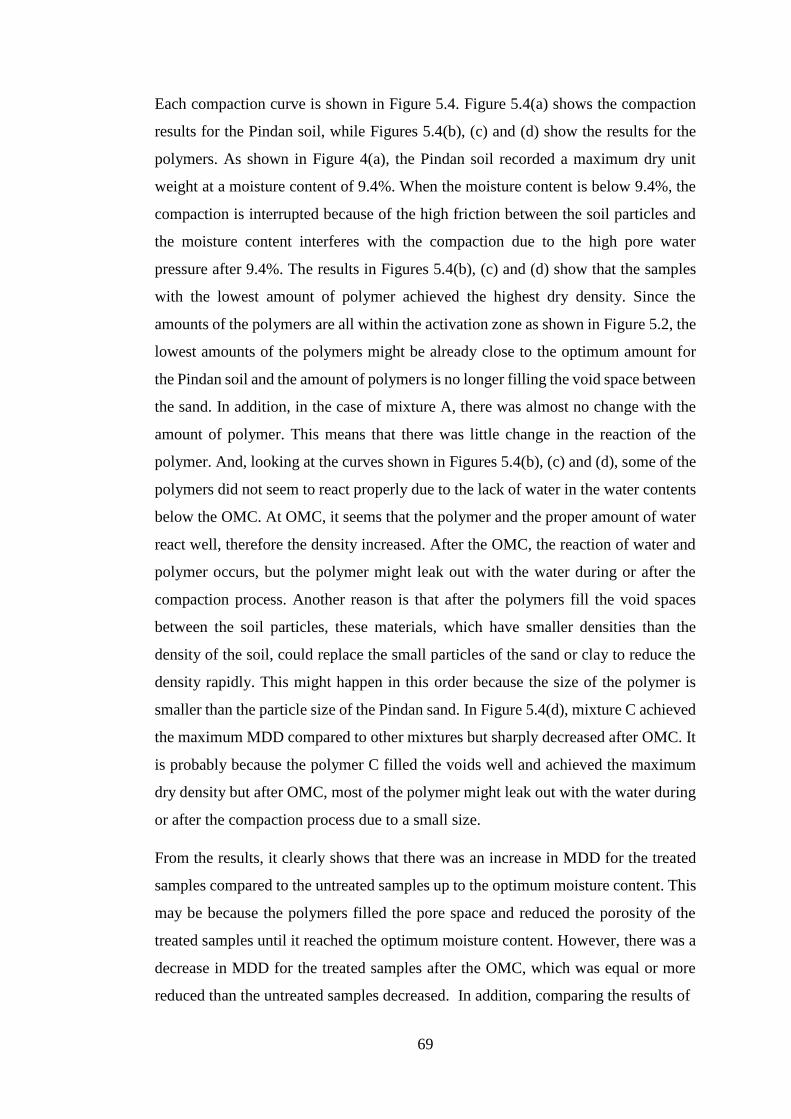
69
Each compaction curve is shown in Figure 5.4. Figure 5.4(a) shows the compaction
results for the Pindan soil, while Figures 5.4(b), (c) and (d) show the results for the
polymers. As shown in Figure 4(a), the Pindan soil recorded a maximum dry unit
weight at a moisture content of 9.4%. When the moisture content is below 9.4%, the
compaction is interrupted because of the high friction between the soil particles and
the moisture content interferes with the compaction due to the high pore water
pressure after 9.4%. The results in Figures 5.4(b), (c) and (d) show that the samples
with the lowest amount of polymer achieved the highest dry density. Since the
amounts of the polymers are all within the activation zone as shown in Figure 5.2, the
lowest amounts of the polymers might be already close to the optimum amount for
the Pindan soil and the amount of polymers is no longer filling the void space between
the sand. In addition, in the case of mixture A, there was almost no change with the
amount of polymer. This means that there was little change in the reaction of the
polymer. And, looking at the curves shown in Figures 5.4(b), (c) and (d), some of the
polymers did not seem to react properly due to the lack of water in the water contents
below the OMC. At OMC, it seems that the polymer and the proper amount of water
react well, therefore the density increased. After the OMC, the reaction of water and
polymer occurs, but the polymer might leak out with the water during or after the
compaction process. Another reason is that after the polymers fill the void spaces
between the soil particles, these materials, which have smaller densities than the
density of the soil, could replace the small particles of the sand or clay to reduce the
density rapidly. This might happen in this order because the size of the polymer is
smaller than the particle size of the Pindan sand. In Figure 5.4(d), mixture C achieved
the maximum MDD compared to other mixtures but sharply decreased after OMC. It
is probably because the polymer C filled the voids well and achieved the maximum
dry density but after OMC, most of the polymer might leak out with the water during
or after the compaction process due to a small size.
From the results, it clearly shows that there was an increase in MDD for the treated
samples compared to the untreated samples up to the optimum moisture content. This
may be because the polymers filled the pore space and reduced the porosity of the
treated samples until it reached the optimum moisture content. However, there was a
decrease in MDD for the treated samples after the OMC, which was equal or more
reduced than the untreated samples decreased. In addition, comparing the results of

70
(a)
(b)
(c)
(d)
Figure 5.4: Compaction Test using the Modified Proctor Compaction Method.
(a) Pindan soil, (b) Mixture A, (c) Mixture B, and (d) Mixture C.

71
Table 5.2: Optimum Moisture Contents (OMC) and Maximum Dry Density (MDD)
of Broome-Pindan Soil and Mixtures
Modified Proctor Compaction Test
Sample OMC (%) MDD (kN/m3)
Untreated Pindan Soil 9.4 18.74
Mixture A (1% Polymer) 8.6 19.05
Mixture A (2% Polymer) 8.2 18.80
Mixture A (3% Polymer) 8.2 18.90
Mixture B (0.001%
Polymer) 8.3 19.21
Mixture B (0.002%
Polymer) 8.2 19.15
Mixture B (0.003%
Polymer) 8.0 19.19
Mixture C (0.5%
Polymer) 7.4 19.70
Mixture C (0.7%
Polymer) 7.2 19.40
Mixture C (1.0%
Polymer) 7.2 19.42
the OMC and MDD for the Pindan soil under the different compaction effort; the
standard compaction effort in Chapter 3 and the modified compaction as shown in
Figure 5.4(a), there was a decrease in OMC and an increase in MDD when the
compaction effort was increased.
5.4 Capillary Rise
Capillary rise refers to the action of groundwater being sucked upward through pore
spaces in the soil by the action of two forces, cohesive and adhesion forces. It is a
phenomenon that occurs between the cohesive force, which is the force that water and
water want to bond with each other, and the adhesive force, which is the force that
water attaches to another substance. That is, the forces that pull each other in the
contact area between the water particles and the soil particles, and the water, refer to

72
the forces through hydrogen bonding to each other. This is a phenomenon in which
water moves up through the soil particles due to adhesion, cohesion and surface
tension. The capillary action of the water is high when the adhesion is greater than the
cohesion force. For example, water in a thin tube has stronger adhesion due to the
bonds that form between water and the tube wall than water in a larger tube. When
the capillary action occurs in the soil, it depends largely on the pore size, because the
water rises up through the spaces between the soil particles against gravity. And,
because the capillary rise is higher with smaller soil pores, sand with smaller particles
has higher capillary rise than sand with larger particles (Moore, 1939).
Capillary rise of the compacted Pindan materials was performed for testing the
stabilised Pindan soils to assess the waterproofing effect of the polymers in
accordance with testing guideline specified in Australian standard AS1141.53
(1996a). This test can simply evaluate the performance of the polymers with the
Pindan soil to determine whether the polymers can improve the performance of the
Broome-Pindan soil in wet conditions. This chapter details the performance of the
untreated and treated samples and confirms that the polymer-stabilised Broome-
Pindan soil can be used as a pavement material. The Pindan soil was treated with
polymer A, B and C at the rate of 2%, 0.002% and 0.7% by weight, respectively. The
samples were compacted to 98% of the OMC using the modified proctor compaction
method and cured for 16 days in a humidity cabinet. The temperature of the cabinet
remained in the range of 21°C to 25°C at 90% humidity. The test was carried out
according to the test procedure detailed in AS1141.53 (1996a). The samples A, B and
C are the compacted mixtures A, B and C, respectively.
Figure 5.5 presented the capillary rise (CR) as a percentage of the specimen height
using the Equation (5.4.1) as provided in AS 1141.53 (1996a):
CR = ℎ
𝐻 × 100 (5.4.1)
where CR is a capillary rise in the sample, h is a height of the capillary rise and H is
an initial height of the sample. The compacted samples were placed in 10 mm deep
of water at a room temperature for 72 hours.
Water risen approximately 20 mm for the untreated sample and sample C within 1
minute. For the sample B, water risen approximately 30 mm within 1 minute. In the

73
case of sample A, there was no change within 1 minute. Two minutes after the start,
the untreated sample and sample B started to slump from the surface and the water
risen up to 30 mm and 50 mm, respectively. And, the water risen up to 5 mm and 35
mm for samples A and C, respectively. The water risen up to 20 mm and dropped
again to 0 mm for polymer A. The untreated sample and polymer C sample were risen
the water similarly and fully saturated after around 2.5 hours from the start. And,
polymer B sample was fully saturated within 2 hours from the start. The surface of
the untreated sample and sample B started to slump when the samples were placed in
10mm of water and the untreated sample was completely collapsed after around 1.5
hours after the fully saturated point, and sample B initially seemed to have an effect
on the surface, but after that it was no longer affected by water. The all treated samples
remained unchanged and seemed to maintain some strength as well as shape. Sample
A almost did not change at all and maintain the sample in a dry condition. The
capillary rise did not occur very much, and it went down to the original water position
again for sample A. Polymer A provided more resistance to water ingress than other
polymers. Polymer A decreased the capillary rise rate and reduced the moisture
sensitivity significantly. The sample B and C were full saturated at about the similar
time as the untreated sample, but there appeared to be no change after that and it
seemed that they are stable unlike the untreated sample. Swelling (S) does not appear
on the treated samples after immersion, and the untreated sample could not be
measured as the sample shape was collapsed after saturated. It has been found that the
polymer could provide sufficient water resistance to the soil during long-term
exposure to water.
From the results, it clearly shows the capillary rise rate of the mixtures B and C was
higher than the untreated sample. There is the Lucas-Washburn equation for the rise
of the capillary (H) with time (t) as (Dimitrov, Milchev, & Binder, 2007):
H(t)= (
γLV Rcosθ
2ŋ)
1⁄2
√𝑡 (5.4.2)
where γLV
is the surface tension of the liquid, R is the pore radius, ŋ is the shear
viscosity of the liquid. In this study, water was used as a liquid in all capillary rise
test, so the pore radius governs the rate of the capillary rise. Based on the equation,
polymers B and C filled the void spaces and thereby reduced the void size of the
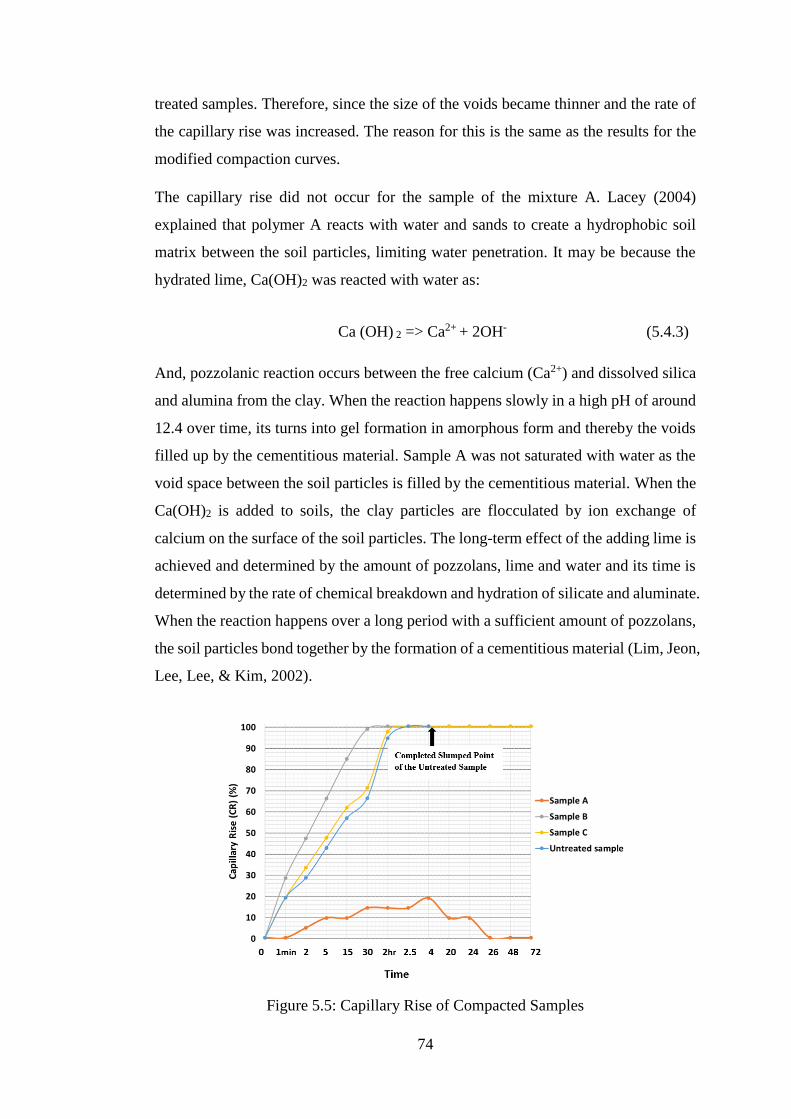
74
treated samples. Therefore, since the size of the voids became thinner and the rate of
the capillary rise was increased. The reason for this is the same as the results for the
modified compaction curves.
The capillary rise did not occur for the sample of the mixture A. Lacey (2004)
explained that polymer A reacts with water and sands to create a hydrophobic soil
matrix between the soil particles, limiting water penetration. It may be because the
hydrated lime, Ca(OH)2 was reacted with water as:
Ca (OH) 2 => Ca2+ + 2OH- (5.4.3)
And, pozzolanic reaction occurs between the free calcium (Ca2+) and dissolved silica
and alumina from the clay. When the reaction happens slowly in a high pH of around
12.4 over time, its turns into gel formation in amorphous form and thereby the voids
filled up by the cementitious material. Sample A was not saturated with water as the
void space between the soil particles is filled by the cementitious material. When the
Ca(OH)2 is added to soils, the clay particles are flocculated by ion exchange of
calcium on the surface of the soil particles. The long-term effect of the adding lime is
achieved and determined by the amount of pozzolans, lime and water and its time is
determined by the rate of chemical breakdown and hydration of silicate and aluminate.
When the reaction happens over a long period with a sufficient amount of pozzolans,
the soil particles bond together by the formation of a cementitious material (Lim, Jeon,
Lee, Lee, & Kim, 2002).
Figure 5.5: Capillary Rise of Compacted Samples

75
5.5 Unconfined Compressive Strength Test
Unconfined Compressive Strength (UCS) test was conducted according to the
Australian Standard AS 5101.4 (2008). A cylindrical metal mould and a rammer were
prepared in accordance with AS 1289.5.2.1 (2017a). The specimens were compacted
in five layers at 25 blows per layer using modified compactive effort of 2703 kJ/m3
as detailed in AS 1289.5.2.1 (2017a). UCS testing was performed on untreated and
treated samples at two different curing times of 1 hour and 16 days. One hour curing
is conducted to assess when the road opens to the public immediately after road
construction or repair. 16day curing is to assess the change in strength over time after
road stabilisation. The effect of using three different polymers on compressive
strength of the untreated and treated samples under unconfined conditions was
assessed using the UCS testing. The test was conducted at loading rate of 1 mm per
minute as described in AS 5101.4 (2008).
Typical graphs of UCS for 1 hour cured samples are presented graphically in Figure
5.6(a). The samples were cured for 1 hour prior to testing. The average of UCS data
is presented in Table 5.3 for each samples. All UCS data is included in detail in
Appendix A. The samples were selected using the standard deviation with 90%
confidence level. In Table 5.3, an increase in strain and compressive stress was
recorded for all samples treated with the polymers as compared to the untreated
samples. Polymers A and C showed the greatest increase in strain and polymer B
showed the greatest increase in compressive stress. For 16 day curing samples, the
samples were compacted to 98% of the MDD using the modified proctor compaction
method and cured for 16 days in a humidity cabinet after extrusion. The temperature
of the cabinet remained in the range of 21°C to 25°C at 90% humidity for 16days.
Stress versus strain data for the samples are graphically provided in Figure 5.6(b).
The average of the maximum UCS values of the 16day cured samples for the
untreated and treated samples are presented in Table 5.4. The results were also
selected using the standard deviation with the 90% confidence interval.
In 1 hour curing condition, the average UCS value of untreated soil samples was 34.7
kPa and all treated samples showed better UCS values ranging from 37.7 to 49.1 kPa
as shown in Table 5.3. In particular, polymer B increased the strength the most. In 16
day curing condition, the UCS value of 1021 kPa for the samples with no stabiliser
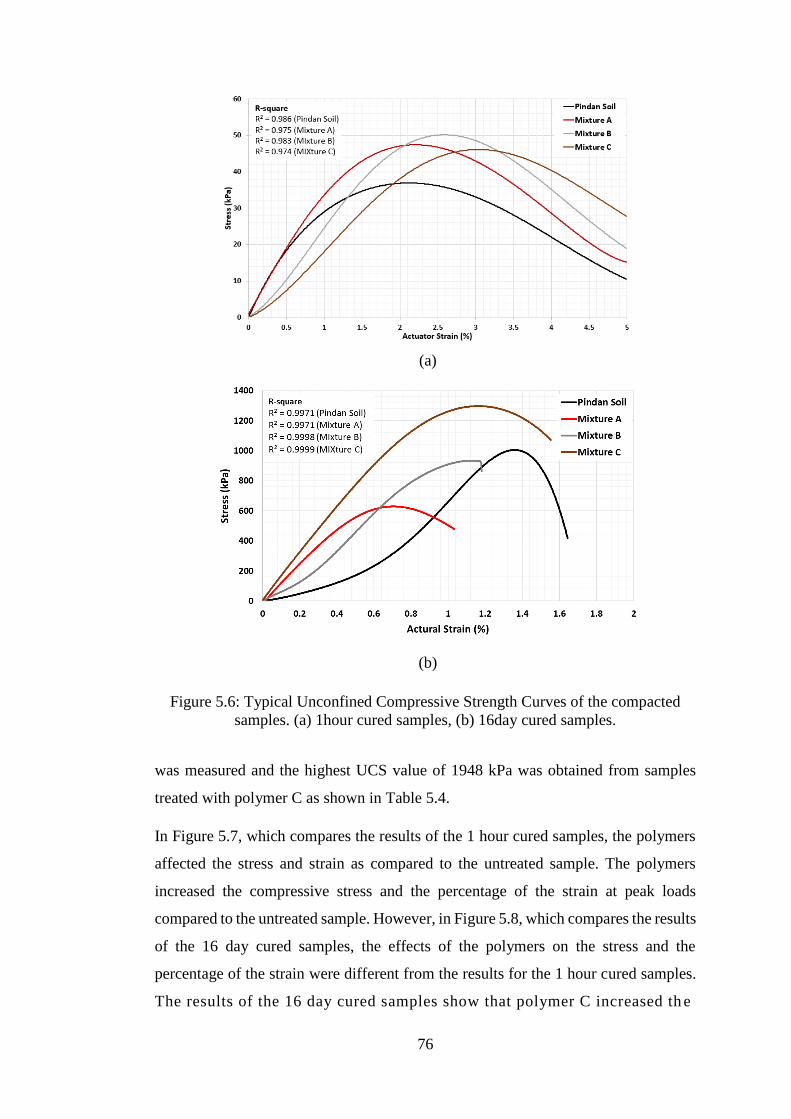
76
Figure 5.6: Typical Unconfined Compressive Strength Curves of the compacted
samples. (a) 1hour cured samples, (b) 16day cured samples.
was measured and the highest UCS value of 1948 kPa was obtained from samples
treated with polymer C as shown in Table 5.4.
In Figure 5.7, which compares the results of the 1 hour cured samples, the polymers
affected the stress and strain as compared to the untreated sample. The polymers
increased the compressive stress and the percentage of the strain at peak loads
compared to the untreated sample. However, in Figure 5.8, which compares the results
of the 16 day cured samples, the effects of the polymers on the stress and the
percentage of the strain were different from the results for the 1 hour cured samples.
The results of the 16 day cured samples show that polymer C increased th e
(a)
(b)

77
Table 5.3: Averages of UCS Results for the 1 hour cured samples
UCS – 1 hour Curing Samples
Sample Actuator strain at peak load
(%)
Peak compressive strength
(kPa)
Pindan Sand 2.25 34.67
Mixture A (1%) 2.28 37.67
Mixture A (2%) 2.78 38.5
Mixture A (3%) 3.15 39.17
Mixture B
(0.001%)
2.53 48.5
Mixture B
(0.002%)
2.43 48.8
Mixture B
(0.003%)
2.48 49.1
Mixture C (0.5%) 2.55 38.5
Mixture C (0.7%) 2.93 43.8
Mixture C (1.0%) 3.20 44.4
Table 5.4: Averages of UCS Results for the 16 day cured samples
UCS – 16 day Curing Samples
Sample Actuator strain at peak load
(%)
Peak compressive strength
(kPa)
Pindan Sand 1.26 1021
Mixture A (1%) 0.83 603
Mixture A (2%) 0.83 762
Mixture A (3%) 0.88 628
Mixture B
(0.001%)
0.89 895
Mixture B
(0.002%)
1.28 949
Mixture B
(0.003%)
1.02 979
Mixture C (0.5%) 1.10 1313
Mixture C (0.7%) 1.37 1648
Mixture C (1.0%) 1.34 1948
compressive strength as compared to the untreated sample, but polymers A and B
caused a decrease in strength and strain. Regarding strength, the strength increased as
the amount of polymer increased regardless of curing age except for the 16 day cured
78
sample of mixture A. In the case of the strain, the strain was also increased when the
amount of polymers was increased similar to the strength except for polymer B. In
particular, polymer C seems to have the most effect on the strain increase. However,
the strain at peak loads seems to have less relation with the amount of polymers over
time.
Polymer A influenced the colour of the sample and showed micro-cracks on the
surface of the sample during curing as shown in Figure 5.9. Thus, the results of both
stress and strain were reduced. This may be just due to shrinkage cracking or due to
carbonation of the hydrated lime, or could be the corrosion due to iron-hydroxide (i.e.
Fe(OH)2). Polymer B had no significantly effect on the stress of the 16 day cured
samples while had significantly effect on the stress of the 1 hour cured samples, and
polymer C significantly increased strength as compared to the 16 day cured untreated
samples and other polymer mixtures. Polymer B caused a blow at the point of failure,
which seems to occur when the bonding was broken at one time. Polymer B changed
the properties of the soil from ductile behaviour to brittle behaviour as shown in
Figure 5.6(b). When polymers A and C were observed on the curves of the 16 day
cured samples, the curves appeared to fall slightly more slowly in strength after the
ultimate tensile strengths, while the untreated sample sharply decreased. It seems to
be due to the polymer holding between the soil particles.
From the results, when compared to the performance of soil with no stabilisers in one
hour curing condition, it appears that all treated samples provide higher strength and
strain. This may be because the polymer reacts with the soil and water to increase the
strength, or the polymer may increase the density by filling voids between the soil
particles and thereby increase the strength. In 16day curing condition, polymer A
seemed to cause a decrease in strength as micro-cracks occurred in the curing process,
while polymer C increased strength and strain. Polymer B did not significantly affect
strength, but changed the failure behaviour of the soil from ductile to brittle. In the
case of strength, the amount of polymers was increased, and it was increased
regardless of curing days. In the case of polymer A, the cause of micro-crack in the
curing process needs to be more studied and prevented to increase strength. The
effects of polymer B on the microstructure and the bonding structures should be
investigated to understand the change in failure behaviour. The change in
microstructure depending on the polymers is covered in Section 5.7.

79
Figure 5.7: UCS Results for 1 Hour curing
Figure 5.8: UCS Results for 16 Day curing

80
(a) (b)
Figure 5.9: UCS Samples. (a) Untreated Pindan Sample, (b) Mixture A
5.6 California Bearing Ratio (CBR)
CBR was performed in accordance with Australian Standard AS 1289.6.1.1 (2014).
The samples were compacted in five layers as described in AS 1289.6.1.1 (2014)
using modified compactive effort (2703 kJ/m3) as detailed in AS 1289.5.2.1 (2017a).
This test was performed immediately after compaction for unsoaked samples.
Samples were cured after compaction for 4 days in water to obtain bearing ratios for
soaked samples with or without polymer stabilisers. All CBR data is included in detail
in Appendix B. The results of CBR test for unsoaked and soaked conditions are
presented in Table 5.5. In the CBR test, when mixing the polymer C with Pindan sand,
the moisture content should not exceed the optimum moisture content. When the
amount of water greater than the optimum moisture content was added, the density of
the compacted sample dropped remarkably. In relation to this, the CBR values of the
samples also dropped significantly up to a CBR of 4 regardless of the amount of the
polymer.
The average CBR value of the untreated soil samples was measured to be around 19.
Most of the treated samples in both unsoaked and soaked conditions provided similar
or greater CBR values than the untreated samples. The unsoaked and soaked samples
did not show much different results. In the CBR test, mixture A showed the highest
CBR values of 30.13 and 26.18, respectively, in unsoaked and soaked conditions. And,
polymer C showed the lowest CBR values in both unsoaked and soaked conditions.
The 1% content of the polymer A did not affect the CBR value, which may increase
over time as shown in the UCS results. The reaction of the polymer might not be

81
started and the reaction would gradually take place over time. This also applies to all
polymers. The polymers might need more time to react to increase the CBR value.
The typical UCS graphs for samples with and without polymer stabilisers in unsoaked
and soaked conditions are presented in Figures 5.10(a) and (b), respectively. For CBR
values, the maximum values calculated for penetrations at 2.5 mm and 5.0 mm are
recorded as a CBR. In the case of mixture C, CBR was lower than the untreated
sample after penetration of 4 mm as shown in Figures 5.10(a) and (b). Therefore, the
CBR value of mixture C was recorded lower than the untreated sample at 5 mm
penetration. Polymer A showed higher CBR value as the amount of polymer increased,
whereas the CBR value decreased as polymer amount of polymer C increased. For
polymer B, it had the highest CBR values when the polymer ratio was 0.002% in both
unsoaked and soaked conditions. Pindan soil is known to be affected by water in the
field as a collapsible soil. Unlike the field, Pindan soil had no difference in strength
between the unsoaked and soaked samples in laboratory conditions. This is probably
due to the sample is a disturbed sample which is different to the conditions of the soil
in-situ.
Table 5.5: Averages of the CBR values for saturated and unsaturated samples
Sample
CBR (%)
Unsoaked Condition
Sample
Soaked Condition
Sample
Pindan Sand 19.05 19.08
Mixture A (1%) 18.64 18.91
Mixture A (2%) 22.87 20.20
Mixture A (3%) 30.13 26.18
Mixture B (0.001%) 24.39 18.35
Mixture B (0.002%) 25.03 25.25
Mixture B (0.003%) 23.31 24.24
Mixture C (0.5%) 23.88 19.53
Mixture C (0.7%) 20.11 18.35
Mixture C (1.0%) 11.11 9.68

82
(a)
(b)
Figure 5.10: Typical UCS. (a) Unsoaked Condition, (b) Soaked Condition.
The CBR test is generally used to evaluate the subgrade strength of roads and its value
can be used to determine the thickness of pavement layers. In general, the unsealed
pavements are used for low trafficked rural roads. The unsealed pavement design
should use the lowest CBR values, mostly from soaked samples. According to
Austroads Unsealed Pavements Design (2009), unsealed roads using Pindan soil
should be stabilised and must have a minimum compacted surfacing thickness of
100mm. It is not recommended to use polymer C as a road stabiliser since it reduced
CBR value to a CBR of 4. For subgrade layers, the minimum thickness for unsealed
road construction is 150mm based on the CBR results. The total pavement thickness
required for the stabilised Pindan soil is at least 250mm. Road failures are often
caused by structural weaknesses, and particularly unsealed roads are vulnerable to
water as water easily flow into road structures. Polymer A reduces water ingress into
83
the subgrade and minimises moisture in the base-course. Therefore, a stabilised base-
course maintains its strength and prevents deformation of subgrade structures, which
increases the lifetime of unsealed pavements. Polymer B also has economic benefits
in road design by stabilising the soil and increasing its strengths. However, in the case
of polymer A, it is necessary to investigate the cause of the micro-cracks generated
during the curing process of the UCS test. It should conduct a long-term study on the
influence of the CBR. If micro-cracks were affected by carbonation, they might also
affect the CBR values over time.
5.7 Chemical and Physical Bonding Mechanism
It is well known that material properties such as strength and shrinkage are affected
and related to the microstructures. However, the microstructure of Pindan soil is not
well investigated and information on the relationship between the microstructure and
strength of the Pindan soil have not been determined. In this chapter, the chemical
and microstructural properties of the Broom-Pindan soil with the three polymers have
been determined and the bonding mechanism between the Broome-Pindan soil and
the polymers has been introduced. Furthermore, the interaction of the bonding
mechanism with strength has been investigated.
X-ray diffraction (XRD) and Scanning Electron Microscope (SEM) were used in the
SM-Pindan sand and mixtures to investigate the chemical and microstructures. The
mixture is a mixture of SM-Pindan sand and the respective three polymers. The results
of the XRD analysis provide the chemical composition of the Pindan sand and
mixtures, and the results of the quantitative X-ray diffraction (QXRD) analysis
provide the quantitative numbers of chemical compositions for the Pindan sand. SEM
images of the microstructure of Pindan sand and the polymer bridges between sand
particles are shown in this chapter. And also, SEM pictures are accomplished with
each energy dispersive X-ray spectroscopy (EDS). EDS analysis is a quantitative X-
ray microanalysis used with SEM to determine the chemical composition of particles
and their relative proportions. There are three polymers for mixing with SM-Pindan
sand. Polymer A is a cationic polymer, B is a polyacrylamides polymer and C is a
Styrene-Acrylate copolymer as displayed in Table 5.1. Polymer C was not able to
perform the Quantitative-XRD because the slurry once dried, it dried as a thin film of
plastic as shown in Figure 5.11 but not in powder form.

84
Figure 5.11: Polymer C for QXRD became a thin film of plastic after dried
5.7.1 Chemical and Microstructural Properties
The Quantitative-XRD (QXRD) analysis for Pindan sand showed the following
results as shown in Table 5.6. The quantity is calculated only for materials with a
crystal structure and not for amorphous materials. Iron (Fe) was not detected in the
XRD test because the amount of iron in the Pindan sand was too small. In the EDS
experiment, Fe was detected in Pindan sand and also in the bonding structure between
the soil particles in the mixtures. Further information on Iron in Pindan sand is
described below along with the EDS results. The amount of Haematite (FeO) in
Pindan sand might be less than 1%. Even though the amount of Haematite is below
1%, it has a great influence on the colour of Pindan sand. According to the results of
the Quantitative-XRD, Pindan sand consists mostly of quartz and kaolinite.
Figures 5.12(A) and (B) provide SEM images of Pindan sand grains collected from
Gantheaume Point Rd (G.P) and Cape Levique (C.L) in Broome, respectively. The
shape of the pindan particles are sub-rounded sand grains. Figures 5.12(C) and (D)
show the crystal form of Pindan sand, and Figures 5.12(E) and (F) more clearly show
the crystal form of the Pindan sand of G.P and C.L, respectively. The images of
Figures 5.12(E) and (F) provide that the crystal form is a loose structures. Both Sands
from G.P and C.L have a similar microstructure.
Table 5.6: Quantitative XRD Analysis for Pindan Sand
Crystalline Mineral %
Quartz SiO2 95 – 96
Kaolinite Al4Si4O10(OH)8 4 - 5

85
Figure 5.12: G.P and C.L Sand Grain. (A) G.P Sub-rounded Grain, (B) C.L Sub-
rounded Grain, (C) G.P Microstructure, (D) C.L Microstructure, (E) Magnification
of (C) showing the clear form, (F) Magnification of (D) showing the clear form.
SEM pictures are accomplished with each energy dispersive X-ray spectroscopy
(EDS) analysis. The EDS spectra of the selected areas within the SEM samples of
Mixtures A, B and C is provided with the SEM images. EDS test was used for element
analysis of specimens. Carbon in the EDS spectra is mostly due to the carbon coating
for sample preparation. The SEM images of the mixtures of pindan sands and the
three Polymers are also provided to determine the microstructures, and the
microstructures are compared to the mechanical properties. The SEM and EDS were
tested on 16 day cured mixtures.

86
Figure 5.13 shows the bonding bridge between the sand particles of the mixture A.
Figure 5.13(A) illustrates that the polymer A might affect the bonding structures
between the particles, and Figure 5.13(B) shows that the Polymer A might also affect
the crystal forms and make them denser compared to the untreated pindan sands as
shown in Figures 5.12(C) and (D). Polymer A might make the sand structure more
coherent as the image of Figure 5.13(B) looks denser and less porosity between the
crystal forms compared to the untreated pindan sand. The SEM images showed the
microstructure of the Pindan sand and that the polymers might be forming the bridges
between the sand particles. Figure 5.14 provides the chemical property of Pindan sand
and mixture A through XRD analysis. And, a SEM image combined with EDS locates
and mineral identifications is provided together in Figure 5.15. In the Mixture A,
Ca(OH)3 and Calcium are detected in the XRD analysis and EDS spectra of Figures
5.14 and 5.15, respectively. Figures 5.15(A) and (B) show the EDS spectra on the
bonding structure and the EDS spectra on the sand, respectively. The EDS spectra on
the bonding structure clearly shows that calcium is detected and most of chemical
component are silica and aluminium. The EDS spectra on the sand also indicates the
detected calcium, silica and aluminium, but aluminium and calcium are relatively
small proportions compared to silica. It is noted that the sand surface was coated by
the polymer and the polymer affected the bonding structures according to the EDS
spectra results. And, Iron (Fe) was detected in both the bonding structure and sand
surface. Iron comes from Pindan sand, which shows that Pindan sand has iron and
also affects bonding structure.
Figure 5.13: SEM Images of Mixture A after 16day curing. (A) Bonding of Mixture
A, (B) Magnification of (A) showing the bonding structure.
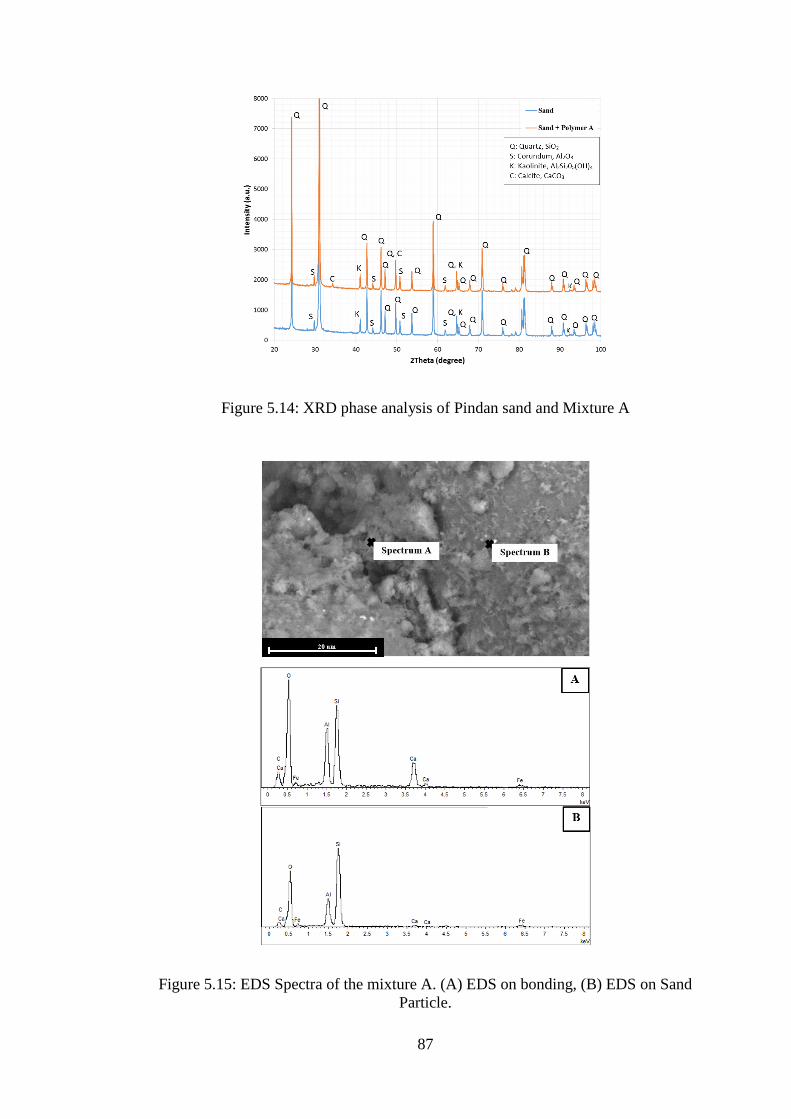
87
Figure 5.14: XRD phase analysis of Pindan sand and Mixture A
Figure 5.15: EDS Spectra of the mixture A. (A) EDS on bonding, (B) EDS on Sand
Particle.

88
Figure 5.16 demonstrates that polymers B and C might affect the bonding between
the particles. Figure 5.16(A) and (B) presented the bonding between the sand particles
of the mixture B and C, respectively. The SEM images of Figures 5.16(C) and (D)
more clearly show the bonding between the particles for the mixtures of the Pindan
sand with the polymer B and Polymer C, respectively. Comparing Figures 5.16(E)
and (F) with Figures 5.12(E) and (F), the polymers might affect not only the bonding
between the particles but also provide the cohesive or the bonding between the
crystals, but the change of crystal form has not been observed. The polymers might
not influence the crystal structure. Figure 5.16(F) clearly shows the needle structures
of the polymer between the crystal forms.
Polymer B might provide cohesive between the crystal forms but might not affect the
bonding structure between the crystal forms, on the contrary, polymer C could provide
the bonding between the crystals but might not influence the cohesive of the crystal
forms while the Polymer A might provide the bonding and improve the cohesive
between the crystal forms according to the XRD and SEM analysis. However, the
crystal forms has not been changed in all polymer mixtures. From the SEM test, it is
noted that the polymers could provide the bonding between the particles and the
crystals, and could increase the density by bonding crystal forms and make them more
cohesive due to reducing the porosity compared to the untreated sands.
Figures 5.17(A) and (B) are the SEM image of the mixture B and EDS spectra on the
bonding structure and the sand particle, respectively. Figures 5.18(A) and (B) show
EDS spectra of the mixture C on the bonding structure and the sand particle,
respectively. In the EDS spectra of Figure 5.18(A), aluminium is detected at a similar
proportion to silica, whereas aluminium in the EDS spectra in Figure 5.18(B) is not
detected due to a small proportion. In EDS test, Fe was also detected on the bonding
structures due to the clay bonding between the sand particles. From the EDS results,
it is proven that Iron affects the bonding structures between the sand particles. Also,
when comparing the EDS spectra of the bonding structure to the sand, the proportion
of aluminium was much higher in the bonding structures then in the EDS of Pindan
sand. Aluminium also affects the bonding structures between the soil particles. Pindan
sands are cemented by iron oxides (Fe2O3) and aluminium oxides (Al(OH)3).

89
Figure 5.16: SEM Images of Mixture B and C after 16day curing. (A) Bonding of
Mixture B, (B) Bonding of Mixture C, (C) Magnification of (A) showing the
bonding structure, (D) Magnification of (B) showing the bonding structure, (E)
Magnification of (C) showing microstructures, (F) Magnification of (C) showing
microstructures.
According to the EDS analysis as shown in Figures 5.17 and 5.18, no significant
difference was found in the chemical composition tested between the bonding
structure and the sand. Also, the XRD analysis shown in Figure 19 did not detect any
change in chemical composition between Pindan sand and the mixtures. The reason
for this is that the XRD test showed no change because the amount of polymer
contained was too low compared to the sands with relatively high intensity. Another
reason for no difference is that some components of the polymers are composed of
components similar to the Pindan sand. In the case of polymers A and B, Al2O3 and
SiO2 were contained in the polymer component, and particularly the polymer B was
mainly composed of the two components. Polymer C seems to have amorphous
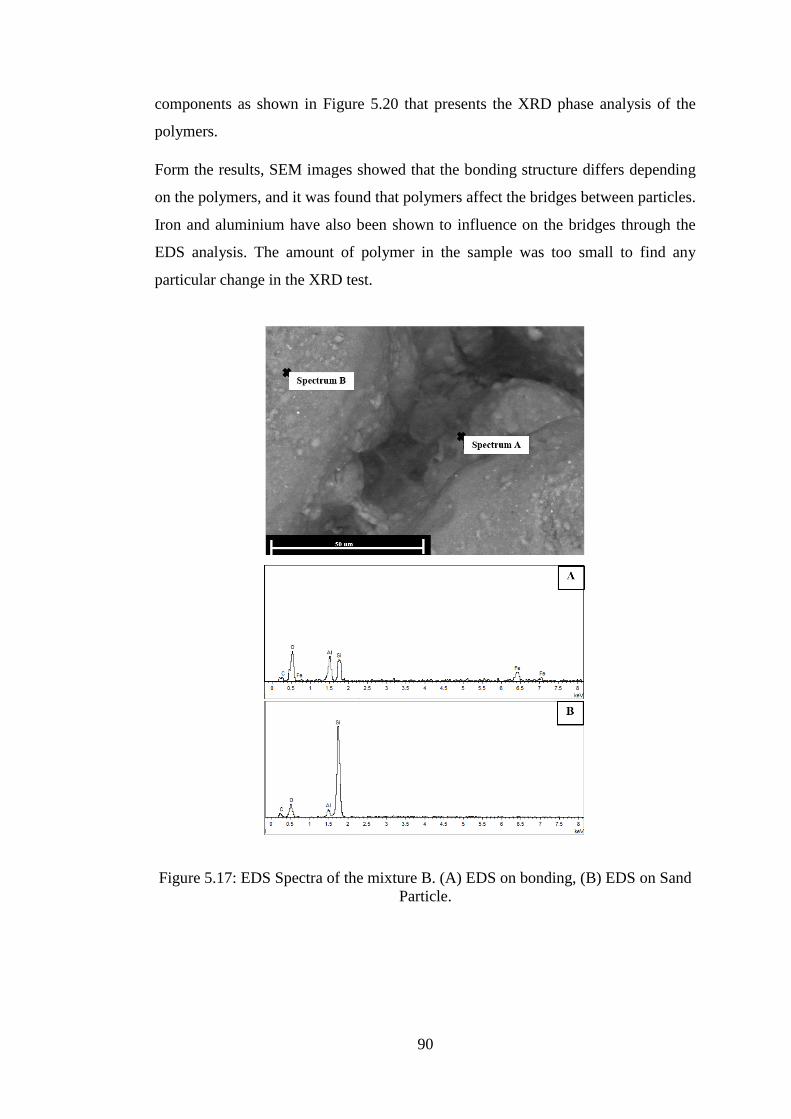
90
components as shown in Figure 5.20 that presents the XRD phase analysis of the
polymers.
Form the results, SEM images showed that the bonding structure differs depending
on the polymers, and it was found that polymers affect the bridges between particles.
Iron and aluminium have also been shown to influence on the bridges through the
EDS analysis. The amount of polymer in the sample was too small to find any
particular change in the XRD test.
Figure 5.17: EDS Spectra of the mixture B. (A) EDS on bonding, (B) EDS on Sand
Particle.

91
Figure 5.18: EDS Spectra of the mixture C. (A) EDS on bonding, (B) EDS on Sand
Particle.
Figure 5.19: XRD phase analysis of Pindan sand, Mixture B and C.

92
Figure 5.20: XRD Phase analysis of Polymers
Note: Polymer components are confidential and therefore does not display components.
5.7.2 Interaction of Microstructural Properties and Mechanical
properties
In the compaction test, the polymers reduced the optimum moisture content and
increased the maximum dry density. This can be demonstrated by SEM test, which
shows that the polymer has reduced the porosity as can be seen from the SEM images
of the mixtures. The reduction of the void ratio is also related to the strength, and the
UCS results show that the compressive stress of the mixtures increases. This shows
that as the SEM images of the mixtures show, the polymer the compressive stress by
reducing the void ratio of the samples. This is also the reason for the increase in
capillary rise ratio. Polymer A caused a decrease in strength by micro-cracks during
the curing process. In addition, in Figure 5.16(E), crystals are well formed together
and have high cohesion. The bonding breaks at the failure point at one time due to
high cohesion, resulting in brittle failure in the UCS test.
In relation to CBR and microstructure changes, the CBR values of mixture B are
similar regardless of the change in the amount of the polymer. This is because the
polymer dose not link crystals but rather coalesces the crystals with each other as
shown in Figure 5.16(E). This was also appears in the UCS results, as the change in
the amount of polymer did not change the UCS results significantly. In the UCS test
for the mixture B, the compressive stress and strain were not significantly different
with respect to the amount of the polymer. In mixture A, CBR increases as the amount

93
of polymer increases. This is because the polymer is smaller than Pindan sand as
shown in Figure 5.1, which increase the amount of void filling during compaction.
Also, as the amount of polymer increase, the sand surface can be covered more, and
calcium can affect the bonding bridges more. The same result is displayed in the UCS
test as well. In the UCS test for the mixture A, the compressive stress and strain
increased in proportion to the amount of the polymer. Polymer C also showed the
same increase in compressive strength and strain as the amount of polymer was
increased. This is because the polymer can provide more needle bonding as shown in
Figure 5.16(F), as the amount of polymer increases. However, at 0.5% of polymer C,
CBR value was much higher than that of untreated sample, but the amount of polymer
increased and CBR decreased. The reason for this is shown in Figure 5.21, where the
force against the piston increased as it did for UCS results, but the stain also increased
as the amount of polymer increased. As shown in Figure 5.21, the results of CBR
showed that the highest value was recorded at 0.25 mm of penetration for samples
with 0.5% polymer C, while the highest value was recorded at 5 mm for samples with
0.7% polymer C. This also resulted in a lower CBR value due to a decrease in the
slope of the curves. In addition, as the amount of moisture content increased, the result
showed a sharp drop in the CBR result, indication that the polymer easily dissolves
in water and therefore the bonding is easily broken by water. For the same reason, the
CBR of the soaked sample is lower than that of the unsoaked sample because the
polymer may also escape during the water drainage.
Figure 5.21: CBR Test for the Mixtures with 0.5% and 0.7% of Polymer C
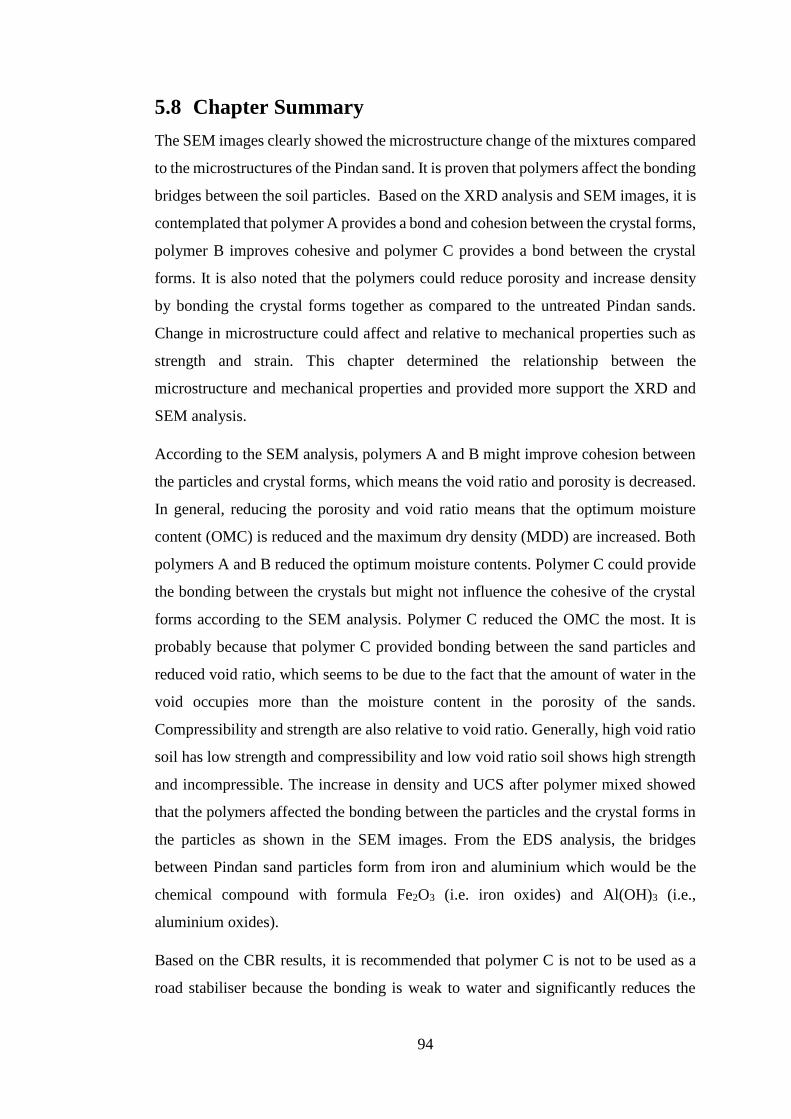
94
5.8 Chapter Summary
The SEM images clearly showed the microstructure change of the mixtures compared
to the microstructures of the Pindan sand. It is proven that polymers affect the bonding
bridges between the soil particles. Based on the XRD analysis and SEM images, it is
contemplated that polymer A provides a bond and cohesion between the crystal forms,
polymer B improves cohesive and polymer C provides a bond between the crystal
forms. It is also noted that the polymers could reduce porosity and increase density
by bonding the crystal forms together as compared to the untreated Pindan sands.
Change in microstructure could affect and relative to mechanical properties such as
strength and strain. This chapter determined the relationship between the
microstructure and mechanical properties and provided more support the XRD and
SEM analysis.
According to the SEM analysis, polymers A and B might improve cohesion between
the particles and crystal forms, which means the void ratio and porosity is decreased.
In general, reducing the porosity and void ratio means that the optimum moisture
content (OMC) is reduced and the maximum dry density (MDD) are increased. Both
polymers A and B reduced the optimum moisture contents. Polymer C could provide
the bonding between the crystals but might not influence the cohesive of the crystal
forms according to the SEM analysis. Polymer C reduced the OMC the most. It is
probably because that polymer C provided bonding between the sand particles and
reduced void ratio, which seems to be due to the fact that the amount of water in the
void occupies more than the moisture content in the porosity of the sands.
Compressibility and strength are also relative to void ratio. Generally, high void ratio
soil has low strength and compressibility and low void ratio soil shows high strength
and incompressible. The increase in density and UCS after polymer mixed showed
that the polymers affected the bonding between the particles and the crystal forms in
the particles as shown in the SEM images. From the EDS analysis, the bridges
between Pindan sand particles form from iron and aluminium which would be the
chemical compound with formula Fe2O3 (i.e. iron oxides) and Al(OH)3 (i.e.,
aluminium oxides).
Based on the CBR results, it is recommended that polymer C is not to be used as a
road stabiliser because the bonding is weak to water and significantly reduces the

95
CBR values. Polymer A, on the other hand, is resistant to water and reduces water
ingress, thus stabilising the pavement structures to maintain strength, increasing the
life of unsealed pavement. Polymer B also stabilises the soil well and increases its
strength even when the amount of polymer is changed. The total pavement thickness
required for the stabilised Pindan soil is at least 250mm.
This study shows the microstructure and the properties of Pindan soil. In particular,
the microstructure changes depend on the type of polymer and the mechanical
properties vary accordingly. The mechanical properties and microstructure changes,
show a close relationship. Basically, it is evident that the failure behaviour, strain and
strength as well as the basic properties are affected and changed by the microstructure
change.
96
Chapter 6
6 Conclusion and Future Research
This research examines properties of Pindan soils and Pindan-mixtures with various
polymers with objective of understanding of the fundamental properties performed in
the nano- and micro-scale. Indentation properties such as elastic modulus, hardness,
packing density, stiffness and cohesion of Pindan soils were obtained using
nanoindentation. Classification tests such as plastic index and specific gravity and
particle size distribution were carried to obtain the basic properties. Compaction,
collapsibility, unconfined compressive strength and California bearing ratio tests
were performed to determine the mechanical properties of stabilised Pindan soils.
Furthermore, chemical and microstructural properties were examined using X-ray
diffraction and scanning electron microscope, and linked with the mechanical
properties.
6.1 Conclusion
Based on this study, the following conclusion can be drawn:
a) Nanoindentation technology can be used to determine mechanical properties
of soils. This method provides various information such as elastic modulus,
hardness, packing density, stiffness, cohesion and fracture toughness of soils
at nano-scales. This technology is useful compared to conventional methods
to get various information at once in a quick and easy way.
b) The Pindan soils have been successfully used as a pavement material in
Western Australia, although limited information exits with Pindan properties.
Thus, Pindan soil were investigated to contribute to the evaluation of the
fundamental properties of Pindan soils. Pindan soils were classified into
classification categories based on basic physical characteristics such as index
properties and particle size distribution and they were classified as silty sand
(SM) and the plasticity index was non-plastic. The collapsible index from the
double oedometer test was 1.24% which corresponds to a moderate trouble

97
soil or slightly collapsible soil. CBR results for the samples compacted to be
greater than 95% of standard proctor maximum dry density were ranged
between 11 – 14 % and 10 – 12 % in the unsoaked and soaked conditions,
respectively.
c) Polymers are widely used for soil stabilisation in civil engineering thus
polymers were used to stabilise Pindan soils. The type of polymer influenced
the optimum moisture contents and strengths rather than the amount of
polymer. Particularly, the capillary rise rate and bonding structures showed
different results depending on the type of polymer. Different bonding
structures were observed depending on the type of polymer, which was not
only related to strengths and also to failure behaviours. From SEM and EDS
analysis, it is found that chemical elements such as Iron and Aluminium affect
the bonding structures. According to the SEM analysis, the polymers affected
the bonding structures not only between the particles but also between the
crystal forms in the particle. The capillary rise test proved that polymer
stabilising bonders has a high resistance to water and can play a role of
waterproofing. Each of the polymers showed a different bonding mechanism,
which also affected the mechanical properties and even material failure modes.
d) Polymer stabilisation is more efficient method for soil stabilisation due to its
low cost and ease of application compared to traditional stabilisation. From
the economic point of view, polymer stabilisers are profitable in term of price
due to the small proportion of the polymers required (adding polymers by
weigh of 0.001 – 3% of the soil).
6.2 Recommendation for future research
To get a better understanding of Pindan soils, more performance on properties such
as mechanical and indentation properties are required. Mechanical properties are
moist important material characteristics in civil engineering in the present. However,
in order to obtain a better understanding and knowledge of the materials, it is
important to find out the indigenous properties of the materials through indentation

98
tests. Although this research has shown mechanical and indentation properties for
Pindan soils, it still lacks information on Pindan soils, and should be tested for more
Pindan soils. In addition, it was found through this study that the bonding mechanism
varies greatly depending on the type of binders. Investigation further the influence of
mechanical properties on the bonding mechanism depending on the type of binders
are also required. A better understanding of soil stabilisation by finding out the
fundamental properties of materials and correlating it with the mechanical properties
through more studying the mechanical properties of the bonding mechanism using
various stabilisers are required and recommended.
Non-traditional stabilisation has less environment impacts than traditional stabilisers
such as cement and lime. According to the manufacturer’s safety data sheet, the
polymers used in this study do not have any significant environment impacts. And the
polymer A has been approved by the Western Australian Department of Health as
compaction aid within drinking water catchment areas. However, the polymers still
contain some toxic components which could affect the environment. And because
only limited information is available, the environmental impacts should be more
studied.
An important object of future research is to formulate a mathematical representation
of the relationship between polymers and Pindan soils to derive the predicted
equations for the mechanical behaviour of pavement. A conserved equation of the
strength stiffness for such polymer stabilised soils needs to be created from theoretical
formulas and support it with experimental results. In order to do so, more advanced
experiments need to be conducted. And, finding and providing the relationship
between the results from the nanoindentation tests and the advanced experiments is
one of the most important research in the future.

99
Appendices
Appendix A
This appendix contains the UCS results for 1hour and 16day cured samples. Moisture
contents are determined at compaction. The samples that compacted more than 98%
modified compaction proctor were accepted.
UCS – 1 hour Curing Samples
Pindan Sand (OMC: 9.4%)
Actuator
strain at
peak load
(%)
Peak
compressive
stress (kPa)
MDD
(kN/m3)
LDR (%) Moisture
Content
(%)
Sample 1 2.25 32.5 18.82 100.4% 9.25
Sample 2 2.15 37.0 18.98 101.3% 9.48
Sample 3 2.35 34.5 19.01 101.5% 9.51
Average 2.25 34.67
Mixture A (1%) (OMC: 8.6%)
Sample 1 2.25 41.0 19.19 100.7% 8.53
Sample 2 2.85 35.5 19.17 100.6% 8.70
Sample 3 2.00 36.5 19.12 100.4% 8.76
Average 2.37 37.67
Mixture A (2%) (OMC: 8.2%)
Sample 1 2.75 42.0 18.79 100.0% 8.26
Sample 2 2.65 37.5 18.83 100.2% 8.28
Sample 3 2.95 36.0 18.80 100.0% 8.14
Average 2.78 38.5
Mixture A (3%) (OMC: 8.2%)
Sample 1 3.45 37.5 19.05 100.8 8.14
Sample 2 3.00 38.5 19.07 100.9 8.18
Sample 3 3.00 41.5 19.08 100.9 8.07
Average 3.15 39.17
Mixture B (0.001%) (OMC: 8.3%)
Sample 1 2.60 50.3 19.61 101.9 8.10
Sample 2 2.65 49.0 19.60 101.8 8.25
Sample 3 2.35 46.1 19.59 101.8 8.28
Average 2.53 48.5
Mixture B (0.002%) (OMC: 8.2%)

100
Sample 1 2.25 47.9 19.48 101.7 8.32
Sample 2 2.40 49.2 19.50 101.8 8.12
Sample 3 2.65 49.3 19.50 101.8 8.09
Average 2.43 48.8
Mixture B (0.003%) (OMC: 8.0%)
Sample 1 2.60 46.5 19.50 101.6 7.98
Sample 2 2.33 51.4 19.51 101.7 7.91
Sample 3 2.50 49.5 19.50 101.6 8.18
Average 2.48 49.1
Mixture C (0.5%) (OMC: 7.4%)
Sample 1 2.55 38.0 19.46 98.8 7.30
Sample 2 2.65 38.3 19.56 99.3 7.35
Sample 3 2.45 39.1 19.70 100.0 7.33
Average 2.55 38.5
Mixture C (0.7%) (OMC: 7.2%)
Sample 1 3.15 42.6 19.19 98.9 7.09
Sample 2 2.85 42.8 19.10 98.5 7.14
Sample 3 2.80 46.1 19.26 99.3 7.13
Average 2.93 43.8
Mixture C (1.0%) (OMC: 7.2%)
Sample 1 3.50 41.0 19.16 98.7 7.09
Sample 2 3.05 46.1 19.15 98.6 7.28
Sample 3 3.05 46.2 19.27 99.2 7.19
Average 3.20 44.4
UCS – 16 Day Curing Samples
Pindan Sand (OMC: 9.4%)
Actuator
strain at
peak load
(%)
Peak
compressive
stress (kPa)
MDD
(kN/m3)
LDR (%) Moisture
Content
(%)
Sample 1 1.30 1025 18.88 100.7 9.2
Sample 2 1.20 1010 18.87 100.7 9.5
Sample 3 1.30 1030 18.89 100.8 9.4
Average 1.26 1021
Mixture A (1%) (OMC: 8.6%)
Sample 1 0.80 595 19.39 101.8 8.8
Sample 2 0.85 600 19.38 101.7 8.7
Sample 3 0.85 615 19.42 101.9 8.8
Average 0.83 603
Mixture A (2%) (OMC: 8.2%)
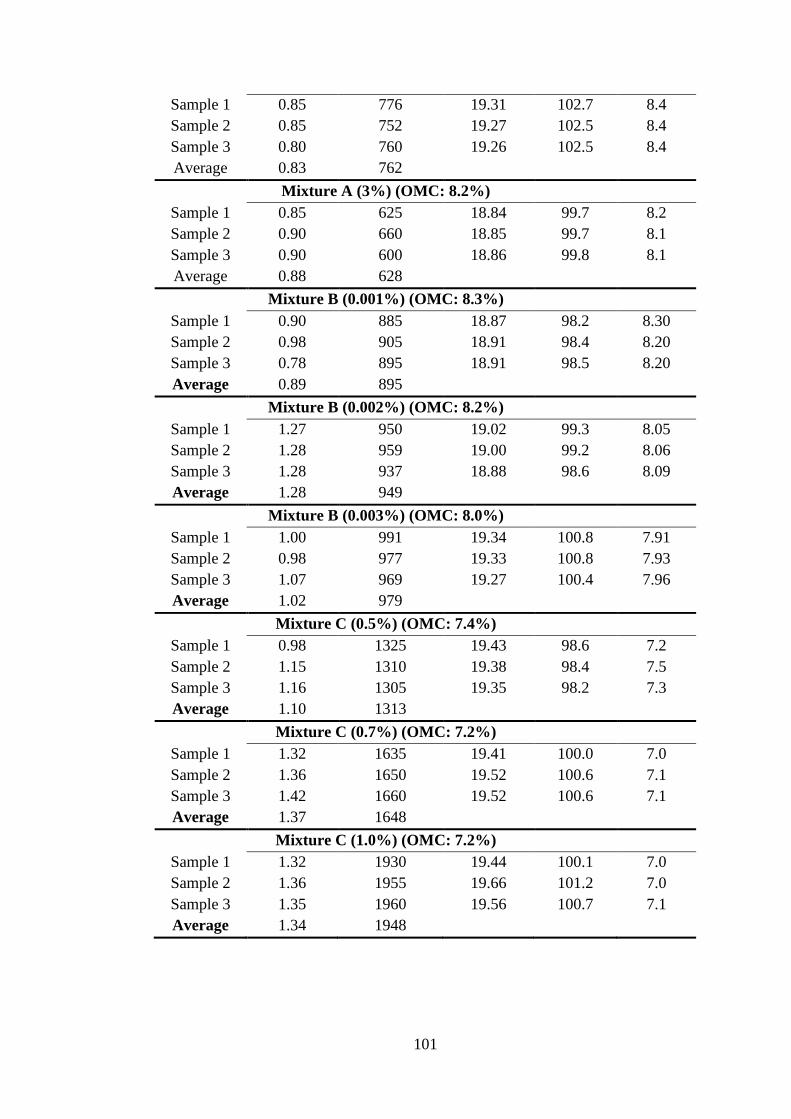
101
Sample 1 0.85 776 19.31 102.7 8.4
Sample 2 0.85 752 19.27 102.5 8.4
Sample 3 0.80 760 19.26 102.5 8.4
Average 0.83 762
Mixture A (3%) (OMC: 8.2%)
Sample 1 0.85 625 18.84 99.7 8.2
Sample 2 0.90 660 18.85 99.7 8.1
Sample 3 0.90 600 18.86 99.8 8.1
Average 0.88 628
Mixture B (0.001%) (OMC: 8.3%)
Sample 1 0.90 885 18.87 98.2 8.30
Sample 2 0.98 905 18.91 98.4 8.20
Sample 3 0.78 895 18.91 98.5 8.20
Average 0.89 895
Mixture B (0.002%) (OMC: 8.2%)
Sample 1 1.27 950 19.02 99.3 8.05
Sample 2 1.28 959 19.00 99.2 8.06
Sample 3 1.28 937 18.88 98.6 8.09
Average 1.28 949
Mixture B (0.003%) (OMC: 8.0%)
Sample 1 1.00 991 19.34 100.8 7.91
Sample 2 0.98 977 19.33 100.8 7.93
Sample 3 1.07 969 19.27 100.4 7.96
Average 1.02 979
Mixture C (0.5%) (OMC: 7.4%)
Sample 1 0.98 1325 19.43 98.6 7.2
Sample 2 1.15 1310 19.38 98.4 7.5
Sample 3 1.16 1305 19.35 98.2 7.3
Average 1.10 1313
Mixture C (0.7%) (OMC: 7.2%)
Sample 1 1.32 1635 19.41 100.0 7.0
Sample 2 1.36 1650 19.52 100.6 7.1
Sample 3 1.42 1660 19.52 100.6 7.1
Average 1.37 1648
Mixture C (1.0%) (OMC: 7.2%)
Sample 1 1.32 1930 19.44 100.1 7.0
Sample 2 1.36 1955 19.66 101.2 7.0
Sample 3 1.35 1960 19.56 100.7 7.1
Average 1.34 1948

102
Appendix B
This appendix contains the CBR results for the unsoaked and soaked samples. The
samples that compacted more than 93% modified compaction proctor were accepted.
Unsoaked
Condition Sample
CBR (%) Swell
(%)
Actual MC
(%) at
Compaction
OMC
(%)
LDR
(%)
Pindan Sand
1 19.54
N/A
9.5
9.4
95.0
2 18.64 9.4 94.5
3 19.24 9.3 94.7
4 18.79 9.4 95.4
Average 19.05
Mixture A (1%)
1 18.33
N/A
8.5
8.6
93.1
2 18.43 8.4 93.3
3 19.14 8.3 93.1
Average 18.64
Mixture A (2%)
1 23.78
N/A
8.0
8.2
97.43
2 21.74 8.0 97.48
3 23.08 8.4 97.16
Average 22.87
Mixture A (3%)
1 30.30
N/A
8.2
8.2
99.23
2 30.30 8.3 99.88
3 29.80 8.1 100.62
Average 30.13
Mixture B
(0.001%)
1 24.24
N/A
8.4
8.3
96.55
2 24.32 8.2 96.41
3 24.62 8.5 96.46

103
Average 24.39
Mixture B
(0.002%)
1 24.02
N/A
8.4
8.2
95.78
2 24.55 8.4 95.00
3 26.52 8.4 94.63
Average 25.03
Mixture B
(0.003%)
1 25.76
N/A
7.9
8.0
93.34
2 23.48 8.1 93.01
3 20.68 8.0 93.01
Average 23.31
Mixture C (0.5%)
1 22.89
N/A
7.3
7.4
93.39
2 24.24 7.3 93.96
3 24.51 7.2 93.02
Average 23.88
Mixture C (0.7%)
1 20.00
N/A
7.0
7.2
94.90
2 21.64 7.0 94.91
3 18.69 7.1 94.64
Average 20.11
Mixture C (1.0%)
1 11.62
N/A
7.2
7.2
93.01
2 10.10 7.1 93.02
3 11.62 7.0 93.01
Average 11.11
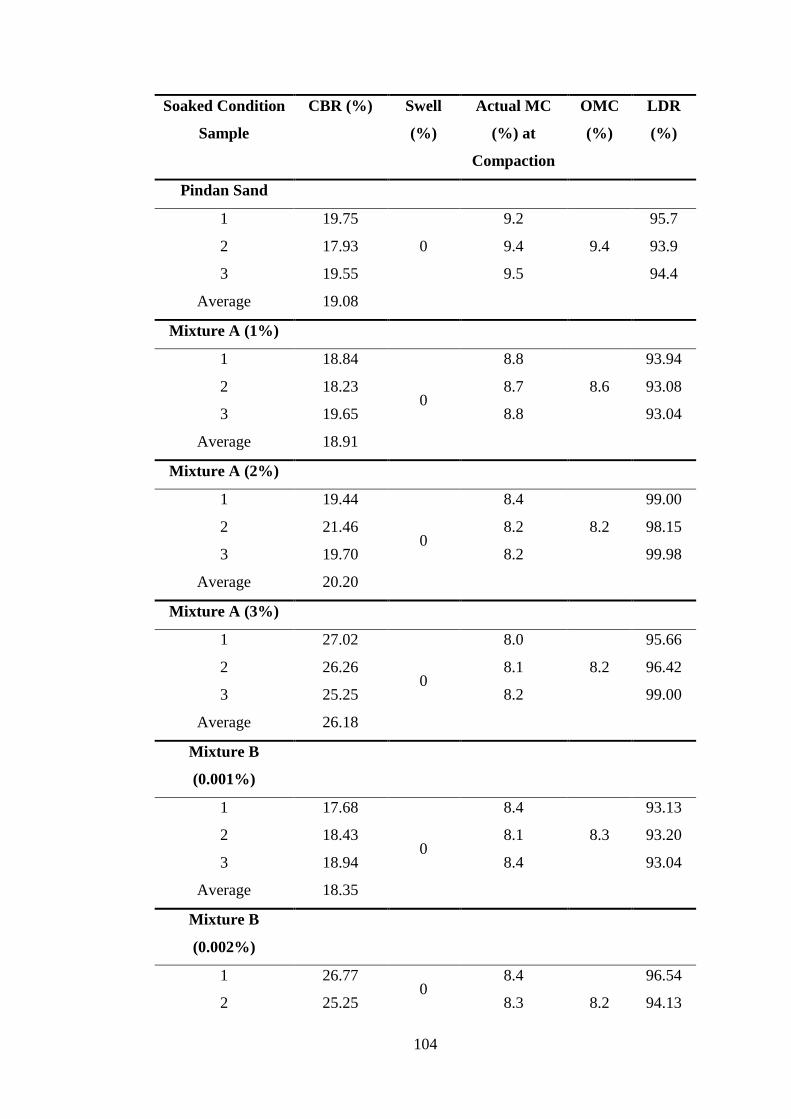
104
Soaked Condition
Sample
CBR (%) Swell
(%)
Actual MC
(%) at
Compaction
OMC
(%)
LDR
(%)
Pindan Sand
1 19.75
0
9.2
9.4
95.7
2 17.93 9.4 93.9
3 19.55 9.5 94.4
Average 19.08
Mixture A (1%)
1 18.84
0
8.8 93.94
2 18.23 8.7 8.6
93.08
3 19.65 8.8 93.04
Average 18.91
Mixture A (2%)
1 19.44
0
8.4 99.00
2 21.46 8.2 8.2
98.15
3 19.70 8.2 99.98
Average 20.20
Mixture A (3%)
1 27.02
0
8.0 95.66
2 26.26 8.1 8.2
96.42
3 25.25 8.2 99.00
Average 26.18
Mixture B
(0.001%)
1 17.68
0
8.4 93.13
2 18.43 8.1 8.3
93.20
3 18.94 8.4 93.04
Average 18.35
Mixture B
(0.002%)
1 26.77 0
8.4 96.54
2 25.25 8.3 8.2 94.13

105
3 23.74 8.1 97.16
Average 25.25
Mixture B
(0.003%)
1 26.26
0
8.0 95.47
2 23.74 8.2 8.0
95.68
3 22.73 8.1 95.20
Average 24.24
Mixture C (0.5%)
1 20.20
0
7.24 93.11
2 19.14 7.16 7.4
93.01
3 19.24 7.35 93.05
Average 19.53
Mixture C (0.7%)
1 18.18
0
7.08 95.69
2 18.69 6.98 7.2
93.93
3 18.18 6.93 93.42
Average 18.35
Mixture C (1.0%)
1 9.60
0
7.1 94.89
2 9.34 7.0 7.2
95.19
3 10.10 7.0 94.52
Average 9.68

106
Appendix C
This appendix contains the nanoindentation results of Pindan Soil.
Modulus Hardness Drift Correction Displacement Load
GPa GPa nm/s nm mN
70.356 10.754 -0.101 2041.342 519.277
68.455 10.679 -0.066 2027.966 502.83
74.014 11.204 -0.034 2023.622 534.295
71.974 10.951 -0.025 2022.826 520.702
66.639 10.643 -0.02 2021.407 490.676
61.035 10.092 -0.036 2024.976 457.379
70.851 10.744 -0.005 2018.146 510.036
54.37 9.845 0.027 2002.968 411.128
53.442 9.793 0.006 2014.74 410.219
49.451 9.21 0.004 2057.793 398.038
67.846 10.795 0.035 2008.834 492.663
69.204 10.85 0.021 2011.151 500.855
69.613 10.952 0.044 2009.538 503.486
66.406 10.696 0.034 2001.175 480.945
51.502 8.733 0.01 2067.178 407.008
76.156 11.248 0.034 2009.934 537.416
68.829 10.692 0.033 2005.304 493.97
63.518 10.454 0.027 2009.565 467.666
60.02 10.282 0.009 2013.548 449.871
61.181 10.204 0.026 2009.055 452.706
80.099 11.358 0.036 2006.652 554.118
81.237 11.288 0.039 2003.481 555.769
81.696 11.332 0.026 2005.145 559.284
81.69 11.397 0.016 2011.574 563.918
80.804 11.376 0.023 2004.589 556.218
81.232 11.499 0.025 2006.36 561.099
78.852 11.244 0.015 2008.478 547.943
81.05 11.474 0.027 2001.158 557.12

107
76.119 11.284 0.021 2011.128 538.468
76.075 11.285 0.01 2009.3 537.36
75.09 11.135 0.008 2012.484 532.249
70.81 11.097 0.014 2010.211 511.461
69.936 10.901 0.01 2009.107 503.988
37.18 6.908 0.066 2283.932 368.668
39.982 6.532 0.036 2042.145 307.319
45.524 7.923 0.044 2008.768 344.359
58.54 10.076 0.066 1999.815 434.036
64.606 10.48 0.067 1999.719 468.808
59.387 9.779 0.059 2006.116 436.987
54.531 9.441 0.036 2007.006 408.822
63.673 10.424 0.038 2006.587 466.674
66.93 10.693 0.046 2000.61 483.08
65.545 10.323 0.04 2011.091 476.078
68.682 10.672 0.042 2006.324 493.483
67.388 10.644 0.044 2007.247 487.59
61.509 9.946 0.032 2010.409 451.317
59.56 9.324 0.003 2032.708 442.28
68.936 10.485 0.032 2010.124 493.515
69.238 10.709 0.033 2007.937 497.332
61.989 10.281 0.038 2002.901 454.997
66.925 10.331 0.016 2014.396 484.044
65.315 9.939 0.005 2021.138 473.598
60.316 9.93 0.009 2016.925 448.146
57.55 8.577 -0.003 2094.722 445.811
54.97 7.966 -0.019 2033.313 398.691
52.65 9.207 0.004 2018.797 400.811
53.492 9.306 -0.004 2019.517 406.689
48.265 8.164 -0.032 2046.58 374.622
68.627 11.113 0.007 2018.948 505.724
75.011 11.424 0.013 2008.107 534.329
76.751 11.363 0.006 2014.969 544.503
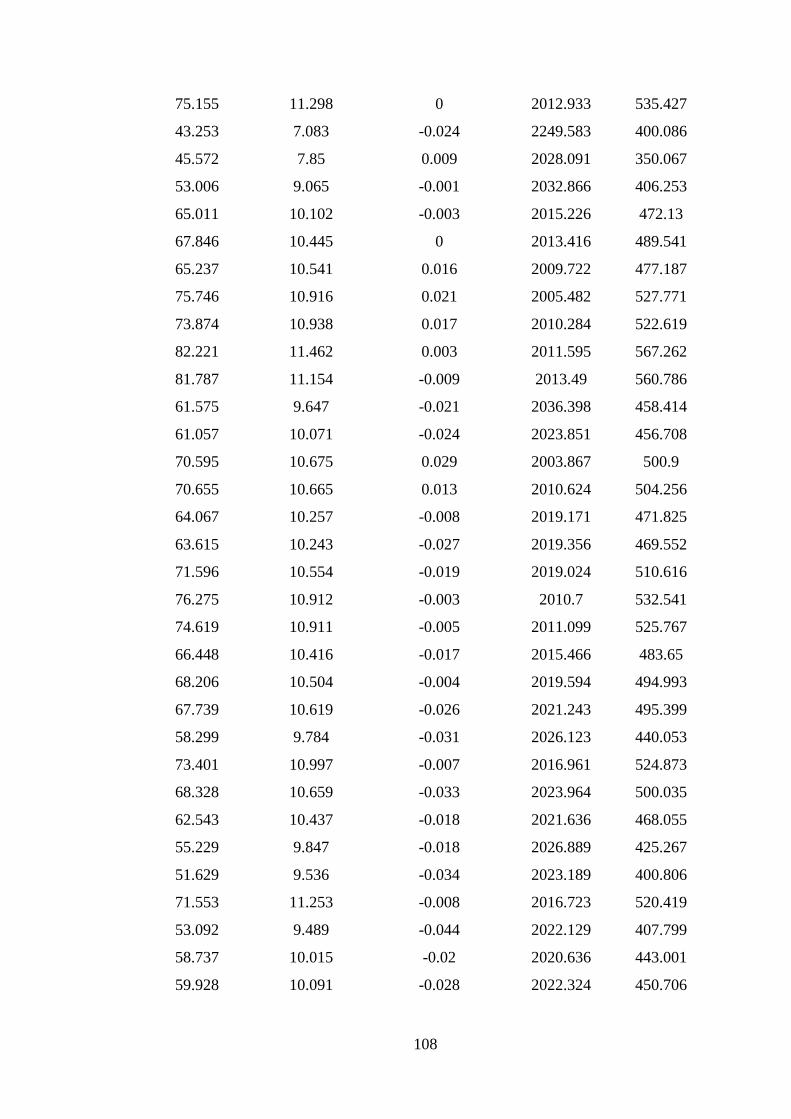
108
75.155 11.298 0 2012.933 535.427
43.253 7.083 -0.024 2249.583 400.086
45.572 7.85 0.009 2028.091 350.067
53.006 9.065 -0.001 2032.866 406.253
65.011 10.102 -0.003 2015.226 472.13
67.846 10.445 0 2013.416 489.541
65.237 10.541 0.016 2009.722 477.187
75.746 10.916 0.021 2005.482 527.771
73.874 10.938 0.017 2010.284 522.619
82.221 11.462 0.003 2011.595 567.262
81.787 11.154 -0.009 2013.49 560.786
61.575 9.647 -0.021 2036.398 458.414
61.057 10.071 -0.024 2023.851 456.708
70.595 10.675 0.029 2003.867 500.9
70.655 10.665 0.013 2010.624 504.256
64.067 10.257 -0.008 2019.171 471.825
63.615 10.243 -0.027 2019.356 469.552
71.596 10.554 -0.019 2019.024 510.616
76.275 10.912 -0.003 2010.7 532.541
74.619 10.911 -0.005 2011.099 525.767
66.448 10.416 -0.017 2015.466 483.65
68.206 10.504 -0.004 2019.594 494.993
67.739 10.619 -0.026 2021.243 495.399
58.299 9.784 -0.031 2026.123 440.053
73.401 10.997 -0.007 2016.961 524.873
68.328 10.659 -0.033 2023.964 500.035
62.543 10.437 -0.018 2021.636 468.055
55.229 9.847 -0.018 2026.889 425.267
51.629 9.536 -0.034 2023.189 400.806
71.553 11.253 -0.008 2016.723 520.419
53.092 9.489 -0.044 2022.129 407.799
58.737 10.015 -0.02 2020.636 443.001
59.928 10.091 -0.028 2022.324 450.706

109
55.859 9.863 -0.016 2022.776 427.123
54.791 9.67 -0.032 2025.19 420.154
60.045 10.06 -0.028 2018.847 449.39
59.107 9.901 -0.039 2022.157 444.004
52.842 9.521 -0.044 2027.354 408.85
70.438 10.816 -0.01 2014.997 507.807
55.691 9.621 -0.032 2034.332 427.947
53.229 9.34 -0.047 2029.41 409.563
49.626 8.98 -0.059 2028.38 385.582
59.423 10.017 -0.024 2013.524 443.462
46.354 9.019 -0.054 2040.734 371.898
49.006 8.507 -0.083 2052.096 385.084
50.901 9.251 -0.052 2034.821 398.042
84.631 11.453 -0.016 2012.995 577.425
84.247 11.354 -0.008 2012.569 573.774
84.667 11.305 -0.007 2013.667 575.035
83.42 11.38 -0.006 2009.974 569.625
83.098 11.416 -0.016 2011.793 570.019
84.171 11.483 -0.017 2013.679 576.575
83.154 11.231 -0.019 2015.168 568.539
83.176 11.516 -0.026 2019.261 576.289
82.404 11.35 -0.015 2015.624 568.104
81.778 11.238 0.002 2012.122 561.604
59.429 10.16 -0.033 2027.43 451.272
69.296 10.854 -0.009 2013.719 502.579
84.444 11.838 -0.031 2024.252 590.187
84.865 11.647 -0.019 2020.754 586.364
88.611 11.828 -0.031 2019.025 603.58
89.618 12.007 -0.027 2025.494 614.762
92.694 12.025 -0.005 2014.411 620.298
91.454 11.966 -0.024 2021.167 618.44
88.617 11.898 -0.017 2019.196 605.069
87.305 11.738 -0.026 2023.13 599.08

110
91.234 11.873 -0.023 2017.18 613.361
84.983 11.474 -0.023 2017.752 581.823
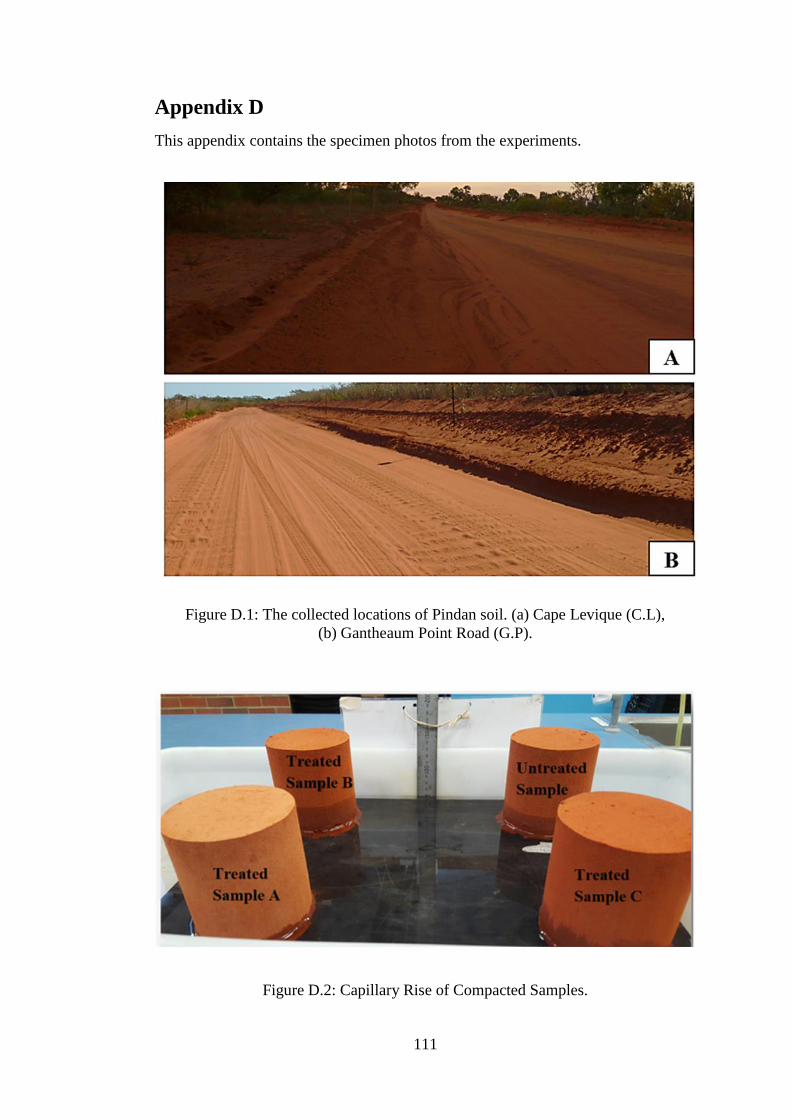
111
Appendix D
This appendix contains the specimen photos from the experiments.
Figure D.1: The collected locations of Pindan soil. (a) Cape Levique (C.L),
(b) Gantheaum Point Road (G.P).
Figure D.2: Capillary Rise of Compacted Samples.

112
Figure D.3: Capillary Rise of Compacted Samples after 2hours.
Figure D.4: Unconfined Compressive Strength Test. (a) Untreated Pindan Sample,
(b) Polymer A-Pindan Mixture, (c) Polymer B-Pindan Mixture, (d) Polymer C-
Pindan Mixture.

113
References
Airey, D., Suchowerska, A., & Williams, D. (2012). Limonite–a weathered residual
soil heterogeneous at all scales. Géotechnique Letters, 2(7-9), 119-122.
Al-Hadidy, A., & Yi-qiu, T. (2009). Effect of polyethylene on life of flexible
pavements. Construction and Building Materials, 23(3), 1456-1464.
Al-Khanbashi, A., & Abdalla, S. W. (2006). Evaluation of three waterborne polymers
as stabilizers for sandy soil. Geotechnical and Geological Engineering, 24(6),
1603-1625.
Andrews, B. (2006). Part 4D: Stabilised Materials, Guide to Pavement Technology:
Austroads Incorporated.
Andrews, R., & Duffy, P. (2008). Polymer stabilisation and best value management
of unsealed road networks. Road & Transport Research: A Journal of
Australian and New Zealand Research and Practice, 17(3), 59.
Anstis, G., Chantikul, P., Lawn, B. R., & Marshall, D. (1981). A critical evaluation
of indentation techniques for measuring fracture toughness: I, direct crack
measurements. Journal of the American Ceramic Society, 64(9), 533-538.
ARA Inc. (2004). Guide for mechanistic-empirical design of new and rehabilitated
pavement structures. Transportation Research Board of the National
Research Council, 1-91.
ASTM International. (2010). D4318-10e1: Standard Test Methods for Liquid Limit,
Plastic Limit, and Plasticity Index of Soils, ASTM International, West
Conshohocken, PA.
ASTM International. (2011a). ASTM D2487-11: Standard Practice for Classification
of Soils for Engineering Purposes (Unified Soil Classification System),
ASTM International, West Conshohocken, PA.
ASTM International. (2011b). D2435/D2435M-11: Standard test method for one-
dimensional consolidation properties of soils using incremental loading,
ASTM International, West Conshohocken, PA.
Ateş, A. (2013). The effect of polymer-cement stabilization on the unconfined
compressive strength of liquefiable soils. International Journal of Polymer
Science, 2013.
Austroads. (2009). Guide to pavement technology: part 6: unsealed pavements.
Azzam, W. R. (2014). Behavior of modified clay microstructure using polymer
nanocomposites technique. Alexandria Engineering Journal, 53(1), 143-150.
Azzam, W. R. (2014). Utilization of polymer stabilization for improvement of clay
microstructures. Applied Clay Science, 93, 94-101.
Balsam, W., Ji, J., & Chen, J. (2004). Climatic interpretation of the Luochuan and
Lingtai loess sections, China, based on changing iron oxide mineralogy and
magnetic susceptibility. Earth and Planetary Science Letters, 223(3), 335-348.
Basma, A. A., & Kallas, N. (2004). Modeling soil collapse by artificial neural
networks. Geotechnical & Geological Engineering, 22(3), 427-438.
Bazant, Z. P., & Pfeiffer, P. A. (1987). Determination of fracture energy from size
effect and brittleness number. ACI Materials Journal, 84(6), 463-480.
Blanton, T., Majumdar, D., & Melpolder, S. (2000). Microstructure of clay-polymer
composites. Advances in X-ray Analysis, 42, 562-568.
Bobko, C., & Ulm, F.-J. (2008). The nano-mechanical morphology of shale.
Mechanics of Materials, 40(4), 318-337.

114
Borodich, F. M., Keer, L. M., & Korach, C. S. (2003). Analytical study of
fundamental nanoindentation test relations for indenters of non-ideal shapes.
Nanotechnology, 14(7), 803.
Chen, J., & Bull, S. (2007). Indentation fracture and toughness assessment for thin
optical coatings on glass. Journal of Physics D: Applied Physics, 40(18), 5401.
Cheng, Y.-T., & Cheng, C.-M. (2004). Scaling, dimensional analysis, and indentation
measurements. Materials Science and Engineering: R: Reports, 44(4–5), 91-
149. doi:http://dx.doi.org/10.1016/j.mser.2004.05.001
Clemence, S. P., & Finbarr, A. O. (1981). Design considerations for collapsible soils.
Journal of Geotechnical and Geoenvironmental Engineering, 107(ASCE
16106).
Cocks, G., Keeley, R., Leek, C., WML, P. F., WML, T. B., Cray, A., . . . McInnes, D.
(2015). THE USE OF NATURALLY OCCURRING MATERIALS FOR
PAVEMENTS IN WESTERN AUSTRALIA.
Constantinides, G., Chandran, K. R., Ulm, F.-J., & Van Vliet, K. (2006). Grid
indentation analysis of composite microstructure and mechanics: Principles
and validation. Materials Science and Engineering: A, 430(1-2), 189-202.
Constantinides, G., & Ulm, F.-J. (2007). The nanogranular nature of C–S–H. Journal
of the Mechanics and Physics of Solids, 55(1), 64-90.
Daphalapurkar, N., Wang, F., Fu, B., Lu, H., & Komanduri, R. (2011). Determination
of mechanical properties of sand grains by nanoindentation. Experimental
Mechanics, 51(5), 719-728.
Davenport, F. (2007). PROBLEM SOILS–A WEST AUSTRALIAN PERSPECTIVE.
Paper presented at the 1st Annual Joint Western Australian Conference,
Foundation & Footings Society Australia and Australian Geomechanics
Society WA, The Effects of Ground Movements on WA Residences.
Dimitrov, D., Milchev, A., & Binder, K. (2007). Capillary rise in nanopores:
molecular dynamics evidence for the Lucas-Washburn equation. Physical
review letters, 99(5), 054501.
Dukino, R. D., & Swain, M. V. (1992). Comparative measurement of indentation
fracture toughness with Berkovich and Vickers indenters. Journal of the
American Ceramic Society, 75(12), 3299-3304.
Durst, K., Backes, B., Franke, O., & Göken, M. (2006). Indentation size effect in
metallic materials: Modeling strength from pop-in to macroscopic hardness
using geometrically necessary dislocations. Acta Materialia, 54(9), 2547-
2555.
Durst, K., Göken, M., & Vehoff, H. (2004). Finite element study for nanoindentation
measurements on two-phase materials. Journal of materials research, 19(1),
85-93.
El Howayek, A., Huang, P.-T., Bisnett, R., & Santagata, M. C. (2011). Identification
and behavior of collapsible soils.
Elkady, T. Y. (2002). Static and Dynamic Behaviour of Collapsible Soils. PhD
dissertation. University of Arizona.
Emery, S., Masterson, S., & Caplehorn, M. (2003). Sand-Clay pindan material in
pavements as a structural layer. Paper presented at the Proc. 21st Australian
Road Research Board Conference.
Ferry, A. (1998). Unsealed roads are sustainable. Transactions of the Institution of
Professional Engineers New Zealand: General Section, 25(1), 54.

115
Field, J., Swain, M., & Dukino, R. (2003). Determination of fracture toughness from
the extra penetration produced by indentation-induced pop-in. Journal of
materials research, 18(06), 1412-1419.
Fischer-Cripps, A. C. (2011). Nanoindentation. New York, NY: New York, NY :
Springer New York.
Fu, B., Newham, L. T., & Ramos-Scharron, C. (2010). A review of surface erosion
and sediment delivery models for unsealed roads. Environmental Modelling
& Software, 25(1), 1-14.
Gaaver, K. E. (2012). Geotechnical properties of Egyptian collapsible soils.
Alexandria Engineering Journal, 51(3), 205-210.
Galán-Marín, C., Rivera-Gómez, C., & Petric, J. (2010). Clay-based composite
stabilized with natural polymer and fibre. Construction and Building
Materials, 24(8), 1462-1468.
Gibbs, H., & Bara, J. (1962). Predicting surface subsidence from basic soil tests Field
Testing of Soils: ASTM International.
Gibbs, H. J. (1961). Properties which divide loose and dense uncemented soils:
United States, Department of the Interior, Bureau of Reclamation.
Gibbs, H. J., & Holland, W. (1960). Petrographic and engineering properties of loess:
Technical Information Branch, Denver Federal Center.
Graham, R. C., & Indorante, S. J. (2017). Concepts of Soil Formation and Soil Survey
The Soils of the USA (pp. 9-27): Springer.
Haeri, S. M., Garakani, A. A., Khosravi, A., & Meehan, C. L. (2013). Assessing the
hydro-mechanical behavior of collapsible soils using a modified triaxial test
device.
Hamory, G., & Ladner, P. (1976). Bitumen stabilisation of a limestone (Calcareous
Aeolinite). Paper presented at the Australian Road Research Board
Conference Proc.
Heelas, R. (2001). Tropical Environments: Costrasting Regimes and Challenges:
Nelson Thornes Limited.
Holtz, W. G. (1961). Settlement of Soil Foundations Due to Saturation.
Homauoni, Z. J., & Yasrobi, S. S. (2011). Stabilization of dune sand with poly (methyl
methacrylate) and polyvinyl acetate using dry and wet processing.
Geotechnical and Geological Engineering, 29(4), 571-579.
Huat, B. B., Gue, S. S., & Ali, F. H. (2007). Tropical residual soils engineering: CRC
Press.
Iyengar, S. R., Masad, E., Rodriguez, A. K., Bazzi, H. S., Little, D., & Hanley, H. J.
(2012). Pavement subgrade stabilization using polymers: characterization and
performance. Journal of Materials in Civil Engineering, 25(4), 472-483.
Jackson, P., Northmore, K., Entwisle, D., Gunn, D., Milodowski, A., Boardman,
D., . . . Dixon, N. (2006). Electrical resistivity monitoring of a collapsing
meta-stable soil. Quarterly Journal of Engineering Geology and
Hydrogeology, 39(2), 151-172.
Jawad, I. T., Taha, M. R., Majeed, Z. H., & Khan, T. A. (2014). Soil stabilization
using lime: Advantages, disadvantages and proposing a potential alternative.
Research Journal of Applied Sciences, Engineering and Technology, 8(4),
510-520.
Jennings, J., & Knight, K. (1957). The additional settlement of foundations due to a
collapse of structure of sandy subsoils on wetting. Paper presented at the
Proceedings.

116
Jennings, J. N. (1975). Desert dunes and estuarine fill in the Fitzroy estuary (north-
western Australia). Catena, 2, 215-262.
Jenny, H. (1994). Factors of soil formation: a system of quantitative pedology:
Courier Corporation.
Kalantari, B. (2013). Foundations on collapsible soils: a review. Proceedings of the
Institution of Civil Engineers-Forensic Engineering, 166(2), 57-63.
Kemp, A. (2004). Sediment control on unsealed roads: a handbook of practical
guidelines for improving stormwater quality. TECHNICAL REPORT.
Kenneally, K. F., Edinger, D. C., & Willing, T. (1996). Broome and beyond: plants
and people of the Dampier Peninsula, Kimberley, Western Australia. Como,
Western Australia: Department of Conservation and Land Management vi,
256p.-col. illus.. ISBN 073096972X En Plant records. Geog, 7.
Khemissa, M., & Mahamedi, A. (2014). Cement and lime mixture stabilization of an
expansive overconsolidated clay. Applied Clay Science, 95, 104-110.
Kilvington, D., & Hamory, G. (1986). The performance of natural gravels as
basecourse in a sealed pavement. Paper presented at the Australian Road
Research Board (ARRB) Conference, 13th, 1986, Adelaide, Australia.
Kumar, A., & Gupta, R. K. (2003). Fundamentals of polymer engineering, revised
and expanded: CRC Press.
Lacey, G. (2004). Do dry powdered polymers work. Paper presented at the
Proceedings from stabilisation of road pavements seminar, NZ Highway
Institute of Technology, Auckland, NZ.
Laugier, M. (1987). Palmqvist indentation toughness in WC-Co composites. Journal
of materials science letters, 6(8), 897-900.
Lawn, B. R., Evans, A., & Marshall, D. (1980). Elastic/plastic indentation damage in
ceramics: the median/radial crack system. Journal of the American Ceramic
Society, 63(9‐10), 574-581.
Lawton, E. C., Fragaszy, R. J., & Hetherington, M. D. (1992). Review of wetting-
induced collapse in compacted soil. Journal of geotechnical engineering,
118(9), 1376-1394.
Lee, H., Vimonsatit, V., & Chindaprasirt, P. (2016). Mechanical and
micromechanical properties of alkali activated fly-ash cement based on nano-
indentation. Construction and Building Materials, 107, 95-102.
Lim, S., Jeon, W., Lee, J., Lee, K., & Kim, N. (2002). Engineering properties of
water/wastewater-treatment sludge modified by hydrated lime, fly ash and
loess. Water research, 36(17), 4177-4184.
Little, D. N., & Nair, S. (2009). Recommended practice for stabilization of subgrade
soils and base materials: National Cooperative Highway Research Program,
Transportation Research Board of the National Academies.
Liu, J., Shi, B., Jiang, H., Huang, H., Wang, G., & Kamai, T. (2011). Research on the
stabilization treatment of clay slope topsoil by organic polymer soil stabilizer.
Engineering Geology, 117(1), 114-120.
Lowe, P. (2003). Pindan Woodlands. Broome, W.A: Environs Kimberley.
Lu, X., Soenen, H., Heyrman, S., & Redelius, P. (2013). Durability of Polymer
Modified Binders in Asphalt Pavements. Paper presented at the XXVIII
International Baltic Road Conference.
Lutenegger, A. J., & Saber, R. T. (1988). Determination of collapse potential of soils.
Lynde, M., & Brooks, E. (2005). Evaluation of latex polymers to resist stripping in
asphalt pavements in Oregon. Retrieved from

117
Main Roads, W. A. (2003). A guide to the selection and use of naturally occurring
materials as base and subbase in roads in Western Australia: Report.
Miura, N., Sakai, A., Taesiri, Y., Yamanouchi, T., & Yasuhara, K. (1990). Polymer
grid reinforced pavement on soft clay grounds. Geotextiles and
Geomembranes, 9(1), 99-123.
Mohamed, A.-M., & El Gamal, M. (2012). Treatment of collapsible soils using sulfur
cement. International Journal of Geotechnical Engineering, 6(1), 65-77.
Mondal, P., Shah, S. P., & Marks, L. (2007). A reliable technique to determine the
local mechanical properties at the nanoscale for cementitious materials.
Cement and Concrete Research, 37(10), 1440-1444.
Moore, R. (1939). Water conduction from shallow water tables. California
Agriculture, 12(6), 383-426.
Moustafa, A., Bazaraa, A., & Nour El Din, A. (1981). Soil stabilization by polymeric
materials. Die Angewandte Makromolekulare Chemie, 97(1), 1-12.
Naeini, S., & Mahdavi, A. (2009). Effect of polymer on shear strength of silty sand.
MS Thesis. Civil Engineering Department, Imam Khomeini International
University, Qazvin, Iran.
Naeini, S. A., & Ghorbanalizadeh, M. (2010). Silty Sand Soils Stabilized with Epoxy
Resin Polymer. Journal of Applied Sciences, 10(22), 2839-2846.
Naeini, S. A., Naderinia, B., & Izadi, E. (2012). Unconfined compressive strength of
clayey soils stabilized with waterborne polymer. KSCE Journal of Civil
Engineering, 16(6), 943-949.
Newman, K., Gill, C., & McCaffrey, T. (2007). Field Testings of Silty Sand Stabilized
Using Combinations of Hydraulic Cement, Fibres and Polymer Emulsions.
Transportanion Research Board, Washington.
Newman, K., & Tingle, J. S. (2004). Emulsion polymers for soil stabilization. Paper
presented at the Presented for the 2004 FAA Worldwide Airport Technology
Transfer Conference.
Ohama, Y. (1998). Polymer-based admixtures. Cement and concrete composites,
20(2-3), 189-212.
Oliver, W. C., & Pharr, G. M. (1992). An improved technique for determining
hardness and elastic modulus using load and displacement sensing indentation
experiments. Journal of materials research, 7(06), 1564-1583.
Oliver, W. C., & Pharr, G. M. (2004). Measurement of hardness and elastic modulus
by instrumented indentation: Advances in understanding and refinements to
methodology. Journal of materials research, 19(01), 3-20.
Papadakis, J. (1975). Climates of the world and their potentialities. Climates of the
world and their potentialities.
Pells, P., Robertson, A., Jennings, J., & Knight, K. (1975). A guide to construction on
or with materials exhibiting additional settlement due to" Collapse" of grain
structure. Retrieved from
Petry, T. M., & Little, D. N. (2002). Review of stabilization of clays and expansive
soils in pavements and lightly loaded structures—history, practice, and future.
Journal of Materials in Civil Engineering, 14(6), 447-460.
Popescu, M. E. (1986). A comparison between the behaviour of swelling and of
collapsing soils. Engineering Geology, 23(2), 145-163.
Rafalko, S., Brandon, T., Filz, G., & Mitchell, J. (2007). Fiber Reinforcement for
Rapid Stabilization of Soft Clay Soils. Transportation Research Record:
Journal of the Transportation Research Board, 2026, 21-29.
doi:10.3141/2026-03

118
Rahman, M. G. F., Talukder, M., & Rahman, A. (2011). Assessment of Soil
Compaction–A Project Study. MIST Journal: GALAXY (DHAKA), 3.
Ramsamooj, D. (2001). An innovative technique for using polymer composites in
airport pavement rehabilitation. Composites Part B: Engineering, 32(1), 57-
66.
Rogers, C. (1995). Types and distribution of collapsible soils Genesis and properties
of collapsible soils (pp. 1-17): Springer.
Rossel, R. V., Minasny, B., Roudier, P., & McBratney, A. (2006). Colour space
models for soil science. Geoderma, 133(3), 320-337.
Santoni, R., Tingle, J., & Nieves, M. (2005). Accelerated strength improvement of
silty sand with nontraditional additives. Transportation Research Record:
Journal of the Transportation Research Board(1936), 34-42.
Saride, S., Puppala, A. J., & Chikyala, S. R. (2013). Swell-shrink and strength
behaviors of lime and cement stabilized expansive organic clays. Applied Clay
Science, 85, 39-45.
Schoknecht, N. R., & Pathan, S. (2013). Soil groups of Western Australia: A simple
guide to the main soils of Western Australia.
Sharp, K., & Andrews, B. (2009). Stabilising Unsealed Roads Efficiently. Road &
Transport Research: A Journal of Australian and New Zealand Research and
Practice, 18(3), 69.
Shirsavkar, S., & Koranne, S. (2010). Innovation in road construction using natural
polymer. Electronic Journal of Geo-Technical Engineering, 15, 1614-1624.
Sinclair Knight Merz. (2009). Broome north development Engineering report.
Retrieved from
Singh, H., & Huat, B. B. (2004). Origin, formation and occurrence of tropical residual
soils Tropical Residual Soils Engineering (pp. 1-19): Taylor & Francis.
Smith, J., & Sullivan, L. (2014). Construction and maintenance of embankments
using highly erodible soils in the Pilbara, north-western Australia.
International Journal of GEOMATE, 6(2), 897-902.
Smolinski, H. J., Galloway, P., & Laycock, J. (2016). Pindan soils in the La Grange
area, West Kimberley: land capability assessment for irrigated agriculture.
Standards Australia. (1996a). Absorption, swell and capillary rise of compacted
materials (AS 1141.53:1996). Retrieved from Standards Online.
Standards Australia. (1996b). Residential slabs and footings (AS 2870:1996).
Retrieved from Standards Online.
Standards Australia. (2006). Soil classification tests - Determination of the soil
particle density of a soil - Standard method (AS 1289.3.5.1:2006). Retrieved
from Standards Online.
Standards Australia. (2008). Unconfined compressive strength of compacted
materials (AS 5101.4:2008). Retrieved from Standards Online.
Standards Australia. (2009). Soil classification tests - Determination of the particle
size distribution of a soil - Standard method of analysis by sieving (AS
1289.3.6.1:2009). Retrieved from Standards Online.
Standards Australia. (2011). Residential slabs and footings (AS 2870:2011).
Retrieved from Standards Online.
Standards Australia. (2014). Soil strength and consolidation tests - Determination of
the California Bearing Ratio of a soil - Standard laboratory method for a
remoulded (AS 1289.6.1.1:2014). Retrieved from Standards Online. .

119
Standards Australia. (2017a). Soil compaction and density tests - Determination of
the dry density/moisture content relation of a soil using modified compactive
(AS 1289.5.2.1:2017). Retrieved from Standards Online.
Standards Australia. (2017b). Soil compaction and density tests - Determination of
the dry density/moisture content relation of a soil using standard compactive
(AS 1289.5.1.1:2017). Retrieved from Standards Online. .
Taha, M. R., Soliman, E., Sheyka, M., Reinhardt, A., & Al-Haik, M. (2010). Fracture
toughness of hydrated cement paste using nanoindentation.
Tayfur, S., Ozen, H., & Aksoy, A. (2007). Investigation of rutting performance of
asphalt mixtures containing polymer modifiers. Construction and Building
Materials, 21(2), 328-337.
Tingle, J., Newman, J., Larson, S., Weiss, C., & Rushing, J. (2007). Stabilization
mechanisms of nontraditional additives. Transportation Research Record:
Journal of the Transportation Research Board(1989), 59-67.
Ulm, F. J., Vandamme, M., Bobko, C., Alberto Ortega, J., Tai, K., & Ortiz, C. (2007).
Statistical indentation techniques for hydrated nanocomposites: concrete,
bone, and shale. Journal of the American Ceramic Society, 90(9), 2677-2692.
Vázquez, M., Justo, J., & Durand, P. (2013). A simplified model for collapse using
suction controlled tests.
Welling, G. E. (2012). Engineering performance of polymer amended soils.
California Polytechnic State University San Luis Obispo.
Western Australia. Department of Regional Development and the North West. (1984).
Stabilisation and compaction of Pindan brick soils for brick manufacture : a
report prepared for the government of Western Australia. Perth, W.A: Dept.
of Regional Development and the North West.
Woodward, H. P. (1891). ... Report on the Goldfields of the Kimberley District: R.
Pether, government printer.
Yazdandoust, F., & Yasrobi, S. S. (2010). Effect of cyclic wetting and drying on
swelling behavior of polymer-stabilized expansive clays. Applied Clay
Science, 50(4), 461-468.
Yildirim, Y. (2007). Polymer modified asphalt binders. Construction and Building
Materials, 21(1), 66-72.
Zandieh, A. R., & Yasrobi, S. S. (2010). Study of factors affecting the compressive
strength of sandy soil stabilized with polymer. Geotechnical and Geological
Engineering, 28(2), 139-145.