Chapters 8 and 9 Fundamentals of Decision Making & Planning and Decision Aids.
45
Chapters 8 and 9 Chapters 8 and 9 Fundamentals of Decision Making Fundamentals of Decision Making & & Planning and Decision Aids Planning and Decision Aids
-
Upload
sophia-alexander -
Category
Documents
-
view
233 -
download
0
Transcript of Chapters 8 and 9 Fundamentals of Decision Making & Planning and Decision Aids.

Chapters 8 and 9Chapters 8 and 9
Fundamentals of Decision MakingFundamentals of Decision Making
&&
Planning and Decision AidsPlanning and Decision Aids
OVERVIEWOVERVIEW CHAPTER 8CHAPTER 8
What is Decision Making What is Decision Making Conditions that affect decision makingConditions that affect decision making The Differences between decision typesThe Differences between decision types Understanding how goals relate to Understanding how goals relate to
decision makingdecision making Understanding the three models of Understanding the three models of
decision makingdecision making
What is Decision MakingWhat is Decision Making
The process of defining problems, The process of defining problems, gathering information, making sense of gathering information, making sense of that information, generating alternatives, that information, generating alternatives, and choosing a course of action.and choosing a course of action.

Conditions Under Which Conditions Under Which Decisions Are MadeDecisions Are Made
Certainty vs. Certainty vs. Uncertainty Uncertainty
RiskRisk Objective Probability Objective Probability
vs. Subjective vs. Subjective ProbabilityProbability

Certainty vs. UncertaintyCertainty vs. Uncertainty
CertaintyCertainty The condition under The condition under
which individuals are which individuals are fully informed about a fully informed about a problem, alternative problem, alternative solutions are obvious, solutions are obvious, and the possible and the possible results of each results of each solution are clear.solution are clear.
UncertaintyUncertainty The condition under The condition under
which an individual which an individual does not have the does not have the necessary information necessary information to assign probabilities to assign probabilities to the outcome of to the outcome of alternative solutions.alternative solutions.
RiskRisk
The condition under which individuals The condition under which individuals can define a problem, specify the can define a problem, specify the probability of certain events, identify probability of certain events, identify alternative solutions, and state the alternative solutions, and state the probability of each solution leading to the probability of each solution leading to the desired resultsdesired results
Generally a risk falls somewhere Generally a risk falls somewhere between the extremes of certainty and between the extremes of certainty and uncertainty.uncertainty.
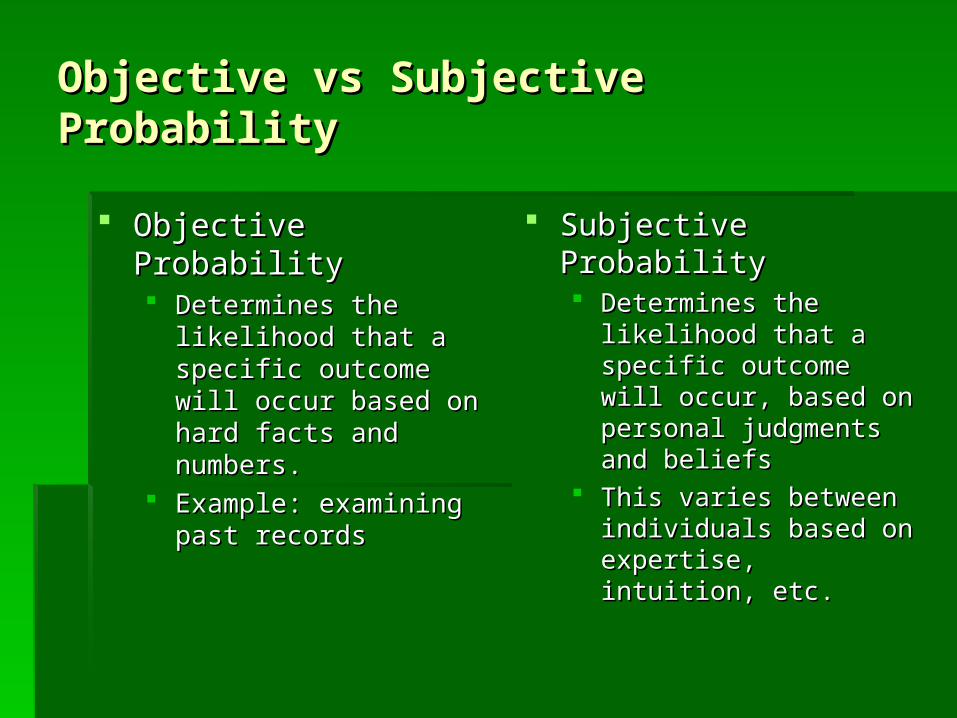
Objective vs Subjective ProbabilityObjective vs Subjective Probability
Objective ProbabilityObjective Probability
Determines the likelihood Determines the likelihood that a specific outcome that a specific outcome will occur based on hard will occur based on hard facts and numbers.facts and numbers.
Example: examining past Example: examining past recordsrecords
Subjective ProbabilitySubjective Probability Determines the likelihood Determines the likelihood
that a specific outcome that a specific outcome will occur, based on will occur, based on personal judgments and personal judgments and beliefsbeliefs
This varies between This varies between individuals based on individuals based on expertise, intuition, etc.expertise, intuition, etc.
Types of Decisions to be MadeTypes of Decisions to be Made
Routine Decisions: choices made in response to relatively Routine Decisions: choices made in response to relatively well-defined and common problems and alternative well-defined and common problems and alternative solutions.solutions.
Adaptive Decisions: choices made in response to a Adaptive Decisions: choices made in response to a combination of moderately unusual and only partially known combination of moderately unusual and only partially known problems and alternative solutions problems and alternative solutions
Continuous improvement: streams of adaptive decisions Continuous improvement: streams of adaptive decisions made over time in an organization that result in a large made over time in an organization that result in a large number of small, incremental improvements year after year.number of small, incremental improvements year after year.
Innovative decisions: choices based on the discovery, Innovative decisions: choices based on the discovery, identification, and diagnosis of unusual and ambiguous identification, and diagnosis of unusual and ambiguous problems and the development of unique or creative problems and the development of unique or creative alternative solutionsalternative solutions..

Goals affect decision Goals affect decision makingmaking
Goals are results to be Goals are results to be attainedattained
Therefore, giving Therefore, giving direction to decisions direction to decisions and actions.and actions.
When a goal is changed When a goal is changed or modified, the or modified, the individual is engaging in individual is engaging in the decision making the decision making process.process.

General and Operational GoalsGeneral and Operational Goals
General Goals: provide broad direction General Goals: provide broad direction for decision making in qualitative terms.for decision making in qualitative terms.
Operational goals state what is to be Operational goals state what is to be achieved in quantitative terms, for whom, achieved in quantitative terms, for whom, and within what time period.and within what time period.
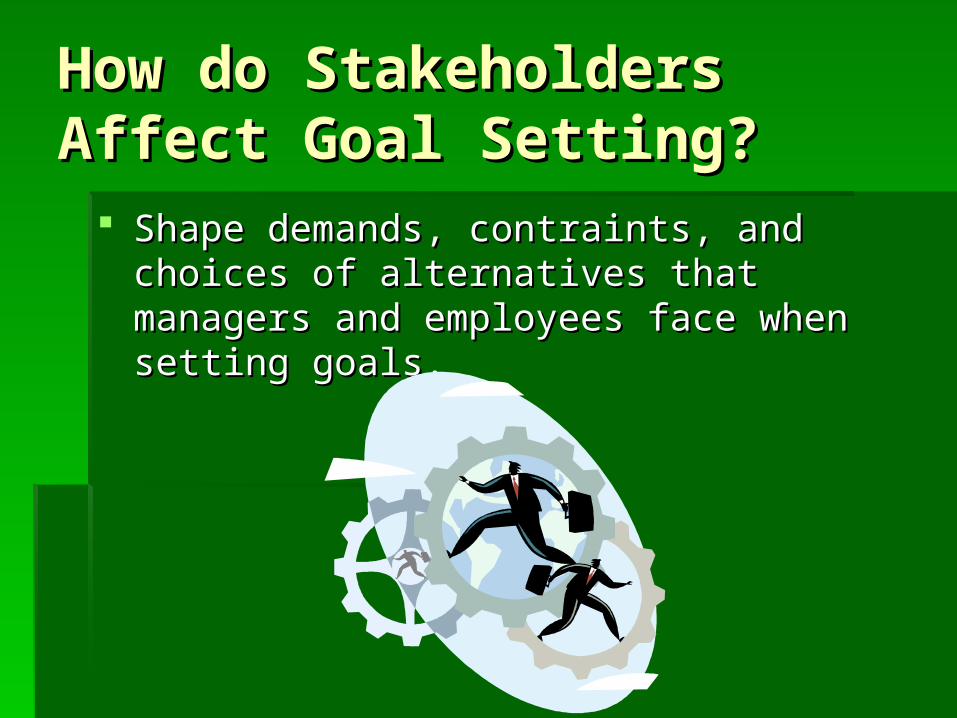
How do Stakeholders How do Stakeholders Affect Goal Setting?Affect Goal Setting?
Shape demands, contraints, and choices of Shape demands, contraints, and choices of alternatives that managers and employees alternatives that managers and employees face when setting goals.face when setting goals.
Decision-Making ModelsDecision-Making Models
RationalRational
Bounded RationalBounded Rational
PoliticalPolitical
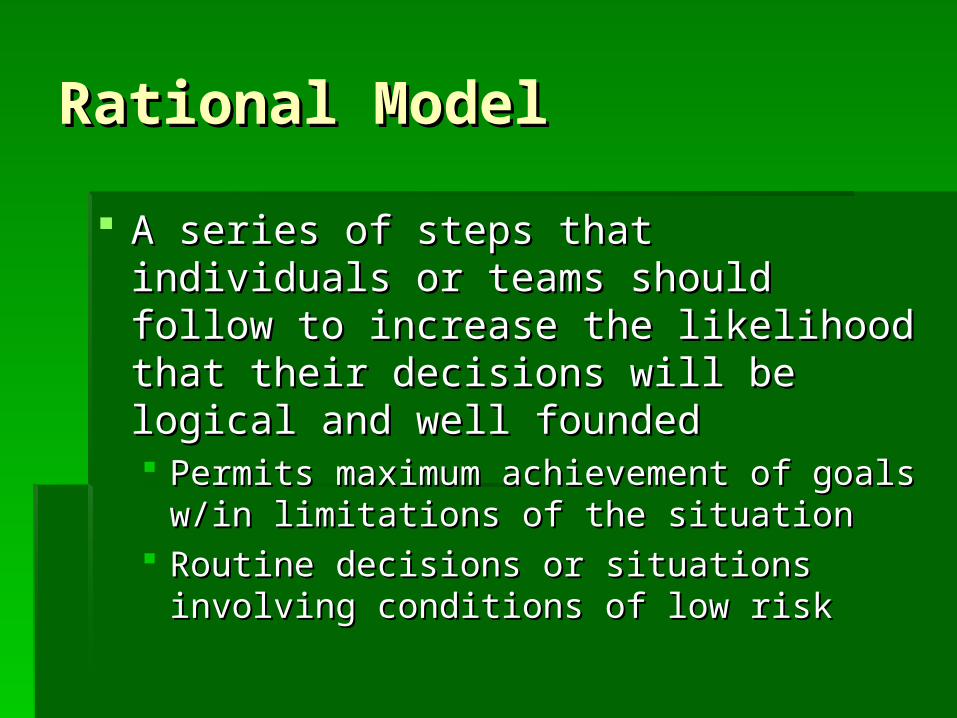
Rational ModelRational Model
A series of steps that individuals or A series of steps that individuals or teams should follow to increase the teams should follow to increase the likelihood that their decisions will be likelihood that their decisions will be logical and well foundedlogical and well founded Permits maximum achievement of goals w/in Permits maximum achievement of goals w/in
limitations of the situationlimitations of the situation Routine decisions or situations involving Routine decisions or situations involving
conditions of low riskconditions of low risk
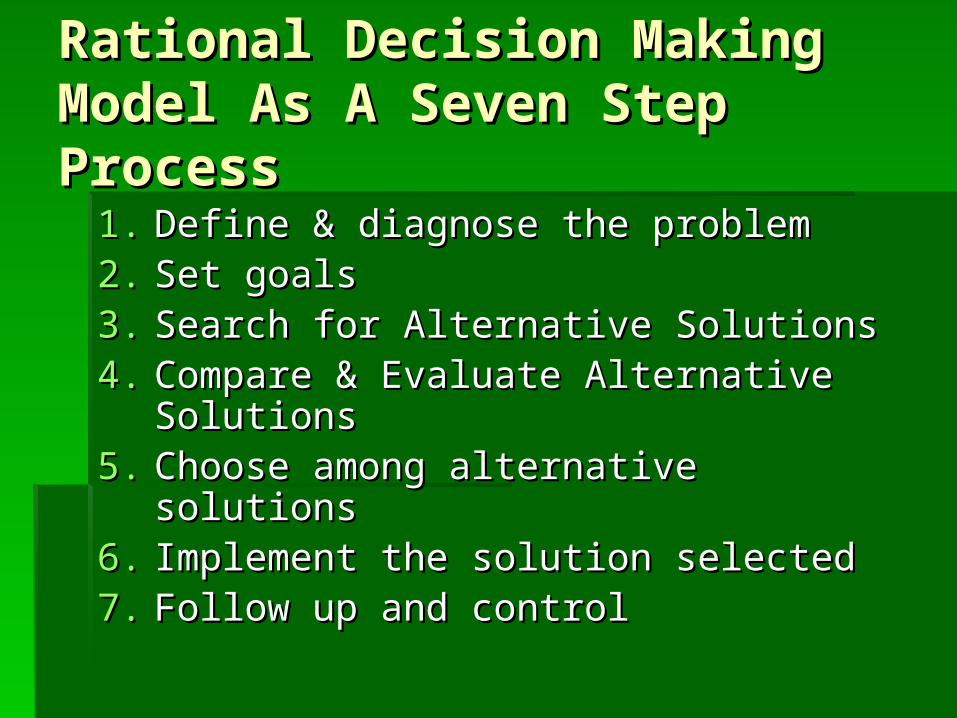
Rational Decision Making Rational Decision Making Model As A Seven Step Model As A Seven Step ProcessProcess
1.1. Define & diagnose the problemDefine & diagnose the problem2.2. Set goalsSet goals3.3. Search for Alternative SolutionsSearch for Alternative Solutions4.4. Compare & Evaluate Alternative Compare & Evaluate Alternative
SolutionsSolutions5.5. Choose among alternative solutionsChoose among alternative solutions6.6. Implement the solution selectedImplement the solution selected7.7. Follow up and controlFollow up and control

Bounded Rationality Bounded Rationality ModelModel
An individual’s tendency…An individual’s tendency…1.1. To select less than the best goal or To select less than the best goal or
alternative solutionalternative solution2.2. To engage in a limited search for To engage in a limited search for
alternative solutionsalternative solutions3.3. To have inadequate information & To have inadequate information &
control over external and internal control over external and internal environmental forces influencing the environmental forces influencing the outcomes of decisionsoutcomes of decisions
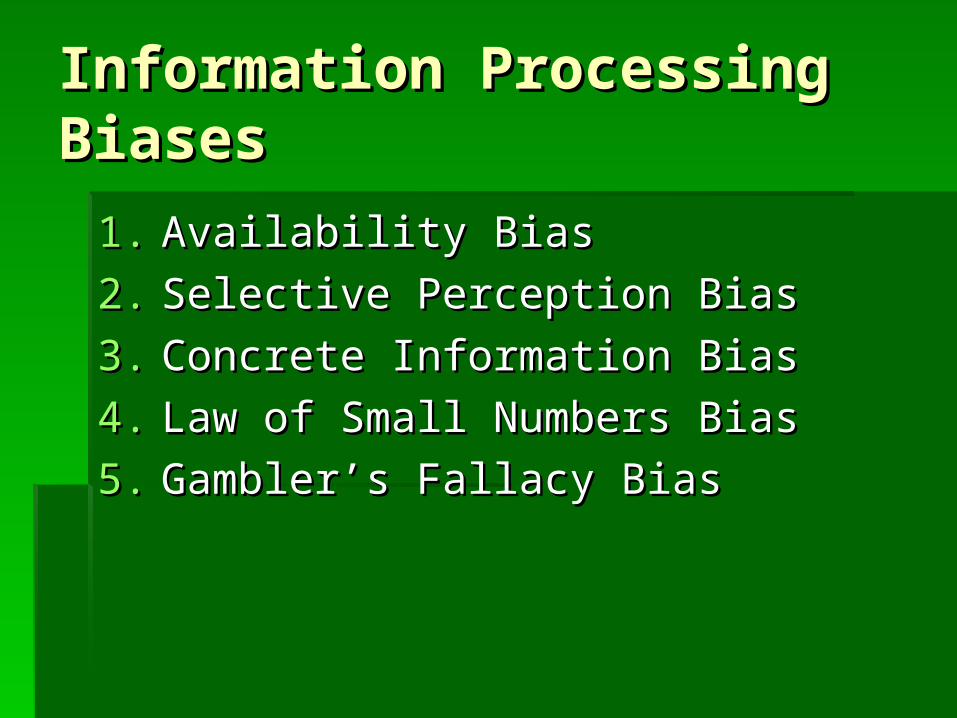
Information Processing Information Processing BiasesBiases
1.1. Availability BiasAvailability Bias
2.2. Selective Perception BiasSelective Perception Bias
3.3. Concrete Information BiasConcrete Information Bias
4.4. Law of Small Numbers BiasLaw of Small Numbers Bias
5.5. Gambler’s Fallacy BiasGambler’s Fallacy Bias
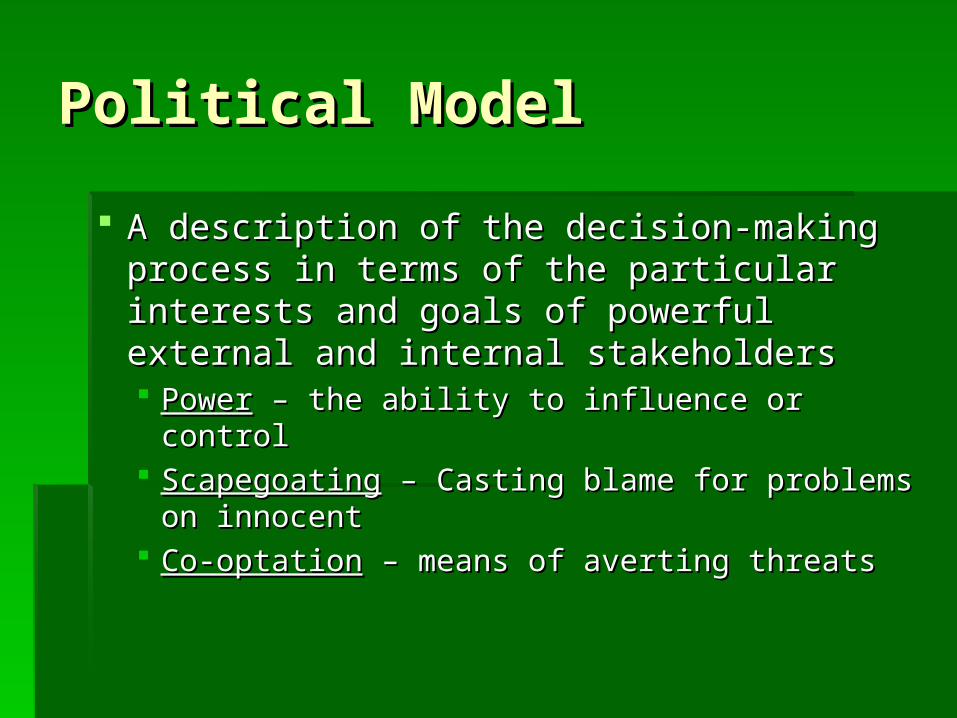
Political ModelPolitical Model
A description of the decision-making A description of the decision-making process in terms of the particular process in terms of the particular interests and goals of powerful external interests and goals of powerful external and internal stakeholdersand internal stakeholders PowerPower – the ability to influence or control – the ability to influence or control ScapegoatingScapegoating – Casting blame for problems – Casting blame for problems
on innocenton innocent Co-optationCo-optation – means of averting threats – means of averting threats

CHAPTER 9 OUTLINECHAPTER 9 OUTLINE
ForecastingForecasting 3 Forecasting Aids: Scenario, Delphi, and 3 Forecasting Aids: Scenario, Delphi, and
SimulationSimulation BrainstormingBrainstorming Cause and Effect RelationshipsCause and Effect Relationships TQM topicsTQM topics Pert NetworkPert Network
FORECASTINGFORECASTING
Is the projecting, Is the projecting, predicting, or estimating predicting, or estimating future events or future events or conditions in an conditions in an organization’s organization’s environment.environment.
Forecasting deals with Forecasting deals with conditions or external conditions or external events beyond the events beyond the organization’s control organization’s control that are important to its that are important to its survival.survival.
EXAMPLES ????EXAMPLES ????

ExtrapolationExtrapolation: : uses both the past uses both the past and present to and present to predict the futurepredict the future..
FOUR FORCASTING PITFALLSFOUR FORCASTING PITFALLS
1) Listening to the 1) Listening to the media.media.
2) Assuming things are 2) Assuming things are going to return to the going to return to the way they used to be.way they used to be.
3) Hearsay3) Hearsay
4) Tunnel Vision4) Tunnel Vision
First forecasting aid: First forecasting aid: SCENARIOSCENARIO Written description of a possible future.Written description of a possible future. 3 scenarios are usually given for companies 3 scenarios are usually given for companies
and they are for the best case, worst case, and they are for the best case, worst case, and most likely to occur.and most likely to occur.
Scenarios provide possibilities of what could Scenarios provide possibilities of what could happen and the business can plan strategies.happen and the business can plan strategies.
They give companies a broad vision of They give companies a broad vision of possible events. possible events.
Companies can identify patterns, Companies can identify patterns, interrelationships, and generalizations that interrelationships, and generalizations that help plan for the future.help plan for the future.

Second forecasting aid: Second forecasting aid: DELPHI TECHNIQUEDELPHI TECHNIQUE
Based on a Based on a consensus of a group consensus of a group of experts.of experts.
This technique relies This technique relies on opinions, so it is on opinions, so it is not foolproof, but it is not foolproof, but it is usually more accurate usually more accurate than an opinion from than an opinion from one expert.one expert.
3 BASIC STEPS OF THE 3 BASIC STEPS OF THE DELPHI TECHNIQUEDELPHI TECHNIQUE
STEP 1STEP 1:: Questionnaire is sent to a group of Questionnaire is sent to a group of experts.experts.
STEP 2STEP 2:: Summary of the first round is Summary of the first round is prepared.prepared.
STEP 3STEP 3:: Summary of the second round is Summary of the second round is prepared.prepared.
Third forecasting aid: Third forecasting aid: SIMULATIONSIMULATION
A representation of a A representation of a real system.real system.
Effects of environmental Effects of environmental changes and internal changes and internal management decisions management decisions can be forecasted by can be forecasted by simulation.simulation.
The simulation goal is to The simulation goal is to test reality without test reality without actually experiencing it. actually experiencing it.
Downfalls: impossible to Downfalls: impossible to apply all aspects and it is apply all aspects and it is expensive.expensive.
VIRTUAL REALITYVIRTUAL REALITY
Simulation by Simulation by computer systems.computer systems.
The user can “enter”, The user can “enter”, move around, and move around, and interact with objects.interact with objects.
Flight SimulatorsFlight Simulators
BRAINSTORMINGBRAINSTORMING
Flow of ideas without restrictions or Flow of ideas without restrictions or judgments.judgments.
4 BASIC RULES OF 4 BASIC RULES OF BRAINSTORMINGBRAINSTORMING
1)1) Criticism is ruled out.Criticism is ruled out.
2)2) Freewheeling is Freewheeling is welcomed.welcomed.
3)3) Quantity is wanted.Quantity is wanted.
4)4) Combination and Combination and improvement are improvement are sought.sought.
Cause and EffectCause and Effect
A then B, therefore A causes BA then B, therefore A causes B But what about C, D, E, F??But what about C, D, E, F?? Cause and effect Diagram- helps back Cause and effect Diagram- helps back
track a problem to its rootstrack a problem to its roots Also known as fishbone diagramsAlso known as fishbone diagrams

General Framework of Cause and Effect General Framework of Cause and Effect (Fishbone) Diagram(Fishbone) Diagram
Adapted from Figure 9.1
People Materials
Equipment Methods
Effect(or ProblemStatement)
9.6

Cause and Effect DiagramCause and Effect Diagram
The cause and effect diagram helps team The cause and effect diagram helps team members display, categorize, and members display, categorize, and evaluate all the possible causes of an evaluate all the possible causes of an effect, which is generally expressed as a effect, which is generally expressed as a problem.problem.
Cause and effect stepsCause and effect steps
Step 1Step 1: the team needs to agree on the effect, : the team needs to agree on the effect, which should be stated in terms of the problemwhich should be stated in terms of the problem
Step 2Step 2: the team identifies all the general factors of : the team identifies all the general factors of categories that contribute to the problem, which will categories that contribute to the problem, which will help the team organize the specific causeshelp the team organize the specific causes
Step 3: the team may also use brainstorming or Step 3: the team may also use brainstorming or other techniques to generate all the possible other techniques to generate all the possible causes that contribute to the problem (or effect) in causes that contribute to the problem (or effect) in that categorythat category
Step 4Step 4: Involves reaching agreement on the top 3-: Involves reaching agreement on the top 3-5 root causes in each major category5 root causes in each major category
TQM TopicsTQM Topics
Benchmarking- comparing self to the best in Benchmarking- comparing self to the best in terms of: terms of:
*process, strategies, products, and*process, strategies, products, and
performanceperformance
Steps:Steps:
1.1. Define domainDefine domain
2.2. Determine what is bestDetermine what is best
3.3. Collect information to create performance gapCollect information to create performance gap
The Benchmarking The Benchmarking ProcessProcess
1. Define the issue1. Define the issue 2. Identify the best performers2. Identify the best performers 3. Collect and analyze data to identify gaps3. Collect and analyze data to identify gaps 4. Set improvement goals4. Set improvement goals 5. Develop and implement plans5. Develop and implement plans 6. Evaluate results6. Evaluate results 7. Repeat evaluation7. Repeat evaluation
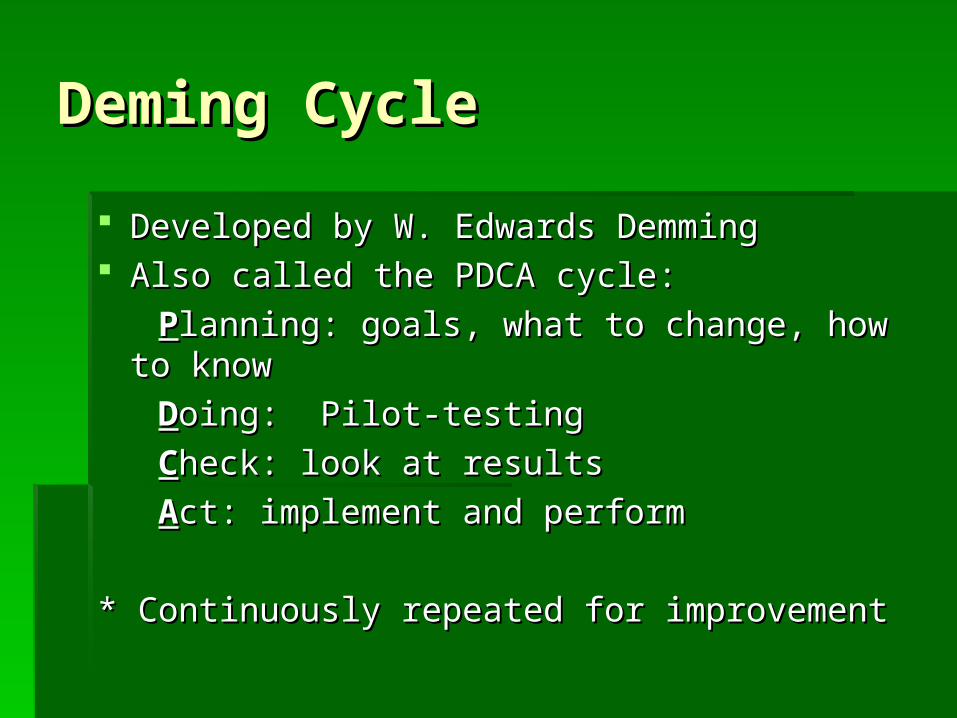
Deming CycleDeming Cycle
Developed by W. Edwards DemmingDeveloped by W. Edwards Demming Also called the PDCA cycle:Also called the PDCA cycle:
PPlanning: goals, what to change, how to knowlanning: goals, what to change, how to know
DDoing: Pilot-testingoing: Pilot-testing
CCheck: look at resultsheck: look at results
AAct: implement and performct: implement and perform
* Continuously repeated for improvement* Continuously repeated for improvement
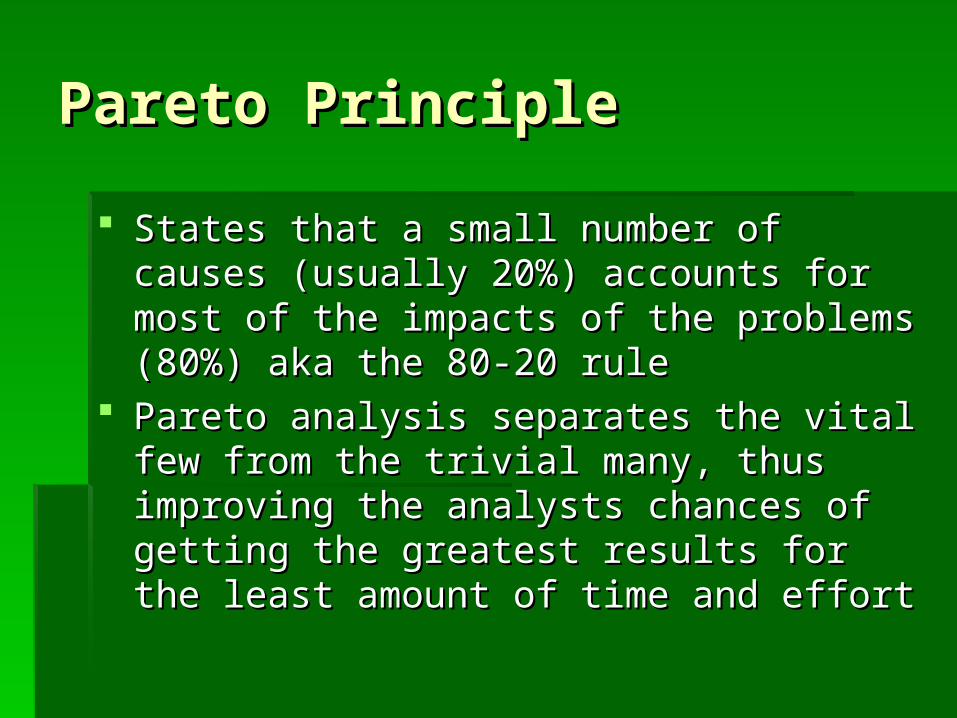
Pareto PrinciplePareto Principle
States that a small number of causes (usually States that a small number of causes (usually 20%) accounts for most of the impacts of the 20%) accounts for most of the impacts of the problems (80%) aka the 80-20 ruleproblems (80%) aka the 80-20 rule
Pareto analysis separates the vital few from the Pareto analysis separates the vital few from the trivial many, thus improving the analysts trivial many, thus improving the analysts chances of getting the greatest results for the chances of getting the greatest results for the least amount of time and effortleast amount of time and effort
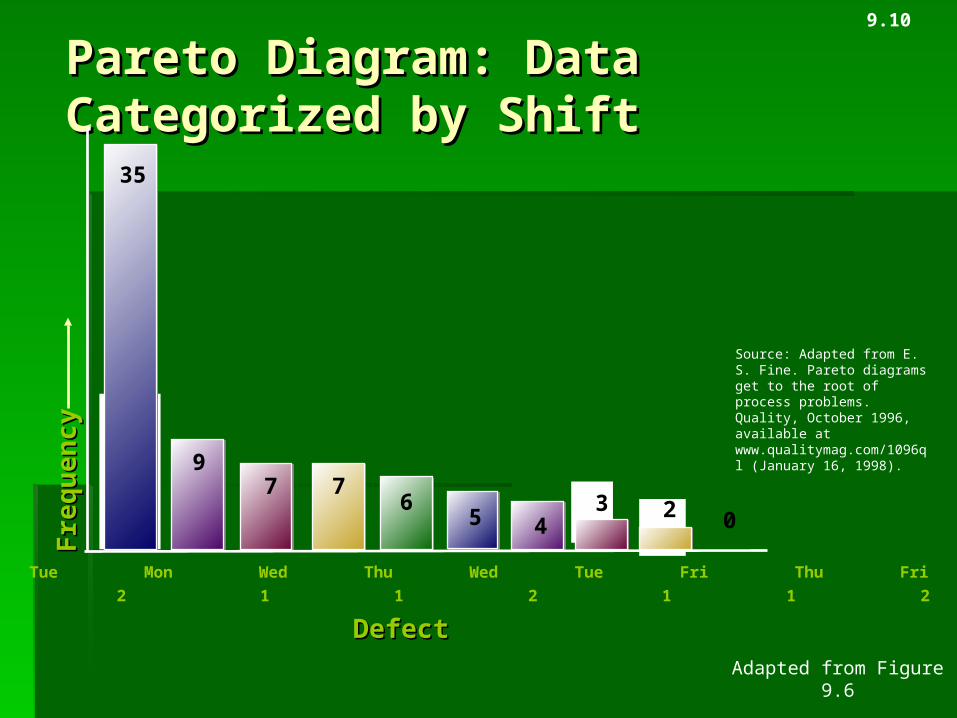
Pareto Diagram: Data Pareto Diagram: Data Categorized by ShiftCategorized by Shift
Fre
qu
en
cyF
req
ue
ncy
DefectDefect
Source: Adapted from E. S. Fine. Pareto diagrams get to the root of process problems. Quality, October 1996, available at www.qualitymag.com/1096ql (January 16, 1998).
Adapted from Figure 9.6
03 2
35
97 7
65 4
Mon Tue Mon Wed Thu Wed Tue Fri Thu Fri
1 2 2 1 1 2 1 1 2 2
9.10
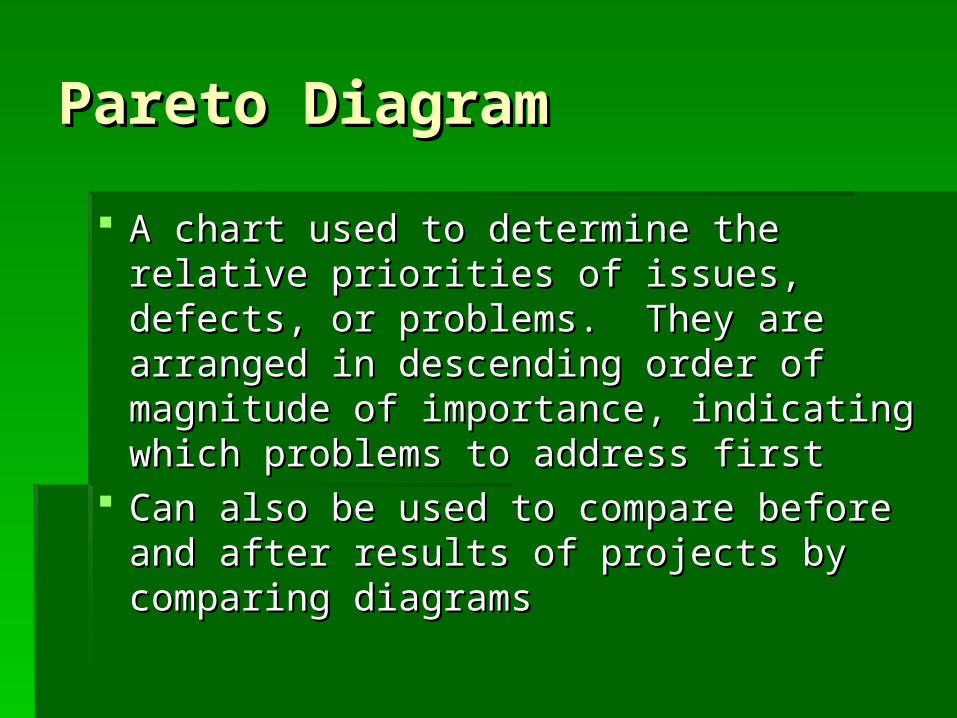
Pareto DiagramPareto Diagram
A chart used to determine the relative A chart used to determine the relative priorities of issues, defects, or problems. priorities of issues, defects, or problems. They are arranged in descending order of They are arranged in descending order of magnitude of importance, indicating magnitude of importance, indicating which problems to address firstwhich problems to address first
Can also be used to compare before and Can also be used to compare before and after results of projects by comparing after results of projects by comparing diagramsdiagrams
PERTPERT
PProgram rogram EEvaluation and valuation and RReview eview TTechniqueechnique
- Method of sequencing activities and - Method of sequencing activities and estimating cost and time for project completionestimating cost and time for project completion
First use:First use: 1958 – Polaris missile1958 – Polaris missile
programprogram
Commonly used for:Commonly used for:
1.1. One-of-a-kind projects – Disney WorldOne-of-a-kind projects – Disney World
2.2. Projects involving new production Projects involving new production processes – robotic automobile plantprocesses – robotic automobile plant
3.3. Projects with multiple/interlocking Projects with multiple/interlocking building processes – apartment building processes – apartment complexescomplexes
PERT NetworkPERT Network
Diagram showing the sequence and Diagram showing the sequence and relationships of activities and events to relationships of activities and events to finish a projectfinish a project
Critical Path – the path which takes the Critical Path – the path which takes the longest time to completelongest time to complete
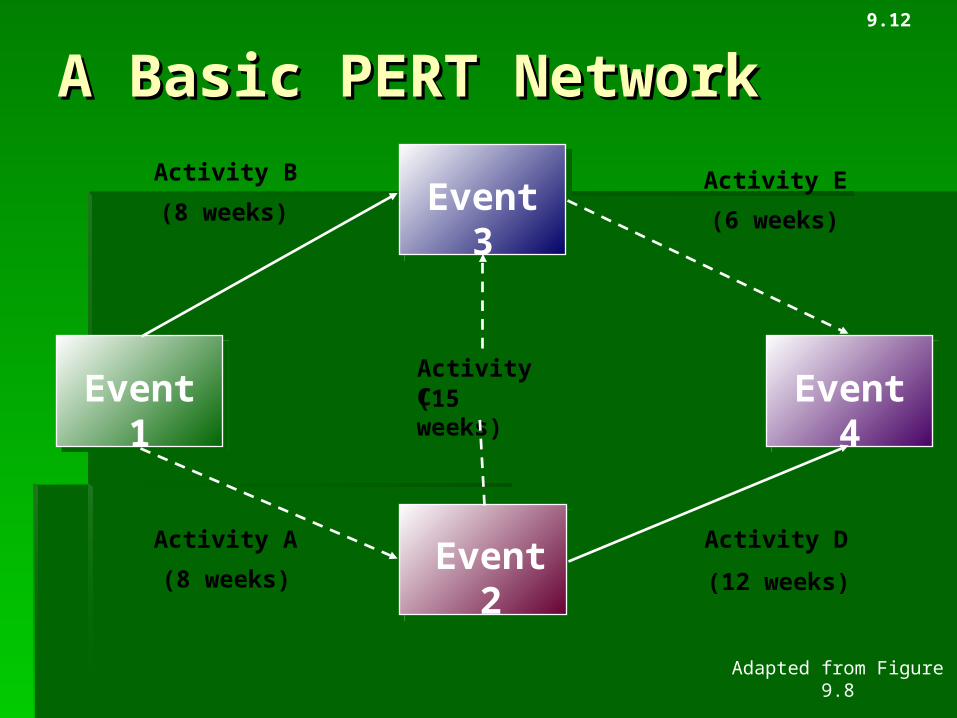
A Basic PERT NetworkA Basic PERT Network
Event 1
Activity B
(8 weeks)Activity E
(6 weeks)
Activity A Activity D
(8 weeks) (12 weeks)
Activity C(15 weeks)
Event 3
Event 2
Event 4
Adapted from Figure 9.8
9.12
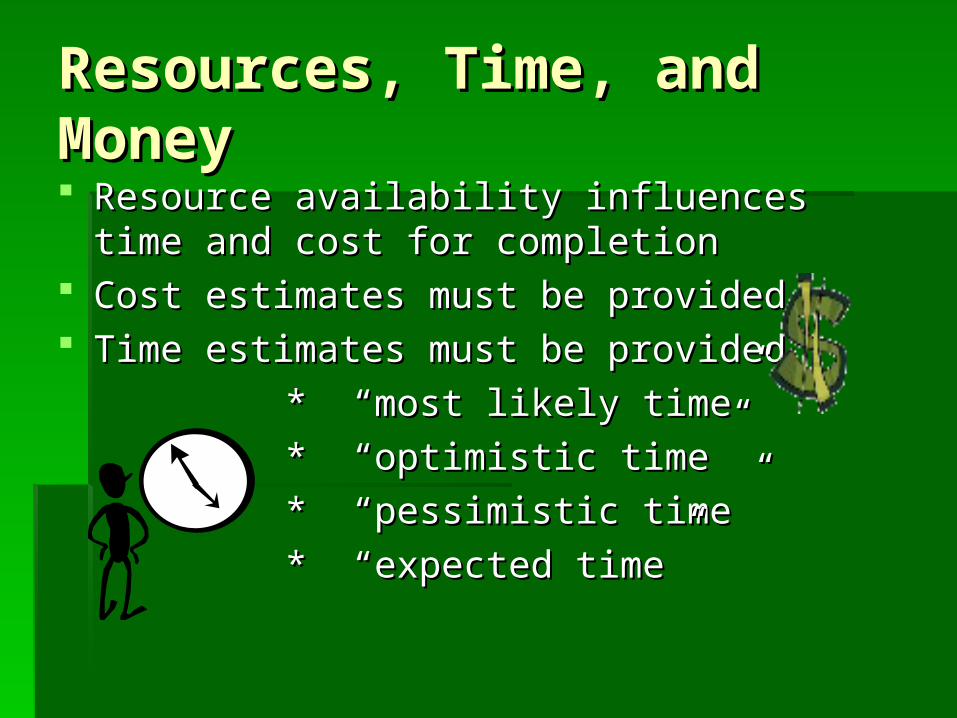
Resources, Time, and Resources, Time, and MoneyMoney Resource availability influences time and cost for Resource availability influences time and cost for
completioncompletion Cost estimates must be providedCost estimates must be provided Time estimates must be providedTime estimates must be provided
* “most likely time”* “most likely time”
* “optimistic time”* “optimistic time”
* “pessimistic time”* “pessimistic time”
* “expected time”* “expected time”
PurposePurpose Used as a control mechanism that allows project Used as a control mechanism that allows project
managers to monitor differences in actual and managers to monitor differences in actual and projected estimates, resulting in more efficient projected estimates, resulting in more efficient completion. completion.
THE ENDTHE END
COURTESY OF THE PEANUT COURTESY OF THE PEANUT GALLERYGALLERY