Chapters 6, 7 and 8
38
Chapters 6, 7 and 8 Benefit-Cost Analysis © 2015 McGraw-Hill Ryerson Ltd. Econ 260 1
Transcript of Chapters 6, 7 and 8
Chapters 6, 7 and 8
Benefit-Cost Analysis
© 2015 McGraw-Hill Ryerson Ltd.
Econ 260
1

Learning Objectives
1. Define the basic framework for the benefit-cost analysis and how it could be used to access government projects and regulatory actions.
2. Show graphically that a project which maximizes net social benefits will be equivalent to the socially efficient equilibrium.
3. Explain the role of discounting in benefit-cost analysis and why the social and private discount rates will typically differ.
4. Explain how the equity and the distribution of income enter into benefit-cost analysis.
5. Describe how expected values can reflect uncertainty and how they can be used in benefit-cost analysis.
6. Define cost effectiveness and when it is used instead of benefit-cost analysis.
© 2015 McGraw-Hill Ryerson Ltd.

Benefit-Cost Analysis (BCA)
• BCA analysis involves measuring, adding up, and comparing all the benefits and all the costs of a public program.
• BCA can be used to analytically quantify potential effectiveness of a decision by estimating a net positive or negative result.
LO1© 2015 McGraw-Hill Ryerson Ltd.
Why use BCA?
• BCA analysis helps society make informed decisions and use scarce resources efficiently
LO1© 2015 McGraw-Hill Ryerson Ltd.
BCA is from Society’s Point of View
• BCA is done from the standpoint of society in general rather from the perspective of a single profit-making firm
• BCA incorporates social valuation of all inputs and outputs related to the project whether or not they are transacted in private markets
LO1© 2015 McGraw-Hill Ryerson Ltd.

Basic Framework for BCA
1. Specify clearly the project or program, including its scale and the perspective of the study
2. Describe quantitatively the inputs and outputs of the program (in quantity numbers)
3. Estimate the social costs and benefits of these inputs and outputs (usually in dollars)
4. Compare these benefits and costs (find the net benefit)
LO1© 2015 McGraw-Hill Ryerson Ltd.

Socially Efficient Scale
• Figure 6-1
• The point where MAC=MD has the highest social efficiency scale, and is the place where net benefits of a program are maximized.
© 2015 McGraw-Hill Ryerson Ltd. 7LO2

Discounting Benefit-Cost Analysis
• Discounting is a way of aggregating a series of future net benefits into an estimate of present value which can be used in BCA calculations.
• Projecting return on investment and interest rates allows economists to determine net benefits over time.
Public and Private Discount Rates• Individuals often use private discount rates (PDR)
which are generated by single capital markets. • Governments often use social discount rates (SDR)
which take into account lower costs of borrowing and externalities such as pollution.
© 2015 McGraw-Hill Ryerson Ltd. 8LO3

Choosing a Discount Rate
• The discount rate generally reflects society’s rate of time preference
• A relatively low discount rate values future benefits and costs at a level similar to present benefits and costs
• A relatively high discount rate implies that future benefits and costs have little value compared to current benefits and costs
© 2015 McGraw-Hill Ryerson Ltd. 9LO3

Distributing Net Benefits
•Economic Efficiency and equitable distribution of cost and benefits must be taken into account when government introduces programs and policies.
•3 Types of Distributional Impacts of Programs and Policies
-Proportional. A program takes equal proportions of everyone’s income to
achieve net benefit.
-Regressive. A program provides individuals with high incomes a higher
net benefit over lower income individuals based on proportion of income
used.
-Progressive. A program provides net benefits that represent a higher
proportion of the lower income-person’s income than it does the rich
persons income.
•Considering how a program or policy will distribute aggregates through a
population is necessary to address the fairness of that plan.
LO4© 2015 McGraw-Hill Ryerson Ltd.

Future Uncertainty
• Uncertainty may exist when anticipating future values of benefits and costs.• For example we are uncertain when and where an earthquake may
strike. Therefore it is hard to estimate how much we extra we should spend today to make buildings strong to withstand an earthquake that may or may not occur in our lifetimes
• Probabilities can be created based on previous data or expert advice to help gauge the likelihood of future occurrences to better understand the risks involved.
Scenario Analysis• We may want to create future scenarios to address uncertainty• For example, calculating a benefit-cost analysis of reducing CO2
emissions to lessen the greenhouse effect requires estimations of future energy saving technologies. As a result, scenarios can be presented based on “slow,” “moderate,” or “fast” advancement rate.
LO5 © 2015 McGraw-Hill Ryerson Ltd.

Cost-Effectiveness Analysis
• Cost-effectiveness analysis can be considered one-half of a benefit-cost analysis, in that it only involves the cost and not the benefits.
• A cost-effective policy will achieve the greatest level of benefit for the lowest cost among possible options.
• When measuring benefits is difficult, a cost-effectiveness study will sometimes be used because it is often easier to estimate costs of a plan or program. This often happens when data on a particular program is lacking.
LO6© 2015 McGraw-Hill Ryerson Ltd.

Chapter Overview
This chapter introduced benefit-cost analysis as the primary way of measuring benefits and costs associated with a resource or environmental program or policy.
Several important facets of this were discussed including- the basic analytical steps involved- determining the appropriate size of a project- calculating the present value of net benefits- issues in discounting future values- distributional ideas, and- uncertainty
Chapters 7 and 8 will focus on specific environmental programs and difficulties associated with measuring costs and benefits.
© 2015 McGraw-Hill Ryerson Ltd.

Chapter 7Benefits and Cost Analysis:
Benefits
© 2015 McGraw-Hill Ryerson Ltd. 14

Learning Objectives
1. Distinguish between direct and indirect methods of
calculating the Willingness To Pay (WTP) for improvements
in environmental quality.
2. Explain the concept of producer surplus and how to
calculate it graphically.
3. Explain the concept of consumer surplus and how to
calculate it graphically for a market good and a public good.
4. Describe four methods of imputing WTP for improvements in
environmental quality.
5. Explain why Willingness To Accept (WTA) estimates generally
exceed those of WTP.

Benefits
• In a BCA for an environmental program or project, the benefits are generally an improvement in environmental quality
• People are Willing To Pay (WTP) for projects and programs that will help to avoid a decline in environmental quality or improve the quality of the environment
• For example, people are WTP the cost for exhaust systems on cars, trucks and buses because they receive the benefits of cleaner air
• People may also be WTP to clean up a polluted site
LO1

Calculating Willingness to Pay
• Determining a populations WTP to reduce pollution is often complex because there is no market where people buy and sell units of environmental quality.
• Two main ways to measure WTP exist:- Direct: WTP reflects how much people would be WTP to avoid the harm
caused by pollution. Examples the health costs caused by pollution, the loss of productivity caused by pollution, or the amount paid to remediate a polluted site.
- In-direct: An Individual’s behavior or choices are used to input WTP. This is done when no actual market exists to reflect environmental values. Several methods might be used including:
1. Preventive/Mitigating Expenditures 2. Hedonic Estimates3. Surrogate Markets4. Contingent Valuation
LO1

Valuing Environmental Quality
• Table 7-1 lists examples of direct and indirect environmental issues related mainly to health care.
© 2015 McGraw-Hill Ryerson Ltd. 18LO1

Producer and Consumer Surplus
• Producer and consumer surplus show the net benefits of production or consumption and allow maximum WTP for change in pollution to be found.
• An individual's WTP for a change in pollution will likely be equal to their total benefit gained from reduced environmental damage.
LO2/3

Benefits from Reduced Production Costs
• Figure 7-1
LO3
• Figure 7-1 Benefits from reduced production costs as a result of reduced pollution levels are shown by a shift in the supply curve from S1 to S2.
• The improvement in net income or producer surplus is the difference between q1 and q2 or (b+d). This amount would be the maximum someone would be willing to pay to reduce pollution.
Deriving Consumer Surplus for a Public Good
• Figure 7-3
LO3
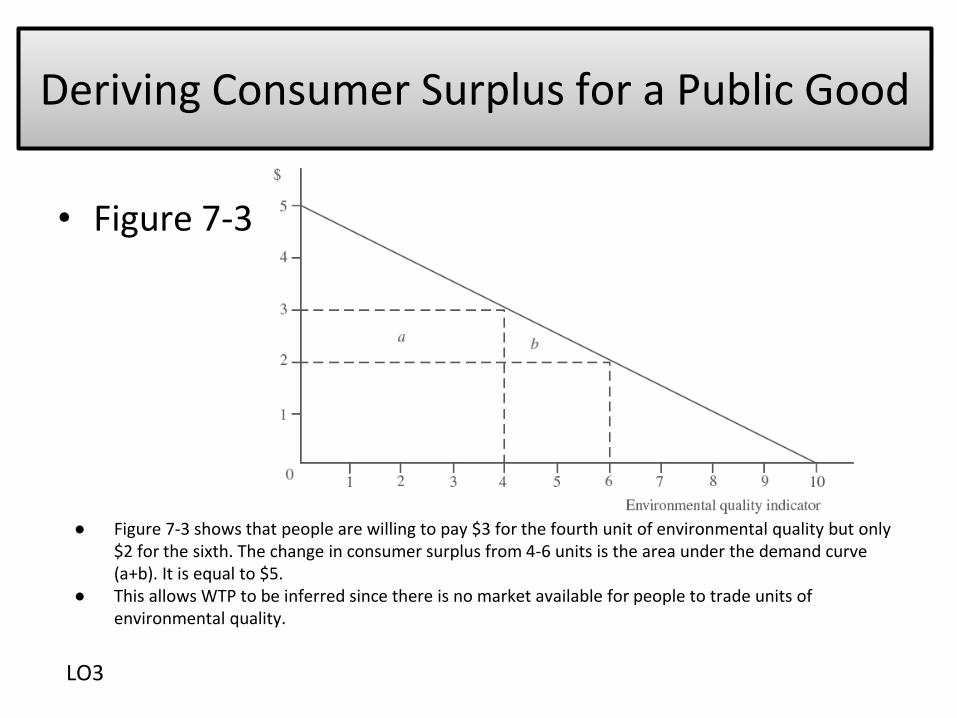
● Figure 7-3 shows that people are willing to pay $3 for the fourth unit of environmental quality but only $2 for the sixth. The change in consumer surplus from 4-6 units is the area under the demand curve (a+b). It is equal to $5.
● This allows WTP to be inferred since there is no market available for people to trade units of environmental quality.
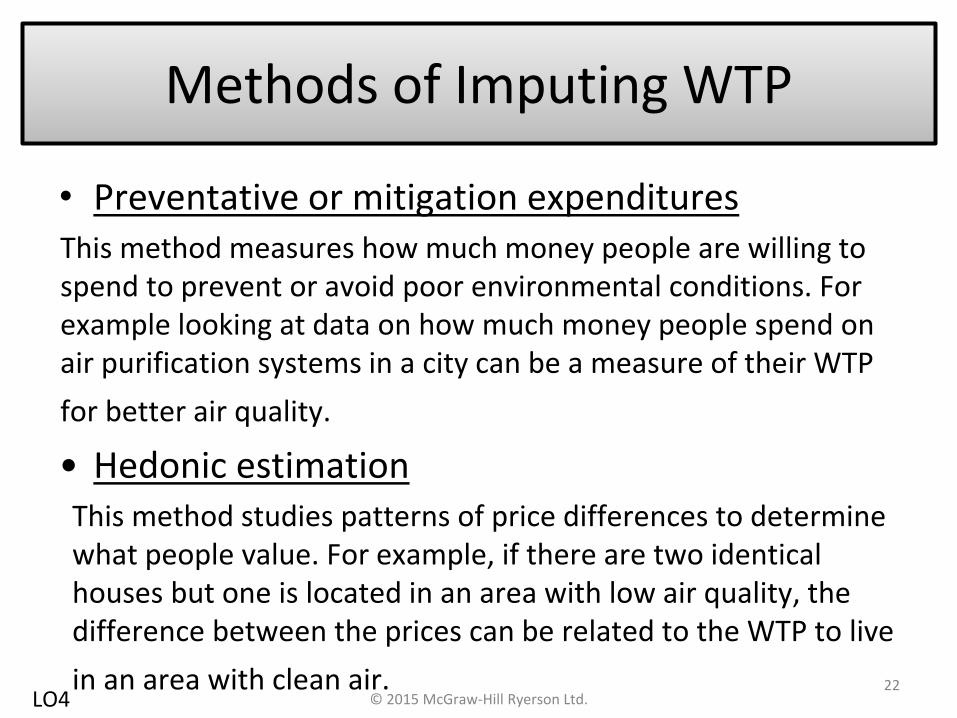
Methods of Imputing WTP
• Preventative or mitigation expendituresThis method measures how much money people are willing to spend to prevent or avoid poor environmental conditions. For example looking at data on how much money people spend on air purification systems in a city can be a measure of their WTP
for better air quality.
• Hedonic estimationThis method studies patterns of price differences to determine what people value. For example, if there are two identical houses but one is located in an area with low air quality, the difference between the prices can be related to the WTP to live
in an area with clean air.© 2015 McGraw-Hill Ryerson Ltd.
22LO4

Methods of Imputing WTP Cont.
• Surrogate Markets- This method uses travel costs as a proxy for price. The
amount of money an individual is willing to spend to experience a natural environment can be translated into their WTP for improving environmental quality.
• Contingent Valuation (CV)- This method involves asking people how much they are WTP
for certain environmental aspects. Use of a series of questions or a bidding game to determine the maximum WTP for a particular quality.
LO4

Questions on Imputing WTP
• How would an economist select which method of imputing WTP to use in a given situation?
• What would the best method be to determine WTP for protection of a natural wildlife park?
• What method could we use to determine the benefits of air pollution reduction in a city?

Willingness to Accept vs. Willingness to Pay.
• A person’s WTP can often be constrained by their income level or preferences. Willingness to Accept (WTA) is not constrained in the same way and can be used instead of WTP.
• WTA is often a much higher value than WTP. This is because people value the loss of an item over the gaining of an item.
• WTP is often used when the environment is being improved while WTA is used when the environment is being degraded.
LO5
Chapter Overview
This chapter provided an overview of the how willingness to pay (WTP) is imputed for determining environmental value.
• Direct and indirect methods of determining WTP for environmental quality are discussed.
• The concept of consumer and producer surplus is introduced and applied graphically to market and public goods.
• Consumer and producer surplus values were determined using graphical methods.
• Four methods of imputing WTP for improvements in environmental quality are described.
• The differences between Willingness To Pay (WTP) and Willingness To Accept (WTA) changes in environmental quality were compared.

Chapter 8Benefit-Cost Analysis: Cost
© 2015 McGraw-Hill Ryerson Ltd. 27

Learning Objectives
LO1 Explain how the concept of opportunity cost can apply to environmental
regulations.
LO2 Define the with - without principle and how it applies to benefit-analysis.
LO3 Distinguish between the private and social costs of a project and provide an
example.
LO4 Explain how to measure the social costs of a regulation when industry output
adjusts.
LO5 Define what is meant by the incidence of a policy and provide an illustration
graphically of how the share paid by consumers versus producers is determined.

What are Opportunity Costs?
• In Economics the most fundamental concept of costs is opportunity costs.
• The opportunity cost of using resources in a certain way is the highest-valued alternative use to which those resources could have otherwise been directed towards.
• Costs are generated by all types of firms, industries, agencies and groups. Each group generally focuses on those costs that directly affect that group.
• The concept of social opportunity costs encompasses all costs that affect any member or group in society.
LO1

Opportunity Costs And Environmental Regulation
• Environmental programs often have social costs associated with them. For example scrubbing SO2 out of power plant
emissions creates cleaner air, but leaves a concentrated sludge that must be disposed. This cost of disposal must be factored into the cost of producing clean air.
• In contrast, no-cost improvements have zero social cost. For example the government often subsidizes farmers
to drain wetlands. By removing those subsidies, farmers would reduce their destruction of wetlands, yielding benefits to wildlife and society.
LO1

The With or Without Principle
• In doing a BCA of how individuals and firms will respond to new laws we want to use the with/without approach and not the before/after approach.
• We want to estimated the differences in cost polluters will have to pay with the new laws compared to their costs in the absence of new laws.
• For example, if a firm currently pays $100 before a new law. With the new law the costs to a company may be $150, but future costs without it would have been $120 if the law was not changed.
• Therefore the cost of the new law is $30 not $50.
LO2
Social and Private Marginal Costs
• Environmental regulations often require firms to reduce or eliminate pollution, resulting in increased costs of production.
• Private marginal costs account for increases in production costs.
• Social marginal costs include marginal damage to society through environmental degradation as well as private costs, such as job losses, or reduced wages.
LO3

Reduced Pesticide Use in an Apple Orchard
• Suppose a pesticide used by a local apple producer is negatively effecting a local river.
• If a regulation is put in place to reduce pesticide use the private costs of production may increase.
• This takes money away from the owner as a loss in profit or consumers in the form of higher prices.
• However, the reduction in marginal damage to the river reduces the social cost, and may have a net benefit to society.
LO3

Questions, The Cost of Environmental Regulation
• Is the loss of consumer surplus a social cost of the project?
• Suppose an environmental regulation results in the closure of many firms within an industry, leaving only 2 or 3 dominate firms, what is the social opportunity cost?
LO3

Changing Social Costs
• Increases in abatement costs do not always accurately reflect opportunity costs. This is because market adjustments are likely to alter the role and performance of an industry in the economy.
• For example, if the price of a good is increased due to new environmental regulations, which resulted in higher costs of production, demand for the good may fall, weakening the industry.
LO4

The Incidence of Costs Changes
• The term incidence means who actually ends up paying the costs. The costs of environmental policy may initially be held by the polluter but can be passed forward onto consumers or backwards to workers or shareholders.• For example, if we place a tax on oil, we need to understand who will
pay the tax, the oil producer or the oil consumer?
• Which situation do you think is true? Who will pay the tax…? If the consumption of oil is price elastic, meaning that quantity of oil
consumed will change a great deal due to changes in price, then the oil producer will pay most of the tax.
If the consumption of oil is price inelastic, meaning that the quantity of oil consumed does not change much if the price changes, then the oil consumer will pay most of the tax.
LO5

Figure 8-1
LO5

Chapter Overview
This chapter provided an overview of the way costs are estimated in cost-benefit analysis.
• The fundamental concept of social opportunity costs was discussed.
• Introduction of the with-without principle and its relation to benefit-cost analysis was described.
• Social and private costs of a project were compared and practically applied to a scenario.
• The incidence of a policy was defined and illustrated graphically to show how costs of new environmental regulations are distributed.