Chapterfive Leadership - Women NSW · Women in NSW 2013 131. Leadership. Gender indicators:...
32
Women in NSW 2013 128 Chapter five Leadership Photo: Vivien Thomson – finalist for 2013 NSW/ACT Rural Industries Research and Development Corporation Rural Women’s Award The NSW economy and key institutions are more likely to perform optimally if leadership is meritorious and diverse, and if organisations make full use of the talents of all, regardless of sex.
Transcript of Chapterfive Leadership - Women NSW · Women in NSW 2013 131. Leadership. Gender indicators:...

Women in NSW 2013 128
Chapter
fiveLeadership
Photo: Vivien Thomson – finalist for 2013 NSW/ACT Rural Industries Research and Development Corporation Rural Women’s Award
The NSW economy and key institutions are more likely to perform optimally if leadership is meritorious and diverse, and if organisations make full use of the talents of all, regardless of sex.

Women in NSW 2013 129
Leadership
Women’s representation in leadership roles in parliament, within the public service and in the community and corporate sectors are the topics explored in this chapter. Women’s leadership in the professions of law and education are also covered.
There is much debate and little consensus about the benefits that women leaders can bring to organisations, including whether particular benefits can be attributed to gender at all.
Some research suggests that company boards with a higher proportion of women are more likely to perform better financially,1 while other studies question this correlation, pointing out that there is not necessarily a causal relationship between female board members and company performance.2 This
1 McKinsey and Co (2007) Women Matter: Gender diversity, a corporate performance driver at www.mckinsey. com. See also McKinsey and Co (2012) Women Matter: Making the breakthrough. 2 R. Adams (2012) Sorry, but there’s no business case for gender quotas, Knowledge Today, Australian School of Business, University of NSW, 31 August 2012, www.blogs.unsw.edu.au/ knowledgetoday
latter research does suggest, however, that women are more likely to attend board meetings than men and that men are more likely to attend when there are more women on the board.3
In spite of the debate around the impact of women leaders, and their under-representation, arguably the NSW economy and key institutions are more likely to perform optimally if leadership is meritorious and diverse, and if organisations make full use of the talents of all, regardless of sex.
Internationally, it is considered that political leadership by women is a fundamental prerequisite for gender equality and genuine democracy and that it facilitates women’s direct engagement in public decision-making.4
The same can be said of women’s leadership in the community, corporate and government sectors and across all social institutions. More women should be in positions where they have the authority to decide and negotiate on issues that affect them.
3 Ibid.4 See www.unifem.org/gender_issues/democratic_governance/
The position of key international organisations such as the United Nations and the Organization for Economic Cooperation and Development is also relevant here: supporting women leaders at all levels is a key area where increased investment can have ‘catalytic and multiplier affects’ for future generations, leading to improved outcomes in health, education and economic security. This chapter’s focus topic on Aboriginal women leaders is of particular interest in light of this statement.
Key findingsThe number of women standing as candidates for local government elections has risen at every election in NSW since 1991, and the 2012 elections were no exception. In 2012, 34 percent of candidates for local government were women, compared to 33 percent in 2008 and 23 percent in 1991.
Although more women are standing for election, this is not reflected in the number of women elected as local government councillors. The proportion of women councillors has not changed since 1999, when it was 26 percent, apart from a small rise to 27 percent in 2008.
Women in NSW 2013 130
Leadership
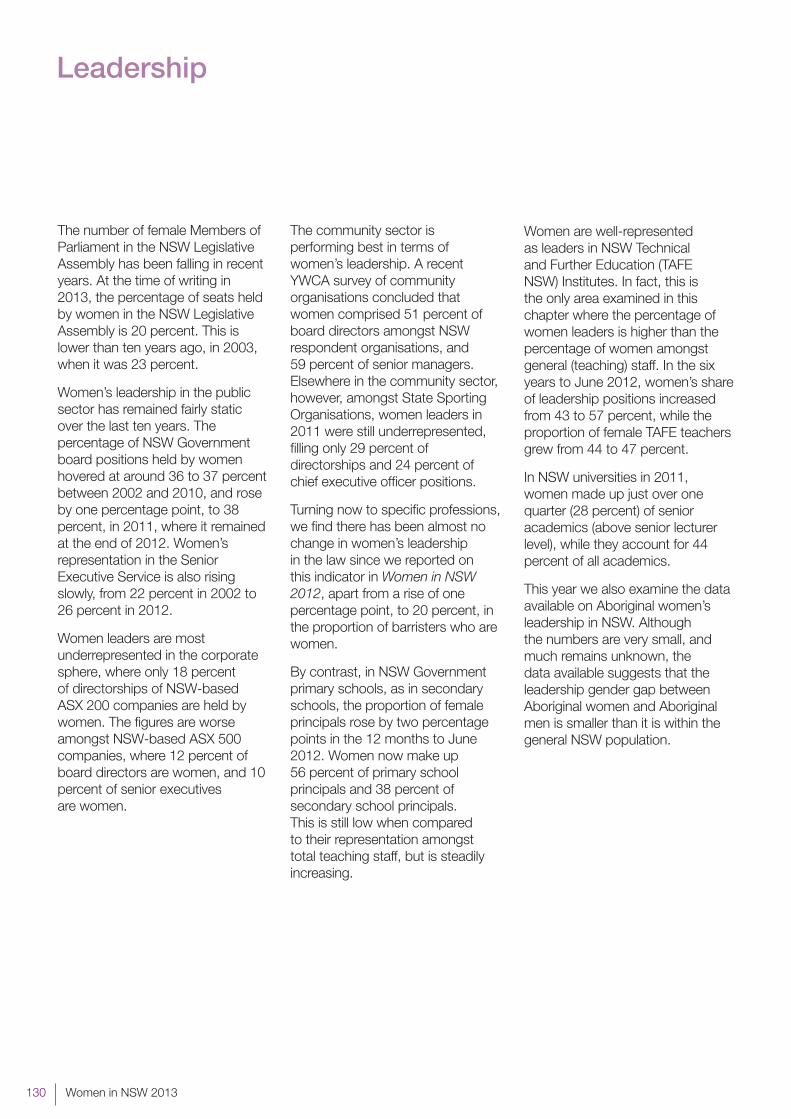
The number of female Members of Parliament in the NSW Legislative Assembly has been falling in recent years. At the time of writing in 2013, the percentage of seats held by women in the NSW Legislative Assembly is 20 percent. This is lower than ten years ago, in 2003, when it was 23 percent.
Women’s leadership in the public sector has remained fairly static over the last ten years. The percentage of NSW Government board positions held by women hovered at around 36 to 37 percent between 2002 and 2010, and rose by one percentage point, to 38 percent, in 2011, where it remained at the end of 2012. Women’s representation in the Senior Executive Service is also rising slowly, from 22 percent in 2002 to 26 percent in 2012.
Women leaders are most underrepresented in the corporate sphere, where only 18 percent of directorships of NSW-based ASX 200 companies are held by women. The figures are worse amongst NSW-based ASX 500 companies, where 12 percent of board directors are women, and 10 percent of senior executives are women.
The community sector is performing best in terms of women’s leadership. A recent YWCA survey of community organisations concluded that women comprised 51 percent of board directors amongst NSW respondent organisations, and 59 percent of senior managers. Elsewhere in the community sector, however, amongst State Sporting Organisations, women leaders in 2011 were still underrepresented, filling only 29 percent of directorships and 24 percent of chief executive officer positions.
Turning now to specific professions, we find there has been almost no change in women’s leadership in the law since we reported on this indicator in Women in NSW 2012, apart from a rise of one percentage point, to 20 percent, in the proportion of barristers who are women.
By contrast, in NSW Government primary schools, as in secondary schools, the proportion of female principals rose by two percentage points in the 12 months to June 2012. Women now make up 56 percent of primary school principals and 38 percent of secondary school principals. This is still low when compared to their representation amongst total teaching staff, but is steadily increasing.
Women are well-represented as leaders in NSW Technical and Further Education (TAFE NSW) Institutes. In fact, this is the only area examined in this chapter where the percentage of women leaders is higher than the percentage of women amongst general (teaching) staff. In the six years to June 2012, women’s share of leadership positions increased from 43 to 57 percent, while the proportion of female TAFE teachers grew from 44 to 47 percent.
In NSW universities in 2011, women made up just over one quarter (28 percent) of senior academics (above senior lecturer level), while they account for 44 percent of all academics.
This year we also examine the data available on Aboriginal women’s leadership in NSW. Although the numbers are very small, and much remains unknown, the data available suggests that the leadership gender gap between Aboriginal women and Aboriginal men is smaller than it is within the general NSW population.

Women in NSW 2013 131
Leadership
Gender indicators: LeadershipIn this chapter, women’s experiences with leadership are reported against five topics of importance for women. Many indicators align with state, national and international frameworks, and these linkages are shown in the table below headed Leadership topics and indicators.
This year, we have included some new indicators that did not appear in Women in NSW 2012. These have been included either because of the availability of new data, for example on women leaders in the community sector (Topic 4) and in companies listed on the ASX 500 index (Topic 3), or because an area
we touched on last year is explored in more detail, such as leadership in the education professions (Topic 5).
State Plan NSW 2021 Goal 1: Improve the performance of the NSW economy
State Plan NSW 2021 Goal 26: Fostering opportunity and partnership with Aboriginal people
The NSW Government is committed to growing the economy so that it provides jobs, opportunities and increased prosperity. The Government is also committed to empowering Aboriginal people to take an active role in decision-making that will build community skills and capacity and provide a greater sense of community ownership.
Topic Indicators Linkages
Topic 1: Electoral representation
1.1 Candidates for election
1.2 Elected representatives
ABS Gender Indicators, Australia
United Nations Gender Inequality Index
OECD Gender Equality Indicators
World Economic Forum Global Gender Gap Index
Topic 2: NSW public sector leadership
2.1 NSW Government boards and committees
2.2 Senior Executive Service roles in the NSW public sector
ABS Gender Indicators, Australia
NSW Treasury Circular 10/05, 6 May 2010
World Economic Forum Global Gender Gap Index
Leadership topics and indicators

Women in NSW 2013 132
Leadership
Topic Indicators Linkages
Topic 3: Leadership in the private sector
3.1 Board directors of NSW-based ASX 500 companies
3.2 Senior executives in NSW-based ASX 500 companies
3.3 Board directorships in NSW-based ASX 200 companies
3.4 Business owners
ABS Gender Indicators, Australia
OECD Gender Equality Indicators
Topic 4: Leadership in the community sector
4.1 Directors of community sector organisations
4.2 Senior managers of community sector organisations
4.3 Leadership roles in State Sporting Organisations
International Working Group on Women and Sport, Sydney Scoreboard
Topic 5: Senior roles in the legal and education professions
5.1 Judges, barristers and partners principals of law firms
5.2 Principals of NSW government schools
5.3 TAFE NSW leaders
5.4 Senior academic positions in NSW universities
ABS Gender Indicators, Australia
Productivity Commission, Report on Government Services
Focus topic Aboriginal women leaders State Plan NSW 2012 Goal 26
Current levels and trendsThis section outlines the current status of NSW women in the topic areas listed above and the direction of change over time, where time-series information is available. The latest available data is used in each case.
For some indicators, no new data is available since the publication of Women in NSW 2012. In this case, indicators are not repeated in the body of the chapter, but are listed in the box on the following page.

Women in NSW 2013 133
Leadership
Indicator Women in NSW 2012 Source
Candidates for election NSW Government – candidates who were women in March 2011
Legislative Assembly: 30 percent
Legislative Council: 34 percent
Australian Government – candidates who were women in 2010
House of Representatives (NSW seats): 27 percent
Senate (NSW seats): 35 percent
Parliament of NSW website
Parliament of Australia website
Elected representatives NSW Legislative Council – elected representatives who were women in February 2013: 31 percent
Australian Government – elected representatives who were women in 2010
House of Representatives (NSW seats): 27 percent
Senate (NSW seats): 42 percent
Parliament of NSW website
Parliament of Australia website
In 1902, women in NSW first gained the right to vote in both state and Australian elections, and to stand for election for the Australian Parliament. Women in NSW won the right to stand for election to the NSW Legislative Assembly in 1918. It took a further eight years for women to be able to stand for election to the NSW Legislative Council (1926). Women have continued to be in the minority at all levels of government, despite these rights.
Since the publication of Women in NSW 2012, local government elections were held throughout NSW on 8 September 2012, and there have been two State Government by-elections which have changed the gender composition of the NSW Legislative Assembly.
Topic 1 Electoral representation
Indicator 1.1 examines the gender split among candidates at the 2012 local government elections, while indicator 1.2 reports on the percentage of women who were actually elected to local government in 2012. Indicator 1.2 also notes the impact of recent NSW by-elections on the gender composition of the NSW Legislative Assembly.

Women in NSW 2013 134
Leadership
1.1 Candidates for election Current position At the local government elections in September 2012, 34 percent of candidates for election
were women.
Gender gap
• Womenaccountedforjustoverone-thirdofcandidateswhostoodforelectiontolocalgovernment in NSW in 2012.
The direction of change over time
In the period between 1991 and 2012, the proportion of women candidates for local government has increased by 11 percentage points, from 23 percent. There was a one percentage point increase between the 2008 and 2012 elections. See Figure 5.1.
Discussion The council with the greatest proportion of women candidates in 2012 was North Sydney, with 67 percent. Of the 10 councils with 50 percent or more women councillors standing for election in 2012, seven were rural councils. See Table 5.1.
In three councils, no women stood for election. These were: Coonamble Shire, Gundagai Shire and Lachlan Shire.
The total number of candidates (female and male) has fluctuated in each election year. In 1991, it was 3,820 (the lowest and in 2004 it was 5,078 (the highest to date).
Local government in NSW consists of 152 councils across the state, which have between five and 15 elected councillors, and in some cases an elected mayor. NSW local government elections are held every four years. The most recent elections were held in September 2012.
Year collected: 2012. Data source: ABC, Antony Green’s election blog, 30 August 2012. More information is available at www.abc.net.au/elections/nsw/2012/council/
Table 5.1 Councils with 50 percent or more women candidates, NSW, 2012
Local council Women candidates % Women councillors %
North Sydney 67 58
Nambucca Shire 62 50
Bega Valley Shire 56 44
Shoalhaven City 53 42
Bellingen Shire 52 17
Woollahra Municipal 51 47
Singleton 50 56
Ashfield 50 50
Greater Hume Shire 50 56
Gunnedah Shire 50 50
Note: The table shows the percentage of women who stood as candidates in the 2012 local government elections, and the percentage elected as councillors. Population: Local councils where 50 percent or more of candidates at the 2012 election were women. Source: ABC, Antony Green’s election blog, 30 August 2012; NSW Electoral Commission website; and research with individual councils that conducted their own elections.

Women in NSW 2013 135
Leadership
Current position Local government
At the 2012 local government elections, women made up 26 percent of elected councillors.
NSW Government
As at January 2013, women made up 20 percent of members of the NSW Legislative Assembly.
Gender gap
• Womenfillaroundone-quarterofelectedpositionsinlocalgovernment,andone-fifthofseats in the NSW Legislative Assembly.
The direction of change over time
Local government
At the local government level, there was a slight (one percentage point) drop between 2008 and 2012 in the percentage of women elected to local government, which is the same now as it was 13 years ago, in 1999. See Figure 5.1.
NSW Government
The proportion of female members in the NSW Legislative Assembly decreased from 23 percent in June 2012 to 20 percent in January 2013. This continues the trend since 2007 for a steady decrease in the number of women in the Legislative Assembly. See Figure 5.2.
Discussion Local government
The council with the highest proportion of women councillors following the 2012 elections was Pittwater Council.
Of the14 councils with 50 percent or more women councillors, the majority (9 out of 14) were located in Sydney. See Table 5.2. Interestingly, in all these Local Councils (except Nambucca Heads and North Sydney), the percentage of women elected to councillor positions was equal to or greater than the percentage who stood for election.
Five councils elected no women councillors. These are: Blayney Shire, Coonamble Shire, Gundagai Shire, Lachlan Shire and Orange City.
NSW Government
The drop in the proportion of women members in the NSW Legislative Assembly between 2012 and 2013 is due to the resignation of two female members in the second half of 2012. Kristina Keneally resigned from the seat of Heffron on 29 June 2012 and Clover Moore from Sydney on 21 September 2012. Male candidates won the by-elections in both seats.
Table 5.3 presents the percentage of seats held by women in Parliaments around Australia, as at September 2012. Queensland and Western Australia were only the states where the representation of women in the lower house was lower than in NSW. In the upper house, NSW had a lower percentage of women members than any other jurisdiction.
Local government in NSW consists of 152 councils across the state, which have between five and 15 elected councillors, and in some cases an elected mayor. NSW local government elections are held every four years. The Legislative Assembly is the lower house of the NSW Parliament with 93 members, each representing an electorate of the state.
Year collected: 2013.Data source: NSW Electoral Commission; research with individual councils that conducted their own elections; NSW Parliament website.More information is available at www.elections.nsw.gov.au; www.parliament.nsw.gov.au
1.2 Elected representatives

Women in NSW 2013 136
Leadership
Local council Women councillors % Women candidates %
Pittwater 67 34
North Sydney 58 67
Camden 56 45
Great Lakes 56 37
Greater Hume 56 50
Singleton 56 50
Ashfield 50 50
City of Canada Bay 50 40
Gunnedah 50 50
Ku-ring-gai 50 44
Manly 50 37
Nambucca Heads 50 62
Waverley 50 41
Willoughby 50 44
Table 5.2 Councils with 50 percent or more women councillors, NSW, 2012
Note: The table shows the percentage of women who were elected as councillors in the 2012 local government elections and the percentage who stood as candidates in those councils.Population: Local councils where 50 percent or more of elected councillors were women following the 2012 election. Source: NSW Electoral Commission website; research with individual councils that conducted their own elections; and ABC, Antony Green’s election blog, 30 August 2012.
Figure 5.1 Women in NSW Local Government elections, 1991-2012
Note: The total number of candidates for election (female and male) in 1991 was 3,820, then 4,084 (in 1995), 4,950 (in 1999), 5,078 (in 2004), 4,441 (in 2008) and 4,566 (in 2012).Population: Women candidates for local government and women elected as councillors. Source: NSW Electoral Commission website; research with individual councils that conducted their own elections; NSW Department of Premier and Cabinet, Division of Local Government (2008) Candidates and Councillors 2008; ABC, Antony Green’s election blog, 30 August 2012.

Women in NSW 2013 137
Leadership
Figure 5.2 Women members of NSW Parliament, 1973 to 2013
Population: Members of the NSW Parliament between 1973 and 2013.Source: NSW Parliamentary Library Research Service (2011) Women in Politics and Public Leadership, Briefing Paper No 6/2011 and Parliament of NSW website.
Table 5.3 Women’s representation in State and Federal Parliaments, September 2012
Lower house % Upper house %
NSW 22 31
Victoria 33 33
Queensland* 20 n/a*
Western Australia 19 47
South Australia 30 32
Tasmania 24 40
Australian Capital Territory* 41 n/a
Northern Territory* 32 n/a
Parliament of Australia 25 38
Note: *Queensland, Northern Territory and the ACT have only a lower house of parliament. Source: Wilson J. and Black D. (2012) Women Parliamentarians in Australia 1921-2012, Parliament of Australia Parliamentary Library.

Women in NSW 2013 138
Leadership
The indicators in this section examine women’s leadership within the NSW public sector. Two important indicators of government’s progress are the percentage of women who are selected to sit on government
Topic 2 NSW public sector leadership
boards and committees, and the percentage of women in the public sector Senior Executive Service (SES).
Indicator 2.1 presents data on female representation on boards
and committees appointed by the NSW Government across a range of portfolios. Indicator 2.2 presents data on women’s representation in senior executive roles in the NSW public sector.
Current position As at 31 December 2012, women held 38 percent of NSW Government board and committee positions.
Gender gap
• Men’srepresentationonNSWGovernmentboardsandcommitteesinDecember2012was 1.6 times greater than women’s.
The direction of change over time
In December 1997, women held 27 percent of NSW Government board and committee positions. That figure has risen by 11 percentage points in 15 years – less than one percentage point per year – to 38 percent in December 2012. See Figure 5.3.
Discussion The portfolios with the highest proportion of female board and committee members as at 31 December 2012 were Family and Community Services (59 percent), Ageing (60 percent), Disability Services (76 percent) and Women (91 percent). The portfolio with the lowest percentage of women board members was Police and Emergency Services (13 percent). See Table 5.4.
Care should be exercised when making year on year comparisons on boards and committees within particular portfolios. Portfolios may have changed between March 2011 and December 2012, as has been the case with Sport and Recreation.
This indicator reports on appointments to NSW Government boards and committees that are approved by Cabinet. As at 31 December 2012, this included boards and committees covering all portfolio areas of government, with more than 4,300 positions in total. Year collected: 2012. Data source: NSW Department of Premier and Cabinet, unpublished data. More information is available at www.boards.dpc.nsw.gov.au
2.1 NSW Government boards and committees

Women in NSW 2013 139
Leadership
Figure 5.3 NSW Government board and committee members, by sex, 1997 to 2012
Population: Members of NSW Government boards and committees. Source: NSW Department of Premier and Cabinet, unpublished data.
Table 5.4 Women’s representation on NSW Government boards by portfolio, 2011 and 2012
Portfolio March 2011 %
March 2012 %
December 2012 %
Police and Emergency Services 8 6 13
Resources and Energy 17 21 18
Tourism, Major Events, Hospitality and Racing 32 21 18
Treasurer 22 19 19
Roads and Ports 14 22 21
Transport 28 29 21
Heritage 11 33 21
Trade and Investment 30 23 23
Sport and Recreation* 37 25 27
Primary Industries 19 27 27
Premier 44 33 27
Medical Research 26 31 29
Finance and Services 37 31 29
Fair Trading 37 34 30
Planning and Infrastructure 32 30 31
Regional Infrastructure and Services 30 29 33

Women in NSW 2013 140
Leadership
Portfolio March 2011 %
March 2012 %
December 2012 %
Citizenship and Communities 49 43 33
Illawarra n/a n/a 33
Aboriginal Affairs 25 38 36
Justice 33 37 38
Local Government 67 38 39
Arts 46 43 40
Environment 34 37 40
Health 44 43 42
Attorney General 44 48 48
Education 52 54 52
Mental Health 51 49 55
Family and Community Services 73 71 59
Ageing 68 67 60
Disability Services 76 75 76
Women 100 50 91
Hunter 31 n/a n/a
Western Sydney 29 n/a n/a
Small Business 23 23 n/a
Total 38 37 38
Note: ‘n/a’ refers to portfolios that had no allocated boards at that point in time. * Changes in the composition of the Sport and Recreation portfolio affect the ability of year to year comparisons.
Population: Members of NSW Government boards and committees. Source: NSW Department of Premier and Cabinet, unpublished data.

Women in NSW 2013 141
Figure 5.4 Women in the SES and the total NSW public sector, 2002 to 2012
Note: Does not include casual staff. Population: Women under SES contracts and women in SES-equivalent position; and total non casual women in the public sector workforce.Source: NSW Public Service Commission, NSW Public Sector Workforce Profile, 2012.
Leadership
2.2 Senior Executive Service roles in the NSW public sector
Current position In 2012, women accounted for 26 percent of the Senior Executive Service (SES) in the NSW public sector.
Gender gap
• Womenmakeupjustoverone-quarteroftheSESintheNSWpublicsector.
The direction of change over time
The percentage of women in the SES has increased by one percentage point since 2011, when it was 25 percent. It has risen from 22 percent in 2002.
The proportion of women in the NSW public sector as a whole also increased slightly between 2011 and 2012, from 60 to 61 percent.
Discussion Women’s SES representation in the NSW public sector (26 percent) remains disproportionately low compared to their representation within the total public sector workforce (61 percent). See Figure 5.4.
SES employees are determined under the Public Sector Employment and Management Act 2002. They do not include chief executives.
The data provided by the NSW Public Service Commission is as at their census date of 21 June 2012 and also includes SES-equivalent positions, who are senior executive staff whose contract of employment does not fall under the Public Sector Employment and Management Act.
Year collected: 2012 and previous years. Data source: NSW Public Service Commission, NSW Public Sector Workforce Profile, 2012. More information is available at www.psc.nsw.gov.au

Women in NSW 2013 142
Leadership
3.1 Board directors of NSW-based ASX 500 companies
Current position As at 16 March 2012, 12 percent of board directors of NSW-based ASX 500 companies were women, and 88 percent were men.
Gender gap
• Womenareseventimeslesslikelythanmentoholdaboarddirector’spositionina NSW-based ASX 500 company.
The direction of change over time
This is the first year that the WGEA has collected data relating to ASX 500 companies.
Discussion NSW is the state in which the highest proportion of ASX 500 companies is located (36 percent). Nearly half of all female board directors across Australia (49 percent) serve on companies with a head office in NSW.
In Western Australia, where 29 percent of ASX 500 companies were located, only 3.5 percent of board directors were women.
In Victoria, where 19 percent of ASX 500 companies were located, 13 percent of board directors were women.
Nationally, 9.2 percent of board directors of ASX 500 companies were women. See Figure 5.5.
Data for this indicator relates to companies in the ASX 500 as at 16 March 2012 which had a head office address in NSW. Data was extracted by WGEA from each company’s most recent annual report published before the WGEA census date of 30 April 2012. Generally, these annual reports covered the 12 months ended 30 June 2011, or the 12 months ended 31 December 2011.
Directors are those people who hold a seat on a company board. They act on behalf of the shareholders in supervising the company. The ASX 500 index refers to the 500 largest securities listed on the All Ordinaries Index of the Australian Securities Exchange. The constituents are not screened for liquidity.
Year collected: 2011. Data source: EOWA (2012) Australian Census of Women in Leadership. Note: EOWA is now known as the Workplace Gender Equality Agency (WGEA) More information is available at www.wgea.gov.au
Topic 3 Leadership in the private sector
The data in this section examines women’s leadership in the corporate sphere, focusing on their representation at the level of board directors and executive managers.
Indicators 3.1 and 3.2 present data from the Workplace Gender Equality Agency’s1 (WGEA)
1 Formerly known as the Equal Opportunity for Women in the Workplace Agency or EOWA.
Australian Census of Women in Leadership 2012. The data looks at board directors and executive managers of ASX 500 companies with a head office address in NSW, and relates to the 2011 financial reporting year.
Indicator 3.3 also considers board directorships, but for a smaller set of companies – those listed on the
ASX 200 – and for a more recent time period. The ASX 200 data was collated at the time of writing, in April 2013.
In Indicator 3.4 we examine women’s ownership of businesses, both small and large.

Women in NSW 2013 143
Leadership
3.2 Senior executives in NSW-based ASX 500 companies
Current position As at 16 March 2012, women made up 10 percent of executive key management personnel in ASX 500 companies with a head office in NSW.
Gender gap
• ExecutivemanagementpositionsinNSW-basedASX500companiesareninetimesmore likely to be filled by a man than by a woman.
The direction of change over time
This is the first year that the WGEA has collected data relating to ASX 500 companies.
Discussion 38 percent of executive key management personnel in all ASX 500 companies are located in NSW.
At 10 percent, NSW lags behind Victoria (13 percent), Tasmania (13 percent) and the Northern Territory (17 percent) when it comes to the proportion of women in executive key management positions, although the number of executives in the latter two jurisdictions is much smaller. See Figure 5.5.
Data for this indicator relates to companies in the ASX 500 as at 16 March 2012 which had a head office address in NSW. Data was extracted by WGEA from each company’s most recent annual report published before the WGEA census date of 30 April 2012. Generally these annual reports covered the 12 months ended 30 June 2011, or the 12 months ended 31 December 2011.
Executive key management personnel are the executive members of the management group who have authority and responsibility for planning, directing and controlling the activities of the entity, directly or indirectly, including any director (whether executive or otherwise) of that entity.
Year collected: 2011. Data source: EOWA (2012) Australian Census of Women in Leadership. More information is available at www.wgea.gov.au
Figure 5.5 Women leaders of ASX 500 companies, by jurisdiction, 2011
Note: ‘Senior executives’ refers to executive key management personnel, who are the executive members of the management group with responsibility for planning, directing and controlling the activities of the entity. See Indicator 3.2 for full explanation. Population: Women board directors and executive key management personnel in ASX 500 companies Source: EOWA (2012) Australian Census of Women in Leadership.

Women in NSW 2013 144
Leadership
3.3 Board directorships in NSW-based ASX 200 companies
Current position As at April 2013, women held 18 percent of all directorships of ASX 200 companies with a registered office address in NSW.
Gender gap
• Womenmakeuplessthanone-fifthofalldirectorsofASX200companiesthatarebasedin NSW.
The direction of change over time
There was an increase of one percentage point between April 2012 and April 2013 in the proportion of directorships held by women in NSW-based ASX 200 companies, from 17 to 18 percent.
In April 2011, 15 percent of directorships in NSW-based ASX 200 companies were held by women.
Discussion Nationally, between 2004 and 2008, the percentage of ASX 200 directorships held by women sat at 8 percent. Since 2011, the percentage of female directorships has been gradually rising, both in NSW and nationally. It is possible that a factor in this rise was the introduction in 2010 of the Australian Securities Exchange’s corporate governance principles for gender diversity. Figure 5.6 presents data for 2011 to 2013 on the percentage of female directorships in ASX 200 companies, both in NSW and nationally. The percentage of women directors in NSW is slightly higher than the national figure.
Data in this section relates to ASX 200 companies that have a registered office address in NSW. The ASX 200 Index consists of a rolling population which companies enter or exit depending on share price. The index measures the performance of the 200 largest index-eligible stocks listed on the Australian Securities Exchange according to criteria established by Standard and Poors and the ASX.
Directors are those people who hold a seat on a company board. They act on behalf of the shareholders in supervising the company.
Year collected: 2013.Data source: Australian Institute of Company Directors, unpublished data.More information is available at www.companydirectors.com.au
Figure 5.6 Female board directorships in ASX 200 companies, NSW and national, 2011-13
Note: NSW data is as at April 2011, April 2012 and April 2013. National data is as at 31 December 2011, 31 December 2012 and 31 March 2013. Population: Companies listed on the ASX 200 for the dates specified above.Source: NSW Institute of Company Directors. National data is available at www.companydirectors.com.au. NSW data is unpublished.

Women in NSW 2013 145
Leadership
3.4 Business owners
Current position In NSW in 2011, women made up 29 percent of owner managers of incorporated enterprises (all sizes), and 34 percent of owner managers of unincorporated enterprises (all sizes).
Gender gap
• Womenarearound2to2.5timeslesslikelythanmentoownandruntheir own business.
The direction of change over time
Incorporated enterprises
There was a slight decrease between 2006 and 2011 in the proportion of owners of incorporated enterprises who were women. The proportion dropped from 30 to 29 percent for businesses with 1-19 employees, and from 29 to 27 percent for enterprises with 20 or more employees. See Figure 5.7.
Unincorporated enterprises
There was an increase of two percentage points between 2006 and 2011 (from 33 to 35 percent) in the proportion of unincorporated enterprises with no employees (eg. sole traders) owned by women.
The proportion of unincorporated enterprises with 1 to 19 employees owned by women has increased by one percentage point since 2006 (from 33 to 34 percent). See Figure 5.7.
Discussion The great majority of incorporated business owners in NSW in 2011 (almost 200,000) had between 1 and 19 employees. A much smaller number (less than 16,000) owned businesses with 20 or more employees. Growth in numbers in recent years has been more notable for male-run incorporated businesses than for those run by women.
By contrast, looking at unincorporated enterprises between 2006 and 2011, there was an increase of 7 percent in the number of female sole traders, compared to a decrease of 3 percent for male sole traders.
An owner manager of an incorporated enterprise is a person who works in her/his own business, which is registered as a separate legal entity to its members or owners (also known as a limited liability company).
An owner manager of an unincorporated enterprise is a person who operates his/her own business, in which the owner and the business are legally inseparable, so that the owner is liable for any business debts that are incurred. It includes people engaged independently in a profession or trade.
Year collected: 2006 and 2011. Data source: ABS Census of Population and Housing 2006 and 2011. More information is available at www.abs.gov.au

Women in NSW 2013 146
Leadership
Figure 5.7 Women business owners by size and type of business, NSW, 2006 and 2011
Population: NSW residents who are owner managers of incorporated and unincorporated enterprises. Source: ABS, Census of Population and Housing 2006 and 2011.
Incorporated enterprises Unincorporated enterprises
Until recently, little was known about the gender composition of boards that operate in the community sector, nor of diversity amongst top-level managers.
A national survey of not-for-profit organisations undertaken in late 2011 by YWCA Australia, Women on Boards and the Australian Council of Social Service (‘the
Topic 4 Leadership in the community sectorYWCA survey’) provides us with the best data we have so far on women’s representation in leadership positions in the community sector. Data relating to NSW organisations has been extracted from the survey results and is presented in Indicators 4.1 and 4.2 below.
Indicator 4.3 considers women’s representation in leadership positions with State Sporting Organisations. State Sporting Organisations are community organisations recognised by government and the majority of playing participants as peak bodies in the management and administration of their individual sports within NSW.

Women in NSW 2013 147
Leadership
4.1 Directors of community sector organisationsWomen’s representation on boards and as office bearers of not-for-profit organisations
Current position In NSW in November/December 2011, women comprised 51 percent of board directors of community organisations that responded to the YWCA survey.
Gender gap
• ThereisanalmostequalproportionoffemaleandmaleboarddirectorsinNSWcommunity organisations that responded to the YWCA survey.
The direction of change over time
There is currently no other data available with which to compare trends over time.
Discussion The YWCA survey shows that, nationally, women make up 51 percent of board directors of community organisations, which is equivalent to the NSW figure, but is substantially lower than the estimated 79 to 85 percent1 that women make up of the total community sector workforce.
Office bearer positions in community organisations are less likely to be held by women than by men. Of NSW-based respondents, 46 percent had a female president, 36 percent had a female vice-president, 34 percent had a female treasurer, and 35 percent had a female secretary. These are very similar to national percentages (see Figure 5.8).
The YWCA survey also shows that as the income of community organisations increases to $1 million or more, they are less likely to have female board directors than organisations with a smaller annual turnover (less than $1 million).
The YWCA survey was distributed electronically amongst networks of the YWCA, Women on Boards and the Australian Council of Social Service. Survey data was collected between 16 November and 12 December 2011. Responses were received from 662 organisations nationally that identified as not-for-profit. Of these, 70 organisations operated solely in NSW and a further 125 organisations operated in NSW and elsewhere. Data relating to NSW community organisations refers to all 195 organisations that operate in NSW.
No definition of ‘not-for-profit’ was provided in the survey questionnaire. The most common sectors in which respondent organisations worked were health (29 percent), education (24 percent), youth work (24 percent), women (23 percent) and disability (19 percent).
Year collected: November/December 2011. Data source: YWCA, Women on Boards, Australian Council of Social Service (2012) Reflecting gender diversity. An analysis of gender diversity in the leadership of the community sector: Inaugural survey results. More information is available at www.ywca.org.au; www.womenonboards.org.au; www.acoss.org.au
1 The estimate of 79 percent is based on data from the ABS Census of Population and Housing 2011 and includes residential care services and social assistance services, cross-referenced with the public/private employer indicator. The source for the higher figure of 85 percent is YWCA, Women on Boards, ACOSS (2012) Reflecting gender diversity. An analysis of gender diversity in the leadership of the community sector: Inaugural survey results, p.2.

Women in NSW 2013 148
Leadership
4.2 Senior managers of community sector organisations
Current position In NSW in November/December 2011, women comprised 59 percent of senior managers of community organisations that responded to the YWCA survey.
Gender gap
• WomenarealmostoneandahalftimesmorelikelythanmentobeseniormanagersinNSW community organisations that responded to the YWCA survey.
The direction of change over time
There is currently no other data available with which to compare trends over time.
Discussion The YWCA survey found that, nationally, 60 percent of senior managers in respondent organisations were female. This is comparable to the NSW figure of 59 percent. See Figure 5.8.
The survey data also indicates that the number of women in senior positions (in comparison to the number of men) rises as the proportion of female staff in the organisation increases.
The YWCA survey was distributed electronically amongst networks of the YWCA, Women on Boards and the Australian Council of Social Service. Survey data was collected between 16 November and 12 December 2011. See Indicator 4.1 for additional detail.
Year collected: November/December 2011. Data source: YWCA, Women on Boards, ACOSS (2012) Reflecting gender diversity: An analysis of gender diversity in the leadership of the community sector: Inaugural survey results. More information is available at www.ywca.org.au; www.womenonboards.org.au; www.acoss.org.au
Figure 5.8 Women leaders in community organisations, NSW and Australia, 2011
Note: Data relates to community organisations operating in NSW that responded to the YWCA survey. Population: Women board members, office bearers and senior managers of community sector organisations that responded to the YWCA survey. Source: YWCA, Women on Boards, ACOSS (2012) Reflecting gender diversity: An analysis of gender diversity in the leadership of the community sector: Inaugural survey results. NSW data unpublished.
Senior ManagersDirectors Office bearers

Women in NSW 2013 149
Leadership
4.3 Leadership roles in State Sporting Organisations
Current position In NSW in 2011, 29 percent of directorships of State Sporting Organisations (SSOs) were held by women.
Gender gap
• WomenarenearlytwoandahalftimeslesslikelythanmentoholdadirectorshipinaNSW State Sporting Organisation.
The direction of change over time
Data for previous years is unavailable at this time. Data on SSOs for 2012 and future years will be examined in future editions of Women in NSW.
Discussion In NSW in 2011, 20 percent of SSO presidents were women, 24 percent of SSO chief executive officers (CEOs) were women, and 16 percent of SSOs did not have a woman on their board.
SSOs in NSW are performing slightly better than their national counterparts in terms of gender equality. Amongst National Sporting Organisations (NSOs) in 2011, 23 percent of directorships were held by women, 11 percent of presidents were women, 22 percent of CEOs were women, and 17 percent of NSOs did not have a woman on their board.
Data on this indicator in Women in NSW 2012 related to the same time period – 2011 – but, as noted in that report, the data set was incomplete at that time, with data available for only 40 out of 106 funded SSOs. The data in Women in NSW 2013 is the full 2011 data set for SSOs in NSW.
State Sporting Organisations are the NSW counterparts of National Sporting Organisations. They are community organisations that receive funding from government and others to promote and control the operations of their sport in NSW. Their member organisations rely to a large degree on the contributions of volunteers. Sporting organisations play an important role, both as promoters of sports throughout the State, and as the peak bodies that oversee the operations of local sports clubs.
Year collected: 2011.
Data source: Department of Education and Communities, Sport and Recreation Division, NSW State Sporting Organisations – Sport Develop-ment Program Report 2010/11, unpublished data.More information is available at www.sydneyscoreboard.com
In Women in NSW 2012, we explored data on women leaders in the professions of law and school teaching. Women have been established in the teaching profession for many decades. As early as 1890, women made up nearly half of all NSW primary and secondary school teachers. 1
1 Facts and Figures, NSW Department of Education and Communities, accessed February 2013 at www.governmentschools.det.nsw.edu.au/files/primary_secondary_teachers.pdf
Topic 5 Senior roles in the legal and education professions
Women’s entrance into the law, by contrast, has been more gradual: women were only permitted to practice law in 1918, and as late as 1998 they still constituted less than one-third of NSW solicitors. Their entry into other areas of the law, the bar and the judiciary, occurred even later, and the first female judge in NSW was only appointed in 1980.
In this topic we update the figures from 2012 on women in senior positions in the law (Indicator 5.1) and school teaching (Indicator 5.2), and we also examine women’s leadership in other areas of education – TAFE NSW Institutes (Indicator 5.3) and NSW universities (Indicator 5.4).

Women in NSW 2013 150
Leadership
5.1 Judges, barristers and partners and principals of law firms
Current position In March 2013, 34 percent of judges and magistrates in NSW were women.
In NSW in October 2012, women made up 23 percent of partners and principals of private law firms.
Women made up 20 percent of all barristers certified to practise in NSW in 2011-12.
Gender gap
• JudgesandmagistratesinNSWaretwiceaslikelytobemaleasfemale;partnersandprincipals of private law firms in NSW are three times as likely to be male as female; and barristers in NSW are four times as likely to be male as female.
The direction of change over time
The percentage of NSW judges and magistrates who are women has not changed since March 2012, when it was also 34 percent.
The percentage of women who work as partners and principals of law firms has not changed since October 2010, when it was also 23 percent.
In the 12 months to 2011-12, there was a slight increase in the proportion of junior barristers who were women (from 21 to 22 percent), and a slight decrease in the proportion of Queen’s Counsel or Senior Counsel who were women (from 7 to 6 percent). See Figure 5.10.
Discussion In the 12 months to October 2012, the number of female solicitors in NSW increased by 5.2 percent, a larger increase than the male rise of 2.7 percent.
While women make up around 50 percent of solicitors (all levels) in private law firms with 21-39 partners, only 23 percent of partners in these firms are women. The same is true in firms of 11-20 partners, where women account for 47 percent of solicitors but only 20 percent of partners. See Figure 5.9.
Overall, since 2000, the proportion of women barristers (junior and senior) has increased by 8 percentage points, from 12 to 20 percent.
The Governor-in-Council appoints judicial officers on the recommendation of the Attorney General. Vacancies for judges of the District Court and Local Court magistrates are advertised. Barristers are lawyers who work as independent and sole practitioners. They specialise in court work and also provide specialised legal advice. Practising certificates for barristers in NSW are issued by the NSW Bar Association. Principals and partners hold senior positions within their law firm. A partner is entitled to a share of the profits of the business. Barristers, principals and partners form a feeder group for judicial service.
Year collected: Multiple years. Data source: Australasian Institute of Judicial Administration (2013) Gender Statistics, www.aija.org.au; The Law Society of New South Wales (2013) 2012 Profile of the Solicitors of NSW Final Report; The NSW Bar Association (2012) Annual Report. More information is available at www.aija.org.au; www.lawsociety.com.au; www.nswbar.asn.au

Women in NSW 2013 151
Leadership
Figure 5.9 Women partners in private law firms, NSW, 2005, 2010, 2012
Population: Solicitors in NSW who held a current practising certificate on October 2012.Source: The Law Society of NSW (2013) 2012 Profile of the solicitors of NSW: Final Report.
Figure 5.10 Women barristers, NSW, 2000 to 2012
Note: ‘Queen’s Counsel’ and ‘Senior Counsel’ are barristers of seniority and eminence in their areas of practice.Population: All barrisers who held a NSW practising certificate as at 30 June 2012, including barristers based interstate and overseas.Source: NSW Bar Association, Annual Reports from 2000 to 2012.

Women in NSW 2013 152
Leadership
5.2 Principals of NSW government schools
Current position As at June 2012 in NSW, 56 percent of primary school principals and 38 percent of secondary school principals of NSW government schools were women.
Gender gap
• Womenconstituteaslightmajorityofprimaryschoolprincipals.
• Theproportionoffemaleprincipalsinsecondaryschoolslagsbehindmalesby 24 percentage points.
The direction of change over time
There has been a gradual increase in the proportion of female principals over the last five years.
Between 2008 and 2012, the proportion of female principals in primary schools rose by 6 percentage points, and the proportion of female principals of secondary schools rose by 3 percentage points.
In each of primary and secondary schools, the proportion of female principals rose by 2 percentage points in the 12 months to June 2012. See Figure 5.11.
Discussion As at June 2012, women made up 81 percent of the total school-based teaching staff (including principals) in primary schools, and 56 percent of total teaching staff in secondary schools.
Set against these figures, women’s share of principal positions is disproportionately low, but gradually increasing. See Figure 5.11.
Principals in NSW Government schools are responsible for educational programs and learning outcomes of students, the management and professional development of staff, school finances and property and the relationships between the school and its community.
As at June 2012, there were some 47,200 permanent and temporary teachers in NSW Government schools. Of this number, some 2,200 (5 percent) were school principals.
Year collected: June 2012. Data source: NSW Department of Education and Communities (DEC), Workforce Profiles as at June for 2008 to 2012. More information is available at www.dec.nsw.gov.au

Women in NSW 2013 153
Leadership
Figure 5.11 Female principals and teachers, NSW government schools, 2008-12
Primary Secondary
Note: ‘Teachers’ covers all teaching staff, including principals. Population: Permanent and temporary staff only. Does not include casual staff. Source: NSW Department of Education and Communities Workforce Profiles as at June for 2008 to 2012.
5.3 TAFE NSW leadersDirectors and managers of Technical and Further Education (TAFE) NSW Institutes
Current position As at June 2012, 57 percent of TAFE NSW Institute directors and managers were women.
Gender gap
• Thereisa14percentagepointgendergapbetweenseniormanagerialstaffintheTAFEsystem, with women ahead of men at this level.
The direction of change over time
The proportion of women at senior management level in TAFE NSW has increased steadily since 2006, when women were 43 percent of Institute directors and managers (see Figure 5.12).
Discussion TAFE NSW is unusual in that the proportion of women leaders (Institute directors and managers) at 57 percent is greater than the proportion of women teachers.
In 2006, women made up 44 percent of total TAFE NSW teachers. This figure increased by three percentage points over six years, reaching 47 percent in 2012.
Institute directors are the pre-eminent managerial and educational leaders within TAFE NSW. They are responsible for the overall leadership of their Institute and its campuses, including management of administrative and teaching staff, the quality of educational programs, oversight of services delivered to industry and business, and relationships with other education providers.
Institute managers are employed as educational leaders and administrative managers in TAFE NSW. They have supervisory responsibility for administrative and/or educational programs and staff.
Year collected: June 2012. Data source: NSW Department of Education and Communities, Workforce Profiles as at June for 2006 to 2012 (unpublished). More information is available at www.dec.nsw.gov.au

Women in NSW 2013 154
Leadership
Figure 5.12 Women TAFE NSW directors and managers, 2006-12
Population: Permanent and temporary staff only. Does not include casual staff. Source: NSW Department of Education and Communities, Workforce Profiles as at June, for 2006 to 2012 (unpublished).
5.4 Senior academic positions in NSW universities
Current position In NSW universities in 2011, 28 percent of academics above senior lecturer level were women.
Gender gap
• SenioracademicsinNSWuniversitiesaremorethantwoandahalftimesmorelikelytobe men than women.
The direction of change over time
Women’s rise into leadership positions in academia has been slow. As recently as 16 years ago, in 1997, women made up only 16 percent of senior level academics in NSW universities, and 36 percent of all academics.
Two years later, in 1999, 20 percent of academic positions above senior lecturer level in NSW were held by women. This dropped back to 17 percent in 2000, but has increased gradually (by one to two percentage points each year) since then. See Figure 5.13.
Discussion In NSW in 2011, women held 44 percent of academic positions, at all levels, in NSW universities. This is an increase of seven percentage points since 1999, when women held 37 percent of all academic positions. See Figure 5.13.
The category ‘above senior lecturer’ includes Vice-Chancellor, Deputy Vice-Chancellor, Professor, Head of school, college fellow, Associate Professor, principal lecturer and other academic staff in the Level D and E salary classifications.
The NSW universities included in this data set are: Charles Sturt University, Macquarie University, Southern Cross University, The University of New England, The University of New South Wales, The University of Newcastle, The University of Sydney, University of Technology Sydney, University of Western Sydney, University of Wollongong.
Year collected: 2011 and previous years.Data source: Department of Industry, Innovation, Science, Research and Tertiary Education, Selected Higher Education Statistics (Staff).More information is available at www.innovation.gov.au/HigherEducation/HigherEducationStatistics

Women in NSW 2013 155
Current position In NSW universities in 2011, 28 percent of academics above senior lecturer level were women.
Gender gap
• SenioracademicsinNSWuniversitiesaremorethantwoandahalftimesmorelikelytobe men than women.
The direction of change over time
Women’s rise into leadership positions in academia has been slow. As recently as 16 years ago, in 1997, women made up only 16 percent of senior level academics in NSW universities, and 36 percent of all academics.
Two years later, in 1999, 20 percent of academic positions above senior lecturer level in NSW were held by women. This dropped back to 17 percent in 2000, but has increased gradually (by one to two percentage points each year) since then. See Figure 5.13.
Discussion In NSW in 2011, women held 44 percent of academic positions, at all levels, in NSW universities. This is an increase of seven percentage points since 1999, when women held 37 percent of all academic positions. See Figure 5.13.
The category ‘above senior lecturer’ includes Vice-Chancellor, Deputy Vice-Chancellor, Professor, Head of school, college fellow, Associate Professor, principal lecturer and other academic staff in the Level D and E salary classifications.
The NSW universities included in this data set are: Charles Sturt University, Macquarie University, Southern Cross University, The University of New England, The University of New South Wales, The University of Newcastle, The University of Sydney, University of Technology Sydney, University of Western Sydney, University of Wollongong.
Year collected: 2011 and previous years.Data source: Department of Industry, Innovation, Science, Research and Tertiary Education, Selected Higher Education Statistics (Staff).More information is available at www.innovation.gov.au/HigherEducation/HigherEducationStatistics
Leadership
Figure 5.13a Women’s representation among senior academics in NSW universities, 1999 to 2011
Note: Data refers to full-time equivalent positions for full-time, fractional full-time and actual casual staff. For each year referred to, data for casual staff was collected from 1 January to 31 December of the previous year, while data on permanent full-time and fractional full-time staff was collected as at 31 March of the previous year.Population: Includes full-time, fractional full-time and actual casual staff of universities in NSW.Source: Department of Industry, Innovation, Science, Research and Tertiary Education, Selected Higher Education Statistics (Staff), accessed via website www.innovation.gov.au/HigherEducation
Focus topic Aboriginal women leadersWhat does ‘leadership’ mean to Aboriginal women and why is it important?
The United Nations, World Health Organisation and OECD consider that focusing effort specifically on raising the status of women and girls has tremendous multiplier effects throughout their communities, as it brings educational, economic, health and social benefits to all in the community, not only females.1
1 World Health Organization, Investing in women and girls: progress in gender equality to reap health and social returns at www.who.int/gender/mainstreaming/investing; United Nations Population
Primary school (2012)
81of teachers
56of principals
% %
Secondary school (2012)
56of teachers 38
of principals
% %
TAFE (2012)
47of teachers
57of directorsand institutemanagers
%
%
University (2011)
28above senior
lecturer
%44of all academic
staff
%
Women are . . .
Notes: XXXXXX.Source: XXXXXX.
Figure 5.13b Women leaders in education, NSW
Note: See Indicators 5.2, 5.3 and 5.4 for further details. Source: NSW Department of Education and Communities, Workforce profile, as at June 2012; Department of industry, Innovation, Science, Research and Tertiary Education, Selected Higher Education Statistics (Staff) as at 2011.

Women in NSW 2013 156
Leadership
Aboriginal women consulted recently on the issue of leadership reported that it is important for leadership to be shared between men and women as a means of strengthening communities and sharing responsibility for facing problems and making decisions about the future.2
Fund (UNFPA), Gender Equality: Empowering Women at www.unfpa.org/gender/empowerment.htm; OECD, Investing in Women and Girls: The breakthrough strategy for achieving the MDGs [Millenium Development Goals] at www.oecd.org/dac/gender-development/46041913.pdf2 Hugging, J. (2012) Towards a National Approach to Promote the Leadership of Aboriginal and Torres Strait Islander Women, Draft working paper for the Office for Women, unpublished.
Many Aboriginal women fulfil a leadership role within their families and communities in an informal capacity. Aboriginal women play an important role as influencers, informal decision-makers, and initiators of projects to improve the lives of their families and communities. In this way they carry significant responsibility for others’ wellbeing now and in the future.
What are the socio-economic conditions that affect Aboriginal women’s ability to take on leadership roles?
Aboriginal women are more likely than Aboriginal men to have in place some of the conventional foundations for leadership – to have completed year 12, to be
undertaking post-school studies, to have completed a Bachelor degree and to be living with their family rather than serving time in prison. This is similar to the pattern between non-Aboriginal women and men, where women are doing better than men on these indicators.
In comparison with non-Aboriginal women, however, Aboriginal women’s outcomes on these indicators are low, and the gap between Aboriginal and non-Aboriginal women remains just as wide as the gap between Aboriginal and non-Aboriginal men (except in relation to rate of imprisonment). See Tables 5.5 and 5.6 below.
Table 5.5 Selected educational indicators by sex and Aboriginal status, NSW, 2011
Women MenAboriginal
%Non-Aboriginal
%Aboriginal
%Non-Aboriginal
%Completed Year 12 27 60 23 57
Attending university 11 34 6 27Attending technical or further education institution
11 9 11 13
Completed Bachelor degree 6 20 3 17
Note: ‘Completed Bachelor degree’ refers to people whose highest completed non-school qualification is a Bachelor degree. Source: ABS, Census of Population and Housing 2011.Population: For ‘Completed Year 12’ and ‘Completed Bachelor degree’ the population is people in NSW aged 20 to 64 years. For ‘Attending univer-sity’ and ‘Attending technical or further education institution’ the population is people in NSW aged 18 to 24 years.
Table 5.6: Imprisonment rate by sex and Aboriginal status, Australia, 2012
Aboriginal women
Aboriginal men
Non-Aboriginal women
Non-Aboriginal men
Imprisonment rate per 100,000 population
405 4,093 17 234
Source: ABS (2012) Prisoners in Australia. Cat no. 4517.0.Population: All persons in the legal custody of adult corrective services in Australia as at midnight 30 June 2012. Imprisonment rates for these categories were not readily available for NSW.

Women in NSW 2013 157
Leadership
What do we know about Aboriginal women leaders?
The small number of Aboriginal people in leadership positions makes it difficult to draw reliable conclusions. On the limited data that is currently available, however, the gender gap in leadership seems smaller between Aboriginal
women and men than it does in the population as a whole.
1. Higher status occupations – professionals and managers
In NSW in 2011, 7 percent of employed Aboriginal women were managers, and 18 percent were professionals. Comparative figures
for employed Aboriginal men were 8 percent as managers and 10 percent as professionals. While Aboriginal women and Aboriginal men are almost equally likely to work as managers, Aboriginal women are nearly twice as likely as Aboriginal men to work as professionals. See Figure 5.14.
Figure 5.14 Managers and professionals by sex and Aboriginal status, NSW, 2011
Source: ABS Census of Population and Housing 2011.Population: People in NSW aged 20-64 years, not including those who were unemployed, not in the labour force, or whose labour force status was not stated.
2. Electoral representation
The first, and still only, Aboriginal member of the NSW Parliament is Linda Burney, who was elected to the seat of Canterbury in 2003. There has not yet been an Aboriginal woman elected to Federal Parliament, for any State.
3. NSW public sector – Senior Executive Service
As at June 2012, there were only 12 Senior Executive Service (SES) people, out of a total of 1,942, who identified themselves as Aboriginal or Torres Strait Islander. Aboriginal women’s and men’s representation in the SES is exactly equal (six women and six men). Looking at Aboriginal representation in the entire NSW public sector, at all levels, 62 percent of Aboriginal
public sector staff are women. This is 24 percentage points greater than for Aboriginal men.
4. NSW Government boards and committees
As at 30 September 2012, Aboriginal women held slightly more positions on NSW Government boards and committees than Aboriginal men: 146 positions (51 percent) for Aboriginal women, compared with 139 positions

Women in NSW 2013 158
Leadership
(49 percent) for Aboriginal men. The total number of government board positions in NSW is 4,490. Unlike non-Aboriginal women, who hold fewer board positions than their male counterparts (see Indicator 2.1), the gender gap is in favour of Aboriginal women on this indicator.
5. Peak NSW Aboriginal representative organisations
The organisations included in the table below are all peak representative bodies for Aboriginal people in NSW in their respective
areas of land rights, health, education, out-of-home care and law. Overall, women hold 51 percent of total board positions across these organisations.
Table 5.7 Board members of peak NSW Aboriginal organisations by sex, February 2013
Women board members %
Total board positions
NSW Aboriginal Land Council 22 9
NSW Aboriginal Health and Medical Research Council 67 12
NSW Aboriginal Education Consultative Group 78 9
NSW Aboriginal Child, Family and Community Care State Secretariat 60 10
NSW/ACT Aboriginal Legal Services 31 13*
Total 51 53
*Does not include honorary board members. Source: www.nswalc.org.au; www.ahmrc.org.au; www.aecg.nsw.edu.au; www.absec.org.au; www.alsnswact.org.au, all accessed on 13 February 2013.
6. Board directors of Indigenous corporations
There are about 405 Aboriginal and Torres Strait Islander corporations registered under the Corporations (Aboriginal and Torres Strait Islander) Act 2006 that have a head office in NSW.1 As at 3 January 2013, the total number of directors of NSW-based corporations was 2,162. Of this number, 56 percent were women and 44 percent were men. This excludes directors whose
1 Indigenous corporations deliver a range of services, in some cases essential services, to remote communities, and some hold land. See the website of the Office of the Registrar of Indigenous Corporations for further details: www.oric.gov.au
sex cannot be identified, which is in 440 cases.2
Conclusion
Except in the public sector, data on Aboriginal leadership is usually not collected or not readily available, and much in this area is still unknown. To understand the leadership experiences of Aboriginal women in NSW more fully, we need more information about the positions that Aboriginal women hold. For example, do Aboriginal women on government boards mainly fill identified positions? Are women on the boards of Indigenous corporations clustered in a particular sector, such as childcare? Are Aboriginal women
2 Data provided by the Office of the Registrar of Indigenous Corporations (unpublished).
mainly filling paid or volunteer board positions? Are their positions mainly in community organisations or in larger, wealthier corporations? We also need a better understanding of the informal leadership that Aboriginal women and men undertake regularly within their communities. At this stage, the evidence is still incomplete.
On the face of it, however, especially in the areas of NSW Government board membership and SES positions (although these numbers are very small), the leadership gender gap between Aboriginal women and Aboriginal men is smaller than it is for the general population.
Aboriginal women have higher rates of educational attainment than Aboriginal men, and are well represented in a number of Indigenous peak organisations.

Women in NSW 2013 159
Leadership
How does NSW compare?The ABS publishes the Gender Indicators Australia series every six months. It sets out a range of indicators against which it is possible to examine how women in NSW are faring compared with all women in Australia. Detailed information is contained in the Appendix.
Based on indicators used in the latest (January 2013) Gender Indicators Australia series, there are some noticeable differences
between the leadership experiences of women in NSW and all Australian women.
In January 2013, there were more women in Federal Parliament (29.2 percent women) than there were in the NSW Parliament (23.7 percent women).
However, there were more women on NSW Government boards in 2011 than there were on Australian Government boards: women made up 37.8 percent of members of NSW Government boards in 2011, compared to 35.3 percent for Commonwealth Government boards.
A more significant difference is in the public sector Senior Executive Service (SES) where, in 2012, only 27 percent of NSW Government SES positions were filled by women, compared to 39.2 percent of Australian Government SES positions.
Based on published data from the Australasian Institute of Judicial Administration as at March 2013, the proportion of women judges and magistrates in Commonwealth courts was 30 percent, compared to 34 percent for NSW courts.