
Chapter V PERFORMANCE OF DEPOSITORIES AND DEPOSITORY...
29
128 Chapter V PERFORMANCE OF DEPOSITORIES AND DEPOSITORY PARTICIPANTS Introduction Ratio analysis is the universally used technique for the analysis of financial performance of an organization. A ratio is a statistical yardstick that provides a measure of relationship between the variables or figures. The ratio analysis helps the management to analyze the past performance of the firm and to make further projections. In this study ratio analysis is done to understand the performance of depositories and DPs. Through this, the weaknesses and strengths are identified and appropriate suggestions are given. Financial Performance of Depositories in India Depository is an institution or a kind of organization which holds securities with it, in which trading is done among shares, debentures, mutual funds, derivatives, F&O and commodities. The intermediaries perform their actions in variety of securities at Depository on the behalf of their clients. These intermediaries are known as Depositories Participants. Fundamentally, there are two sorts of depositories in India. One is the National Securities Depository Limited (NSDL) and the other is the Central Depository Service (India) Limited (CDSL). The investor who is known as beneficial owner (BO) has to open a demat account through any DP for dematerialization of his holdings and transferring securities. Depositories were setup with the objective of providing convenient, dependable and secure depository services at affordable cost to all market participants. All leading stock exchanges like the National Stock Exchange, Bombay Stock Exchange, Calcutta Stock Exchange, Delhi Stock Exchange, The Stock Exchange of Ahmadabad, etc have established connectivity with CDSL or NSDL. This Chapter focuses on financial performance of both the depositories i.e. CDSL and NSDL of India. This study is purely based on secondary data and the period of the study is April – 2007 to March – 2012 i.e. five consecutive financial years.
Transcript of Chapter V PERFORMANCE OF DEPOSITORIES AND DEPOSITORY...

128
Chapter V
PERFORMANCE OF DEPOSITORIES AND DEPOSITORY
PARTICIPANTS
Introduction
Ratio analysis is the universally used technique for the analysis of
financial performance of an organization. A ratio is a statistical yardstick that
provides a measure of relationship between the variables or figures. The ratio
analysis helps the management to analyze the past performance of the firm and to
make further projections. In this study ratio analysis is done to understand the
performance of depositories and DPs. Through this, the weaknesses and strengths
are identified and appropriate suggestions are given.
Financial Performance of Depositories in India
Depository is an institution or a kind of organization which holds
securities with it, in which trading is done among shares, debentures, mutual
funds, derivatives, F&O and commodities. The intermediaries perform their
actions in variety of securities at Depository on the behalf of their clients. These
intermediaries are known as Depositories Participants. Fundamentally, there are
two sorts of depositories in India. One is the National Securities Depository
Limited (NSDL) and the other is the Central Depository Service (India) Limited
(CDSL). The investor who is known as beneficial owner (BO) has to open a
demat account through any DP for dematerialization of his holdings and
transferring securities. Depositories were setup with the objective of providing
convenient, dependable and secure depository services at affordable cost to all
market participants. All leading stock exchanges like the National Stock
Exchange, Bombay Stock Exchange, Calcutta Stock Exchange, Delhi Stock
Exchange, The Stock Exchange of Ahmadabad, etc have established connectivity
with CDSL or NSDL. This Chapter focuses on financial performance of both the
depositories i.e. CDSL and NSDL of India. This study is purely based on
secondary data and the period of the study is April – 2007 to March – 2012 i.e.
five consecutive financial years.

129
National Securities Depository Limited (NSDL)
It is an organization promoted by lOBI, UTI and National Stock Exchange
of India Ltd. The aim is to provide facilities for holding and handling securities in
electronic form. Subsequently; SBI (acquired a 4.76 per cent in NSDL). HDFC
bank, Deusche bank, Dena Bank, Canara Bank, Global Trust Bank, Standard
Chartered bank, Citibank NA and HSBC have acquired stake in NSDL. It
commenced its operations in November 1996. Its headquarter is situated at
Mumbai. It is holding and handling securities in electronic form. It facilitates
faster settlement cycles. It provides services related to transactions in securities. It
interfaces with the investors through its agents called depository participant
(DPs). As a depository, NSDL (i) acts as a custodian as well as legally transfer
beneficial ownership, (ii) reduces settlement risk by minimizing the paper work
involved in trading, and settling and transferring securities. NSDL offers the
following benefits: (a) dematerialization, (b) rematerialization, (c) electronic
settlement trades in stock exchanges connected to NSDL, (d) pledging/
hypothecation of dematerialized securities against bank loan, (e) electronic credit
of securities, (f) receipt of non-cash corporate benefits such as bonus in electronic
form, (g) other services viz., holding debt instruments in the same account,
availing stock lending/ borrowing facility etc.
Central Depository Services (India) Limited (CDSL)
Bombay Stock Exchange Limited (BSE) promoted CDSL jointly with
leading banks such as State Bank of India, Bank of India, Bank of Baroda, HDFC
Bank, Standard Chartered Bank, and Union Bank of India and Centurion Bank
CDSL was set up with the objective of providing convenient, dependable and
secure depository services at affordable cost to all market participants. CDSL
received the certificate of commencement of business from SEBI in February
1999. All leading stock exchanges like the National Stock Exchange, Calcutta
Stock Exchange, Delhi Stock Exchange, The Stock Exchange, Ahmadabad, etc
have established connectivity with CDSL. As at the end of Dec 2005, over 5000
issuers have admitted their securities (equities, bonds, debentures, and
commercial papers), units of mutual funds, certificate of deposits etc. into the

CDSL system. CDSL has over 296 DPs spread around 119 cities/towns across the
country, offering convenience for an investor to select a DP based on his location.
Table 5.1 Investor and DP Services
NSDL
Investor Accounts
DP Services Centers
Demat Custody Value
DPs
Companies
Source: www.nsdl.com, www.cdsl.com
Table 5.1 indicates
Custody Value and number of DPs and DP companies
Securities Depository
Limited (CDSL) as on
Table 5.2 Equity Shares in NSDL and CDSL traded in NSE and BSE
Depository
NSDL
CDSL Source: www.nsdl.com,www.cdsl.com
Table 5.2 indicates the both NSDL and CDSL
7,145and1, 51,810 respectively. The
companies are 1,184,586 and 97, 39,080 respectively.
Fig
0
20
40
60
80
100
120
Quantity (in Millions)
130
CDSL system. CDSL has over 296 DPs spread around 119 cities/towns across the
country, offering convenience for an investor to select a DP based on his location.
Investor and DP Services Centers of NSDL and CDSL as on
31-3-2013
NSDL CDSL
s 1,26,88,865 Investor Account
DP Services Centers 14,641 DP Location
Demat Custody Value 76,79,027 Demat Custody Value
567 DPs
10,843 Companies
, www.cdsl.com
5.1 indicates Investor accounts, DP Services Centers and Demat
Custody Value and number of DPs and DP companies of both
itory Limited (NSDL) and Central Depository Service (India)
as on 31st
March, 2013.
Equity Shares in NSDL and CDSL traded in NSE and BSE
Quantity (in
Millions)
Value ( in Millions)
7,145 1,184,586
151,810 9,7www.nsdl.com,www.cdsl.com
Table 5.2 indicates the both NSDL and CDSL have equity
51,810 respectively. The Value of the equity quantity held by both the
1,184,586 and 97, 39,080 respectively.
Fig 5.1 Equity Shares in NSDL and CDSL
Quantity (in Millions) Value ( in Millions)
CDSL system. CDSL has over 296 DPs spread around 119 cities/towns across the
country, offering convenience for an investor to select a DP based on his location.
nters of NSDL and CDSL as on
83,27,482
12,864
97,39.080
579
12,801
Investor accounts, DP Services Centers and Demat
the National
and Central Depository Service (India)
Equity Shares in NSDL and CDSL traded in NSE and BSE
Value ( in Millions)
1,184,586
9,739,080
have equity quantity of
held by both the
NSDL
CDSL
131
Financial Performance of Depositories
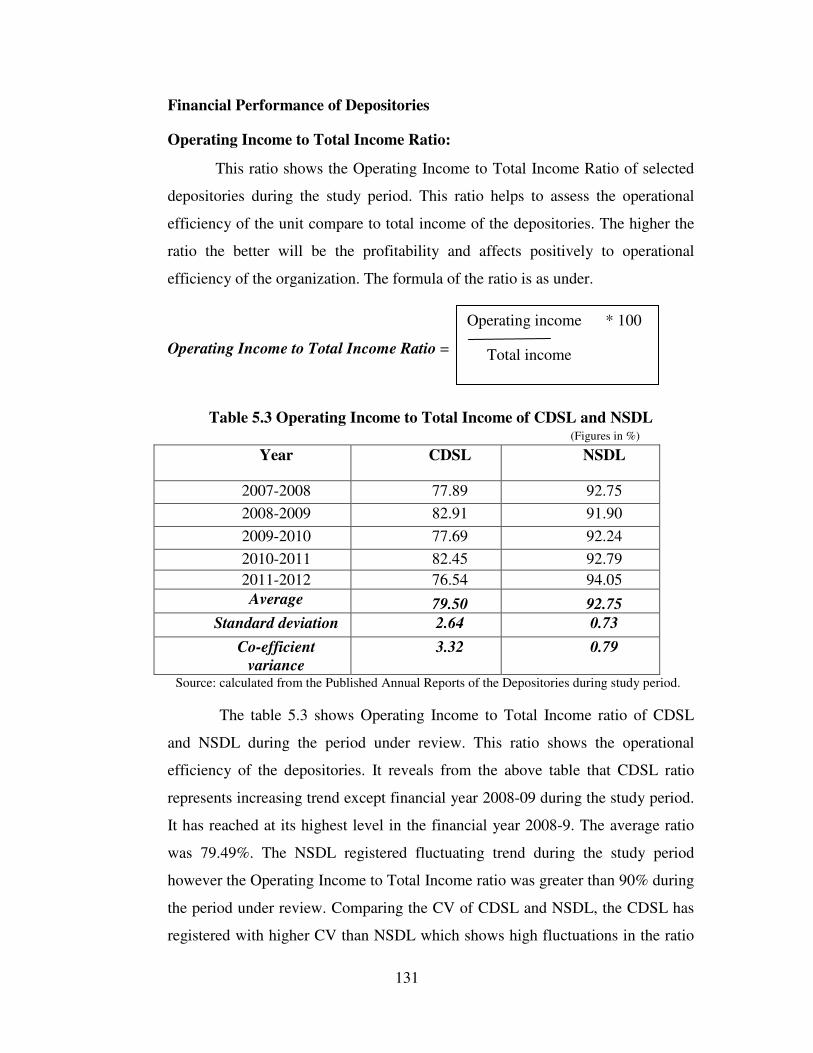
Operating Income to Total Income Ratio:
This ratio shows the Operating Income to Total Income Ratio of selected
depositories during the study period. This ratio helps to assess the operational
efficiency of the unit compare to total income of the depositories. The higher the
ratio the better will be the profitability and affects positively to operational
efficiency of the organization. The formula of the ratio is as under.
Operating Income to Total Income Ratio =
Table 5.3 Operating Income to Total Income of CDSL and NSDL (Figures in %)
Year CDSL NSDL
2007-2008 77.89 92.75
2008-2009 82.91 91.90
2009-2010 77.69 92.24
2010-2011 82.45 92.79
2011-2012 76.54 94.05
Average 79.50 92.75
Standard deviation 2.64 0.73
Co-efficient
variance
3.32 0.79
Source: calculated from the Published Annual Reports of the Depositories during study period.
The table 5.3 shows Operating Income to Total Income ratio of CDSL
and NSDL during the period under review. This ratio shows the operational
efficiency of the depositories. It reveals from the above table that CDSL ratio
represents increasing trend except financial year 2008-09 during the study period.
It has reached at its highest level in the financial year 2008-9. The average ratio
was 79.49%. The NSDL registered fluctuating trend during the study period
however the Operating Income to Total Income ratio was greater than 90% during
the period under review. Comparing the CV of CDSL and NSDL, the CDSL has
registered with higher CV than NSDL which shows high fluctuations in the ratio
Operating income * 100
Total income

whereas NSDL has low ratio which affects positively to its stability.
that NSDL is performing
TI is high and also CV is low.
and enhance its operating efficiency so that it can achieve maximum Operating
Income to Total Income
Fig: 5.2 Operating Income to Total Income
H0: There is no significance difference between CDSL and NSDL with regard to
operating Income to Total Income Ratio.
H1: There is significance difference between CDSL and NSDL with regard to
operating Income to Total Income Ratio
Table 5.3.1 Operating Income to Total Income (One Way ANOVA)
Sum of
Squares
Between
Groups
Within
Groups
Total
438.906
37.634
476.541
Source: SPSS and * significant at 0.01 level of significance
0
2040
6080
100
132
whereas NSDL has low ratio which affects positively to its stability.
that NSDL is performing well when compared with CDSL as mean ratio
high and also CV is low. It is suggested to CDSL to reduce its business risk
operating efficiency so that it can achieve maximum Operating
Income ratio.
Operating Income to Total Income of CDSL and N
: There is no significance difference between CDSL and NSDL with regard to
operating Income to Total Income Ratio.
There is significance difference between CDSL and NSDL with regard to
operating Income to Total Income Ratio.
Operating Income to Total Income (One Way ANOVA)
Sum of
Squares
Df Mean
Square
F-Cal Sig. F-table
@0.01
L.O.S
438.906
37.634
476.541
1
8
9
438.906
4.704
93.299 .000* 11.26
Source: SPSS and * significant at 0.01 level of significance.
Operating Income from Total Income
whereas NSDL has low ratio which affects positively to its stability. It is found
mean ratio of OI to
It is suggested to CDSL to reduce its business risk
operating efficiency so that it can achieve maximum Operating
SL and NSDL
: There is no significance difference between CDSL and NSDL with regard to
There is significance difference between CDSL and NSDL with regard to
Operating Income to Total Income (One Way ANOVA)
table
@0.01
L.O.S
Decision
11.26
H0 is
Rejected
and H1 is
Accepted
CDSL
NSDL

133
The ratio of Operating Income to Total Income is an important measure
for analyzing the operating efficiency of the depository. To test whether there
exists significance difference between CDSL and NSDL with regard to operating
efficiency (OI/TI).The table-5.3.1 indicates that F-cal (93.29) is more than F-table
(11.26) at 0.01 level of significance for degrees of freedom ʋ1= 1 and ʋ2 = 8.
Null hypothesis (H0) is rejected and hence, H1 is accepted .Therefore it is
concluded that there is significance difference between CDSL and NSDL with
regard to operating Income to Total Income Ratio (operating efficiency).
It is suggested to CDSL and NSDL to enhance their operating efficiency so that
their operating Income to Total Income will reach to maximum level.
Other Income to Total Income Ratio
This ratio shows the Other Income to Total Income Ratio of selected
depositories during the study period. This ratio helps to assess depositories’ way
of working. The higher the ratio the better will be the profitability but it can be
said that the depository is unable to work operationally well. The Other Income
here includes Misc. Income, Interest or Dividend Income, profit on sale of assets,
etc. The formula of the ratio is as under.
Other Income to Total Income Ratio =
Table 5.4 Other Income to Total Income Ratio of CDSL and NSDL
(Figures in %)
Year CDSL NSDL
2007-2008 16.96 8.09
2008-2009 22.18 7.76
2009-2010 19.84 8.35
2010-2011 17.55 7.21
2011-2012 23.46 5.95
Average 19.99 7.47
Standard deviation 2.53 0.85
Co-efficient
variation
12.64 11.38
Source: Calculated from the Published Annual Reports of the Depositories during study period.
Other Income * 100
Total Income

134
The table 5.4 shows that Other Income to Total Income ratio of CDSL and
NSDL during the period under review. This ratio shows income earned by
depositories other than Operational one. Other Income includes Misc. Income,
Interest or Dividend Income, profit on sale of assets, etc. It revels from the above
table that CDSL ratio represents decreasing trend except financial year 2008-09
during the study period. It has reached at its highest level in the financial year
2008-09. The average ratio was 22.17%. The NSDL registered fluctuating trend
during the study period however the Other Income to Total Income ratio was
lower than 9% during the period under review which affects positively to
company’s operational efficiency. Comparing the CV of CDSL and NSDL, the
CDSL has registered with higher CV than NSDL which shows high fluctuations
in the ratio whereas NSDL has low ratio which shows stability in company’s
earning. It is observed that CDSL is not performing its operations well even
though it has high mean of OI /TI when compared with NSDL and more over
NSDL has lesser business risk than CDSL. Therefore, it is suggested that to the
CDSL to concentrate on earning consistent income by performing operations well
and that should lead to decrease in business risk.
Chart 5.3 Other Income to Total Income of CDSL and NSDL
H0: There is no significance difference between CDSL and NSDL with regard to
Other Income to Total Income Ratio.
H1: There is significance difference between CDSL and NSDL with regard to
Other Income to Total Income Ratio.
05
101520253035
NSDL
CDSL

135
Table 5.4.1 Other Income to Total Income (One Way ANOVA)
Source Sum of
Squares
D
f
Mean
Square
F-Cal Sig. F-table
@0.01
L.O.S
Decision
Between
Groups
Within Groups
Total
392.252
35.615
427.866
1
8
9
392.252
4.452
88.110 .000* 11.26 H0 is
Rejected
and H1 is
Accepted
Source: SPSS and * significant at 0.01 level of significance
The ratio of other Income to Total Income is an important measure for
analyzing whether depository is performing its operations well or not? The anova
test is conducted between CDSL and NSDL to know the significance difference
between CDSL and NSDL with regard to other income to total income ratio. The
table 5.4.1 indicates that F-cal (88.11) is more than F-table (11.26) at 0.01 level of
significance for degrees of freedom ʋ1= 1 and ʋ2 = 8. Null hypothesis (Ho) is
rejected and hence, H1 is accepted .Therefore it is concluded that there is
significance difference between CDSL and NSDL with regard to other Income to
Total Income Ratio. It is suggested that of CDSL and NSDL have to enhance their
other income by performing their operations well or effectively.
Total Expenses to Total Income Ratio
This ratio shows the Total Expenses to Total Income Ratio of selected
depositories during the study period. This ratio helps to assess depositories’
Profitability from the view point of expenses. Higher ratio affects negatively to
the profitability of depositories’ income earning capacity. Total expenses include
administration, and other expenses of the organization. The formula of the ratio is
as under.
Total Expenses to Total Income Ratio =
TotalExpenses *100
Total Income

136
Table 5.5 Total Expenses to Total Income Ratio of CDSL and NSDL
(
F
i
g
u
r
e
s
i
n
Source: calculated from the Published Annual Reports of the Depositories during study period.
The table 5.5 shows Total Expenses to Total Income ratio of CDSL and
NSDL during the period under review. This ratio shows expenses accrued by
depositories during study period. Total expenses include administration, and other
expenses of the organization. It reveals from the above table that CDSL ratio
represents decreasing trend during 2008-12. CDSL was controlling its total
expenses effectively. Its ratio reached to highest level of 38.11 in the financial
year 2008-9.
The NSDL registered fluctuating from 2007 to2011 and then increased
marginally in 2011-12. The lower Total expenses to Total Income ratio affects
positively to company’s operational efficiency and profitability. Comparing the
CV of CDSL and NSDL, the CDSL has registered with lower CV than NSDL
which shows that NSDL has less stability in term of Total Expenses to Total
Income ratio during the study period. Therefore, it is found that CDSL is
controlling its total expenses to total income consistently and its trend is in
decreasing from2008-12. The NSDL has high level of Total expenses to Total
income as its mean ratio is 70.14 and CV of 9.23. In this regard, it is suggested to
the NSDL to control its total expenses effectively so that it can improve its
consistency in total expenses to total income.
Year CDSL NSDL
2007-2008 33.80 60.97
2008-2009 38.11 80.51
2009-2010 33.46 66.35
2010-2011 32.84 71.07
2011-2012 32.46 71.80
Average 34.14 70.14
Standard deviation 2.04 6.48
Co-efficient variance 5.98 9.23

Fig 5.4 Total Expenses to Total Income
H0: There is no significance difference between CDSL an
Total Expenses to Total Income Ratio.
H1: There is significance difference between CDSL and NSDL with regard to
Total Expenses to Total Income Ratio.
Table 5.5.1Total Expenses
Source Sum
Squares
Between
Groups
Within
Groups
Total
3241.080
230.462
3471.542Source: SPSS and * significant at 0.01 level
The table 5.5.1 indicates that F
0.01 level of significance for degrees of freedom
hypothesis (H0) is rejected and hence,
that there is no uniformity in Total expenses to
CDSL and NSDL and it is significant statistically.
020406080
100
`in
Laksh
s i
n %
137
Total Expenses to Total Income of CDSL and NSDL
: There is no significance difference between CDSL and NSDL with regard to
to Total Income Ratio.
There is significance difference between CDSL and NSDL with regard to
to Total Income Ratio.
Total Expenses to Total Income (One Way ANOVA)
Sum of
Squares
Df Mean
Square
F-Cal Sig. F-
table
@0.01
L.O.S
3241.080
230.462
3471.542
1
8
9
3241.080
28.808
112.51 .000* 11.26
Source: SPSS and * significant at 0.01 level of significance
.1 indicates that F-cal (112.11) is more than F-table (11.26
0.01 level of significance for degrees of freedom ʋ1= 1 and ʋ2 = 8.
) is rejected and hence, H1 is accepted .Therefore it is conclude
uniformity in Total expenses to Total Income Ratio
CDSL and NSDL and it is significant statistically. It is suggested to
Years
of CDSL and NSDL
d NSDL with regard to
There is significance difference between CDSL and NSDL with regard to
to Total Income (One Way ANOVA)
table
@0.01
L.O.S
Decision
11.26 H0 is
Rejected
and H1 is
Accepted
table (11.26) at
2 = 8. Null
s accepted .Therefore it is concluded
Total Income Ratio between
It is suggested to that CDSL
CDSL
NSDL

138
and NSDL have to enhance their efforts in controlling expenses to improve its
efficiency.
Return on Investment Ratio of CDSL and NSDL
This ratio shows the percentage return received by depositories on their
total share holder’s fund during the study period. This ratio helps to assess
depositories’ Profitability from the view point of share holder’s fund. Higher ratio
affects positively to the profitability of depositories’ income earning capacity.
Total share holder fund includes share capital and reserve and surplus during one
financial year. The formula of the ratio is as under.
ROI =
Table 5.6 Return on Investment Ratio of CDSL and NSDL
(Figures in %)
Year CDSL NSDL
2007-2008 20.83 20.36
2008-2009 17.17 9.54
2009-2010 20.58 22.01
2010=2011 18.16 19.51
2011-2012 16.16 20.52
Average 18.58 18.39
Standard
deviation
1.85 4.49
Co-efficient
variance
9.94 24.45
Source: calculated from the Published Annual Reports of the Depositories
Return on Investment is an important measure of performance of any
organization. ROI is important for the owners of the organization. The table 5.6
shows that Return on Investment ratio of CDSL and NSDL during the period
under review. This ratio reveals that returns earned by depositories on their
investment during study period. The profit which is taken as post tax. It reveals
from the above table that CDSL ratio represents fluctuating trend during the study
Profit after Tax * 100
Total Share Holders Fund

139
period of 2007-12 except in 2008-09 which shows that its profitability was not
stable. CDSL has achieved its highest level of 20.83 % in the financial year 2007-
08. The average ROI of CDSL obtained during the study is 18.58%. The NSDL
also registered fluctuating trend during the study period which also affects
negatively to its profitability. The Return on Investment ratio recorded 9.54%
which was the lowest during the period 2007-12 which affects negatively to
company’s operational efficiency. NSDL achieved highest ROI of 22.01 % in the
year 2009-10 .Comparing the CV of CDSL and NSDL; the CDSL has registered
with lower CV than NSDL which shows that NSDL has less stability in term of
Return on Investment ratio during the study period. It is found that both the
depositories have almost earned equally to the extent of 18 % of ROI during the
study from 2007-12 and more over CDSL has more consistency in ROI when
compared with NSDL. NSDL has high business risk due to fluctuating trend in
ROI and but its ROI is increased to 20.52 % in 2011-12 from 19.51 in 2010-11. In
this regard, it is suggested to the depositories to improve their operating and other
incomes and simultaneously control the total expenses and thus enhances the
consistency in ROI.
Fig 5.5 Return on Investment Ratio of CDSL and NSDL
H0: There is no significance difference in the return on investment (ROI) of
CDSL and NSDL.
H1: There is no significance difference in the return on investment (ROI) of CDSL
and NSDL.
0
5
10
15
20
25
30
0 5 10
`in
Laksh
s i
n %
Years
CDSL
NSDL
Linear (CDSL)
Linear (NSDL)

140
Table 5.6.1 Return on Investment (One Way ANOVA)
Sum of
Squares
Df Mean
Square
F-Cal Sig. F-
table
@0.01
L.O.S
Decision
Between
Groups
Within
Groups
Total
.092
118.182
118.275
1
8
9
.92
14.773
.006 .939ns
11.26 H0 is
Accepted
and H1 is
Rejected
Source: SPSS and ns- not significant at 0.01 level of significance.
The table 5.6.1 indicates that F-cal (0.006) is less than F-table (11.26) at
0.01 level of significance for degrees of freedom ʋ1= 1 and ʋ2 = 8. Alternative
hypothesis (H1) is rejected and hence, Ho is accepted .Therefore it is concluded
that there is uniformity in Return on Investment (ROI) earning of CDSL and
NSDL and it is not significant statistically. Both the depositories have earned
equally to the extent of 18 % only. It is suggested to depositories of CDSL and
NSDL to enhance their efforts in improving the operating incomes and other
incomes and by simultaneously the controlling expenses and that improves the
consistency in Return on Investment ratio.
Performance of Select Depository Participants
Financial statements are formal records of the financial activities of a
business, person, or other entity and provide an overview of a business or person's
financial condition in both short and long term. In this study give an accurate
picture of a select DPs condition and operating results in a condensed form.
Analysis and interpretation of financial statements help in determining the
liquidity position, long term solvency, financial viability and profitability of a
firm. Ratio analysis shows whether the depository participants are improving or
deteriorating in past years. Moreover, Comparison of different aspects of all the
firms can be done effectively with this. It helps the investors to decide in which
firm the risk is less or in which one they should invest so that maximum benefit
can be earned. So before have taking decision one have to carefully study its
financial condition and worthiness of DPs. Unfortunately very limited work has

141
been done on analysis and interpretation of financial statements of Indian for DPs.
An attempt has been carried out in this research to analyze and interpret the
financial statements of four select depository participants.
Performance of Karvy Stock Broking Ltd.
Current Ratio of Karvy Stock Broking Ltd:
Current ratio matches current assets with current liabilities and tells us
about Karvy Stock Broking Ltd whether the current assets are enough to settle
current liabilities. General rule is that higher the current ratio better it is but a ratio
of 2:1 is considered as ideal.
Table 5.7 Current Ratio of Karvy Stock Broking Limited
Years Current Ratio
2009 - 2010 0.13
2010 – 2011 0.93
2011 - 2012 3.64
Average 1.57
Source: Compiled from the annual reports of Karvy Stock Broking Co.Ltd.
The table 5.7 indicates that average current ratio of KSBCL is 1.57 which
is below the standard norm of 2:1, so KSBCL cannot meet its short term
obligations effectively. The trend of current ratio of KSBCL is in increasing trend.
Therefore, it is found that liquidity position of the KSBCL is not satisfactory as
its average current ratio during the study is 1.57 and its ratio in years 2009-10 to
2010-11 were lower than standard norm of 2:1 which means for every one rupee
worth of current liability KSBCL has 1.57 rupees worth of current assets. In this
regard, it is suggested to the KSBCL to take appropriate measures to enhance the
current assets over current liabilities so that it has sufficient liquidity to discharge
short term obligations effectively.
142
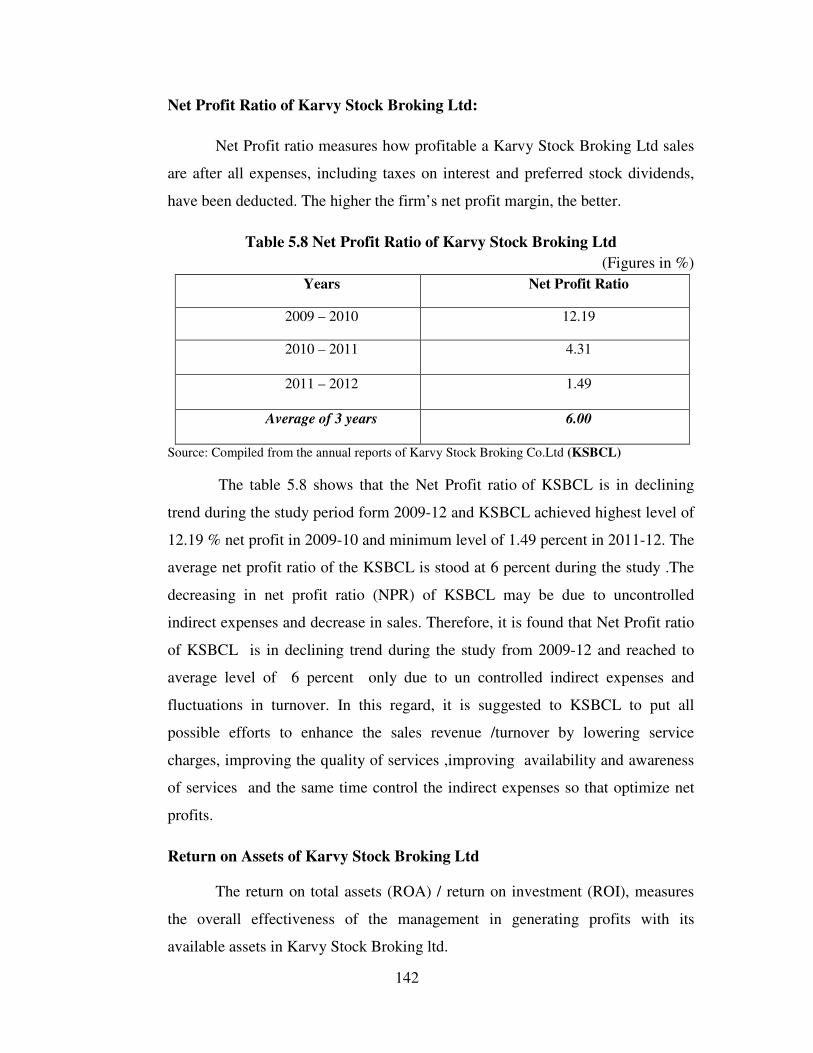
Net Profit Ratio of Karvy Stock Broking Ltd:
Net Profit ratio measures how profitable a Karvy Stock Broking Ltd sales
are after all expenses, including taxes on interest and preferred stock dividends,
have been deducted. The higher the firm’s net profit margin, the better.
Table 5.8 Net Profit Ratio of Karvy Stock Broking Ltd
(Figures in %)
Years Net Profit Ratio
2009 – 2010 12.19
2010 – 2011 4.31
2011 – 2012 1.49
Average of 3 years 6.00
Source: Compiled from the annual reports of Karvy Stock Broking Co.Ltd (KSBCL)
The table 5.8 shows that the Net Profit ratio of KSBCL is in declining
trend during the study period form 2009-12 and KSBCL achieved highest level of
12.19 % net profit in 2009-10 and minimum level of 1.49 percent in 2011-12. The
average net profit ratio of the KSBCL is stood at 6 percent during the study .The
decreasing in net profit ratio (NPR) of KSBCL may be due to uncontrolled
indirect expenses and decrease in sales. Therefore, it is found that Net Profit ratio
of KSBCL is in declining trend during the study from 2009-12 and reached to
average level of 6 percent only due to un controlled indirect expenses and
fluctuations in turnover. In this regard, it is suggested to KSBCL to put all
possible efforts to enhance the sales revenue /turnover by lowering service
charges, improving the quality of services ,improving availability and awareness
of services and the same time control the indirect expenses so that optimize net
profits.
Return on Assets of Karvy Stock Broking Ltd
The return on total assets (ROA) / return on investment (ROI), measures
the overall effectiveness of the management in generating profits with its
available assets in Karvy Stock Broking ltd.

143
Table 5.9 Return on Assets of Karvy Stock Broking Ltd
(Figures in %)
S
o
u
r
c
e
:
C
o
m
piled from the annual reports of Karvy Stock Broking.Ltd
The table 5.9 shows that ROA of KSBCL is in declining trend during the
study from 2009-12. The average return on Assets (ROA) of KSBCL during the
study was 3.59 percent only which indicates the in efficiency of the management
in utilizing the assets for generating adequate returns. Therefore, it is found that
the average return on assets (ROA) of KSBCL during the study from 2009-12 is
3.59 percent only which indicates that management is not utilized the assets to the
optimum extent in generating sufficient returns. It is suggested to the KSBCL to
utilize the all the assets to the optimum extent and improve operational efficiency
so that Return on assets (ROA) is maximized.
India Info Line Limited (IIFL)
Current Ratio of IIFL
Current ratio matches current assets with current liabilities and tells us
about IIFL whether the current assets are enough to settle current liabilities.
Current ratio below 1 shows critical liquidity problems because it means that total
current liabilities exceed total current assets. General rule is that higher the
current ratio better it is but a ratio of 2:1 is considered as ideal.
Years ROA
2009 - 2010 8.60
2010 – 2011 1.78
2011 - 2012 0.41
Average ROA 3.59

144
Table 5.10 Current Ratio of IIFL
(Figure in %)
Years Current Ratio
2009 – 2010 1.52
2010 – 2011 1.42
2011 – 2012 1.39
Average CR 1.44
Source: Compiled from the annual reports of the IIFL.
The table 5.10 indicates that a current ratio of 1.44 is below the standard
norm of 2:1, so IIFL cannot meet its short term obligations effectively. The trend
of current ratio of IIFL is in decreasing trend. Therefore, it is found that liquidity
position of the IIFL is not satisfactory as its average current ratio during the study
is 1.44 only which means every one rupee current liability IIFL has 1.44 rupees of
current assets. In this regard, it is suggested to the IIFL to take appropriate
measures to enhance the current assets over current liabilities so that its liquidity
can discharge short term obligations effectively.
Net Profit Ratio of IIFL
Net profit margin = Earnings after Taxes (EAT) / Sales. It measures how
profitable a IIFL sales are after all expenses, including taxes on interest and
preferred stock dividends, have been deducted. The higher the firm’s net profit
margin, the better.
Table 5.11 Net Profit Ratio of IIFL
(Figure in %)
Years Net Profit Ratio
2009 - 2010 22.02
2010 - 2011 15.29
2011 - 2012 10.13
Average 15.81
Source: Compiled from the annual reports of the IIFL.
145
The table 5.11 shows that the Net Profit ratio is in decreasing trend during
the study period form 2009-12 and IIFL achieved highest level of 22.02 % net
profit in 2009-10 and minimum level of 10.13 % in 2011-12. The average net
profit ratio of the IIFL is stood at 15.81 % during the study .The decreasing in net
profit ratio (NPR) of IIFL may be due to uncontrolled indirect expenses even
though sales are increasing. Therefore, it is found that Net Profit ratio of IIFL is in
decreasing trend during the study from 2009-12 and reached to average level of
15.81 % only due to un controlled indirect expenses even though the turnover is
in increasing trend. In this regard, it is suggested to IIFL to put all possible efforts
to control the indirect expenses and at same the time continues the increasing
trend in sales in future also.
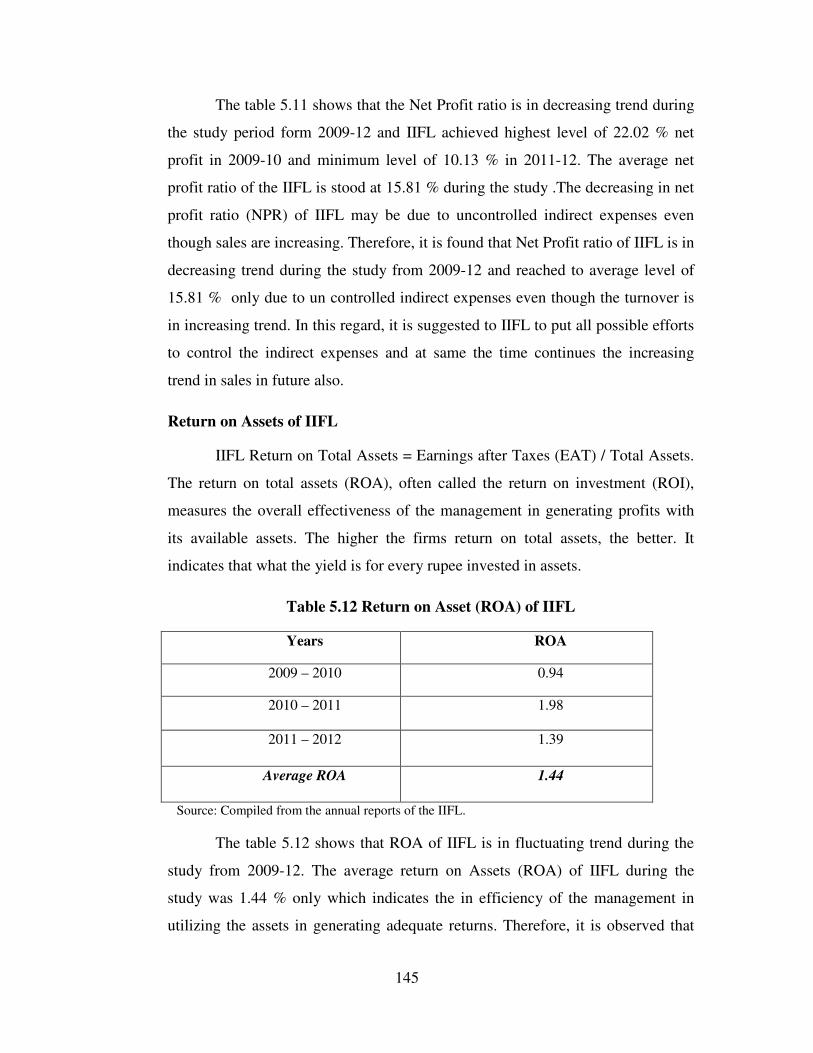
Return on Assets of IIFL
IIFL Return on Total Assets = Earnings after Taxes (EAT) / Total Assets.
The return on total assets (ROA), often called the return on investment (ROI),
measures the overall effectiveness of the management in generating profits with
its available assets. The higher the firms return on total assets, the better. It
indicates that what the yield is for every rupee invested in assets.
Table 5.12 Return on Asset (ROA) of IIFL
Years ROA
2009 – 2010 0.94
2010 – 2011 1.98
2011 – 2012 1.39
Average ROA 1.44
Source: Compiled from the annual reports of the IIFL.
The table 5.12 shows that ROA of IIFL is in fluctuating trend during the
study from 2009-12. The average return on Assets (ROA) of IIFL during the
study was 1.44 % only which indicates the in efficiency of the management in
utilizing the assets in generating adequate returns. Therefore, it is observed that

146
the average return on assets (ROA) of IIFL during the study is 1.44 % only which
indicates that management is not utilized the assets to the optimum extent in
generating sufficient returns. It is suggested to the IIFL to utilize the all the assets
to the optimum extent so that Return on assets (ROA) is maximized.
PCS Securities Ltd.
Current Ratio of PCS Securities Ltd:
Current ratio matches current assets with current liabilities and tells us
PCS Securities whether the current assets are enough to settle current liabilities.
Current ratio below 1 shows critical liquidity problems because it means that total
current liabilities exceed total current assets. General rule is that higher the
current ratio better it is but a ratio of 2:1 is considered as ideal.
Table 5.13 Current Ratio of PCS Securities
(Figure in %)
Years Current Ratio
2009 – 2010 2.62
2010 – 2011 1.38
2011 – 2012 2.71
Average CR 2.24
Source: Compiled from the annual reports of PCS Securities Limited
The table 5.13 indicates that a current ratio of 2.24 is more than the
standard norm of 2:1, so PCS can meet its short term obligations effectively. The
trend of current ratio of PCS is in fluctuating trend. Therefore, it is found that
liquidity position of the PCS is satisfactory as its average current ratio during the
study is 2.24 only which means every one rupee current liability PCS has 2.24
rupees of current assets. In this regard, it is suggested to the PCS management to
invest idle funds in money market instruments so that to achieve trade-off
between liquidity and profitability.

147
Net Profit Ratio:
Net profit margin = Earnings after Taxes (EAT) / Sales. It measures how
profitable a PCS Securities sales are after all expenses, including taxes on interest
and preferred stock dividends, have been deducted. The higher the firm’s net
profit margin, the better.
Table 5.14 Net Profit Ratio of PCS Securities
(Figures in %)
Years Net Profit Ratio
2009 - 2010 9.40
2010 - 2011 13.50
2011 - 2012 7.38
Average 25.36
Source: Compiled from the annual reports of PCS Securities Limited
The table 5.14 shows that the Net Profit ratio is in decreasing trend during
the study period form 2011-12 and PCS achieved highest level of 13.50 % cash
profit in 2010-11 and minimum level of 9.40 % in 2009-10. The average net profit
ratio of the PCS is stood at 25.36 % during the study .The decreasing in net profit
ratio (NPR) of PCS may be due to uncontrolled indirect expenses even though
sales are increasing. Therefore, it is found that Net Profit ratio of PCS is in
decreasing trend during the study from 2011-12 and reached to average level of
25.36% only due to un controlled indirect expenses even though the turnover is
in increasing trend. In this regard, it is suggested to PCS to put all possible efforts
to control the indirect expenses and at same the time continues the increasing
trend in sales in future also.
Return on Assets of PCS Securities:
PCS Securities Return on Total Assets = Earnings after Taxes (EAT) /
Total Assets. The return on total assets (ROA), often called the return on
investment (ROI), measures the overall effectiveness of the management in
148
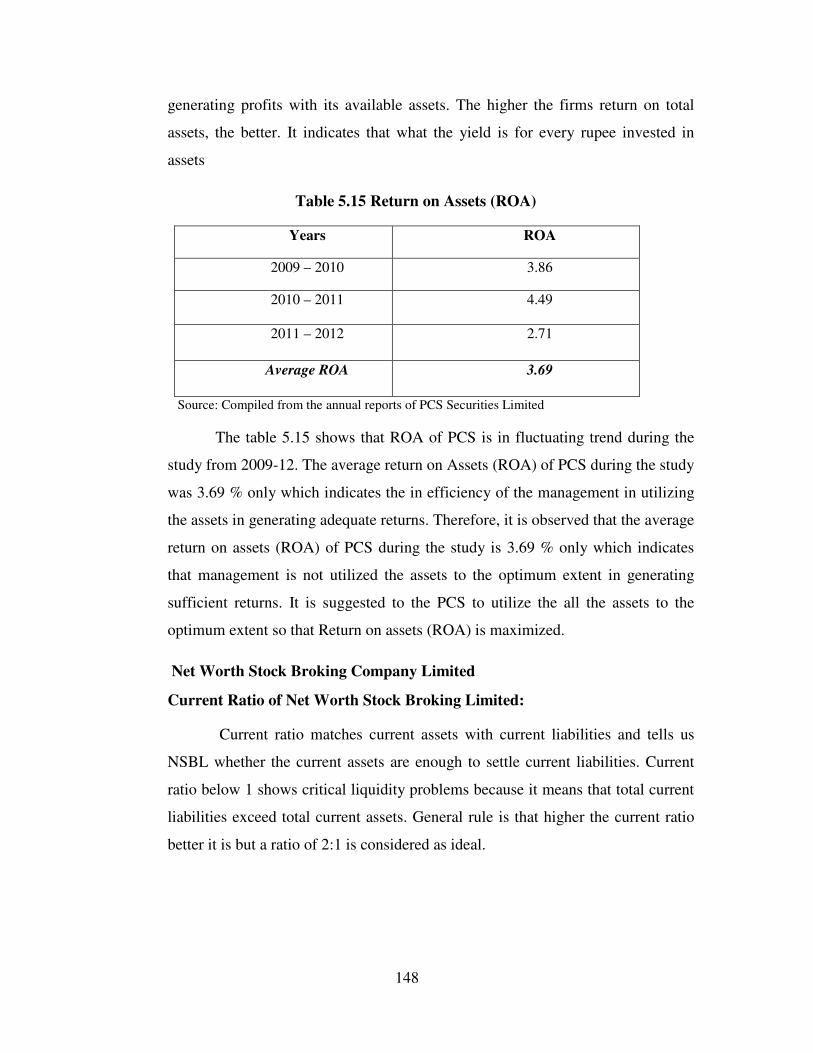
generating profits with its available assets. The higher the firms return on total
assets, the better. It indicates that what the yield is for every rupee invested in
assets
Table 5.15 Return on Assets (ROA)
Years ROA
2009 – 2010 3.86
2010 – 2011 4.49
2011 – 2012 2.71
Average ROA 3.69
Source: Compiled from the annual reports of PCS Securities Limited
The table 5.15 shows that ROA of PCS is in fluctuating trend during the
study from 2009-12. The average return on Assets (ROA) of PCS during the study
was 3.69 % only which indicates the in efficiency of the management in utilizing
the assets in generating adequate returns. Therefore, it is observed that the average
return on assets (ROA) of PCS during the study is 3.69 % only which indicates
that management is not utilized the assets to the optimum extent in generating
sufficient returns. It is suggested to the PCS to utilize the all the assets to the
optimum extent so that Return on assets (ROA) is maximized.
Net Worth Stock Broking Company Limited
Current Ratio of Net Worth Stock Broking Limited:
Current ratio matches current assets with current liabilities and tells us
NSBL whether the current assets are enough to settle current liabilities. Current
ratio below 1 shows critical liquidity problems because it means that total current
liabilities exceed total current assets. General rule is that higher the current ratio
better it is but a ratio of 2:1 is considered as ideal.
149
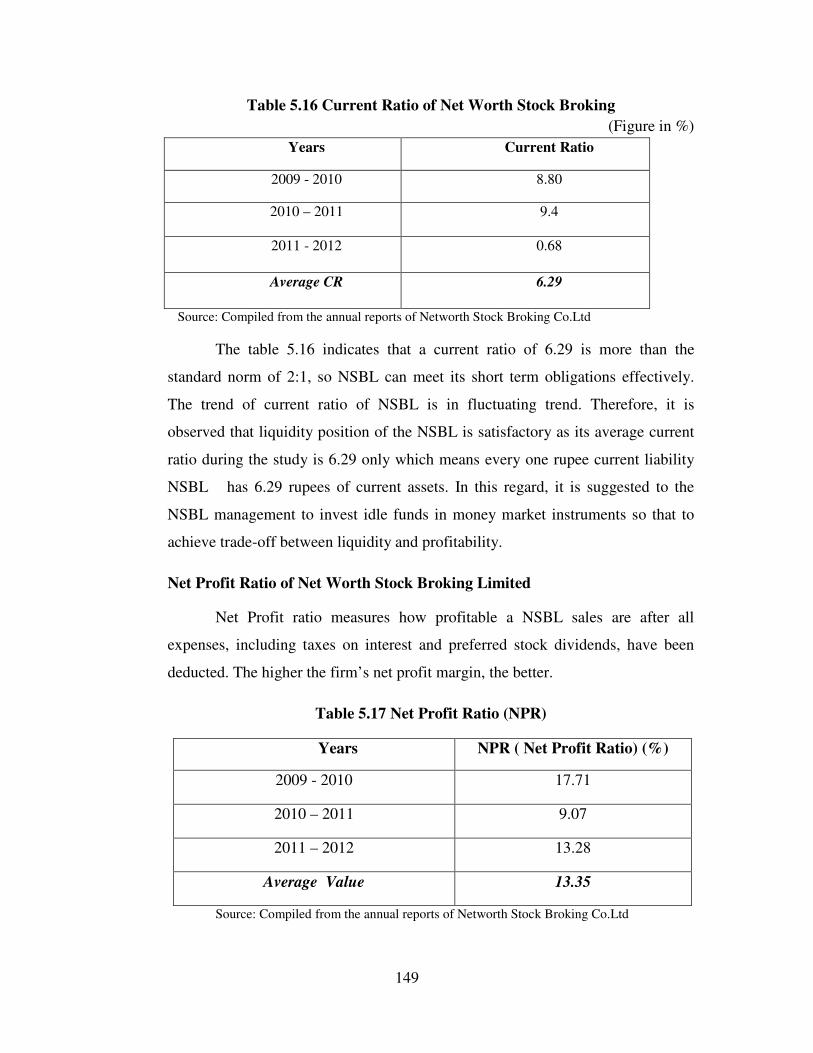
Table 5.16 Current Ratio of Net Worth Stock Broking
(Figure in %)
Years Current Ratio
2009 - 2010 8.80
2010 – 2011 9.4
2011 - 2012 0.68
Average CR 6.29
Source: Compiled from the annual reports of Networth Stock Broking Co.Ltd
The table 5.16 indicates that a current ratio of 6.29 is more than the
standard norm of 2:1, so NSBL can meet its short term obligations effectively.
The trend of current ratio of NSBL is in fluctuating trend. Therefore, it is
observed that liquidity position of the NSBL is satisfactory as its average current
ratio during the study is 6.29 only which means every one rupee current liability
NSBL has 6.29 rupees of current assets. In this regard, it is suggested to the
NSBL management to invest idle funds in money market instruments so that to
achieve trade-off between liquidity and profitability.
Net Profit Ratio of Net Worth Stock Broking Limited
Net Profit ratio measures how profitable a NSBL sales are after all
expenses, including taxes on interest and preferred stock dividends, have been
deducted. The higher the firm’s net profit margin, the better.
Table 5.17 Net Profit Ratio (NPR)
Years NPR ( Net Profit Ratio) (%)
2009 - 2010 17.71
2010 – 2011 9.07
2011 – 2012 13.28
Average Value 13.35
Source: Compiled from the annual reports of Networth Stock Broking Co.Ltd

150
The table 5.17 shows that the Net Profit ratio is in fluctuating trend during
the study period form 2009-12 and Networth company achieved highest level of
17.71 % net profit in 2009-10 and minimum level of 9.07 % in 2010-11. The
average net profit ratio of the Networh is stood at 13.35 % during the study .The
net profit ratio (NPR) of Networh is low due to uncontrolled indirect expenses
and decreasing sales. Therefore, it is found that Net Profit ratio of Networth
Company is in fluctuating trend during the study from 2009-12 and on average,
the firm earned a net profit of 13.35 % only due to uncontrolled indirect expenses
and declining trend in sales. In this regard, it is suggested to Net worth Company
to put all possible efforts to enhance the sales by lowering service charges,
improving the quality of services and other promotional efforts. More over
measures should be taken to control the indirect expenses also for magnifying the
profits of the firm.
Return on Assets of Net Worth Stock Broking Limited:
NBSL The return on investment (ROI), measures the overall effectiveness
of the management in generating profits with its available assets. The higher the
Net worth Stock broking limited return on total assets, the better. It indicates that
what the yield is for every rupee invested in assets.
Table 5.18 Return on Assets of Net Worth Stock Broking
(Figures in %)
Years ROA (%)
2009 - 2010 17.49
2010 – 2011 3.89
2011 - 2012 3.22
Average ROA 8.2
Source: Compiled from the annual reports of Networth Stock Broking Co.Ltd
The table 5.18 shows that ROA of NSBL is in declining trend during the
study from 2009-12. The average return on Assets (ROA) of NSBL during the
study was 8.2 percent only which indicates the in efficiency of the management in
utilizing the assets in generating adequate returns. Therefore, it is found that the
151
average return on assets (ROA) of NSBL during the study is 8.2 percent only
which indicates that management is not utilized the assets to the optimum extent
in generating sufficient returns. It is suggested to the NSBL to utilize the all the
assets to the optimum extent and improve operational efficiency so that Return on
assets (ROA) is maximized.
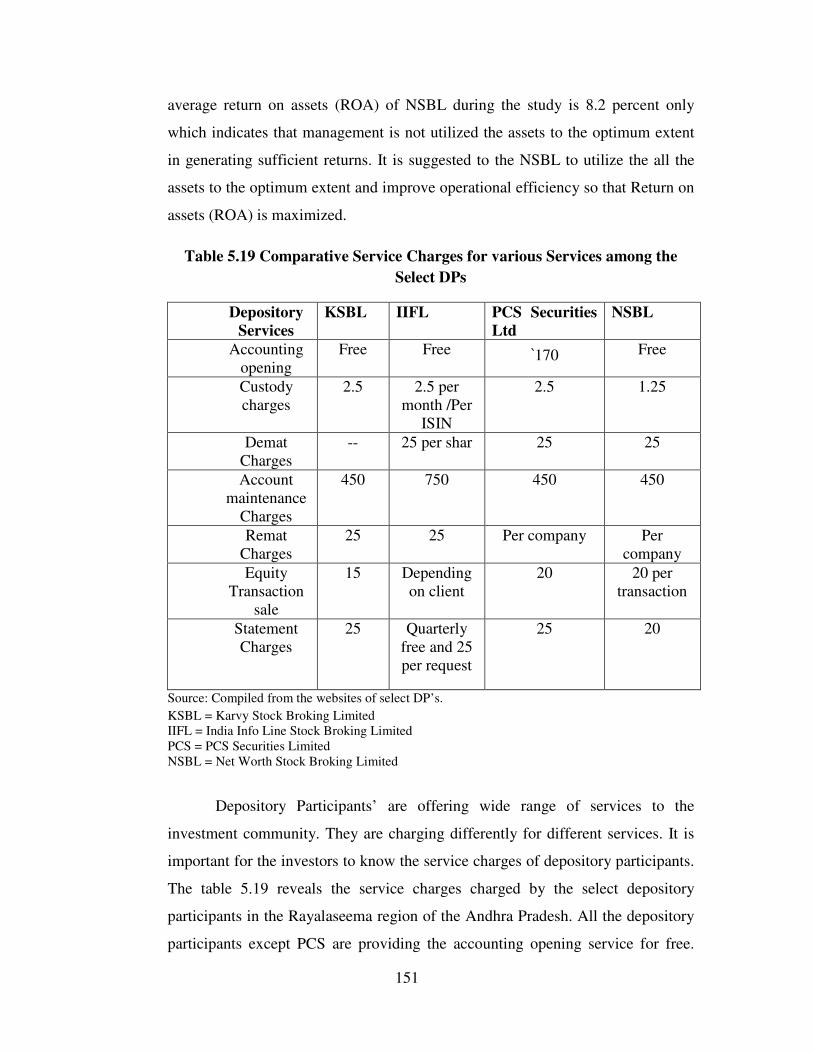
Table 5.19 Comparative Service Charges for various Services among the
Select DPs
Depository
Services
KSBL IIFL PCS Securities
Ltd
NSBL
Accounting
opening
Free Free `170 Free
Custody
charges
2.5 2.5 per
month /Per
ISIN
2.5 1.25
Demat
Charges
-- 25 per shar 25 25
Account
maintenance
Charges
450 750 450 450
Remat
Charges
25 25 Per company Per
company
Equity
Transaction
sale
15 Depending
on client
20 20 per
transaction
Statement
Charges
25 Quarterly
free and 25
per request
25 20
Source: Compiled from the websites of select DP’s.
KSBL = Karvy Stock Broking Limited
IIFL = India Info Line Stock Broking Limited
PCS = PCS Securities Limited
NSBL = Net Worth Stock Broking Limited
Depository Participants’ are offering wide range of services to the
investment community. They are charging differently for different services. It is
important for the investors to know the service charges of depository participants.
The table 5.19 reveals the service charges charged by the select depository
participants in the Rayalaseema region of the Andhra Pradesh. All the depository
participants except PCS are providing the accounting opening service for free.
152
PCS securities Ltd is charging for accounting opening for 170 rupees. All
depository participants except NSBL are almost charging same for the custody of
securities. NSBL is charging 1.25 rupees for security custody charges only .All
the depository participants are charging same except KSBCL for the service of
demat. KSBCL is offering the demat service for free of cost. Among the select
depository participants, IIFL is charging to the extent of 750 rupees for account
maintenance service where as the remaining DP’s are charging 450 rupees only.
Among the select DP’s IIFL and KSBCL are charging 25 rupees for remat service
where as remaining (NSBL and PCS) are charging per company wise. The service
charge charged by the select depository participants for equity transaction sale
and statement charges are competitive.
It is observed that Net worth Stock Broking Ltd and Karvey Stock
Broking Co.Ltd are charging less for various services offered to the investors
when compared with other depository participants. The service charges charged
by select depository participants for the services of security custody, equity
transaction sale and transaction statement are competitive. Among select the
depository participants, only PCS securities is charging to the extent of 170
rupees others are providing the accounting opening service for free of cost. IIFL is
charging to the extent of 750 rupees for account maintenance service where as the
remaining DP’s are charging 450 rupees only. In this regard, it is suggested to the
depository participants to offer services to the investors for reasonable /nominal
charges so that large number of investors are motivated and invest towards capital
market securities.
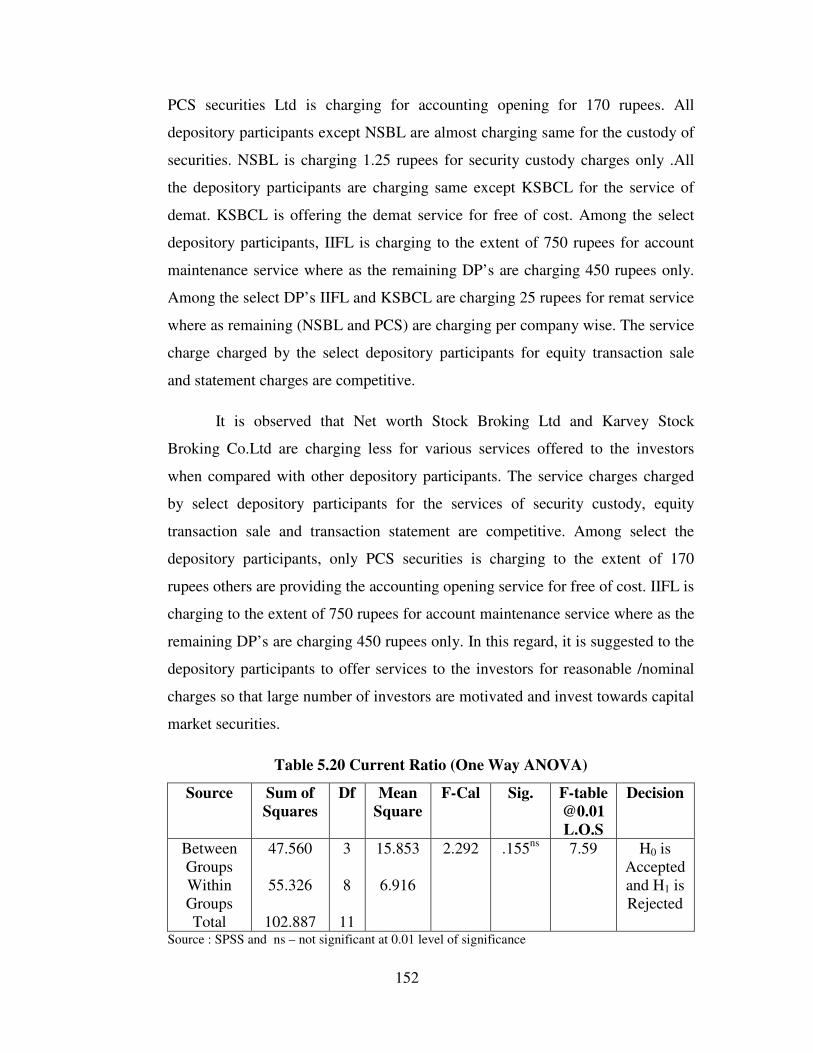
Table 5.20 Current Ratio (One Way ANOVA)
Source Sum of
Squares
Df Mean
Square
F-Cal Sig. F-table
@0.01
L.O.S
Decision
Between
Groups
Within
Groups
Total
47.560
55.326
102.887
3
8
11
15.853
6.916
2.292 .155ns
7.59 H0 is
Accepted
and H1 is
Rejected
Source : SPSS and ns – not significant at 0.01 level of significance

153
H0: Current Ratio (CR) position of KSBL, IIFL, PCS, and NSBL does not differ
significantly.
H1: Current Ratio (CR) position of KSBL, IIFL, PCS and NSBL differ
Significantly.
Current ratio is an important indicator of liquidity position. A current
ratio of 2:1 is considered as standard norm or ideal .The average current ratios of
IIFL, PCS, NSBL and KSBCL were 1.44, 2.24, 6.29 and 1.57 respectively. IIFL
and KSBCL liquidity position is not satisfactory and PCS and NSBL maintained
satisfactory liquidity position. To test whether there is significance difference in
the liquidity position of IIFL, PCS, NSBL and KSBL or not. The F-test / Anova is
conducted and result is given in the table 5.20. It reveals that F-cal (2.29) is less
than F-table (7.59) at 0.01 level of significance for degrees of freedom ʋ1=3 and
ʋ2 = 8. Alternative hypothesis (H1) is rejected and hence, H0 is accepted
.Therefore it is concluded that there is uniformity in the current ratio (CR) or
liquidity position of IIFL, PCS, NSBL and KSBCL or Current ratio position of
IIFL, PCS, NSBL and KSBCL does not differ significantly. All the depository
participants have to maintain standard norm level of liquidity so that they remain
competitive and can discharge their short term obligations effectively.
Table 5.21 Return on Assets (One Way ANOVA)
Source Sum of
Squares
Df Mean
Square
F-Cal Sig. F-table
@0.01
L.O.S
Decision
Between
Groups
Within
Groups
Total
72.780
170.342
243.122
3
8
11
24.260
21.293
1.139 .390ns
7.59 H0 is
Accepted
and H1 is
Rejected
Source : SPSS and ns – not significant at 0.01 level of significance
H0: There is no significant difference in the return on assets (ROA) of KSBL,IIFL,
PCS and NSBL.
H1: There is significant difference in the return on assets (ROA) of KSBL , IIFL,
PCS and NSBL.

154
The return on total assets (ROA) / return on investment (ROI), measures
the overall effectiveness of the management in generating profits with its
available assets. The return on assets (ROA) ratio of IIFL and PCS were in
fluctuating trend and the ROA ratio of NSBL and KSBCLs were in declining
trend during the study from 2009-12. The average return on Assets (ROA) of
IIFL, PCS, NSBL and KSBCL during the study were 1.44 %, 3.69. 8.2 % and 3.9
% respectively. All the depository participants have not earned satisfactory return
on assets (ROA) / ROI. To test whether there is significance difference in the
return on assets (ROA) of IIFL, PCS, NSBL and KSBL or not. The F-test / Anova
is conducted and result is given in the table 5.21. It reveals that F-cal (1.139) is
less than F-table (7.59) at 0.01 level of significance for degrees of freedom ʋ1=3
and ʋ2 = 8. Alternative hypothesis (H1) is rejected and hence, Ho is accepted
.Therefore it is concluded that there is no significant difference in the return on
assets (ROA) of IIFL, PCS, NSBL and KSBCL. It is suggested that all the
depository participants have to optimize the utilization of assets and operating
efficiency to achieve the satisfactory return on Assets (ROA) which satisfies the
shareholders of the company or enhances the market value of the company.
It can be concluded from the above that the depositories and select
depository participants (IIFL, NSBL, PCS and KSBCL) are providing wide range
of services. All are interested in knowing the financial performance of
depositories, CDSL and NSDL and depository participants of IIFL, PCS, NSBL
and KSBCL as earning returns from the services rendered is essential for survival
in the market. Operating Income to Total Income ratio helps to assess the
operational efficiency of the unit compare to total income of the depositories. It is
found that NSDL is performing well when compared with CDSL as mean ratio of
Other Income to TI (Total Income) is high and also CV is low. It is suggested to
CDSL to reduce its business risk and enhance its operating efficiency so that it
can achieve maximum Operating Income to Total Income ratio.
From the point of view of ratio of Other Income to Total Income earned,
it is observed that CDSL is not performing its operations well even though it has

155
high mean of OI /TI when compared with NSDL and more over NSDL has lesser
business risk than CDSL. From the point of view of Total expenses to Total
Income, it is found that CDSL is controlling its total expenses to total income
consistently and its trend is in decreasing from2008-12. The NSDL has high level
of Total expenses to Total income as its mean ratio is 70.14 and CV of 9.23. In
this regard, it is suggested to the NSDL to control its total expenses effectively so
that it can improve its consistency in total expenses to total income. It is found
that both the depositories have almost earned equally to the extent of 18 % of ROI
during the study from 2007-12 and more over CDSL has more consistency in ROI
when compared with NSDL. It is also proved statistically that two depositories
have same ROI. NSDL has high business risk due to fluctuating trend in ROI and
but its ROI is increased to 20.52 % in 2011-12 from 19.51 in 2010-11.
Depository Participants are rendering wide range of services to investing
community. It is necessary to understand the service charges charged by select
depository participants as it has impact on the performance of the firms. It is
observed that Networh Stock Broking Ltd and Karvey Stock Broking Co.Ltd are
charging less for various services offered to the investors when compared with
other depository participants. The service charges charged by select depository
participants for the services of security custody, equity transaction sale and
transaction statement are competitive. Among select the depository participants,
only PCS securities is charging to the extent of 170 rupees others are providing
the accounting opening service for free of cost. IIFL is charging to the extent of
750 rupees for account maintenance service where as the remaining DP’s are
charging 450 rupees only..The average current ratios of IIFL, PCS, NSBL and
KSBCL were 1.44, 2.24, 6.29 and 1.57 respectively. IIFL and KSBCL liquidity
position is not satisfactory and PCS and NSBL maintained satisfactory liquidity
position. When Anova / F-test is conducted to know whether there is significance
difference in liquidity position of selected depository participants or not?. From
result, it is concluded that the liquidity position of IIFL, PCS, NSBL and KSBCL
or Current ratio position of IIFL,PCS ,NSBL and KSBCL does not differ
significantly. All the depository participants have to maintain standard norm level
156
of liquidity so that they remain competitive and can discharge their short term
obligations effectively.
The return on total assets (ROA) / return on investment (ROI), measures
the overall effectiveness of the management in generating profits with its
available assets. The return on assets (ROA) ratio of IIFL and PCS were in
fluctuating trend and the ROA ratio of NSBL and KSBCLs were in declining
trend during the study from 2009-12. The average return on Assets (ROA) of
IIFL, PCS, NSBL and KSBCL during the study were 1.44 %, 3.69. 8.2 % and 3.9
% respectively. All the depository participants have not earned satisfactory return
on assets (ROA) / ROI. To test whether there is significance difference in the
return on assets (ROA) of IIFL, PCS, NSBL and KSBL or not. When F-test /
Anova is conducted .From the result , it is concluded that there is no significant
difference in the return on assets (ROA) of IIFL, PCS, NSBL and KSBCL. It is
suggested that all the depository participants have to optimize the utilization of
assets and operating efficiency to achieve the satisfactory return on Assets (ROA)
which satisfies the shareholders of the company or enhances the market value of
the company. From this it is clear that Net worth Stock Broking Company Ltd
has performed well when compared with other depository participants.


