CHAPTER V CHANGES IN MANAGERlAL...
58
CHAPTER V CHANGES IN MANAGERlAL PERFORMANCE Recent years have witnessed an unprecedented emphasis k i n g placed on profitability of' the Public Sector Enterprises while the Government is still committed to its long standing policy of allowing the Public Sector to achieve commanding heights in the economy. It has made it abundantly clear that the Public Sector Enterprises must generate surpluses so that the society could get a reasonable return on the investment made in these enterprises. Pressure is likely to mount further on the Public Sector Enterprises to increase their efficiency and capacity utilisation, reduce costs exercise better control over project expenditure and take other steps to ensure improvement in Management ~erformance'. Further, the criteria for measurement of Public Sector Performance has remained the bone of contention for a long time, mainly due to the fact that the diversity of forms and functions has come in the way of any common solution generally applicable to all cases2. Public Sector Enterprises survey has indicated some criteria of efficiency measurement in Public Sector Enterprises to that of efficiency in Resource Generation and Resource ~tilisations'. The Nun Sen Gupta Committee also ageed to '~huja, N.L., "Working Capital Holding the Promise to Public Sector Enterprises", lndian Management, March 1990,p.9. 'sumit K.Majumdar, "Public, Joint and Private Sector in Indian Industry- Evaluating Relative Performance Differences", Economic and Political Weekly, February 18-25, 1995. p.29. '~overnmentof India, Public Enternrises Survey, 1993-94, Vol.1, p. I0 I.
Transcript of CHAPTER V CHANGES IN MANAGERlAL...

CHAPTER V
CHANGES IN MANAGERlAL PERFORMANCE
Recent years have witnessed an unprecedented emphasis k ing placed
on profitability of' the Public Sector Enterprises while the Government is still
committed to its long standing policy of allowing the Public Sector to achieve
commanding heights in the economy. It has made it abundantly clear that the Public
Sector Enterprises must generate surpluses so that the society could get a
reasonable return on the investment made in these enterprises. Pressure is likely
to mount further on the Public Sector Enterprises to increase their efficiency and
capacity utilisation, reduce costs exercise better control over project expenditure and
take other steps to ensure improvement in Management ~erformance'. Further, the
criteria for measurement of Public Sector Performance has remained the bone of
contention for a long time, mainly due to the fact that the diversity of forms and
functions has come in the way of any common solution generally applicable to all
cases2. Public Sector Enterprises survey has indicated some criteria of efficiency
measurement in Public Sector Enterprises to that of efficiency in Resource
Generation and Resource ~tilisations'. The Nun Sen Gupta Committee also ageed to
'~huja , N.L., "Working Capital Holding the Promise to Public Sector Enterprises", lndian Management, March 1990,p.9.
'sumit K.Majumdar, "Public, Joint and Private Sector in Indian Industry- Evaluating Relative Performance Differences", Economic and Political Weekly, February 18-25, 1995. p.29.
'~overnment of India, Public Enternrises Survey, 1993-94, Vol.1, p. I0 I .

advocate the managerial performance criteria for management efficiency by making use
of working capltal management4.
Therefore, in this current Chapter an attempt is made to analyse in select
Public Sector Enterprises belonging to Heavy and Medium Engineering during 1975-76
and 1995-96. The Managerial Performance of selected Public Sector Enterprises
belonging to Heavy and Medium Engineering is evaluated on ratios based approach
as suggested by the International Labour Organisation (ILO). These ratios are
examined in this section.
Many studies have come out with certain results like profit
requirements, financial resources utilization, physical resources utilization, market
share innovat~on, productivity and quality, human resources, social responsibility
which could be the basis that the Public Sector Enterprises have to undertake to
deliver a specified level of performance (output, profit, growth and so on) in return to
the capital resources mobilised from the Government. It is generally believed that
the effectiveness of Public Sector Enterprises could be in terms of continuing long-term
g~owth of the corporation, contribution to national income and value added.
Further, a general corporate effectiveness is often measured by the surplus generated
and its relati~nsh~p ,U ihz net cap~tal employed in the corporation.
An International Labour Organisation's (ILO's) publication on
improving the Public Sector Enterprises performance has suggested certain broad
indices which can be worked out by constructing certain ratios from the financial
statements are as follows:
' b u n Sen Gupta, committee Remrt, p.75.

(1) General performance indices.
(2) Management performance.
(3) Financial performance.
(4) Investment performance.
(5) Cost break-down (input coefficient and physical performance).
Different ratios suggested for the measurement of the performance under
different categories wuld be examined as follows:
The above said indices have considered for measuring the managerial
performance of selected public sector enterprises belonging to Heavy and Medium
Engineering engaged in the present study. However, due to limitations on different
aspects of the data the study has considered only three aspects, namely, the General
performance, Management performance and Financial performance. The ratios
considered under each category are also limited to the extent of data available in various
financial statements published by Bureau of public Sector Enterprises in their Annual
Surveys. Broadly the indicators considered are as follows:
V.l GENERAL PERFORMANCE
In order to evaluate the General Performance of the selected Public
Sector Enterprises, the study has calculated three ratios as follows:
Operating Profit
Capital Employed
This ratio demonstrates number of times the capital has rooted in the
process of doing business. Also it shows a management's ability to use tirm assets
239

to generate earnings on its invested capital. Further, it measures productivity as well
as profitability. The profit being the result of all operation, the return on capital
expresses all efficiencies or inefficiencies of business collectively and thus is a
dependable measure for judging its overall efficiency or inefficiency. For this
purpose, the amount of operating profit is considered before making deduction on
interest and tax and the capital is the aggregate of all the capital at disposal of the
company.
The second ratio is calculated as
Sales
Capital Employed
This ratlo is likely to throw light on theeffective utilisation of
capital resources employed in generating the annual turnover. Again it indicates the
number of times an asset flows through a firm's operations and into sales
The third ratio is calculated as
Operating Profit
Sales
This ratio helps In determining the eficiency with which affairs of the
business are being managed. An increase in the ratio over the previous period
indicates improvement in the operational efficiency of the business provided the gross
profit ratio is constant. The d o is thus an effective measure to check the profitability
of a business. A constant increase in this ratio year after year is a definite indication of
improving conditions of the business. These ratios are presented in Tables V. 1.1 to
240

V.1.5 for Heavy Engineering enterprises and Tables V.2.1 to V.2.5 for Medium
Engineering enterprises for further analysis.
It can be seen from the Tables V. 1.1 to V. 1.5 that the ratio of operating
profit to capital employed of select Public Sector Enterprises belonging to Heavy
Engineering was not uniform during the study period. This ratio fluctuates behveen
0.12 times in the year 1979-80 and 0.33 times in the 1995-96. In HEC, this was
negative in 14 out of 21 years of the study period. This has happened due to
inadequate operating profit in HEC during the reference period. Similar trend was
registered in BSL and JCL during the study period. However, these units have
improved their operating profit during the fourth phase of the study. Next to BHEL, the
Operating Profit to Capital Employed ratio was positive in all the years except in 1978-
79 in case of BHPV during the period of study. It fluctuates between 0.05 times in
the year 1975-76 and 0.37 times in the year 1984-85. Under the unit-wise analysis, the
ratio was nearly consistent in BHEL and BHPV and inconsistent in HEC, BSL and
JCL during the reference period.
From the analysis, it may be inferred that BHEL and BHPV have had
normal operating profit to meet their business obligations during the study period. At
the same time, the ratio was negative in study units, namely, HEC, RSL and JCI.
which reflected poor operational performance of these units during the reference period.
Besides, it can be noticed from the table that operating profit to sales
turnover ratio in BHEL has ranged between 0.24 times in 1975-76 and 0.09 times in
1991-92 during the reference period This may be accounted from Ten rupees as profit
margin for every hundred rupees of sales made in BHEL in the said period. It is quite
surprising to note that similar trend was registered in case of BHPV during the
241

Table V.l.1
General Performance Ratios - BHEL
India
. - .- - - . . - . - -
1975-76
1976-77
1977-78
1978-79
1 1980-81 1 1981-82
1 1982-83
1983-84
1984-85
1985-86
1986-87
1987-88
1988-89
1989-90 1 1990-91 I
1991-92 ,
1 7 3 7 3 ' 86961
17965 1 89962
21398 ) 90867
20948 91772 I
89740
108252
30865 / 120224
31748 ' 171204
132472
153992
177044
199394
231830
270682
300740
323716
1992-93 47961 : 195454 1 1993-94 1 47091 201241
1994-95 46899 181687
1995-96 69525 210676
Average 24418 106521
Source: Computed using data compiled from Various lssues of Public Entemrises m, Bureau of Public Enterprises, Ministry of Industry. Government of
-31600 170065 1 333083
0.2454
0.2340
0.2581
0.3300
0.2142
352528
355368
409418
483346
204006
0.1998
0.1997
0.2355
0.2283
0.2775
0.2506
0.2567
0.2619
0.1858 I
1.9586 ! 00949 '
1.5233 0.1311 !
1.7117 I 1 0,1167 ,
1.8036
1.7659
2.2534
2.2943
1.7604
1.9484
2.1727
2.5834
2.5005
2.5015
0.1360 / 0.1325
0.1146
0.1438
0.1284
0.1209 i
0.1051 / 0.1074
0.1002
2.6708 . 0.0981 ,

Table V.1.2
General Performance Ratios - BEC
I - - -
Operating Profit
Capital Employed
Gross Sales Employed
IWI-92 1 - I Ins2 18222 1 24634 I -0.6065 1 1 3519 ! -0 4486.- ' 1992-93
1993-94
1994-95
1995-96
Average
Source: Computed using data compiled from Various Issues of Public Enternrises Survey, Bureau of Public Enterprises, Ministry of Industry, Government of India.
3.5709
4.3931
-1.6545
-0.8474
1.3750
0.0642
0.0183 1
-0.7352
-0.3567
-0.1990
-2861 ! 12487 I
44590 ' -0.2291
602
-18637
-8895
-269 1
32891
25348
24939
19030
7487
-15321
-29430
13103
0.0804
1.2164
0.3022
0.0039

Table V.1.3
General Performance Ratios - BHPV
Operating Capital Gross I I Profit / Employed ( Bles / --A
Profit to
- 2 3 L
- - .-
Employed
:: 1 I I831 1 28238 I 0.0687 1 2.3868 1 0.0288 1 1995-96 I Average 5775 10911 0.1294 1.6953 0.0764
I 1 .--1 I I I Source: Computed using data comp~led from Various Issues of Public Enternrises
m, Bureau of Public Enterprises, Ministry of Industry, Government of
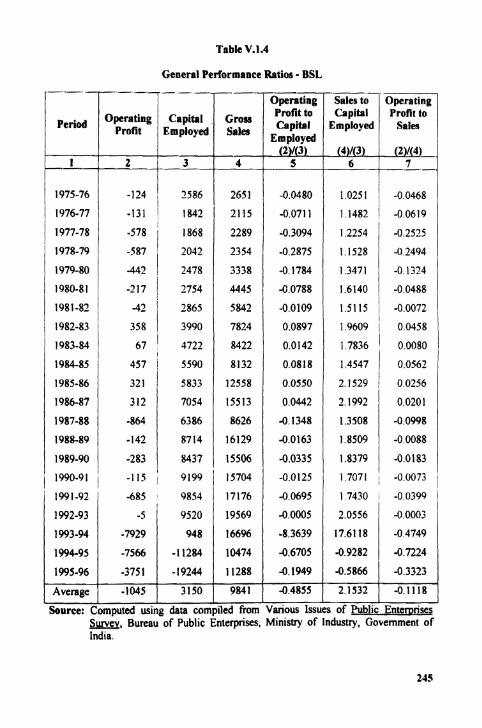
Table V.1.4
General Performance Ratios - BSL -~=t in~
Profit to capital
Employed (2)/(3)
5
1975-76
1976-77
1977-78
1978-79
1979-80
1980-8 1
1981-82
1982-83
1983-84
1984-85
1985-86
1986-87
1987-88
1988-89
1989-90
Sales t o Capital
~mp~oyetj
(4)/(3) 6
---
Profit to S ~ I H
7
I 2586 i -131 1 1842 I
1868
2042
-442 -s87 1 2478
-217 1 2754
4 2 1 2865
358 I 3990
67 ' 4722
457 5590
I 5833
312 3 2 1 j 7054
1990-91 1
2651
2115
2289
2354
3338
4445
5842
7824
8422
8132
12558
15113
8626
16129
15506
-864
-142
-283
m, Bureau of Public Enterprises, Ministry of Industry, Government of India.
-115 1 9199 / 15704
17176
19569
166%
10474
11288
9841
compiled from
6386
8714
8437
6.0480
-0.0711
-0.3094
-0.2875
4.1784
4.0788
-0.0109
0.0897
0.0142
0.0818
0.0550
0.0442
-0.1348
-0.0163
-0.0335
-0.0125
-0.0695
-0.0005
-8.3639
-0.6705
-0.1949
-0.4855
Various Issues
1991-92
1992-93
1993-94
1994-95
1995-96
Average
1.0251 / -0.0168
1 .14821 -0.0619
12254 / -0.2525
I 1528 -0 2494
1.3471 , -0.1324
1 . 6 1 4 0 -00488
1.51 15 -0.0072 I
1.9609 ( 0.0458 ; 1.7836
1.4547 / O.OS62
2.1529 1 0.0256
21992
1.3508
1.8509
1.8379
Surce: Computed using data
/ 1.7071 i -0.0073 1
1 7430 : -0.0399 1 -685 , 9854
-5 1 9520
00201
-0.0998
-0.0088
-0.0183
2.0556
17.61 18
-0.9282
-0.5866
2.1532
-7929
-7566
-3751
-1 045
4.0003
-0.4749
-0.7224
-0.3323
-0.1 118
948
-1 1284
-19244
3150
of Public Enternrises

Table V.1.S
General Performance Ratios - JCL
/ Period Operating Profit
Capital Employed
Gross Salw
- - .- Operating Profit to Capital
Employed (2)/(3)
5
- -. - -
India.
Sales to
1 1983-84
1984-85
1985-86
1986-87
1987-88
1988-89
1989-90
Operating Capital Profit to
Employed Sales
21 / 5557
187 1 5615
1990-91 1 616 I 8040 00766 I 5437 00496 1 1 I ' 1991-92 ' 123 I 00495 I I I764 , 0 0421
1992-93
5728
6075
6085
6392
7869
9261
12626
202
326
340
555
654
5785
6339
6491
7009
8013
1993-94
1994-95
1995-96
Average
00038
00333
0 0349
00514
0 0524
0 0792
00816
Source: Computed using data comp~led from Vanous Issues of Publ~c Entemnses m, Bureau of Publrc Enterprises, M~n~stry of Industry. Government of
6316
5068
8130
6497
-9796
-2055
-2936
-571
1 0308
10819
1 05 19
1 0084
l 2123
1 3213
15757
3 2939
02475
02067
0 1953
-2974
-8303
-14205
3972
00037 1
0 0332 , 00510 1 0 0432 I 0 0599
00518
-2 1237
-06104 1
-0 5723
0 7301
-1 5510
-04055
-0 3611
4 I005

period of study. A further examination of the Table reveals the operating profit to sales
turnover ratio showed negative trend in the case of HEC, BSL and JCL during the
reference period. It may be noticed from the foregoing analysis that these units have
no sufficient sales in resultant which affected profitability of these sample units during
the study period. Hence, BHEL and BHPV are progressing in the right direction
while comparing to other sample units during the reference period.
As such, a further investigation about the trend of say& should be
carried for the better operating profit margin position of these sample units. For this
purpose operating profit to sales turnover ratio is employed. This ratio varied from 0.24
times in 1975-76 to 0.094 times in 1991-92 in case of BHEL. However, this ratio was
negative in 17 years out of 21 years of the study in case of HEC. Similar trend was
registered in BSL and JCL. It indicates that the sales was inadequate in these units
during the period of the study. But, at the same time, the ratio was positive in all the
years except in 1993-94 and 1994-95 during the study period.
It can be concluded from the foregoing analysis that General
performance was not satisfactory in all sample units belonging to Heavy Engineering
Enterprises during the study period. However, among the sample units, BHEL and
RHPV have had satisfactory performance as compared to other study un~ts during the
reference period.
The General performance ratios of select sample units belonging to
Medium Engineering Enterprises have been presented in Tables from V.2.1 to V.2.5. It
can be seen from the tables that The operating profit to Capital employed ratio was less
than one time in BEL during the study period. But, this ratio turned as negative for 4
years in BDL, 2 years in HMT, and one year each in HCL and ITIL respectively over
247

the 21 years of the study period. It shows that BEL has earned profit continuously as
compared to other sample units during the reference period.
In the unitwise analysis, HCL and ITlL have had operating surplus in all
years except in 1995-96 during the reference pericd. In case of BDL, the operating
profit was meagre during the first phase and it incurred loss during the second phase of
the study period. However, BDL has been improved its operating profit in the
subsequent phases of the study. This might have occurred due to the influence and
attitudes of the Government towards Public Sector Enterprises since the
introduction of liberalisation policies. Further, it can be found out from the Table that
Operating profit was positive in HMT except in the years 1993-94 and 1994-95 during
the study period.
While the examination of the tables that provided sales to capital
employed ratlo was more than one time in case of BEL, HMT and HCL during the
reference period. It indicates that capital has been utilised prudently for generating
adequate sales in the respective sample units during the study period. The analysis
further substantiates that there was fluctuation on ratio in BDL and ITIL over the period
of the study.
It emphasises that sales was inconsistent in BDL and ITIL during swdy
period which m~ght have happened on account of poor management and changing
policies of the government.
On careful examination of the data available in the tables, the operating
surplus to sales ratio was similar as operating profit to capital employed ratio during
the study period. The ratio indcates that profit margin was meagre in all sample units

Table V.2.1
General Performance Ratios - BEL,
I"- Operating Sales to Operating Profit to Capital Profit to Operating Clpibl Employed &Ies Sales Eeployd (2)/(3) (4)/(3)- , - -(2)/(4)
5 -.G - 7
I
I
Average 1 5081 1 24032 / 38886 i 0.2214 1 1 . 4 5 1 6 1 0 1 6 2 0 I I I I I I
Source: Computed using data compiled from Various Issues of Public Enternrises m, Bureau of Public Enterprises, Ministry of Industry, Government of India.

Table V.2.2
General Performance Ratios - BDI,
India
1975-76 10 I 330 I I3
405
471
692
550
228
483
324
355
146
684
3362
3445
4264
5240
8930
110258
392
464
502
1976-77 1
0 2572
0 0836
01590 \ 0 1414 / 01469 I
-00176
Enterunses
I 00303 / 1 2273 I 00247 ,
1977-78
1978-79
m, Bureau of Publlc Enterprises, Ministry of Industry, Government of
146
93
1979-80
I
00276
02110
0 1691 1
0 2193
-0 1781
-0 3364
-0 8169
-1 8288
0 2222
0 2403
01974
0 1522 I
0 0950
0 2885
( 01543
538
00332 / 12015
Source: Computed usmy data compiled from Vanous lssues of Publ~c
0 1300
00440
00985
0 1698
01910
-00536 1 2
1991-92 I 3234
03147
0 1853
0 0929
-0 1972
0 5054
0 5271
06194
12011
13001
10056
24885
21296
20124
14982
15627
7366
1992-93
1993-94
1994-95
1995-96
Average
14914
10956
0 4238
1 1078 1980-81 ' -86 I 436 I
1981-82 1 -109 j 617
1982-83 1 -290 ' 626
12576
11226
12465
17995
20317
5448
938
1982
2544
2984
866
1983-84
1984-85
1985-86
1986-87
1987-88
I -0 1767 I 0 5251
-04633
-3 1412
0 2349
0 5747
03164
0 1316
00576
-267 85
647
808 I S 2 1406
0 5671
17176
1 0572
2 3912
16031
0 8644
0 6060
680
649 I 1988-89
0 1727 1 0 5986
1 00751 1 04868
2149
4933
8647
1989-90 / 2 1 14918 I
1990-91 / 1583 1 21074

Table V.23
General Performance Ratios - AMTL
Period Operating Capital 1 r o t 1 Employ4
1995-96 46143
Average 34080 - Source: Computed using data con m. Bureau of Public
India.
. Operating Sales . . . to Operating
Grosls Profit to Capital Profit to Capital Employed Sales
Elnoloved
-J d a r i o u s lssues of Publii Enternrises nterprises, Ministry of Industry, Government of

General Performance Ratios - HCL
- 3 1 3 2 0 0 5 9 0.5010 -0.01171 1 5 - 9 6
Average 2375 21335 24669 0.1348 1.2066 0.1072 -2-
Source: Computed using data compiled from Various Issues of Public Enternrises m, Bureau of Public Enterprises, Ministry of Industry, Government of India.
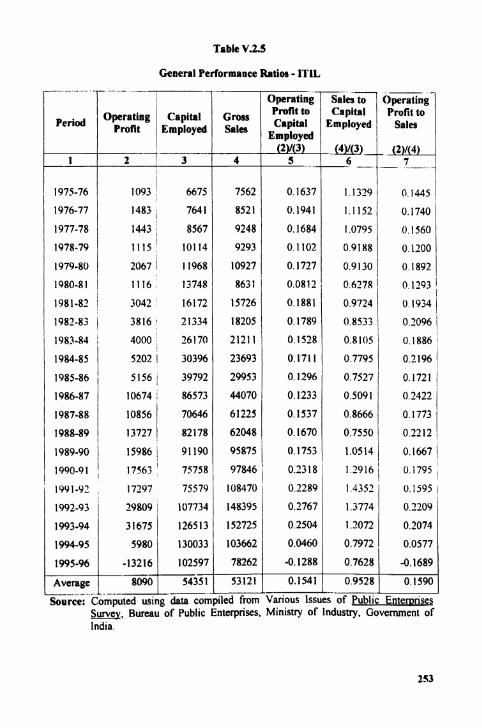
Table V.2.5
General Performance Ratios - lTIL
Period Operating Capital 1 1 ..rn Employed 1 Gross Sales
o p e r a t i n g r - i i l (lag- 1 Profit to Capital Profit to Capital Employed Sales
Emoloved
1992-93 29809 107734 148395 0 2767 13774 0 2209
1993-94 31675 1 126513 152725 0 2504 l 7072 0 2074
1994-95 130033 103662 00460 0.7972 0 0577
1995-96 -0.1288 0 7628 -0 1689
54351 53121 Average 0.1541 09528 01590 - --
Source: Computed using data complled from Vanous Issues of Publlc Entemnses m, Bureau of Publ~c Enterprises, Mln1stl-y of Industry, Government of lnd~a

during the initial years of the study but it found negative during the second phase in
BDL, fourth phase in HMT, HCL and ITIL respectively over the period of study.
However, it is worth mentioning that the ratio of BEL was positive and
consistent in all the years and on an average was 22 per cent during the period of study.
Hence, BEL is placed in a better position than other units like BDL, HCL, HMT and
ITIL during the reference period.
From the foregoing exposition, it can therefore be concluded that the
analysis of general performance of ratios was setisfactory in BEL during the study
period among the selected units of Medium Engineering Enterprises.
V.2 MANAGEMENT PERFORMANCE RATIOS
Management performance of select Public Sector Enterprises
belongng to Heavy and Med~um Engineering has been evaluated through ratios as
identified by International Labour Organisation (ILO). The computation of
Management ratios and their significance are given in the following paragraphs.

hdcx Index Measures
Operating Surplus -------*--------.
Total Assets
Cost of Sales
Stock
Gross Value Added ....................... Fixed Assets
Gross Value Added
Total Assets
Gross Value Added ------------*----------
Labour Cost
Sales -----*---------
Labour Cost
Fixed Assets
Labour Cost
Pre Tax Surplus ------------------- Labour Cost
Sales Less Material ---- Total Wages and Salaries
It is calculated to know the productivity of the total assets that are available to management.
This ratio is deemed to reflect the efficiency of lnventory Management. It further explains whether investment in inventories is within proper limit or not. Usually inventory should not exceed 2 4 months consumption of the year.
This ratio is calculated to measure the productivity of capital in terms of gross value added. Also it indicates nature of capital intensive in an organisation.
It is computed to measure the productivity of total assets in generating value added.
It is a measure of productivity of labour in generating d u e added.
This ratio is calculated to measure the labour productivity per employee in terms in sales.
This ratio indicates the relationship between Fixed Assets and Labour Cost. It also explains whether capital is intensive or not.
This ratio is computed to know the proportion between profit and Labour Cost. Further, it explains profit per employee dunng operating of an organisation.
This ratio is computed to know the value added per every hundred ruptes wages and salaries paid

The Management Perfonname ratios of select Public Sector Enterprises
belonging to Heavy Engineering are presented in Tables V.3.l to V.3.5.
It can be seen from the tables that the Operating Surplus to Total Assets
ratio of BHEL has shown fluctuating trend between 24 per cent in 1975-76 and 7 per
cent in 1994-95. This ratio was negative in many years in HEC, BSL and JCL during
the study period. However, this ratio was positive in all the years except in the year
1978-79 in case of BHPV and on an average of this ratio was 5 per cent during the
study period. The analysis shows that Operating profit to Total Asset ratio of BHEL is
better than that of HEC, BSL, BHPV and JCL.
From Table V.3.1, it is evident that the cost of sales to stock tumover
ratio in BHEL was significant which had been fluctuating between 8.37 times in 1975-
76 and 1.05 times In 1987-88. Over the period, it also evidences decreasing trend.
On an average, the ratio has turned over 2.44 times during the period. This shows that
sufficient and satisfactory business activities in BHEL during the study period.
In HEC also the cost of sales to stock turnover ratio is fluctuating
between 0.51 time in 1976-77 and 2.56 times in 1995-96. On an average this ratio has a
turnover of 1.10 times duriitg this period of study. This ratio is less than that of BHEL.
Evidently, similar trend was registered in case of BHPV, BSL and JCL
and on an average this ratio was 1.89 times, 3.09 times and 1.78 times of the
res-ve units during the study period. From this analysis, it may be inferred that
the movement of inventories was fast in BHEL while comparing to other study units
during the study period.
The data available from the tables, it is evident that the Gross Value
Added to Fixed Assets ratio was consistent in B m L but it was inconsistent in other
256

sample units during the study period On an average, this was 2.15 times in BHEL,
0.34 times in HEC, 0.97 times in BHPV, 0.95 times in BSL and 0.71 times in JCL
respectively during the study period. This indicates that the Fixed Assets have been
utilised satisfactorily for building up Gross Value Added in BHEL while comparing to
other sample units belonging to Heavy Engineering group. Next to BHEL, BHPV's
position was good during reference pmod.
Further, as exhibited in tables, Gross Value Added to Total Fixed Assets
ratios of sample units were fluctuating during the study period. On an average the
ratio was 0.51 times in BHEL, 0.18 times in HEC, 0.28 times in BHPV, 0.32 times in
BSL and 0.24 times in JCL during the reference period. This indicates that the Gross
Value Added has been showing real growth by proper utilisation of Total Assets only
upto 199 1-92 in all study units except in BHPV. As it is apparent that even when there
occurred positive real growth in 1990s, it was much lower than in 1980s, thus revealing
an investment slowdown in study units during liberalisation. However, 1994-95 and
1995-96 witnessed a positive real growth of Value Added as during 1980s in case of
BHPV during the reference period. This study results is coincided with the result of
Romeshan's study on Public Sector Enterprises through reforms?
Tables reveal the ratio of Gross Value Added to Labour Cost to its
utilisation as assuming one of the indicators to measure the performance of the study
units. It can be found out from the tables that the ratio was more consistent and more
than 2 times over the study period in case of BHEL and BHPV. At the same time, the
ratio was more than one from 1975-76 t~ 1993-94 but it declined to less than during
1994-95 and 1995-96 in the study units, namely, HEC,BSL and JCL during the reference
hmeshan, P., "Public ~nterprises Through Reforms - A Financial Ratios Analysis", Pmductivity, Vo1.38, No.2, July-September 1997, pp.264-275.

period This reflects that the Labour productivity is good in terms of Value Added in
the sample units like BHEL and BHPV. However, Labour productivity is satisfactory
in relation to Value Added in case of HEC, BSL and JCL.
As regards to Sales to Labour Cost ratio, it is found to be fluctuated in
all study units during the reference period. On an average of the ratio is 6.94 times in
BHEL, 3.1 1 times in HEC, 6.94 times in BHPV, 2.76 times in BSL and 2.99 times in
JCL during the study period. It states that the Labour Productivity is highly intensive in
terms of Sales in BHEL and BHPV as compared to other units over the period of the
study.
It is evident from the Table V.3.1, which depicts that Fixed Assets to
Labour Cost ratio has ranged between 0.85 times in 1982-83 and 1.79 times 1995-96 in
BHEL. This ratio has been varied in year after year in the sample units and on an
average of this ratio was 5.23 times in HEC (Table V.3.2), 3.82 times in BHPV (Table
V.3.3). 1.86 times in BSL (Table V.3.4) and 1.83 times in JCL (Table V.3.5) during the
study period. It indicates that the fixed assets to Labour Cost ratio is similar as to the
Total Asset to Labour Cost ratio, while the rste of Productivity was relatively small.
Interpreting this ratio, the Productivity of the invested Fixed Asset of the sample units
has come down year after year even during 1990 and some symptoms of
improvements appeared during the fourth phase in BHEL and HEC during the period
under study.
It can also be observed from the tables that Pretax Surplus to Labour
Cost ratio is not quite satisfactory in all study units. However, this ratio was
positive and consistent in case of BHEL but it was negative for many years in HEC,
BSL and JCL during the study period. In BHPV, this ratio was positive in all the years
of the study except 1978-79. It represents that the growth rate of the Pre-tax Profit in
258

terms of Labour Cost of the BHEL and BHPV is successively higher since 1991-92. It
reached a magnificent level in 1994-95 and 1995-96. But this ratio can be found an
uninspiring one since '991-92 in case of WC, BSL and JCL during the study period.
This might had happened on account of economic liberalisation and Public Sector
Enterprises reforms.
Finally, Sales Less Material Cost to Labour Cost ratio indicates that
the ratio 'nas been widely fluctuating in BHEL and BHPV but it mildly varied year
after year in case of HEC, BSL and JCL over the period of the study. On an average,
this ratio was 2.18 times in BHEL, 1.34 times in HEC, 1.22 times in BHPV, 1.64 times
in BSL and 1.30 times in JCL during the study period Looking at the analysis, it may
be inferred that the Labour Productivity in terns of Sales i s highly intensive in BHEL
and BHPV as compared to other study units during the period under study. However,
Sales in proportion to Employees shows higher ratio in the initial years of the study
and did not rise even under the liberalised conditions of the 1990s. Rather, it declined
noticeably during this period. As a matter of fact, the raw-material was also
proportionately stable during this period This stagnation has occurred in the study
units during 1990s due to the influence of Public Sector refonns and economic
liberalisation pursued by the Government.
From the foregoing analysis, the management performance of select
Public Sector Enterpnises belonging to Heavy Engineering was measured through
different ratios. The analysis revealed that the positive changes and noticeable in
sample uaib like BHEL and BHPV in this study. Hence, it can be concluded that
management performance of BHEL and &V wa.. comparatively good among the
sample units over the period of the study.


Tab
le V
.3.2
Man
agem
ent P
erfo
rman
ce R
atio
s -
HE
C
Per
iod
opm
fjw
Su
rplu
s to
T
otal
h
se
h
0.0426
0.0490
-0.0578
-0.03 10
-0.0480
' -0.0889
-0.1049
4.0914
-0 0798
-0.0492
-0 0068
0.1011
0.0575
1
-0.0131
i -0.0817
-0.1657
-0.051 5
OOlll
1 -0
.406
7
Co
st o
f S
ale
to
Sto
ck
-0.1973
1- 2.5641
-0.0598
i 1.1017
Sou
rce:
Bureau of Public E
nter
pris
es,
Fix
ed
To
tal
-E+w
lic
Ent
eror
ises S
urve
y, M
ini
Gro
ss
Add
ed t
o L
abo
ur
Labour
Cost
2.6356
2.4%8
0.8470
1 2.5341
1 3.1057
1.5885
1 3.1178
1 5.2330
ry of
Indu
stry
, Gov
ernm
ent o
f Ind
ia, New
Pre
Tax
S
urp
lm to
L
ab
ou
r C
ost
Del
hi Vol. I
.

Tab
le V
.33
Man
agem
ent P
erfo
rman
ce R
atio
s - BH
PV
1995-96
1 0.0209
j .- 3.3720
Ave
rage
1
0.M63
1 1.8948
So
um
: Bureau of Public E
nter
pris
es, P
Gro
ss
Val
ue
Flrc
d V
alue
Sa
les
to
to
, A
dded
to
; L
abou
r , L
abou
r ~
ixe
d
TOW
I i
Lab
our
i c
os
t !
- .
--
~
..
-
1.7045
1 0.3072 1
2.8059
1 6.4140
1 1.
6461
0.9708
1 0.2799
1 3.1635
1 6.9402 i
3.8257
lic
Ent
aori
ses S
UIV y, M
inis
try
of Indusuy, G
over
nmen
t of
Indi
a, N
ew
Prr
Tax
S
urp
lus
to
Lab
our
Cost
0.0434


The Management Performance ratios of select Public Sector Enterpriws
belonging to Medium Engineering are given in Tables V.4.1 to V.4.5 for further
examination.
The data presented in the tables provide that Operating Surplus to Total
Asset ratio is varied between 0.25 times in 1981-82 and 0.05 times in 1995-96.
However, it is positive throughout the study period. But, at the same time, the ratio
was negative for three years in BDL, for two years in HMT' and one year in HCL and
ITI1, respectively during the study period. It indicates that the sample units have not
generated adequate Operating Profit by using their Total Assets available during the
study pericd. Further, it reflects that the Productivity is not commendable in the study
units during the reference period. On the other hand, the ratio was positive and showed
improvement during 1990s in BEL while comparing to other study units during the
reference period.
It is evident from the Table V.4.1 that the Cost of Sales to Stock
Turnover ratio in BEL has shown raising trend from 0.60 times in 1975-76 to 2.37
times in 1995-96. It implies good inventory management and sufficient business
activities d:!ring thc study period.
It is sign~ficant to note that this has been fluctuating widely in other
study units, namely, BDL (Table V.4.2), HMT (Table V.4.3), HCL (Table V.4.4) and
ITIL (Table V.4.5) during the reference period. On an average of the ratio was 1.40
times in BDL, 1.88 times in HMT, 2.69 times in HCL and 1.65 times in ITIL during
the period of study. This explains that the inventory management was sat~sfactory
in all study units. At the same time, higher ratio in HCL reflects effic~ent business
activities during the study period. A low ratio is noticed in BDL which is an Indicator
265

of excessive inventory and over investment in inventory during the reference period.
Hence, the inventory management was good in BEL and HCL as compared to other
units during the period under study.
The tables also show the Gross Value Added to Fixed Asset ratio for
select sample units belonging to Medium Engineering enterprises. Considering
the relationship between Gross Value Added and Fixed Assets in each year, as a
specific lcvel of operation of the study units, reveals that thc ratici was positi\,e and
consistent in HEL and HMT during the study period. In BDL, this ratio was negative
during 1984-85 but there was an improvement during 1990s. It implies that Gross
Value Added has not been built adequately by employing Fixed Assets in the study
units. Further. it can be seen from the data presented in the Table that an average of the
ratio was 0.44 times in HCL and 0.96 times ITlL during the study period. From the
analysis, it is noticed that the ratio was less than one in most of the years of the
sample unlts. It ~nd~cates the excessive investment on Fixed Assets in the study units
and they do not build up Gross Value Added proportionately during the study period.
Evidently, similar trend was found on Gross Value Added to Total Asset
Ratio of all sample units during the study period. It is necessary to note that this ratio
i s less than one in all select units during the reference pcriod This indicates that
Total Assets were excessive in all samplc units and they did not build adequate Value
Added in sample units over the period of the study. Hence, the Productivity is low in
study units. However, performance was satisfactory dunng 1980s in all sample units
while comparing their performance during 1990s. Moreover, economic
liberalisat~on and Public Sector refoms do not influence on performance to these
units during the study period.

It can be observed from the tables that Gross Value Added to Labour Cost
ratio has been fluctuated in all study units. This ratio is calculated to measure the
Labour Productivity of the sample units. On an average the ratio was 2.25 times in
BEL, 1.83 times in BDL, 2.21 times in HMT, 4.75 times in HCL and 2.29 times in ITIL
during the study period. It implies that the Labour Productivity is high in HCL among
the study units during the study period.
I t is seen from the tables that the Sales to Labour Cost ratlo is found to
be fluctuating substantially over the various phases of the study in all sample units.
This ratio establishes the relationship between Sales and Labour Cost. Also, it measures
the Labour Productivity of a firm in terms of Sales hence it is useful to judge the
performance of Management. On an average the ratio was 4.20, 4.59,4.44, 12.56, 3.16
ilmes In BEL. (Table V.4.11, RDL (Table V.4.2). HMT (Table V.4.3). HCI, (Table
V.4.4) and ITII. (Table V.4.5) respectively during the study period. This indicates
that the Labour Product~vity is very intensive in terms of Sales in HCL among the study
units during the reference period. However, it is noticed that the Labour Productivity
IS at the appreciable level in other study units over the period of the stud!
The tables also present the Fixed Assets to 1.abour Cost ratio of the
sample units during the study period. It may be noted that this ratio found to be
fluctuated in sample units like BEL, BDL and HCL over the period of the study. At
the same time, the ratio declined from 5.75 times in 1975-76 to 1.59 times In 1995-96
in case of HMT. It is quite contrast to other sample units, the ratio of ITIL has raised
from 1.13 times in 1975-76 to 2.63 times in 199: -96 during tlie reference period.
However, the average of this ratio for the sample units over their period of 21 years of
the study was 3.23 times in BEL 5.84 times in BDL, 3.19 times in HMT, 8.33 times

in HCL and 5.52 times in ITJL respectively during the study period It indicates that
the Labour Productivity was high in HCL which reflected heavy investment made on
Fixed Assets during the reference period. Over the period of the study, the Labour
Productivity in terms of Fixed Assets was relatively good in the sample units,
namely, BEL, BDL and HMT. Further, the low ratio of ITIL indicates that higher
Labow Cost involved in operation due to surplus employees in the study unit. From
the foregoing analysis, it can be concluded that the Labour Productivity in terms of
Fixed Assets was good in BEL, BDL and HMT during the study period.
It can be seen from the tables that the ratio of Operating Profit to
Employees has shown improvement fiom 0.05 times in 1975-76 to 0.72 times in 1993-
94 in BEL but it declined during the years 1994-95 and 1995-96. Looking at the data
available in the Table, it may be noted that in BDL the ratio was insignificant during the
late 1970s but it turned as negative in early 1980s. Subsequently, the ratio has shown
in raising trend during 1990s in the study unit.
In HMT, the ratio varied between 0.06 times in 1975-76 and 0.25
times in 1992-93. AAenvards it tumednegative during the years 1993-94 and 1994-
95 over the period of the study. It is necessary to note that t h~s ratio was positive in
HCL during the entire period of study except in the year 1995-96. The same trend was
in case of ITlL during the study period. From the above given exposition, it may
be i n f t r d that the Operating Profit to Employees ratio was positive only in BEL for
the entire period of the study. Hence, BEL has earned profit adequately over the
period of the study as compared to other sample units.
From the data available in Tables V.4.1 to V.4.5, it demonstmtes
that Sales minus Material Cost to Labour Cost ratio has been fluctuating in all sample

units during the period of the study. However, the ratio was sigaificant snd positive
during 1990s in all sample units except in BDL. It explains the Labour Productivity in
terms of Sales is good in all sample units except BDL during 1990s of this study.
On an average, the ratio was 2.20 times in BEL, 1.71 times in BDL,
2.05 times in HMT, 5.23 times in HCL and 2.35 times in TTIL during the period the
study. This indicate that the Labour Productivity in terms of Net Sales is more
intensive in HCL and ITIL among the study units over the period of the study. At the
same time, BDL has no adequate Sales during 1979-80 and 1984-8s hence this unit is
not having consistent Sales during the reference period.
From the foregoing analysis, the Management Performance of select
Public Sector Enterprises belonging to Medium Engineering was evaluated through
various ratios as suggested by the International Labour Organisation (LO). The
results of various ratios pertaining to sample units, disclose that all the ratios are
mostly favourable to the only sample unit namely BEL during the study. Next to the
BEL, the results are good to HCL during the reference period Therefore, it can be
concluded that the Management Performance of BEL and HEC was comparatively good
among the sample units during the reference period.
Further, the Management Performance of select Heavy Engineering
units compared against the performance of select Medium Engineering units during the
study period. The results of the study reveals that the performance of Medium
Engineering units was better than that of Heavy Engineering units over the period of
2 1 years of the study.

Tab
le V
.4.1
Mrn
agem
ent
Per
form
ance
Rat
ios - B
EL
Per
iod
1975
-76
1976
-77
1977
-78
1978
-79
1979
-80
1980
-81
3981
-82
1982
-83
1983
-84
1984
-85
1985
-86
1986
-87
1987
-88
1988
-89
1989
-90
1990
-91
1991
-92
1992
-93
1993
-94
Ope
mtln
g 1
Surp
ler
to
/ T
otal
I
Asa
ets
0.08
42
0.09
75
0.07
13
0.06
91
' 0.
2570
0.
1287
0.
1092
.
0.09
60
0.06
39
0.07
63
I
0.06
41
0.08
50
0.11
13
0.09
44
0.09
68
Add
ed to
0.73
06
0.71
65
0.72
38
0.65
34
0.50
46
0.96
%
1.04
84
1.01
85
0.89
78
0.71
83
0.67
40
0.65
6 1
0.62
73
0.68
92
0.64
78
0.62
52
0.66
84
0.64
43
Gro
ss
Val
ue
Add
ed t
o T
otal
A
sset
a 0.
3003
0.
3007
0.
2868
0.
3066
0.
26%
0.
1%2
0.39
90
0.44
62
0.36
35
0.35
74
0.32
98
0.27
72
0.25
08
0.23
43
0.24
17
0.27
45
0.27
64
0.25
90
0.24
84
--
Gm
r
Val
ue
Add
ed t
o L
abou
r C
ost
2.
7386
2.
5662
2.
2Oll
f ,
9357
1.
8058
1.
6770
2.
6019
2.
5889
2.
4988
1.
4942
2.
4704
2.
5950
2.
6586
2.
2845
2.
4833
2.
43 1
4 2.
2237
2.
2503
2.
3850
Sal
es to
L
abou
r C
ost
4.23
98
4.15
23
3.93
65
3.29
29
3.40
37
3.10
83
4.11
01
3.70
04
3.27
78
3.48
75
3.73
08
4.46
76
5.07
41
4.97
52
5.45
83
5.77
80
5.42
68
4.90
90
5.41
51
... . ..
-. -
~
I -~
-
..
-
..
1995
-96
1 0.
0467
1
2.37
18
1 0.
6818
1
0.29
78
1 1.
7165
1
4.09
72
! 2.
5177
1
0.3%
3 1
1.88
73
Avc
m t
0.09
02
1.23
70
0.72
43
0.29
44
2.25
41
4.29
93
3.23
47
0.27
64
2.20
32
Sau
negB
ur!a
u of
Pub
lic E
lit~
rise
s, PU
bL E
ntem
rise
/Sur
rcr,
~
iniJ
Ly
of
tmiu
stry
! ~o
vm
en
t
bfh
dia
, N
ew Li VO
I. I


Tab
le V.4.5
Man
agem
ent
Per
form
ance
Rat
ios - IT
lL
Gro
ss
Cro
ss
i G
ross
V
alue
v
alu
e v
alu
e A
dded
lo
Add
ed t
o I
Add
ed t
o 1
i Tota
l I
Lab
our
Per
iod
opc=
tin
g S
urp
lm to
'O
ut of
T
otnl
S
ales
to
Ass
ets
Stoc
k 1
Ass
ets
1 A
sset
s 1.
5466
!
0.43
66
1.43
%
1 0.
4504
1995
-96
1 -0
.082
9 /
2.19
77
1 0.
3722
[
0.16
29
1 0.
9790
1
2.95
18
1 2.
6303
1
-0.5
979
Ave
rage
1
0.09
28
1 1.
6543
1
0.95
62
j 0.
3215
1
2.29
18
1 4
.20
Wi
2.52
11
( 0.
2611
S
oure
e: Bureau
of P
ublic
Ent
erpr
ises
, Pub
lic E
nter
nris
es S
urve
y, M
inis
try
of I
ndus
try,
Gov
enun
ent o
f In
dia,
New D
elhi
, Vol
. 1.
to
Lab
our
Cos
t 1.
7534
1.
8877
s.kr
Le3
s M
ater
id to
To
w
Wag
es &
S
alar
ies
2.01
53
2.01
12
Fix
ed
Ass
ets
to
Lab
our
Pre
Tax
Su
rplu
s to
L
abo
ur
Cos
t I
Cos
t C
ost
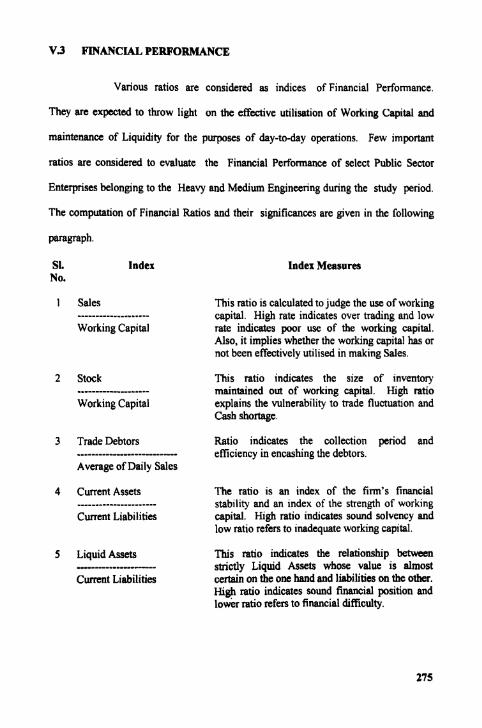
V.3 FINANCIAL PERFORMANCE
Various ratios are considered as indices of Financial Performance.
They are expected to throw light on the effective utilisation of Working Capital and
maintenance of Liquidity for the purposes of day-to-day operations. Few important
ratios are considered to evaluate the Financial Performance of select Public Sector
Enterprises belonging to the Heavy and Medium Engineering during the study period.
The computation of Financial Ratios and their significances are given in the following
SI. Index No.
Lndex Measures
1 Sales This ratio is calculated to judge the use of working capital. High rate indicates over trading and low
Working Capital rate indicates poor use of the working capital. Also, it implies whether the working capital has or not been effectively utilised in making Sales.
2 Stock .................... Working Capital
3 Trade Debtors
Average of Daily Sales
4 Current Assets -------------------*--
Current Liabilities
5 Liquid Assets -------------------- Current Liabilities
This ratio indicates the size of inventory maintained out of working capital. High ratio explains the vulnerability to trade fluctuation and Cash shortage.
Ratio indicates the collection period and efficiency in encashing the debtors.
The ratio is an index of the firm's financial stability and an index of the strength of working capital. High ratio indicates sound solvency and low ratio refers to inadequate working capital.
This ratio indicates the relationship between strictly Liquid Assets whose value is almost certain on the one hand and liabilities on the other. High ratio indicates sound financial position and lo& ratio refers to financial diWculty.

6 Contribution --
Operating Profit
7 Long Term loan ---------------------------**
Paid up Capital, Reserve And Long Term loan
8 Fixed Assets -------------------- Capital Employed
9 Inventory
Average Weekly Sales
10 Sales
Capital Employed
11 Gross Profit
Sales
12 Pre-tax Surplus ----------------- Sales
This ratio implies relationship between contribution and operating profit and also it indirectly refers to the relation between Operating Profit and Sales.
It indicates the level of business finance excessive reliance on borrowing money.
This ratio indicates the proportion of Total Finance available invested in Fixed Assets.
The ratio demonstrates the velocity of Inventory Turnover in an organisation.
This ratio indicates the number of times the Capital has been rotated in the process of doing business.
This is Profitability ratio which indicates the efficiency of the production.
This ratio implies the Operating Profit Margin on Sales.
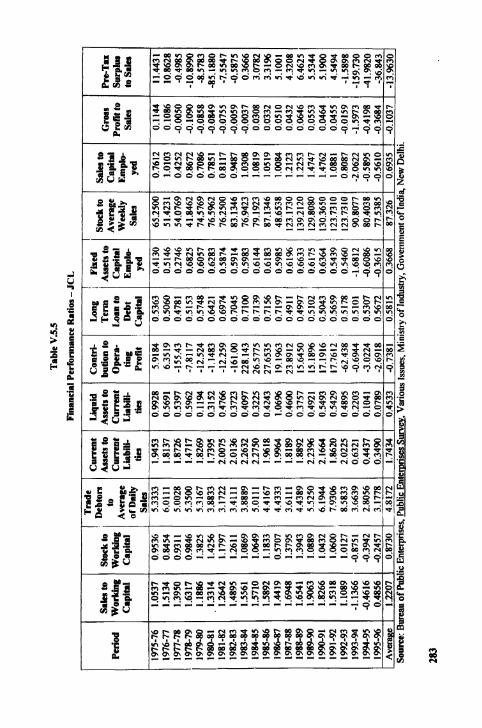
Financial ratios of select sample units belonging to the Heavy
Engineering Enterprises have been presented in Tables from V.5.1 to V.5.5 for
further examination and interpretation.
It can be seen From the tables that the Turnover ratios represented
positive trcnd in sample units, namely, BHEL (Table V.5.1) and BIIPV (Table V.5.3)
but negative trend was found in some of the years in case of HEC (Table V.S.2), BSL
(Table V.5.4) and JCL (Table V.5.5) during the study period. It implies that the sales
t~end was relatively satisfactory in BHEL and BHPV than other sample units during the
276

study period. From the above analysis, it is be infemd that the Working Capital
rquirernents could be met from sale proceeds in the sample units like BHEL and
BHPV while comparing to other sample units during the reference period.
It is shown in tables that trade debtors ratio of BHEL has registered
upward trend tremendously from 25.98 times in 1975-76 to 822.82 times in 1995-96.
The similar trend was recorded in BHPV during the reference period. It can be said that
these sample units have taken more time for collecting dues from debtors which results
to meet Working Capital requirements from short-term borrowings. Tables further
show that this ratio was low and fluctuated during the initial years but it improved
steadily in case of HEC. While this ratio was insignificant in BSL and JCL due to
inadequate sales during the period of study. Hence the liquidity of these units were
affected and the Working Capital requirements could be met from external resources.
The data assembled in tables relate to the current ratio of sample units
during the study period. On an average, the ratio was 1.39 times in BHEL, 1.26 times in
HEC, 1.44 times in BHPV, 1.74 times in BSL and 1.74 times in JCL during the reference
period. Looking at the current ratio of sample units, it may be observed that all units
had satisfactory ratio during the study period Comparison of this ratio against the
Turnover ratios of the respective sample units revealed that there was correlation
between Turnover ratios and Current ratios in the case of BHEL and B W V but no
correlation in other sample units. As such, it can be said that sample units such as
HEC. BSL and JCL depended more on short-term borrowings for Working Capital
requirement than on Sales proceeds during the study period.

Further, it can be seen from the tables that the Quick Asset ratio (Acid
Test Ratio) was less than one time in all sample units. It can, therefore, be stated that
no sample urit could be maintained suitable proportion of Liquid Assets against
Current Liabilities as suggested by Tandon committee6.
The tables also present information about various financial ratios of the
sample units. The contribution to Operating Profit ratio was consistent and positive
only in BHEL, however, it was negative in most of the years in other sample units
during the study period. It reflects that BHEL alone had sufficient sales to meet its
financial commitments during the study period.
Again, it can be noticed from the tables that the Fixed Assets to Capital
Employed ratios reported positive trend in all sample units. However, it showed
negative trend dwing the year 1994-95 and 1995-96 in HEC, BSL and JCL. On an
average, the ratio was 0.87 times in BHEL, 1.56 times in HEC, 0.80 times in BHPV,
1.12 times in BSL and 0.36 times in JCL during the study period. It implies that
sample units had generated additional assets by employing capital in business
operation during the study period. As far as unit-wise analysis, it was more
consistent and satisfactory for asset creation in BHEL and BHPV than that of other
sample units during the reference period.
Significantly, it can be seen From the tables that Gross Rofit ratios of
sample units revealed profitability trend during the study period. Under unit-wise
analysis, on an average of this ratio was 13 per cent in case of BHEL during the study
period. Next to BHEL, in BHPV the ratio was positive in all the years except 1978-79
and it was meagre to the extent of 7 per cent during the r e f e m period. Moreover,
-
vandon Committee Reuort, 1975, p. 135.
278

Tab
le V
.S.1
Fin
anci
al P
erfo
rman
ce R
ah
- BH
EL
sale
at0
wor
king
C
apih
l
1.08
32
2.18
49
2.45
58
2.60
%
2.12
65
2.08
1 1
. 2.0
410
2.11
70
2 .m
3.
7481
4.
2678
5.
0791
6.
5086
4.
5004
3.
9724
4.
1634
2.
5335
2.
2346
2.
2968
Liq
uM
Ass
ets
to
Cu
nm
t L
hbit
i-
ties
0.09
1 1
0.11
95
0.19
29
0.23
11
0.27
62
0.27
47
0.12
55
0.11
23
0.12
68
0.23
69
0.28
13
0.33
25
0.34
84
0.33
94
0.31
19
0.25
94
0.29
48
0.20
79
0.27
72
Con
hi-
buti
on to
oper
a-
ting
P
rofi
t
2.48
08
2.79
30
4.08
21
5.51
19
6.28
28
7.31
89
5.94
06
5.40
87
5.12
19
5.92
55
5.64
28
6.44
63
6.30
43
6.89
13
6.56
26
6.97
41
6.78
95
4.88
91
4.87
80
Long
Ter
n
Loa
n to
D
ebt
Cap
ital
-- 0.
3514
0.
3684
0.
3439
0.
2835
0.
2617
0.
2707
0.
2749
0.
2895
0.
2624
0.
2634
0.
253
1 0.
2398
0.
2388
0.
1980
0.
1663
0.
1679
0.
1125
0.
1025
0.
0995
Fid
Assets to
Cap
ital
E
mpl
o-
yed
0.54
79
0.79
12
0.90
77
0.89
02
0.76
08
0.78
16
0.79
11
0.79
51
0.90
38
0.97
33
1.05
81
0.14
36
1.25
86
1.10
55
1.07
77
1.16
20
0.84
22
0.77
61
0.81
42
Sto
ck to
S
alts
to
Ave
rage
C
apil
al
We
tw
Em
plo-
S
ala
ye
d
1994
-95
1995
-96
Ave
rage
S
ourc
e: B
urea
u of
Pub
lic E
nter
prise
s. m
c
Ent
eror
ises
Sur
vey,
Various is
sues
, Min
isby of In
dus@
. G
over
nmen
t of I
ndia
, New D
elhi
.
3.01
01
2.95
57
3.08
95
1.05
54
/ 690
.322
2 1
.07
20
, 82
2.82
50
1.6
30
7'
318.
9573
1.31
83
1.35
47
1.39
75
0.17
31
0.13
09
0.22
59
5.69
92
4.92
57
5.56
52
0.10
56
0.10
09
0.22
64
' 0.
9493
0.
8817
0.
8672
2526
.692
30
81.9
23
1658
.862
2.06
24
2.09
73
1.67
93
0.12
52
0.15
74
0.13
15
12.5
158
15.7
350
19.9
192

Peri
od
i T
rade
Sllc
s to
S
tock
to
i W
ork
ins
Wor
king
1975
-76
1976
-77
Cu
mn
t A
s~
h
to
Cu
rren
t L
iaM
li-
ties
1.75
67
1.91
64
1.67
74
1.61
67
1.38
30
1.11
03
1.03
65
1.35
11
1.21
15
1.21
02
1.00
73
0.94
%
0.96
85
1.55
21
1.95
20
1.59
57
1.17
80
1.07
27
0.97
12
0.60
15
1977
-78
1978
-79
1979
-80
1980
-81
1981
-82
1982
-83
1983
-84
1984
-85
1985
-86
1986
-87
1987
-88
1988
-89
1989
-90
1990
-91
1991
-92
1992
-93
1993
-94
1994
-95
1995
-96
Ave
rage
0.87
06
0.82
28
Sto
ck to
A
vera
ge
We
Y.
s.k
s
234.
596
267.
404
249.
769
249.
788
243.
923
260.
577
308.
519
367.
865
452.
096
438.
096
446.
769
53 1.
058
567.
250
581.
769
690.
904
738.
404
737.
942
486.
019
524.
923
371.
654
Tab
lt V
S.2
Fha
ncia
l Per
form
ance
Rat
ios - H
EC
Co
nh
i-
So
um
: Bu
reau
of P
ublic
Ent
erpr
ises
, Pub
lic EI
0.85
43
1.05
91
1.21
33
- 3.
3027
13
.477
7 1.
6168
1.
9836
2.
8657
85
.545
5 -1
1.83
80
-17.
4930
1.
4775
I.
102
9 0.
9721
2.
6005
13
.402
4 -2
2.55
10
-1.0
100
-0.6
409
3.79
21
0.49
99 1
0.03
25 1
-2.4
171
1 0.
5250
1 -0
.971
1 !
311.
288
1 -0
.792
4 1
-0.3
814
1.26
75 1
0.15
62 1
4.58
88 1
0.54
40 1
1.56
74 /
431.
458
1 1.
2831
1 -0
.179
7 em
rises
Sur
vey,
Various Is
sues
. Min
istry
of I
ndus
hy, G
over
nmen
t of
Indi
a, N
ew D
elhi
.
1.61
45
1.50
85
0.23
08
0.14
92
0.13
29
0.14
83
0.17
69
0.18
49
0.13
55
0.15
26
Pn
-Tn
su
rplu
s to s
* S
ales
8.
4361
10
.752
8 1.
8769
1 7.
7500
1,
8814
; 5.
5833
3.73
34
3.30
66
-2.8
263
-7.3
369
2.50
97'
6.91
68
19.8
552
2.76
95
4.43
06
4.17
39
105.
6000
-1
3.35
30
8.97
78
8.03
06
10.9
389
12.3
556
12.9
917
16.8
1 11
1 1.7
944
20.4
361
1.54
82
1.62
80
0.45
41
0.4
65
8;
0.46
20
0.47
53
0.08
78 1
-4
.366
4 0.
1000
i -5
.078
3
0.67
19
0.90
93
1.05
52
1.09
99
0.65
28
0.64
36
-18.
9690
1 33
.658
3 1.
6839
; 30
.583
3
1.28
29
1.68
92
2.04
17
1.75
73
-4.6
134
: 0.
4802
-2
.513
5 ;
0.50
15
1.33
01
1.70
53
4.44
75
8.06
41
-20.
2340
-0
.806
1 -0
.444
9 5.
5505
-8.8
990
-3.5
048
0.09
54
0.09
71
0.12
54
0.28
40
0.24
42
0.28
69
0.18
32
0.24
36
0.14
18
0.04
81
34.8
056
30.7
528
27.3
639
29.0
250
32.2
694
28.9
306
38.6
250
20.2
320
' 0.
5205
0.
6069
-8.6
653
-55.
8540
2.
8226
7.
0707
-3
1.22
60 '
-3.9
729
-1.9
216
-9.2
859
40.3
123
-1.1
298
0.64
29 j
2.87
27
0.64
78
4.90
14
0.64
98 1
4.06
25
0.68
32
0.50
28
0.50
14
0.54
01
0.50
82
0.47
36
0.48
70
0.95
66
0.75
49
0.89
17
1.49
10
2.22
20
3.70
94
-1.6
588

Tab
k VJ3
Financial
Per
fom
mce
Rat
ios -
BHP
V
Sale
s to
Pe
riod
W
ork
ing
C
.pih
l
Liq
uid
Ass
ets
to
Cu
rren
t L
iabi
li-
tie
0.0615
0.5867
0.5411
0.3589
0.3579
0.2838
0.2537
0.3721
0.2833
0.2936
0.4269
0.3490
0.4727
0.5363
0.4435
0.5408
0.5775
0.4012
0.3871
0.2542
Fixe
d A
saeh
to
Cap
ital
Emplb
yed
0.6356
0.5927
0.7259
0.7495
0.7609
0.9257
1.0775
1.3222
1.2408
0.9991
0.8794
0.9600
1.3094
0.6155
0.6220
0.5813
0.5571
0.5143
0.6332
0.6770
1995-%
1 2.9678
1 0.91 1
1 i 73 7556
1 1.3404
1 0.3909
1 23.9434
1 03417
/ 0.5927 1
161.17301
2.3073
Ave
rage
1
3.1825
1 2.2467
i 11.5619
1 1.4452
1 0.3892
1 10.3462
1 0.4488 1
0.8082 1
93.462
1 1.6721
Source:
Bur
eau of Public Enterprises, Public
Ente
rnris
es Survey, Various
Issu
es, M
inist
ry o
f Industry, Government
of In
dia,
New
Del
l
Sto
ck to
A
vera
ge
Wee
kly
S.k
s
54.2500
44.3846
37.2885
47.4423
55.3269
49.3846
60.1346
60.8654
118.1730
136.1350
95.3269
106.6920
107.2120
95.9038
120.0960
109.1350
106.8850
158.2310
117.6540
121.0000
Sd
u to
C
apit
al
Emplo-
yed
0.5412
0.7437
0.7650
0.5749
0.9445
1. I576
1.1651
1.9977
1.9485
2.3429
2.1723
2.1474
2.8281
1.7442
1.7658
2.3378
2.0680
1.5878
1.7731
2.2012


it is necessary to mention that the Gmss Profit ratio was negative in most of the years in
HEC, BSL and JCL over the period of the study. It implies that these units did not have
adequate sales which reflected negative trend on Gross Profit during the study period.
At the same time, Cost of Goods sold had mounted year after year due to the firm's
under-utilisation of its capacity, over-investment in Plant and Machinery, purchasing
of Raw Materials at unfavourables prices or it might be represented low Revenue due to
low prices in competitive product market.
Evidently, it can be observed from the Tables that Operating Surplus to
Sales ratios of the sample units reported similar is the Gross Profit ratios of the
sample units during the study period.
An examination of the financial performance of the sample units
belonging to Heavy Engineering in select Public Sector Enterprises is essential as it is
hypothesised that poor returns resulted in poor generation of the Internal resources
during the study period. However, on the basis of various financial ratios and their
results indicated that BHEL's financial performance was more satisfactory among the
sample units during the study period.
Financial rabos of sample units belonging to Medium Engineering
Public Sector Enterprises have been presented in Tables from V.6.1 to V.6.5 for
further analysis.
It can be observed from the tables that the Turnover ratios were
positive and satisfactory in sample units such as BEL (Table V.6.1), HMT (Table
V.6.3) and HCL (Table V.6.4). These ratios were r e p o d negative during the year
1983-84 and 1984-85 in case of BDL (Table V.6.2) and similar trend found during year

1994-95 in ITIL (Table V.6.5) during the study period. On an average, Sales to
Working Capital ratio was 2.21 times in BEL, 2.45 times in BDL, 1.81 times in HMT,
1.86 times in HCL ,and 1.06 times in RIL during the study period. This analysis
indicates that the ratio was relatively satisfactory in all sample units. From the
foregoing analysis, it may be inferred that the working capital requirements could be
met from the sale proceeds in all sample units, however, it was relatively good in case of
BEL during the period under the study.
It is exhibited in tables that Trade Debtor ratio of BEL has shown raising
trend significantly from 3.29 times in 1975-76 to 118.50 times in 1995-96. But tius ratio
has been fluctuated in HMT, HCL and ITIL during the study period At the same
time, this ratio was insignificant in BDL due to inadequate trade debtors. It might have
happened either due to cash sales or poor sales in BDL during the study period.
From the above exposition, it can be said that sample units such as BEL and ITIL have
taken more time for collecting dues from their debtors while comparing to HMT and
HCL during the reference period. As a result, sample units depended on short-term
borrowing for Working Capital requirements. However, it is noticed from the
analysis that the Liquidity position of the sample units, namely, HMT, HCL and ITIL
are good during the period of the study
The data presented in Tables from V.6.1 to V.6.5 pertaining to the
current ratio of sample units during the reference period. Looking at the current ratio
in tables which had been fluctuating in all sample units and an average of this ratio
was 1.49 times in BEL, 1.27 times in BDL, 2.55 times in HMT, 2.43 times in HCL and
2.52 times in JCL during the study period.

It can be observed &om the analysis that all sample units had
comfortable current ratio during the study period. Further, it reveals Cment Assets are
excess over Current Liabilities in all sample units which reflects sound short-term
solvency during the study period.
While comparing this ratio against the Turnover ratios of the respective
sample units, a proper correlation among all sample units except BDL was identified
during the study period. A significant variation was found in respect of current ratio
and turnover ratios of BDL due to wide fluctuation in Sales during the study period.
From the above analysis, it is evident that all sample units except BDL met their
Working Capital requirements from sale proceeds, hence, their short-term solvency
was good during the study period
Again, it can be seen from the tables that the Quick Assets / Acid Test
raOo was less than one time as an average in all sample units during the study
period. Therefore, it can be judged that all units could not be maintained in proper
proportion of Liquid Assets against Current Liabilities.
The tables further explain about different financial ratios of the
study units. The contribution to Operating PrcEt :& c!ez!y sh;.;;s relationsbp
between Operating Profit and Sales of the sample units. In BEL, this ratio was
positive throughout the study period and on an average, this ratio was 5.04 times. It
shows that conaibution was sufficient to meet Fixed wst and left sizeable portion as
Profit in the sample unit. While this ratio has been fluctuated widely in BDL which had
negative values during 1980-81 and 1983-84. This ratio turned as positive from
1984-85 onwards. From this analysis, it can be said that BDL had not earned profit in
all the years of the study period.

In the case of HMT, this ratio was positive and satisfactory from 1975-
76 to 1992-93 but it changed as negative dangerously during the year 1993-94 and
1994-95 due to inadequate Sales and increasing overhead cost, however, it improved
subsequently. On the basis of this ratio, it may be judged that HMT was not having
consistent Financial Performance during the period of the study. In HCL, on an
average, t h ~ s ratio was 3.02 times while it was 3.85 times in ITlL during the study
period. These sample units had sufficient contribution in all the years except in 1995-
96 due to inadequacy of Sales or increasing Cost of Goods sold. Judging from the
analysis that contribution was adequate to meet Fixed Costs and other Overhead Cost
of these units during the study period.
Evidently, it is also seen from the tables that the Fixed Assets to
Capital Employed ratios represented positive trend in all study units and an average
of the ratio was 1.03 times in BEL, 1.41 times in BDL, 0.80 times in HMT, 0.78 times
in HCL and 0.56 times in ITLL during the study period. This reflects that every one
rupee of Capital Employed in business has generated Asset to the extent of Rs. 1.03 in
BEL, Rs.1.41 in BDL, Rs.0.80 in HMT, Rs.0.78 in HCL and Rs.0.56 in lTIL
respectively during the study period. From this above exposition, it is judged that all
sample units have created Fixed Assets by employing capital in business operation
during the study period.
It will be pertinent to note about Gross Profit ratios help in knowing
their Rofitability trend during the study period. Under unit-wise analysis, an average of
this ratio was 17per cent in BEL, 10 per cent in HMT, 11 per cent in HCL and 16 per
cent in ITIL respectively and it was negative in BDL during the reference period.
Thus, it is necessary to note that this ratio was negative during the year 1993-94 and

1994-95 in HMT, and during the year 1995-96 in the case of HCL and ITIL. From the
foregoing analysis, it is inferred that the BEL was only sample unit which had
consistent Gross Profit during the period under study. Moreover, Gross Profit had
been fluctuating in all sample units due to increase of Cost of Goods sold in the said
period. This indicates under-utilisation of capacity, over-investment in Fixed Assets and
purchasing Raw Materials at high prices in the sample unit during the study period.
Significantly, it can be seen from the Tables that Operating Profit to Net
Sales ratios of the sample units reported similar trend to Gross Profit ratios of the
sample units during the study period.
It can be concluded from the foregoing analysis that the Turnover ratios
recorded favourable trend in all sample units except in BDL. Also, it is noticed that
Trade Debtor ratio showed debts realised effectively in BEL and HCL among the study
units. This ratio is much influenced on Current ratios of the sample units. Despite of
fluctuation in Current ratio, it is considered to be favourable in all sample units during
the study period.
Jt is relevant and significant to say that the Fixed Assets to Capital
Employed ratio is considered to be favourable in all study units which is more relevant
in the case of BEL during the study period. Further, Profitability of the sample units is
evaluated through Gross Profit ratio and Operating Profit ratio and the results are
encouraging only in BEL during the study period.
After careful examination on the results of financial ratios of the
study units, it may be concluded that BEL recorded satisfactory Financial Performance
among the sample units belonging to the Medium Engineering hb l i c Enterprises during
the study period.


Tnbk V
.6.4
Per
iod
1975
-76
1976
-77
1977
-78
1978
-79
1979
-80
1980
% 1
1981
-82
1982
-83
1983
-84
1984
-85
1985
-86
1986
-87
1987
-88
1988
-89
1989
-90
1990
-91
1 99
1 -92
19
92-9
3 19
93-9
4 19
94-9
5 19
95-9
6 A
vera
ge
Sou
rce:
B
Slk
a to
wo
rkb
y C
apit
al
2.27
60
3.15
71
2.20
18
1.66
52
1.48
72
1.82
05
2.09
13
1.76
05
1.93
60
1.91
83
2.51
29
2.21
65
2.26
71
2.25
20
1.44
65
1.27
74
1.79
37
1.56
35
1.36
14
1.32
87
0.74
99
1.86
11
mu
of P
ul
Fina
ncia
l Per
form
ance
Rsr
ios - H
CL
-
-
Tra
de
ic E
ntap
rise
s, m
r
Ent
ernr
ises
Sur
vey,
var
ious
Stock
to
Ave
rage
W
nW
Slles
20.4
808
Saks to
C
apit
al
Em
plo-
Y
C~
1.18
45
Gro
ss
Pm
fit t
o Sale
0.11
50
-67.
6630
1
0.55
79 1
0.70
00
1 348
.942
0 1
0.42
52
1 3.
0241
!
0.44
99 /
0.78
01
1 14
3.45
9 1
1.13
40 1
Issu
es, M
inis
try o
f Ind
ustry
, G
over
nmen
t of I
ndia
New
Del
hi.


V.4 CONCLUSION
An attempt is made in this chapter to analyse the performance of the
select Public Sector Enterprises by considering 25 different financial measures. These
ratios are categorised into three important groups namely, General performance,
Management performance and Financial performance. Based on the analysis, the
following conclusions are drawn.
(a) The profit before tax was not progressive and positive in all sample units except
in BHEL belonging' to Heavy engineering and BEI, belonging to Medium - engineering units dun'ng the study period
(b) It is found from the analysis that the Sales turnover to Capital employed was - positive in all sample units except in BSL and JCL of Heavy engineering group.
(c) The area in which selected Public enterprises have not done well, is on
Productivity performance and Management of working capid. Although excess
liquidity has been brought under control against the objective of profit
maximisation, the utilisation of working capital balances show the scant attention
by the management
(d) The financial performance of sample units seems to have poor returns which
results in poor generation of the internal resources during the study penod.
However, on the basis of various financial ratios and their results indicate that the
BHEL in Heavy engineering and the BEL in Medium engineering units were
recording satisfactory performance among the sample units during the study
period.