Chapter # TRANSMITTANCE SCALING FOR REDUCING POWER ... · Chapter # TRANSMITTANCE SCALING FOR...
22
Chapter # TRANSMITTANCE SCALING FOR REDUCING POWER DISSIPATION OF A BACKLIT TFT-LCD Wei-Chung Cheng and Massoud Pedram University of Southern California Abstract: This chapter presents transmittance scaling; a technique aimed at conserving power in a transmissive TFT-LCD with a cold cathode fluorescent lamp (CCFL) backlight by reducing the backlight illumination while compensating for the luminance loss. This goal is accomplished by adjusting the transmittance function of the TFT-LCD panel while meeting an upper bound on a contrast distortion metric. Experimental results show that an average of 3.7X power saving can be achieved for still images with a mere 10% contrast distortion. Key words: CCFL; transmissive LCD; TFT-LCD; backlight luminance dimming; transmittance scaling; concurrent brightness and contrast scaling; power efficiency; low power design. 1. INTRODUCTION TFT-LCD is the most popular flat-panel display used in today's consumer electronics and computer systems. TFT stands for "Thin Film Transistor" and describes the control elements that actively control the individual pixels. For this reason, one speaks of so-called "active matrix TFT's". LCD means "Liquid Crystal Display" and stands for monitors that are based on liquid crystals. To obtain a high image quality and low power dissipation in a TFT-LCD, low off-current and high on-current are necessary. Previous studies on battery-powered electronics point out that the display subsystem dominates the energy consumption of the whole system. In the SmartBadge system, for instance, the display consumes 29%, 29%, and 50% of the total power in the active, idle, and standby modes, respectively [1]. Direct-view LCDs can largely be categorized into reflective and transmissive displays which utilize ambient light and light from an artificial light source (e.g., fluorescent backlight tube) respectively. In a transmissive TFT-LCD monitor, the backlight contributes more than 50% of the
Transcript of Chapter # TRANSMITTANCE SCALING FOR REDUCING POWER ... · Chapter # TRANSMITTANCE SCALING FOR...
Chapter #
TRANSMITTANCE SCALING FOR REDUCING POWER DISSIPATION OF A BACKLIT TFT-LCD
Wei-Chung Cheng and Massoud Pedram University of Southern California
Abstract: This chapter presents transmittance scaling; a technique aimed at conserving power in a transmissive TFT-LCD with a cold cathode fluorescent lamp (CCFL) backlight by reducing the backlight illumination while compensating for the luminance loss. This goal is accomplished by adjusting the transmittance function of the TFT-LCD panel while meeting an upper bound on a contrast distortion metric. Experimental results show that an average of 3.7X power saving can be achieved for still images with a mere 10% contrast distortion.
Key words: CCFL; transmissive LCD; TFT-LCD; backlight luminance dimming; transmittance scaling; concurrent brightness and contrast scaling; power efficiency; low power design.
1. INTRODUCTION
TFT-LCD is the most popular flat-panel display used in today's consumer electronics and computer systems. TFT stands for "Thin Film Transistor" and describes the control elements that actively control the individual pixels. For this reason, one speaks of so-called "active matrix TFT's". LCD means "Liquid Crystal Display" and stands for monitors that are based on liquid crystals. To obtain a high image quality and low power dissipation in a TFT-LCD, low off-current and high on-current are necessary. Previous studies on battery-powered electronics point out that the display subsystem dominates the energy consumption of the whole system. In the SmartBadge system, for instance, the display consumes 29%, 29%, and 50% of the total power in the active, idle, and standby modes, respectively [1]. Direct-view LCDs can largely be categorized into reflective and transmissive displays which utilize ambient light and light from an artificial light source (e.g., fluorescent backlight tube) respectively. In a transmissive TFT-LCD monitor, the backlight contributes more than 50% of the

2 Chapter # display subsystem when using a cold cathode fluorescent lamp (CCFL) [2]. To reduce the backlight power consumption, Choi et al. proposed a technique called backlight luminance dimming. This technique dims the backlight and compensates for the luminance loss by adjusting the grayscale of the image to increase its brightness or contrast. The grayscale of the image is adjusted by multiplying the pixel values by a scaling factor. In this chapter, we describe the transmittance scaling technique, which compensates for the luminance loss by adjusting the transmittance function of the TFT-LCD panel. More precisely, transmittance scaling means “scaling the transmittance function of the TFT-LCD panel.” This is a general technique that can achieve concurrent brightness and contrast scaling of the whole image to compensate for the effects of the backlight dimming.
In the following sections, we explain how CCFL works and show how to model the non-linearity between its backlight illumination and power consumption. Next, we propose a contrast distortion metric to quantify the image quality loss after transmittance scaling. Finally, we formulate and optimally solve the optimal transmittance scaling problem subject to a constraint on the contrast distortion.
2. PRELIMINARIES
A transmissive LCD uses a dedicated backlight. A reflective LCD uses the ambient light or/and a dedicated frontlight. A transflective LCD uses both the ambient light and backlight. The frontlight and backlight use the same light source. The difference between the two lighting schemes is in the light path from the light source through the LCD panel to the observer. A back-lit or front-lit LCD offers superior contrast ratio compared to the one that is lit by the ambient light. A backlight can be direct or indirect type. A direct backlight is positioned directly beneath the LCD panel. An indirect (or side-lit) backlight is positioned at the side of the LCD panel and requires a carefully designed light-guide and a diffuser to illuminate the LCD panel evenly.
Most TFT-LCD monitors use CCFL for backlighting due to its unrivaled luminance density – emitting the most light within the minimum form factor. The CCFL can be designed to generate an arbitrary color, which is critical for reproducing pure white in the backlighting applications. Technology for CCFL manufacturing is mature; therefore, its production cost is rather low. However, compared to power consumption of the TFT-LCD panel, the power consumption of the CCFL backlight is quite high.
2.1 Radiometry and Photometry Terminology
Radiometry refers to the science of measuring light in any portion of the electromagnetic spectrum [3]. In practice, radiometry is usually limited to the measurement of infrared, visible, and ultraviolet light using optical instruments.
Light is radiant energy. Electromagnetic radiation transports energy through space. Radiant energy (denoted as Q) is measured in joules. A broadband source such as the Sun emits electromagnetic radiation throughout most of the electromagnetic spectrum, from radio waves to gamma rays. However, most of its

#. Transmittance Scaling for Reducing power Dissipation of a Backlit TFT-LCD
3
radiant energy is concentrated within the visible portion of the spectrum. A single-wavelength laser, on the other hand, is a monochromatic source; all of its radiant energy is emitted at one specific wavelength. Energy per unit time is power, which we measure in joules per second, or watts. A laser beam, for example, has so many watts of radiant power. Light “flows” through space, and so radiant power is more commonly referred to as the “time rate of flow of radiant energy” or radiant flux. It is defined as: Φ=dQ/dt where Q is radiant energy and t is time. Radiant flux is measured in watts. In terms of a photographic light meter measuring visible light, the instantaneous magnitude of the electric current is directly proportional to the radiant flux. The total amount of current measured over a period of time is directly proportional to the radiant energy absorbed by the light meter during that time.
Radiant flux density is the radiant flux per unit area at a point on a surface. There are two possible conditions. The flux can be arriving at the surface, in which case the radiant flux density is referred to as irradiance. The flux can also be leaving the surface due to emission and/or reflection. The radiant flux density is then referred to as radiant exitance. Radiant flux density is measured in watts per square meter. The radiant flux density at a point on a surface due to a single ray of light arriving (or leaving) at a solid angle θ to the surface normal is dΦ/(dA·cosθ). The radiance at that point for the same angle is then d2Φ/(dA·dω·cosθ), or radiant flux density per unit solid angle. Radiance is measured in watts per square meter per steradian. We can imagine an infinitesimally small point source of light that emits radiant flux in every direction. The amount of radiant flux emitted in a given direction can be represented by a ray of light contained in an elemental cone. This gives us the definition of radiant intensity: I =dΦ/dω. Radiant intensity is measured in watts per steradian.
Photometry is the science of measuring visible light in units that are weighted according to the sensitivity of the human eye [3]. It is a quantitative science based on a statistical model of the human visual response to light -- that is, our perception of light -- under carefully controlled conditions. The human visual system is a complex and highly nonlinear detector of electromagnetic radiation with wavelengths ranging from 380 to 770 nanometers (nm). The sensitivity of the human eye to light varies with wavelength. A light source with a radiance of one watt/m2-steradian of green light (540nm wavelength), for example, appears much brighter than the same source with a radiance of one watt/m2-steradian of red (650nm wavelength) or blue light (450nm wavelength). In photometry, we attempt to measure the subjective impression produced by stimulating the human eye-brain visual system with radiant energy. This task is complicated immensely by the eye’s nonlinear response to light. It varies not only with wavelength but also with the amount of radiant flux, whether the light is constant or flickering, the adaptation of the iris and retina, the spatial complexity of the scene being perceived, the psychological and physiological state of the observer, and a host of other variables [4].
According to studies done by the Commission Internationale d’Eclairage (CIE), the photopic luminous efficiency of the human visual system as a function of wavelength looks like a near-normal distribution as depicted in Figure 1 (cf. [5].)

4 Chapter # The CIE photometric curve thus provides a weighting function that can be used to convert radiometric measurements into photometric measurements. Today the international standard for a light source is a point source that has a luminous intensity of one candela (the Latin word for “candle”). It emits monochromatic radiation with a frequency of 540*1012 Hertz (or approximately 555nm, corresponding with the wavelength of maximum photopic luminous efficiency) and has a radiant intensity (in the direction of measurement) of 1/683 watts per steradian.
Figure 1: Photopic luminosity function.
Together with the CIE photometric curve, candela provides the weighting factor
needed to convert between radiometric and photometric measurements. Consider, for example, a monochromatic point source with a wavelength of 510nm and a radiant intensity of 1/683 watts per steradian. The photopic luminous efficiency at 510nm is 0.503. The source therefore has a luminous intensity of 0.503 candela. Luminous flux is the photometrically-weighted radiant flux (power). Its unit of measurement is the lumen, defined as 1/683 watts of radiant power at a frequency of 540*1012 Hertz. As with luminous intensity, the luminous flux of light with other wavelengths can be calculated using the CIE photometric curve. Luminous energy is photometrically-weighted radiant energy. It is measured in lumen seconds. Luminous flux density is photometrically-weighted radiant flux density. Luminous flux density is measured in lumens per square meter. Illuminance is the photometric equivalent of irradiance, whereas luminous exitance is the photometric equivalent of radiant existence. Illuminance can be used to characterize the luminous flux emitted from a surface. Most photographic light meters measure the illuminance. Luminance is photometrically-weighted radiance. In terms of visual perception, we perceive luminance. It is an approximate measure of how “bright” a surface appears when we view it from a given direction. Luminance is measured in lumens per square meter per steradian. The maximum brightness of a CRT or LCD monitor is described by luminance in its specification. Luminous intensity is photometrically-weighted radiant intensity. It is measured in lumens per steradian (i.e., candelas). Luminous intensity can be used to characterize the optical power emitted from a spot light source, such as a light bulb.
There is much more that we have not covered here, such as reflectance, transmittance, absorption, scattering, diffraction, and polarization. We have also

#. Transmittance Scaling for Reducing power Dissipation of a Backlit TFT-LCD
5
ignored the interaction of the human visual system with light, including scoptic and mesopic luminous efficiency, temporal effects such as flicker, and most important, color perception. The study of light and how we perceive it fills volumes of research papers and textbooks.
2.2 Cold Cathode Fluorescent Lamp
A transmissive LCD uses a dedicated backlight. A reflective LCD uses the ambient light or/and a dedicated frontlight. A transflective LCD uses both the ambient light and backlight. The frontlight and backlight use the same light source. The difference between the two lighting schemes is in the light path from the light source through the LCD panel to the observer. A back-lit or front-lit LCD offers superior contrast ratio compared to the one that is lit by the ambient light. A backlight can be direct or indirect type. A direct backlight is positioned directly beneath the LCD panel. An indirect (or side-lit) backlight is positioned at the side of the LCD panel and requires a carefully designed light-guide and a diffuser to illuminate the LCD panel evenly.
Most TFT-LCD monitors use CCFL for backlighting due to its unrivaled luminance density – emitting the most light within the minimum form factor. The CCFL can be designed to generate an arbitrary color, which is critical for reproducing pure white in the backlighting applications. Technology for CCFL manufacturing is mature; therefore, its production cost is rather low. However, compared to power consumption of the TFT-LCD panel, the power consumption of the CCFL backlight is quite high.
A CCFL backlight module consists of the fluorescent lamp, the driving DC-AC inverter, and the light reflector. A CCFL is a sealed glass tube with electrodes on both ends. The tube is filled with an inert gas (argon) and mercury. The inner glass surface of the tube is coated with phosphor, which emits visible light when excited by photons. The wavelength of the visible light (i.e., color) depends on the type of the gas and phosphor. In the LCD backlighting application, a proper mix of red, green, and blue phosphors produces the desired three-band white light. In other applications where the pure white is not required, the emitted light is color-shifted (e.g., the bluish or yellowish household hot cathode fluorescent lamps).
The CCFL converts electrical energy into visible light by a process known as the gas discharge phenomenon. When a high voltage is applied to the electrodes turning on the lamp, electrical arcs are generated that ionize the gas, which allows the electrical current to flow. The collision among the moving ions injects energy to the mercury atoms. The electrons of the mercury atoms receive energy and jump to a higher energy level followed by emitting ultraviolet photons when falling back to their original energy level. The ionized gas conducts the electrical current as a gas conductor. The impedance of the gas conductor, unlike that of the metal conductor having a linear behavior, decreases as the current increases. Therefore, the CCFL has to be driven by an alternative current (AC). Otherwise, the CCFL explodes due to the heat caused by the runaway current. The CCFL is usually manufactured as a thin long tube, which can be straight or in any different shape.

6 Chapter #
A DC-AC inverter is usually used to drive a CCFL in battery-powered applications. A DC-AC inverter is basically a switching oscillator circuit that supplies high-voltage AC current from a low-voltage battery. The nominal AC frequency of modern CCFL is in the range of 50-100 kHz to avoid flickering. The nominal operate voltage has to be higher than 500 VRMS to keep inert gas ionized.
To conserve energy in battery-powered applications, dimming control is a desirable feature for DC-AC inverters. Different methods of dimming the CCFL have been used, including linear current, pulse-width-modulation, and current chopping [6]. In a DC-AC inverter with dimming control, an analog or digital input signal is exposed for adjusting the CCFL illumination in addition to the on/off input signal. Most well designed DC-AC inverters have high electrical efficiency (>80%) and linear response of output electrical power to input power. Most fluorescent lamps, however, have low optical efficiency (<20%) and non-linear response of output optical power versus input power [7].
2.3 Power Modeling for the CCFL
The CCFL illumination is a complex function of the driving current, ambient temperature, warm-up time, lamp age, driving waveform, lamp dimensions, and reflector design [7]. In the transmissive TFT-LCD application, only the driving current is controllable. Therefore, we model the CCFL illumination as a function of the driving current only and ignore the other parameters.
Figure 2: Normalized CCFL illuminance (i.e., backlight factor, b) versus driver’s power consumption for a CCFL light source.
Relationship between the CCFL illumination (i.e., luminous flux incident on a
surface per unit area) and the driver’s power dissipation for the CCFL in LG Philips transmissive TFT-LCD LP064V1 [8] is shown in Figure 2. The CCFL illumination increases monotonically as the driving power increases from 0 to 80% of the full
0 0.1 0.2 0.3 0.4 0.5 0.6 0.7 0.8 0.9
1
0 0.5 1 1.5 2 2.5 3 Power Consumption (W)
CC
FL
illu
min
ance
#. Transmittance Scaling for Reducing power Dissipation of a Backlit TFT-LCD
7
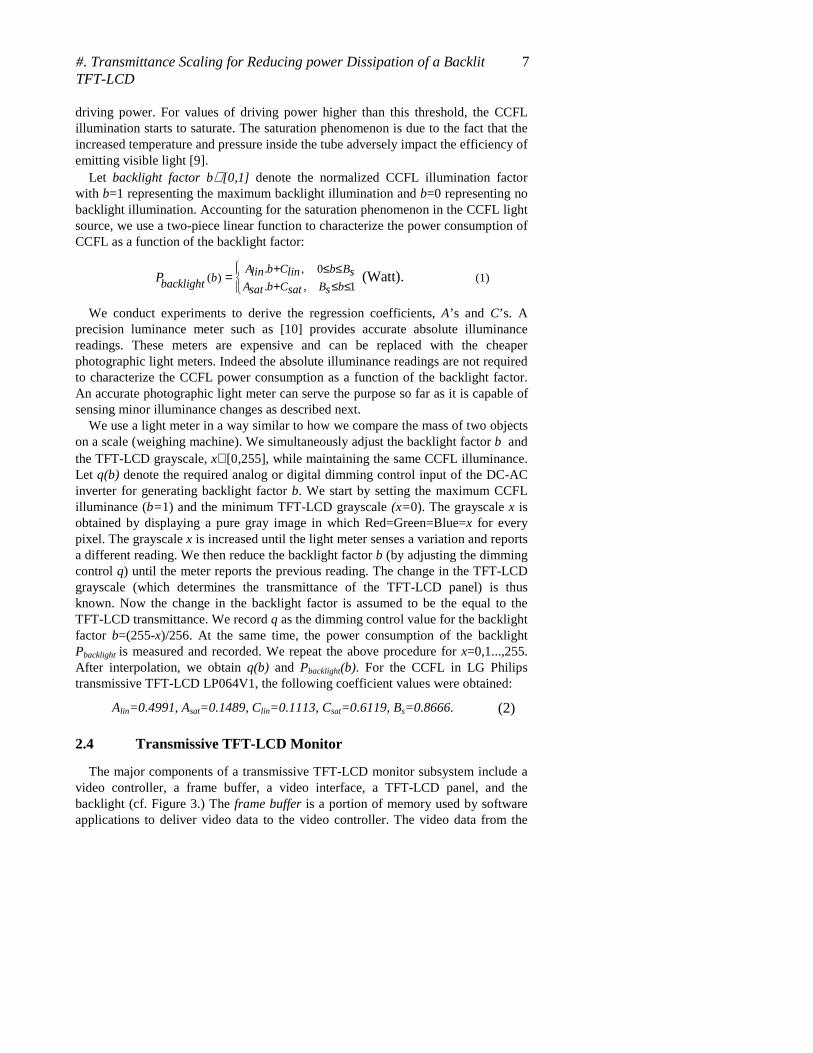
driving power. For values of driving power higher than this threshold, the CCFL illumination starts to saturate. The saturation phenomenon is due to the fact that the increased temperature and pressure inside the tube adversely impact the efficiency of emitting visible light [9].
Let backlight factor b∈ [0,1] denote the normalized CCFL illumination factor with b=1 representing the maximum backlight illumination and b=0 representing no backlight illumination. Accounting for the saturation phenomenon in the CCFL light source, we use a two-piece linear function to characterize the power consumption of CCFL as a function of the backlight factor:
. , 0( )
. , 1
A b C b Blin lin sbbacklight A b C B bsat sat sP
+ ≤ ≤
+ ≤ ≤= (Watt). (1)
We conduct experiments to derive the regression coefficients, A’s and C’s. A precision luminance meter such as [10] provides accurate absolute illuminance readings. These meters are expensive and can be replaced with the cheaper photographic light meters. Indeed the absolute illuminance readings are not required to characterize the CCFL power consumption as a function of the backlight factor. An accurate photographic light meter can serve the purpose so far as it is capable of sensing minor illuminance changes as described next.
We use a light meter in a way similar to how we compare the mass of two objects on a scale (weighing machine). We simultaneously adjust the backlight factor b and the TFT-LCD grayscale, x∈ [0,255], while maintaining the same CCFL illuminance. Let q(b) denote the required analog or digital dimming control input of the DC-AC inverter for generating backlight factor b. We start by setting the maximum CCFL illuminance (b=1) and the minimum TFT-LCD grayscale (x=0). The grayscale x is obtained by displaying a pure gray image in which Red=Green=Blue=x for every pixel. The grayscale x is increased until the light meter senses a variation and reports a different reading. We then reduce the backlight factor b (by adjusting the dimming control q) until the meter reports the previous reading. The change in the TFT-LCD grayscale (which determines the transmittance of the TFT-LCD panel) is thus known. Now the change in the backlight factor is assumed to be the equal to the TFT-LCD transmittance. We record q as the dimming control value for the backlight factor b=(255-x)/256. At the same time, the power consumption of the backlight Pbacklight is measured and recorded. We repeat the above procedure for x=0,1...,255. After interpolation, we obtain q(b) and Pbacklight(b). For the CCFL in LG Philips transmissive TFT-LCD LP064V1, the following coefficient values were obtained:
Alin=0.4991, Asat=0.1489, Clin=0.1113, Csat=0.6119, Bs=0.8666. (2)
2.4 Transmissive TFT-LCD Monitor
The major components of a transmissive TFT-LCD monitor subsystem include a video controller, a frame buffer, a video interface, a TFT-LCD panel, and the backlight (cf. Figure 3.) The frame buffer is a portion of memory used by software applications to deliver video data to the video controller. The video data from the
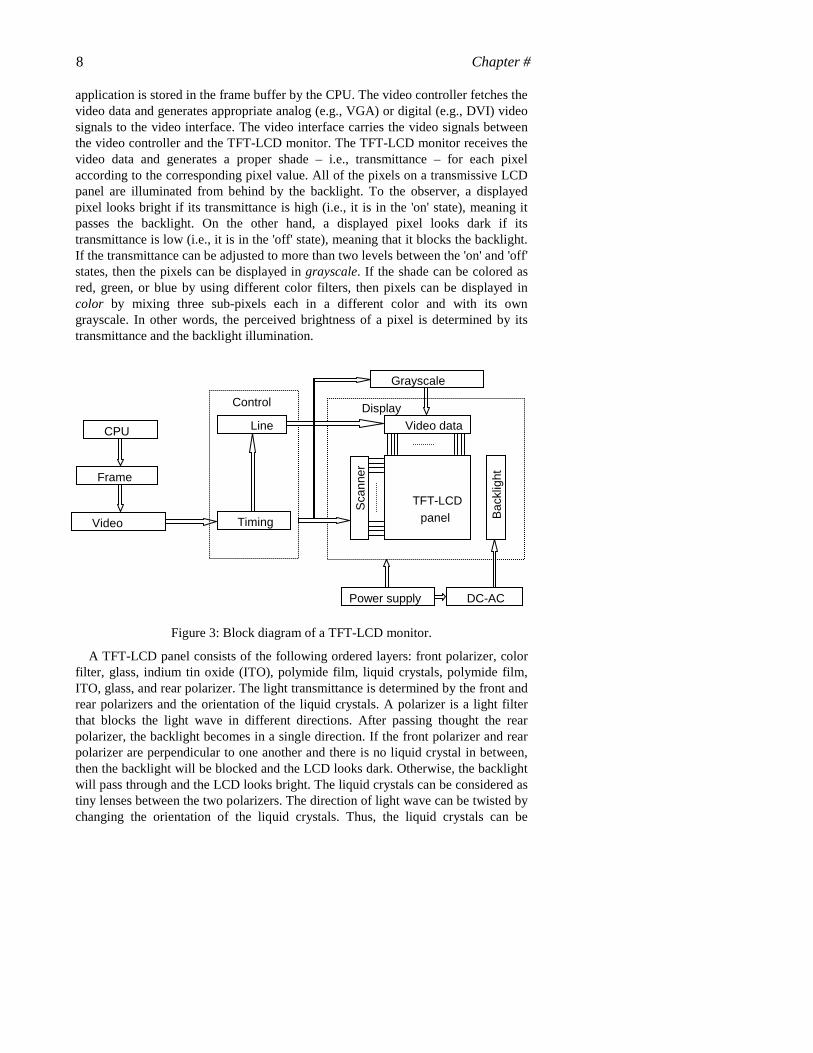
8 Chapter # application is stored in the frame buffer by the CPU. The video controller fetches the video data and generates appropriate analog (e.g., VGA) or digital (e.g., DVI) video signals to the video interface. The video interface carries the video signals between the video controller and the TFT-LCD monitor. The TFT-LCD monitor receives the video data and generates a proper shade – i.e., transmittance – for each pixel according to the corresponding pixel value. All of the pixels on a transmissive LCD panel are illuminated from behind by the backlight. To the observer, a displayed pixel looks bright if its transmittance is high (i.e., it is in the 'on' state), meaning it passes the backlight. On the other hand, a displayed pixel looks dark if its transmittance is low (i.e., it is in the 'off' state), meaning that it blocks the backlight. If the transmittance can be adjusted to more than two levels between the 'on' and 'off' states, then the pixels can be displayed in grayscale. If the shade can be colored as red, green, or blue by using different color filters, then pixels can be displayed in color by mixing three sub-pixels each in a different color and with its own grayscale. In other words, the perceived brightness of a pixel is determined by its transmittance and the backlight illumination.
Figure 3: Block diagram of a TFT-LCD monitor.
A TFT-LCD panel consists of the following ordered layers: front polarizer, color filter, glass, indium tin oxide (ITO), polymide film, liquid crystals, polymide film, ITO, glass, and rear polarizer. The light transmittance is determined by the front and rear polarizers and the orientation of the liquid crystals. A polarizer is a light filter that blocks the light wave in different directions. After passing thought the rear polarizer, the backlight becomes in a single direction. If the front polarizer and rear polarizer are perpendicular to one another and there is no liquid crystal in between, then the backlight will be blocked and the LCD looks dark. Otherwise, the backlight will pass through and the LCD looks bright. The liquid crystals can be considered as tiny lenses between the two polarizers. The direction of light wave can be twisted by changing the orientation of the liquid crystals. Thus, the liquid crystals can be
Frame
CPU
Video
Line
Timing
TFT-LCD panel
Video data
Sca
nner
Grayscale
Bac
klig
ht
DC-AC
Display Control
Power supply

#. Transmittance Scaling for Reducing power Dissipation of a Backlit TFT-LCD
9
considered as voltage-controlled light switches (cf. Figure 4.)
Figure 4: LCD as voltage-controlled light switch.
The liquid crystals are in a phase of matter between liquid and solid states. In the
liquid state the molecules can move freely, whereas in solid state the molecules are fixed in certain order. The liquid crystals are in the state that the molecules can move until they form a certain order according to an external force. Three types of liquid crystal phases are used in LCD: nematic, cholesteric, and smectic. The twisted nematic (TN) liquid crystal is the most widely used in today's LCD monitors.
The nematic liquid crystals can be considered as transparent rods (rod-like lenses.) These rods are locally aligned with their long axes nearly parallel to each other on a two-dimensional plane. Their orientation can be denoted by an angle. When there are two stacked planes of nematic liquid crystals, the molecules on each plane align with each other, but the angle of each plane can be different, or twisted. When more twisted planes of nematic liquid crystals are stacked, a series of twisted rod-like lenses forms a spiral light path, which can twist the direction of the light wave from the backlight. If the polarizers are perpendicular, then the backlight passes and a bright pixel is seen. This configuration of crossed polarizers is called normally white.
When an external electrical field is applied, all nematic liquid crystals change their orientation such that their long axes point to the electrodes uniformly. In this case, the direction of the light wave is not affected and forms a dark pixel in a normally white LCD. In other words, a normally white LCD consumes power to generate a dark pixel. By controlling the electrode voltage, the amount of light passing the LCD can be modulated to generate grayscale pixels.

10 Chapter #
The nematic liquid crystals are sandwiched between two glasses. The spacing in between decides the number of planes of nematic liquid crystals. To twist the liquid crystals, parallel groves are produced on the glasses by using polymide film. The groves on the front glass set the orientation of the nearby nematic liquid crystals.
The groves on the rear glass set the orientation of the nearby nematic liquid crystals to be perpendicular to the first one. The orientations of other planes in between will be twisted by the first and last plane from 0 to 90 degree accordingly when no voltage applied. The color filter determines a sub-pixel to be red, green, or blue.
Figure 5: The electrical waveforms of the gate-source Vg and drain-source voltage Vd of a TFT-LCD.
Each sub-pixel has an individual liquid crystal cell, a thin-film-transistor and a storage capacitor. The layout of the transparent ITO electrodes defines the shape of a sub-pixel. The liquid crystals between the electrodes form a conceptual cell. The electrical field of the capacitor controls the transmittance of the cell. The capacitor is charged and discharged by its own TFT. The gate electrode of the TFT controls the timing of charging/discharging when the pixel is scanned (or addressed) for refreshing its content. The (drain-) source electrode of the TFT controls the amount of charge (cf. Figure 5).
Figure 6: The equivalent circuit of a TFT-LCD sub-pixel. CST is the storage capacitor. CGS and Clc are parasitic capacitances.
Vcom
Vg
Vd
Source bus line
Vn
Cst Clc
G
Vg
Vd
S D
Cgs
Vs Vcom
Gate bus line
Vcom
#. Transmittance Scaling for Reducing power Dissipation of a Backlit TFT-LCD
11
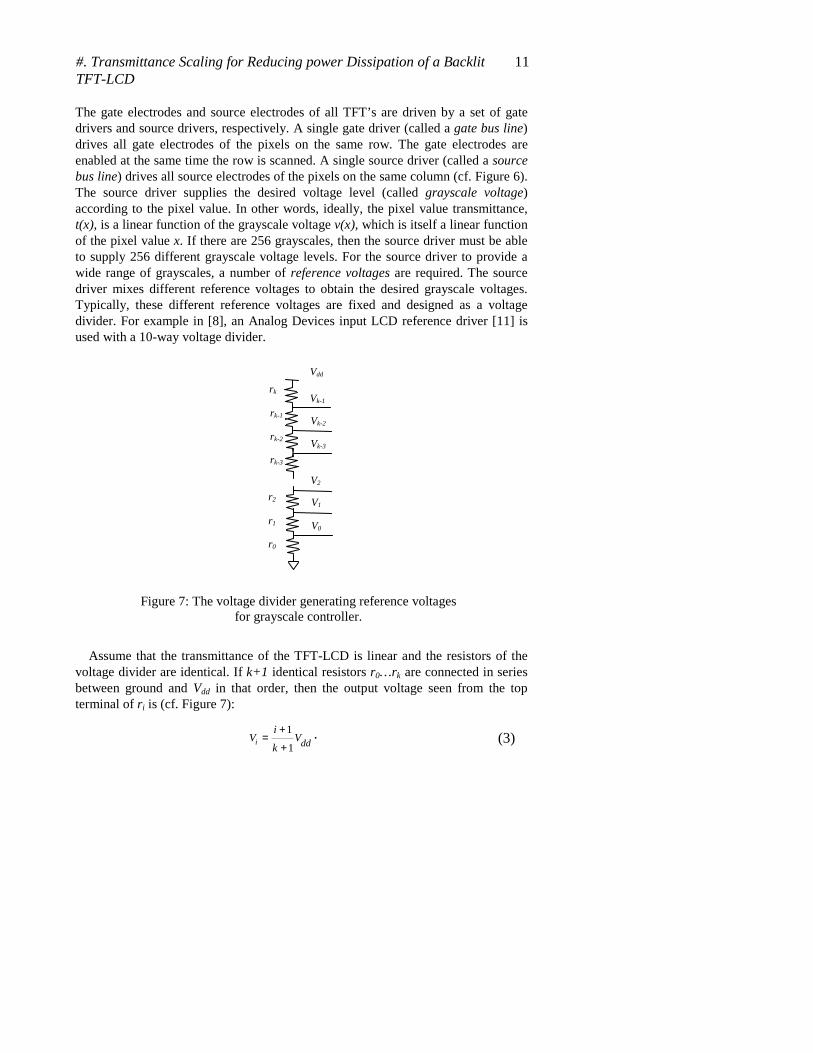
The gate electrodes and source electrodes of all TFT’s are driven by a set of gate drivers and source drivers, respectively. A single gate driver (called a gate bus line) drives all gate electrodes of the pixels on the same row. The gate electrodes are enabled at the same time the row is scanned. A single source driver (called a source bus line) drives all source electrodes of the pixels on the same column (cf. Figure 6). The source driver supplies the desired voltage level (called grayscale voltage) according to the pixel value. In other words, ideally, the pixel value transmittance, t(x), is a linear function of the grayscale voltage v(x), which is itself a linear function of the pixel value x. If there are 256 grayscales, then the source driver must be able to supply 256 different grayscale voltage levels. For the source driver to provide a wide range of grayscales, a number of reference voltages are required. The source driver mixes different reference voltages to obtain the desired grayscale voltages. Typically, these different reference voltages are fixed and designed as a voltage divider. For example in [8], an Analog Devices input LCD reference driver [11] is used with a 10-way voltage divider.
Figure 7: The voltage divider generating reference voltages for grayscale controller.
Assume that the transmittance of the TFT-LCD is linear and the resistors of the
voltage divider are identical. If k+1 identical resistors r0…rk are connected in series between ground and Vdd in that order, then the output voltage seen from the top terminal of ri is (cf. Figure 7):
1
1i dd
iV V
k
+=
+. (3)
r0
r1
r2
rk-3
rk-2
rk-1
rk
Vdd
Vk-1
Vk-2
Vk-3
V2
V1
V0

12 Chapter #
Figure 8: Normalized pixel transmittance, t(x), versus power consumption of a pixel in the LCD panel.
2.5 Power Modeling for the TFT-LCD
The hydrogenated amorphous silicon (a-Si:H) is commonly used to fabricate the TFT in display applications. For a TFT-LCD panel, the a-Si:H TFT power consumption can be modeled by a quadratic function of pixel value x∈ [0,255] [13]:
PTFT (x)=c0+c1x+c2x2 (Watt).
(4)
We performed the current and power measurements on the LG Philips, LP064V1 LCD. The measurement data are shown in Figure 8. The regression coefficients are thus determined as:
c0=2.703E-3, c1=2.821E-4, c2=2.807E-5. (5)
The power consumption of a normally white TFT-LCD panel decreases as its global transmittance increases. In other words, while maintaining the same luminance, the power consumption of the TFT-LCD decreases when dimming the backlight. The change in the TFT-LCD power consumption is, however, quite small.
3. BACKLIGHT AND TRANSMITTANCE SCALING
The general framework for the backlight luminance dimming and the transmittance scaling is depicted in Figure 9. The pixel illumination is determined by the backlight illumination and the LCD transmittance. The backlight illumination is controlled by adjusting the amplitude of the dimming control signal to the DC-AC inverter. The LCD transmittance is controlled by the pixel values and the grayscale
0 0.1 0.2 0.3 0.4 0.5 0.6 0.7 0.8 0.9
1
0.96 0.965 0.97 0.975 0.98 0.985 0.99 0.995 1 TFT-LCD Panel Power
Tra
nsm
itta
nce
t

#. Transmittance Scaling for Reducing power Dissipation of a Backlit TFT-LCD
13
controller. The backlight scaling technique dims the backlight to save power and increases pixel values to compensate for the brightness loss. The transmittance scaling technique dims the backlight to save power and increases the reference grayscale voltages to compensate for the brightness loss. Note that transmittance scaling does not change the pixel values.
Figure 9: A framework for backlight luminance dimming and transmittance scaling.
The luminance of a transmissive object is the product of the luminance of the incident light and the transmittance of the object [5]. For a pixel on a transmissive TFT-LCD monitor, its transmittance, t(x), is a function of its pixel value x. More precisely, a pixel value of zero means zero transmittance and hence the perceived shade will be black whereas a pixel value of 255 means a transmittance of one and hence the perceived shade will be white. Other pixel values between 0 and 255, result in various shades of gray. Now, luminance, L(x), of a pixel in the TFT-LCD panel is calculated as:
L(x) = b·t(x) (6)
The ambient light is not considered here because it has little effect for a transmissive TFT-LCD when compared with a reflective or transflective one. Figure 10 depicts the relation in (6) assuming that the TFT-LCD transmissivity is a linear function of the pixel value.
b *
=
Backlight
Factor
TFT-LCD Transmittance Function
Luminance Function
Figure 10: The luminance of a normalized pixel value (right) is the product of the backlight factor b and the TFT-LCD transmissivity function.
In a non-backlight-scaled TFT-LCD monitor, the backlight luminance (denoted by the normalized backlight factor b) is fixed at full CCFL driver power (b=1).
Pixel value Dimming value
DC - AC inverter
CCFL Illumination LCD Transmittance
Control voltage
Source driver
Grayscale controller
* = Pixel Illumination
Reference grayscale voltages
10
Pixel value Dimming value
DC - AC inverter
CCFL Illumination
Control voltage
Source driver
Grayscale controller
* =
Reference grayscale voltages
10

14 Chapter # 3.1 Backlight Luminance Dimming
Reference [2] describes two backlight luminance dimming techniques, which dim the backlight luminance to save power consumption. To compensate for brightness loss, the authors reduce b while increasing the pixel values from x to x' by two mechanisms. The “backlight luminance dimming with brightness compensation” technique uses:
x’=x+b. (7)
The “backlight luminance dimming with contrast enhancement” technique uses:
x’=x/b. (8)
The pixel values are adjusted by software before being written into the frame buffer or by hardware after being fetched by the video controller. The distortion after backlight luminance dimming is evaluated by the percentage of saturated pixels that exceed the range of pixel values, i.e., [0,255]. The optimal backlight factor is determined by the backlight luminance dimming policy subject to the given distortion rate. To calculate the distortion rate, a histogram estimator is required for calculating the statistics of the input image.
3.2 Programmable LCD Reference Driver
Recall that the pixel value transmittance, t(x), is a linear function of the grayscale voltage v(x). The transmittance scaling approach is to control the mapping of v(x) in order to control the transmittance function t(x). We propose using a programmable LCD reference driver (PLRD) described as follows.
The PLRD is implemented by adding an extra logic to the original voltage divider expressed by (6). The logic contains a number of p-channel and n-channel switches and multiplexers. Recall that k+1 identical resistors r0…rk are connected in series between ground and Vdd. The PLRD takes two input arguments gl and gu, and then short circuits the top terminal of rgl to ground and the top terminal of rgu to Vdd. In this way, the output voltage seen from the top terminal of ri becomes:
,
',, ,
0, 0
V gu i kdd
i glV gl i guddi gl gu gu gl
i gl
V
≤ ≤ − ≤ <
− ≤ ≤
= . (9)
Clearly, the PLRD performs a linear transformation (limited by 0 and Vk) on the original reference voltages, and therefore, provides the transmittance scaling policy a mechanism for adjusting the TFT-LCD transmittance function as shown in Figure 11a. The luminance function is shown in Figure 11b.

#. Transmittance Scaling for Reducing power Dissipation of a Backlit TFT-LCD
15
b *
(a)
=
(b)
Figure 11: (a) The LCD transmittance function (b) and the luminance function when using a programmable LCD reference driver.
The similar concept of PLRD has been implemented in TFT-LCD controllers such as [12] to control contrast or gamma-correction. The PLRD represents a class of linear transformations on the backlight-scaled image. It covers both brightness scaling (adjusting gu and gl simultaneously) and contrast scaling (adjusting gu-gl). On the other hand, non-linear transformations are not desired in transmittance scaling because they cannot preserve the uniformity of contrast.
3.3 Contrast Fidelity
(a) Original image
(b) Dim backlight to
50% without compensation
(c) Backlight
luminance dimming
(d) Transmittance
scaling
Figure 12: Luminance functions and visual effects of adjusting brightness (b), contrast (c), and both (d) when the backlight is dimmed to 50%.
The term contrast describes the concept of the differences between the dark and bright pixels. Brightness and contrast are the two most important properties of any image. In the Human Visual System [5][14], which models the perception of human
0 glx
1
1
t(x)
gu0 glx
1
1
t(x)
gu 0
b
x
L(x)
1
1
gl gu0
b
x
L(x)
1
1
gl gu

16 Chapter # vision as a three-stage processing, the brightness and contrast are perceived in the first two stages. Virtually every single display permits the users to adjust the brightness and contrast settings. For transmissive LCD monitors, the brightness control changes the backlight illumination and the contrast control changes the LCD transmittance function. Figure 12 shows how the brightness and contrast control change the luminance function and their visual effects when the maximum brightness is limited to 50%. Figure 12a depicts the original image of the USC girl. In Figure 12b, when the backlight is reduced to 50%, the image contrast is noticeably reduced. If we compensate for the contrast loss as shown in Figure 12c, then the darker (<50%) pixels will preserve their original brightness while the brighter (>50%) pixels will overshoot completely (there will be no contrast present among these pixels.) Figure 12d shows how the transmittance scaling generates a better image by balancing the contrast loss and number of overshot pixels. The luminance functions in Figure 12b and Figure 12d represent the following class of linear transformations that can be implemented by the PLRD as expressed in (9):
0, 0
, ,
, 1
( )
dx gl glccx d gl x gu where b d
gub gu x c
b t x
− ≤ ≤ =+ ≤ ≤ − =≤ ≤
⋅ = . (10)
Here (gl,0) and (gu,b) are the points where y=cx+d intersects y=0 and y=b, respectively. The luminance function consists of three regions: the undershot region [0,gl], the linear region [gl,gu], and the overshot region [gu,1]. In other words, the gl and gu are the darkest and the brightest pixel values that can be displayed without contrast distortion (overshooting or undershooting). Notice that the slope of the linear region is very close to that of the original luminance function, which is unity. The image has very few pixels in the undershot and overshot regions. Its histogram is shown in Figure 13a.
The kernel of transmittance scaling is to find the dissimilarity between the original and backlight-scaled images, which can be solely determined by examining the luminance function b.t(x). We define the contrast fidelity function as the derivative of b.t(x):
0, 0
, , 0 1
0, 1
( )x gl
c gl x gu ccgu x
f x
≤ <
≤ ≤ ≤ ≤ < ≤
=
.
(11)
c is limited between 0 and 1. If c>1, the contrast increases and deviates from that of the original image while the dynamic range [gl,gu] shrinks. The overall contrast fidelity decreases from this point, so we do not include c>1 in our solution space.
The contrast fidelity is defined without quantifying contrast itself, which has no universal definition [15] and cannot help solve the optimal transmittance scaling policy problem. However, the definition of contrast fidelity does convey the concept of the classical definitions of contrast such as Weber's or Michelson's that express contrast as the ratio of the luminance difference to the maximum luminance [5][14][15]. If the normalized image histogram providing the probability distribution
#. Transmittance Scaling for Reducing power Dissipation of a Backlit TFT-LCD
17
of the occurrence of pixel value x in the image is given as:
p(x)∈ [0,1], x=0..255, (12)
then the global contrast fidelity of the backlight-scaled image will be defined as:
( ) ( ).gu
C cgl
F f x p x= ⋅∑ (13)
Fc is a function of p, gl and gu. Finding the optimal solution that minimizes Fc is called the optimal transmittance scaling policy problem. More precisely, given the image, we would like to find the optimal backlight factor and the PLRD transformation function, which maximize the global contrast fidelity. The variables of optimization are b, gu, and gl.
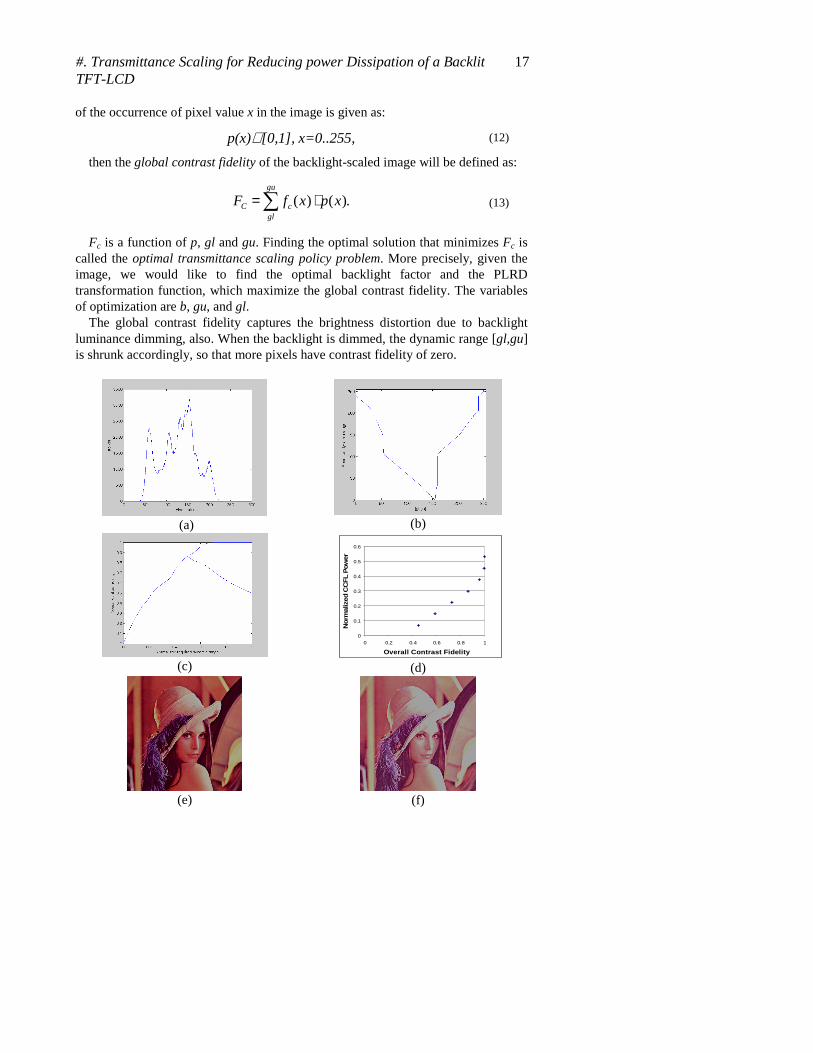
The global contrast fidelity captures the brightness distortion due to backlight luminance dimming, also. When the backlight is dimmed, the dynamic range [gl,gu] is shrunk accordingly, so that more pixels have contrast fidelity of zero.
(a)
(b)
(c) (d)
(e)
(f)
0
0.1
0.2
0.3
0.4
0.5
0.6
0 0.2 0.4 0.6 0.8 1
Overall Contrast Fidelity
Nor
mal
ized
CC
FL P
ow
er

18 Chapter #
Figure 13: (a) Histogram of the example image, (b) Optimal values of gl (left curve) and gl+dr (right curve) as functions of dynamic range dr, (c) Global contrast fidelity Fc as a function of dynamic range dr for b=1 (upper curve ) and b=0.5 (lower curve),
(d) Optimal solutions < Fc,Pbacklight>, (e) After transmittance scaling with 10% contrast distortion (f) After backlight luminance dimming.
3.4 Transmittance Scaling
To simplify the optimal transmittance scaling policy problem, our approach is first to find the optimal linear transmittance function for each given backlight factor. This problem is called the contrast fidelity optimization problem. In this simplified version, given the image and backlight factor, we would like to find the optimal PLRD transformation function that maximizes the global contrast fidelity. The variables of optimization are gu and gl. Next, we sweep the backlight factor domain to find the globally optimal solutions
Our goal is to find the optimal gl and gu that maximize the overall contrast fidelity Fc. After that, the optimal coefficients c and d can be calculated from (10). The optimal transmittance function t(x) that should be applied to the LCD can then be determined as:
0, 0
,
1, 1
( )
x gl
cx dgl x gu
bgu x
t x
≤ < + ≤ ≤ < ≤
= , (14)
Clearly the backlight should be concurrently dimmed to b. The optimal solution to the contrast fidelity optimization problem for an arbitrary
histogram can be found by the following procedures. Let dr=gu-gl denote the required dynamic range [gl,gu] and the backlight factor b denote the available dynamic range [0,b]. For each dr, we can find the required dynamic range [gl,gl+dr]
that maximizes ( )gl dr
gl
p x+
∑ . The optimal gl is found by scanning gl=0*256/k,
1*256/k,…(k-1)*256/k, where k represents the resolution of the PLRD in (9). Based on the histogram shown in Figure 13a, Figure 13b shows the optimal gl and gl+dr in the x axis as functions of dr in the y axis. The left and right curves are the optimal gl and gl+dr, respectively for different dr values. This means that when the backlight is dimmed to dr, by using the available dynamic range [0,dr] from the transmissive LCD to display the required dynamic range [gl,gl+dr] by the image, we are able to generate a backlight-scaled image that minimizes the number of undershot or overshot pixels.
Now consider the contrast fidelity c in (14). If the available dynamic range is larger or equal to the required dynamic range (dr≤b), the optimal contrast fidelity
c=1 can be obtained with d≤0 and the overall contrast fidelity Fc is simply ( )gu
gl
p x∑ .
Otherwise, if dr>b, the highest possible contrast fidelity is c=b/dr with t=1 and

#. Transmittance Scaling for Reducing power Dissipation of a Backlit TFT-LCD
19
d=0. Thus, Fc becomes
( ).gl dr
gl
bp x
dr
+
∑ (15)
Figure 13c shows Fc as a function of dr for b=1 (upper) and b=0.5 (lower). The Fc increases as dr increases from dr=0 to dr=0.5. For the b=1 curve, the example image needs no more than 70% of available dynamic range to represent the whole histogram with the best contrast fidelity c=1. For the b=0.5 curve, the Fc decreases
from dr=0.5 to dr=1 because in (15) the ( )gl dr
gl
p x+
∑ increases slower than dr. The
optimal Fc happens at dr=0.5 and the contrast fidelity c=1 in the region [gl,gl+dr]. Notice that c=1 is not always the optimal solution when dr>b. If the distribution in the histogram is not normal (e.g. has two peaks) the optimal dr can be greater than
b, such that ( )gl dr
gl
p x+
∑ can be increased. For each backlight factor b, the complexity of
finding the optimal Fc, gl and gu is O(k2) with k a small number (<12). Given the solution to the contrast fidelity optimization problem for any backlight
factor b, the optimal transmittance scaling policy problem can be solved by sweeping the backlight factor range between bmin and bmax, where bmin and bmax are user-specified minimum and maximum backlight factors, respectively. All of the optimal solutions are recorded along with their power consumptions. The inferior solutions, i.e., those with higher or equal power consumptions but lower fidelity, are discarded. The remaining solutions are stored for the transmittance scaling policy to select the most suitable solution according to the user preferences. Figure 13d shows the optimal solutions for b=0.8, 0.7,…0.2 from top-right to bottom-left. The x and y coordinates of each solution indicate the global contrast fidelity and backlight power, respectively. The two inferior solutions for b=1.0 and 0.9 are discarded because they have the same fidelity, Fc=1, as that of b=0.8. Results show that more than 50% power savings can be achieved by the transmittance scaling policy while maintaining almost 100% of contrast fidelity at a backlight factor of 70%. The visual effect is shown in Figure 13e, in comparison with Figure 13f generated from the brightness-invariant policy from (8).
A pseudo-code transmittance scaling procedure is provided below. transmittance_scaling(p[0..255],k) { cdf[0]=p[0]; for (i=0; i<256; i++) cdf[i]+=p[i];
for (b=bmin; b<=bmax; b+=(1/k)) { Pb=Pbacklight(b); for (dr=1; dr<=255; dr+=(256/k)) { Rmax=-1; for (g=0; g<=255-dr; g+=(256/k)) { R=cdf[g+dr]-cdf[g]; if (R>Rmax) { gl=g;

20 Chapter #
Rmax=R; } } } if (b>=dr) Fc=R;
else Fc=(b/dr)*R; gu=gl+dr; Sol = <Fc,Pb,b,gl,gu>; Search solution database for <Fc,*,*,*> and <*,Pb,*,*>; if (Sol is not inferior) Insert Sol into solution database; } }
We use a set of benchmark images from the USC SIPI Image Database (USID)
[16]. The USID is considered the de facto benchmark suite in the signal and image processing research field [5]. The results reported here are from 8 color images from volume 3 of USID. All of these images are 256 by 256 pixel images. The color depth is 24 bits, i.e., 8 bits per color-channel in the range of 0-255.
Tables I and II show the results of the optimal transmittance scaling policies for the benchmark images. We use 90% as the global contrast fidelity threshold to find the minimum backlight factor and the optimal transmittance transformation. The results show an average of 3.7X power savings within 10% of contrast distortion.
Table #-1. Optimal transmittance scaling solutions to the USID benchmark images.
Image
#
Backlight factor
b
Contrast fidelity
c
Brightness shift
d
Overall fidelity
Fc
CCFL Power (mW)
4.1.01 0.51 1 0.00 0.91 803.84
4.1.02 0.38 1 0.00 0.91 549.99
4.1.03 0.65 1 0.00 0.91 1077.21
4.1.04 0.75 1 0.00 0.91 1272.47
4.1.05 0.75 1 0.01 0.91 1272.47
4.1.06 0.84 1 0.04 0.90 1448.21
4.1.07 0.71 1 0.06 0.90 1194.36
4.1.08 0.72 1 0.04 0.92 1213.89
Table #-2. Original images (upper images) vs. transmittance-scaled images (lower images).

#. Transmittance Scaling for Reducing power Dissipation of a Backlit TFT-LCD
21
4. SUMMARY
This chapter presented a technique for reducing the backlight illumination while compensating for the luminance loss by adjusting the transmittance function of the TFT-LCD panel. First, background information about CCFL and TFT-LCD monitors was presented. Next, a contrast distortion metric to quantify the image quality loss after dimming backlight was described. Finally, the transmittance scaling problem was precisely formulated and solved. Experimental results showed that an average of 3.7X power saving can be achieved with a mere 10% contrast distortion. The proposed transmittance scaling technique was applied to still images only. However, the basic technique can be extended to video streams. For video, the decision about the backlight scaling factor is made for each frame one at a time. Consequently, the backlight factor may change significantly across consecutive frames. The enormous change in the backlight factor may introduce inter-frame brightness distortion to the observer. Therefore, when the transmittance scaling

22 Chapter # technique is applied to video applications such as an MPEG2 decoder, the inter-frame change in the backlight dimming factor should be controlled carefully such that the change is hardly noticeable to human eyes.
REFERENCES
[1] T. Simunic et al., “Event-driven power management,” IEEE Tran. Computer-Aided Design of Integrated Circuits and Systems, vol. 20, pp. 840-857, July 2001.
[2] I. Choi, H. Shim, and N. Chang, “Low-power color TFT LCD display for hand-held embedded systems,” Proc. of Symp. on Low Power Electronics and Design, Aug. 2002, pp. 112-117.
[3] ANSI/IES. 1986. Nomenclature and Definitions for Illuminating Engineering, ANSI/IES RP-16-1986. New York, NY: Illuminating Engineering Society of North America.
[4] Radiosity: A Programmer’s Perspective by Ian Ashdown, © October 2002 by Heart Consultants Limited. (Originally published by John Wiley & Sons in 1994.)
[5] W. K. Pratt, Digital Image Processing, Wiley Interscience, 1991.
[6] Maxim, MAX1610 Digitally Controlled CCFL Backlight Power Supply.
[7] J. Williams, “A fourth generation of LCD backlight technology,” Linear Technology Application Note 65, Nov. 1995.
[8] LG Philips, LP064V1 Liquid Crystal Display.
[9] Stanley Electric Co., Ltd., [CFL] cold cathode fluorescent lamps, 2003.
[10] Minolta, Minolta Precision Luminance Meter LS-100.
[11] Analog Devices, AD8511 11-Channel, Muxed Input LCD Reference Drivers.
[12] Hitachi, HD66753 168x132-dot Graphics LCD Controller/Driver with Bit-operation Functions, 2003.
[13] H. Aoki, “Dynamic characterization of a-Si TFT-LCD pixels,” HP Labs 1996 Technical Reports (HPL-96-19), February 21, 1996.
[14] S. Daly, “The visible differences predictor: an algorithm for the assessment of image fidelity,” Digital Images and Human Vision, pp. 179-206, Cambridge: MIT Press, 1993.
[15] E. Peli, “Contrast in complex images,” J. Opt. Soc. Amer. A, vol. 10, no. 10, pp. 2032-2040, Oct. 1990.
[16] A. G. Weber, “The USC-SIPI image database version 5,” USC-SIPI Report #315, Oct. 1997. Also http://sipi.usc.edu/services/database/Database.html.
[17] Toshihisa Tsukada, TFT/LCD, Liquid-Crystal Displays Addressed by Tin-Film Transistors, Amsterdam: Gordon and Breach Publishers, 1996.
[18] W. C. O'Mara, Liquid crystal flat panel displays: manufacturing science & technology, New York: Van Nostrand Reinhold, 1993.