Chapter Six - Zendesk€¦ · Web view · 2016-12-01Chapter Eleven. Reports. This chapter ......
37
Chapter Eleven Reports This chapter will cover various reports and reporting options available in Yardi Voyager 6.0. Yardi Voyager version 6.0 introduced the concept of analytic reporting for several different types of commonly used reports. These analytic reports allow the user to enter a set of filter criteria and generated several different reports. The reports may be displayed on the screen or exported to Excel or PDF, all from within the analytics interface. Screen reports also offer drill-down capability, where detailed information pertaining to a report item may be viewed by clicking on that item. In This Document Residential Analytics.....................................2 Financial Analytics......................................6 Using Property Attributes with Financial Analytics......10 Payable Analytics........................................12 Work Order Analytics.....................................14 Property Reporting.......................................18 Affordable Gross Potential Rent Report..................18 Affordable Rent Roll....................................20 Tax Credit Unit Set Aside Report........................22 Yardi Voyager ver. 6.008 – Tax Credit & Market Page 11 – 1 Rev. 10/01/2011
-
Upload
trankhuong -
Category
Documents
-
view
214 -
download
1
Transcript of Chapter Six - Zendesk€¦ · Web view · 2016-12-01Chapter Eleven. Reports. This chapter ......

Chapter Eleven
Reports
This chapter will cover various reports and reporting options available in Yardi Voyager 6.0. Yardi Voyager version 6.0 introduced the concept of analytic reporting for several different types of commonly used reports. These analytic reports allow the user to enter a set of filter criteria and generated several different reports. The reports may be displayed on the screen or exported to Excel or PDF, all from within the analytics interface. Screen reports also offer drill-down capability, where detailed information pertaining to a report item may be viewed by clicking on that item.
In This Document
Residential Analytics...........................................................................................................2
Financial Analytics..........................................................................................................6
Using Property Attributes with Financial Analytics......................................................10
Payable Analytics..............................................................................................................12
Work Order Analytics........................................................................................................14
Property Reporting.............................................................................................................18
Affordable Gross Potential Rent Report........................................................................18
Affordable Rent Roll.....................................................................................................20
Tax Credit Unit Set Aside Report..................................................................................22
Yardi Voyager ver. 6.008 – Tax Credit & Market Page 11 – 1
Rev. 10/01/2011

Residential Analytics
Residential Analytics now generates reports more quickly and includes the ability to display graphs and export files either as PDFs or in Excel format. Users can easily generate reports summarized at the property, unit-type, unit, and resident levels.
These available reports include Rent Roll, Gross Potential Rent, Market Rent Schedule, Unit Availability, Resident Activity, Conversion Ratios, Lease Expirations, and Aged Receivables. Many of the reports include links that let the user drill down for more detail by clicking on hyperlinked (i.e., blue-colored) results.
To access Residential Analytics, from the Left-Side Menu, click “Analytics,” “Operations” and then select “Residential.”
Yardi Voyager ver. 6.008 – Tax Credit & Market Page 11 – 2
Rev. 10/01/2011

The Residential Reports filter screen will be displayed.
The filter options available for Residential Analytics are as follows: Property – Enter a property or list code, or select one from a popup window by
clicking the link. Unit Type – Report only on a specific unit type by entering a unit type code. Unit – Report only on a specific unit by entering a unit code. Date – Enter a date or range of dates for the report. Month / Year – Enter a month or range of months for the report. Report Type – Select the report that is to be displayed. Choosing different reports
may change some of the filter options. Summarize By – Depending on the Report Type chosen, the options may include
Property, Unit Type, Unit or others. Show Graphs – Mark this box to display, on appropriate reports, graphs from the
report data. Show Grids – Mark this box to display gridlines in the report for easier viewing.
Click on Excel, PDF, or Display to display to screen.
The corresponding report will be displayed.
Click on any blue-colored result to review specific details pertaining to that data in a separate screen.
Yardi Voyager ver. 6.008 – Tax Credit & Market Page 11 – 3
Rev. 10/01/2011

In the example above, the Resident code, or “tCode” and the Resident’s balance are colored blue and therefore act as direct hyperlinks to respective records. In this case, to view the Resident’s record directly from the Analytics Report screen, simply click on the Resident’s code.
The Resident screen will be displayed.
At this point, any function or information can be accessed within the Resident record just as if it was accessed via a typical search from the Voyager Dashboard.
Residential Analytics reports provide a quick way to view multiple report types in a single location while making only minimal changes to the filter settings.
NOTE: When filtering for different reports, it’s helpful to remember that there are various click-able hyperlinks that appear within the filtered results. Should results need
Yardi Voyager ver. 6.008 – Tax Credit & Market Page 11 – 4
Rev. 10/01/2011

to be investigated in greater detail, it’s often easier to do so directly from the report’s results by clicking the hyperlink(s) (if possible) as opposed to navigating from the Left-Side Menu or Dashboard. Oftentimes, hyperlinked results will be displayed in a pop-up window, allowing the user to stay within the Analytics report window while at the same time viewing corresponding detailed records in another.
Yardi Voyager ver. 6.008 – Tax Credit & Market Page 11 – 5
Rev. 10/01/2011
Financial Analytics
Yardi has the ability to generate Income Statement, Trial Balance, Balance Sheet, Cash Flow and other financial reports by single property or multiple properties through the utilization of Financial Analytics. This will allow the end user to choose the report to populate financial data per specific filter criteria. Financial Analytics can be run to print financial statements for accrual accounting.
One of the benefits of using Financial Analytics reports is that the user may enter filter information once, and then generate a host of different financial reports by changing only the values in the “Account Tree” and “Report Type” fields. Depending on the report selected in the “Report Type” field, the user may need to modify the dates entered in the filter and may be presented with other report options, such as options for grouping the resulting data. This is more efficient than having to navigate to several different reports in the Voyager Left-Side Menu and completing the filter for each report.
To access Financial Analytics, from the Left-Side Menu, click “Analytics,” “Financial” and then select “Financial Analytics.”
Yardi Voyager ver. 6.008 – Tax Credit & Market Page 11 – 6
Rev. 10/01/2011

The Financial Reports screen will be displayed.
Enter the following information on the Financial Reports filter screen: Property – Enter the property code, or click Property to select a Property or
Property List. Book – Enter Cash or Accrual. Account Tree – Select an Account Tree based on the chart below. Report Type – Select a financial report from the list of available choices. Period – Enter the report period.
Listed below are the Yardi Account Tree names and the Report Types associated with these names. These should be entered in the filters for “Account Tree” and “Report Type.”
Yardi Account Tree Yardi Report NameVictory Housing / GEDCO /
Section 8 Account Tree ysi_bs Balance Sheet hud_bs
std_is Income Statement hud_isysi_tb Trial Balance hud_tbstd_cf Cash Flow hud_cfysi_bf Standard Budget N/A
Financial Analytics reports can be generated to display on the screen in Grid, Graph or Account format. Examples are displayed below. In addition, the report can be generated via Excel or PDF. Click the “Display” button to generate the report on the screen. Use the “Grid,” “Graph” or “Account” options as desired to produce the results shown below. Use the “PDF” and “Excel” buttons to generate report output in these file formats. The “Clear” button allows the user to clear the entire filter of entries. Finally, the “Decimals” checkbox is an on/off toggle that determines whether the reports display whole figures or figures which include decimals.
Reports may be further narrowed by entering criteria in the Property Attributes sections of the Dashboard, located in the two center columns. It is recommended to use the links to choose an available attribute from a pop-up window, as misspelling may result in errors or inaccurate reports.
Grid Format
Yardi Voyager ver. 6.008 – Tax Credit & Market Page 11 – 7
Rev. 10/01/2011

Graph Format
Account Format
Once the report is displayed on the screen, additional account information is available by drilling down on the hyperlinked, blue-colored data.
Yardi Voyager ver. 6.008 – Tax Credit & Market Page 11 – 8
Rev. 10/01/2011

A new window will be displayed.
The sample screen shot above reflects the details of the $101 debit transaction from GL Account 1005000-00 in the screen shot displayed at the top of this page. Notice that links to the corresponding Receipt and Journal Entry are available to review in more detail directly from this window.
NOTE: When filtering for different reports, it’s helpful to remember that there are various click-able hyperlinks that appear within the filtered results. Should results need to be investigated in greater detail, it’s often easier to do so directly from the report’s results by clicking the hyperlink(s) (if possible) as opposed to navigating from the Left-Side Menu or Dashboard. Oftentimes, hyperlinked results will be displayed in a pop-up window, allowing the user to stay within the Analytics report window while at the same time viewing corresponding detailed records in another.
Yardi Voyager ver. 6.008 – Tax Credit & Market Page 11 – 9
Rev. 10/01/2011

Using Property Attributes with Financial Analytics
Certain property attributes are configured in the database, thereby allowing Financial Analytics reports two methods of reporting – Consolidated and Columnar – that make use of the attribute data. Attributes are located in two places within the Financial Analytics Dashboard – within the Report Type drop-down menu and in the second column of the Financial Analytics Dashboard.
Consolidated Reports
Consolidated reports are generated by choosing an attribute or attributes in the second column of the dashboard. When applied, the Month to Date and Year to Date columns of a report will reflect consolidated figures representing all properties that have the selected attribute value.
Yardi Voyager ver. 6.008 – Tax Credit & Market Page 11 – 10
Rev. 10/01/2011

Columnar Reports
Columnar reports are generated by selecting the desired attribute in the Report Type drop-down list. Once selected, attribute value(s) may be entered in the second column of the Dashboard. Used in combination with an appropriate Account Tree, the report will display a column for the attribute type with values for properties that have the selected attribute values. The rows of the report are driven by the Account Tree that has been chosen.
When using columnar reporting, the “Report Columns” filter item becomes available. This list provides several other column options that can be included in the report, such as Actual, Budget, Both and Variance. In order to activate the field, the report must first be displayed to the screen, after which the columns option is available.
Yardi Voyager ver. 6.008 – Tax Credit & Market Page 11 – 11
Rev. 10/01/2011

Payable Analytics
Similar to Financial Analytics, Payable Analytics allow the user to input a set of filter criteria and then generate a collection of Payable reports for a property or list of properties. The filter criteria are persistent, which allows the series of reports to be generated quickly, with no or minor changes to the filter necessary between reports. As with other analytics reports, the results can be displayed on the screen with the capability to drill down for detailed information, along with distribution via PDF or Excel.
To access Payable Analytics, from the Left-Side Menu, click “Analytics,” “Operations” and then select “Aged Payable.”
Yardi Voyager ver. 6.008 – Tax Credit & Market Page 11 – 12
Rev. 10/01/2011

The Payable Analytics filter screen will be displayed.
Complete the following fields within the Payable Analytics filter: Report Type – Choose the report that should be displayed. Property – Enter a property or property list code, or click the link to choose from a
pop-up list. Account – Leave blank. Control No. – Enter a beginning and ending Payable number to limit the results to
that subset, or leave blank. Batch No. – Enter a Payable Batch number to limit the results to that subset, or leave
blank. Period – Enter a beginning and ending month. To view only one month of data, enter
the same period in both fields. Date – Enter a beginning and ending date for the report. To view only one day, enter
the same date in both fields.
NOTE: Depending on the Report Type selected, other filter options will be made available by which to filter the corresponding results.
Click “Submit.”
Yardi Voyager ver. 6.008 – Tax Credit & Market Page 11 – 13
Rev. 10/01/2011

Work Order Analytics
Similar to other analytics, Work Order Analytics allow the user to input a set of filter criteria and then generate a collection of Work Order reports for a property or list of properties. The filter criteria are persistent, which allows the series of reports to be generated quickly, with no or minor changes to the filter necessary between reports. As with other analytics reports, the results can be displayed on the screen with the capability to drill down for detailed information, along with distribution via PDF or Excel.
To access Payable Analytics, from the Left-Side Menu, click “Analytics,” “Operations” and then select “Aged Payable.”
Yardi Voyager ver. 6.008 – Tax Credit & Market Page 11 – 14
Rev. 10/01/2011

The Work Order Analytics screen will be displayed.
Complete the following fields within the Work Order Analytics filter: Report Type – Choose the report that should be displayed. Summarize By – Choose an option by which to summarize the corresponding report
results. WO # – Leave blank. Property – Enter a property or property list code, or click the link to choose from a
pop-up list. Unit – Enter a unit or units or leave blank.
NOTE: When entering multiple units, the unit numbers must be separated by a caret ^ symbol (e.g., 102^103^104, etc.).
Vendor – Leave blank. Template – Leave blank. Asset – Leave blank. Employee – Leave blank. Skill – Leave blank. Category – Select a category or leave blank. SubCategory – Leave blank. Status – Select a status or leave blank. Priority – Select a priority or leave blank. Call Date – Enter a from-to date in order to review Work Orders with call dates
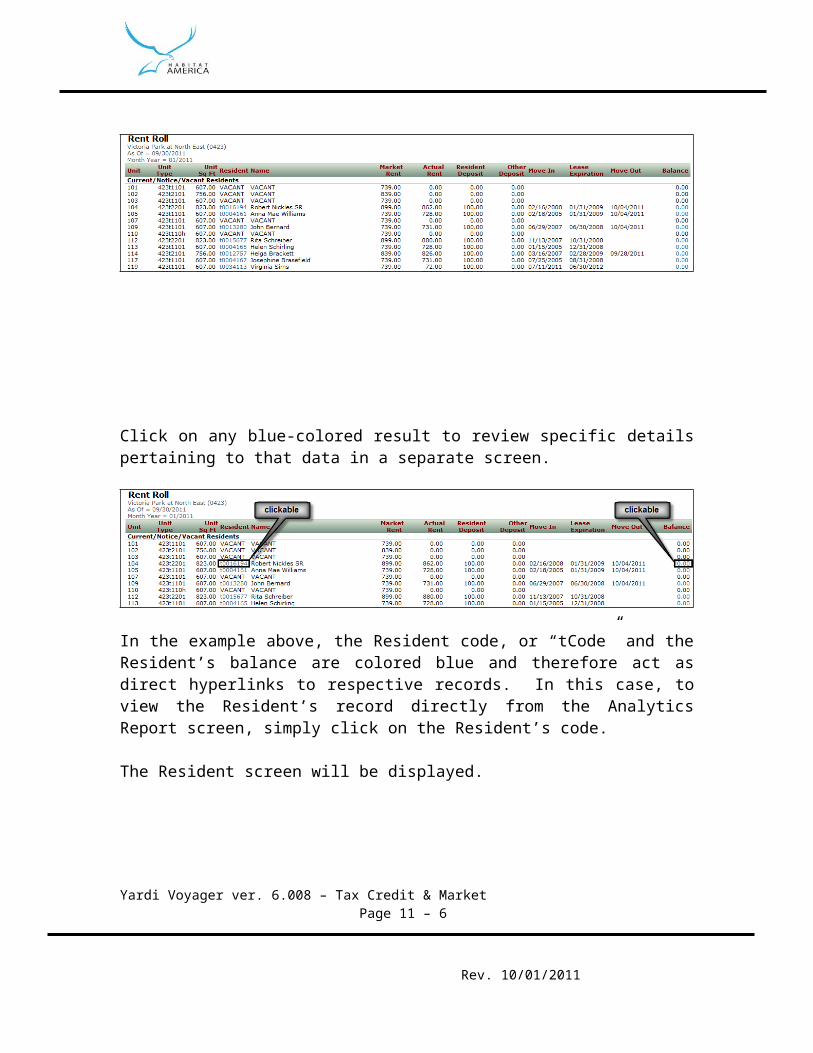
occurring between the selected range. Schedule Date – Enter a from-to date in order to review Work Orders with schedule
dates occurring between the selected range. Complete Date – Enter a from-to date in order to review Work Orders with
completed dates occurring between the selected range. Approval Status – Select an approval status or leave blank.
Click “Display.”
Status Report
Yardi Voyager ver. 6.008 – Tax Credit & Market Page 11 – 15
Rev. 10/01/2011

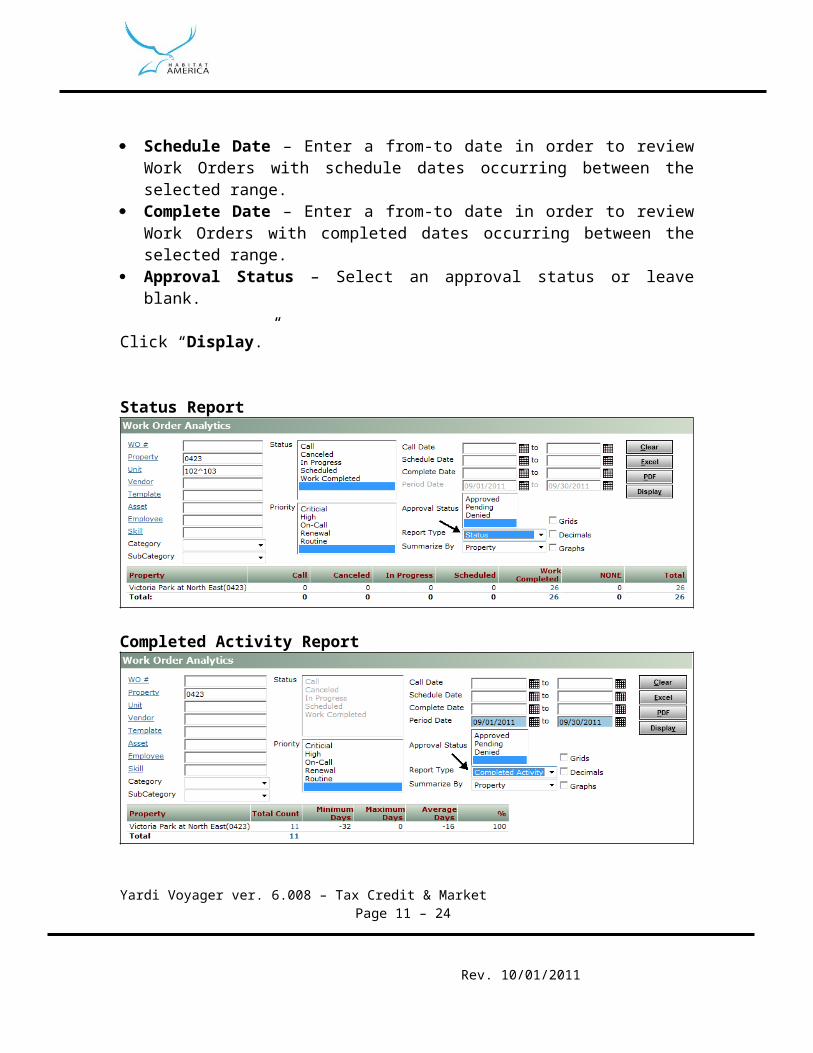
Completed Activity Report
Period Activity Report
Yardi Voyager ver. 6.008 – Tax Credit & Market Page 11 – 16
Rev. 10/01/2011

NOTE: When filtering for different reports, it’s helpful to remember that there are various click-able hyperlinks that appear within the filtered results. Should results need to be investigated in greater detail, it’s often easier to do so directly from the report’s results by clicking the hyperlink(s) (if possible) as opposed to navigating from the Left-Side Menu or Dashboard. Oftentimes, hyperlinked results will be displayed in a pop-up window, allowing the user to stay within the Analytics report window while at the same time viewing corresponding detailed records in another.
Yardi Voyager ver. 6.008 – Tax Credit & Market Page 11 – 17
Rev. 10/01/2011

Property Reporting
Property Reports are generally run for a single property at a time, although most can also be run for property lists. These reports tend to deal with a level of detail that is best reserved for analysis of individual properties.
Affordable Gross Potential Rent Report
The Affordable Gross Potential Rent (GPR) report is one of the critical reports for any property management concern. This version of the report differs from the standard GPR report in that it will include subsidy rent amounts.
To access the Affordable GPR report, from the Left-Side Menu, click “Reports,” “Affordable Reports” and then select “Affordable GPR Report.”
Yardi Voyager ver. 6.008 – Tax Credit & Market Page 11 – 18
Rev. 10/01/2011

The Affordable Gross Potential Rent filter screen will be displayed.
Complete the following information within the Affordable Gross Potential Rent filter screen: Property – Enter a property code or click the link to select one from the popup
window. As Of Date – Enter the last day of the month for which the report is to be run. As Of Month – Enter the month in mm/yyyy format for which the report is to be run. Show Model-Down-Admin units – Select whether to display information on non
revenue producing units.
Click “Submit.”
The Affordable Gross Potential Rent report will be displayed.
Yardi Voyager ver. 6.008 – Tax Credit & Market Page 11 – 19
Rev. 10/01/2011

Affordable Rent Roll
In any rental operation, the Rent Roll report is one of the most important management tools available. The Affordable Rent Roll improves on the standard version for Affordable concerns by adding several fields related to Affordable Housing. The report shows, at a glance, Affordable Programs, Contract information, rents and subsidies, and more.
To access the Affordable Rent Roll, from the Left-Side Menu, click “Reports,” “Affordable Reports” and then select “Affordable Rent Roll.”
Yardi Voyager ver. 6.008 – Tax Credit & Market Page 11 – 20
Rev. 10/01/2011

The Affordable Rent Roll filter screen will be displayed.
Complete the following information within the Affordable Rent Roll filter screen: Property – Enter a property code or click the link to select a property. Tenant – Leave blank for standard reporting. Contract – Enter a contract number or click the link to select one from the popup
window. This allows the user to only view the residents on a specific contract. As of Date – Enter the date for which the report is to be run. Sort By – Sort the report by either Unit or Tenant.
Click “Submit.”
The Affordable Rent Roll will be displayed.
Yardi Voyager ver. 6.008 – Tax Credit & Market Page 11 – 21
Rev. 10/01/2011

Tax Credit Unit Set Aside Report
The Tax Credit Unit Set Aside Report allows the user to view a complete inventory of a property’s units and their assigned set aside percentages.
To access the Tax Credit Unit Set Aside report, from the Left-Side Menu, click “Reports,” “Tax Credit Reports” and then select “Tax Credit Unit Set Aside Report.”
Yardi Voyager ver. 6.008 – Tax Credit & Market Page 11 – 22
Rev. 10/01/2011

The Tax Credit Unit Set Aside Report filter will be displayed.
Enter the property code for a tax credit property and click “Submit.”
The Tax Credit Unit Set Aside Report will be displayed.
Yardi Voyager ver. 6.008 – Tax Credit & Market Page 11 – 23
Rev. 10/01/2011
This page is intentionally left blank.
Yardi Voyager ver. 6.008 – Tax Credit & Market Page 11 – 24
Rev. 10/01/2011