Chapter Six Process Costing COPYRIGHT © 2012 Nelson Education Ltd.
70
Chapter Six Process Costing COPYRIGHT © 2012 Nelson Education Ltd.
-
Upload
franklin-preston -
Category
Documents
-
view
214 -
download
0
Transcript of Chapter Six Process Costing COPYRIGHT © 2012 Nelson Education Ltd.

Chapter SixProcess Costing
Chapter SixProcess Costing
COPYRIGHT © 2012 Nelson Education Ltd.

COPYRIGHT © 2012 Nelson Education Ltd.
Learning ObjectivesLearning Objectives
1. Describe the basic characteristics and cost flows associated with process manufacturing
2. Define equivalent units and explain their role in process costing. Explain the differences between the weighted average method and the FIFO method of accounting for process costs
3. Prepare a departmental production report using the weighted average method
4. Explain how non-uniform inputs and multiple processing departments affect process costing
5. (Appendix) Prepare a departmental production report using the FIFO method
6-2
OBJECTIVE OBJECTIVE 11
Describe the basic characteristics and cost
flows associated with process manufacturing

COPYRIGHT © 2012 Nelson Education Ltd.
Characteristics of Process ManufacturingCharacteristics of Process Manufacturing
Large manufacturing plants
Tire manufacturers
Food
Process costing works well whenever relatively homogeneous products pass through a series of
processes and they receive similar amount of manufacturing costs
Example Industries:
Chemicals
6-4

COPYRIGHT © 2012 Nelson Education Ltd.
Types of ProcessesTypes of Processes
Sequential processingRequires that units pass through one process before they
can be worked on in later processes
Parallel processingPartially completed units can be worked on simultaneously in
different processes and then brought together in a final process for completion
6-5

COPYRIGHT © 2012 Nelson Education Ltd.
Raw Materials Cost FlowRaw Materials Cost Flow
Manufacturing cost flows are same as those for a job-order system
Raw Materials
Materials purchases
As raw materials are purchased, cost of these materials flow into a raw
materials account
6-6
COPYRIGHT © 2012 Nelson Education Ltd.
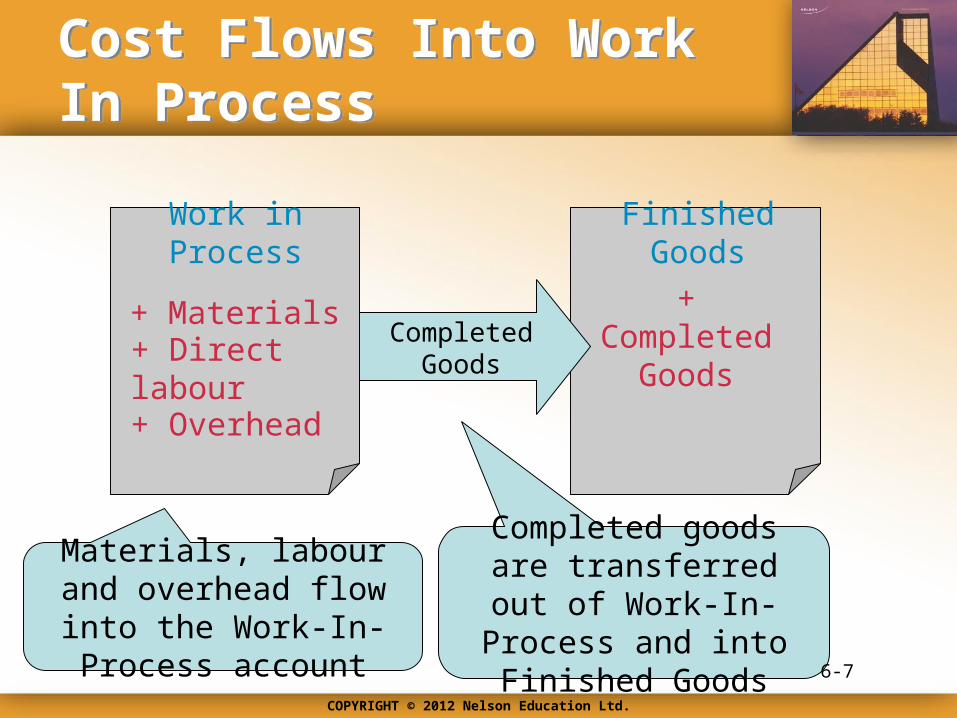
Cost Flows Into Work In ProcessCost Flows Into Work In Process
Work in Process
+ Materials
+ Direct labour
+ Overhead
Finished Goods
+ Completed Goods
CompletedGoods
Completed goods are transferred out of Work-
In-Process and into Finished Goods 6-7
Materials, labour and overhead flow into the
Work-In-Process account

COPYRIGHT © 2012 Nelson Education Ltd.
Cost Flows Into Work In ProcessCost Flows Into Work In Process
Finished Goods
+ Completed Goods
Cost of Goods Sold
+ Sold GoodsSoldGoods
Goods that are sold are transferred out of Finished Goods
and into Cost of Goods Sold
6-8

COPYRIGHT © 2012 Nelson Education Ltd.
Example: Cornerstone 6-1Example: Cornerstone 6-1
6-9
Information:
Picking Dept.
Healthblend produces 2,000 bottles of multivitamins with the following costs:
Encapsulating Dept.
Direct materialsDirect labour
$1,700
Applied overhead
Bottling Dept.
$1,000 $80050 60 300
450 500 600
How to Calculate Cost Flows Without Work-In-Process (WIP)
• Calculate the costs transferred out of each department• Prepare journal entries that reflect these cost transfers
Required:
COPYRIGHT © 2012 Nelson Education Ltd.
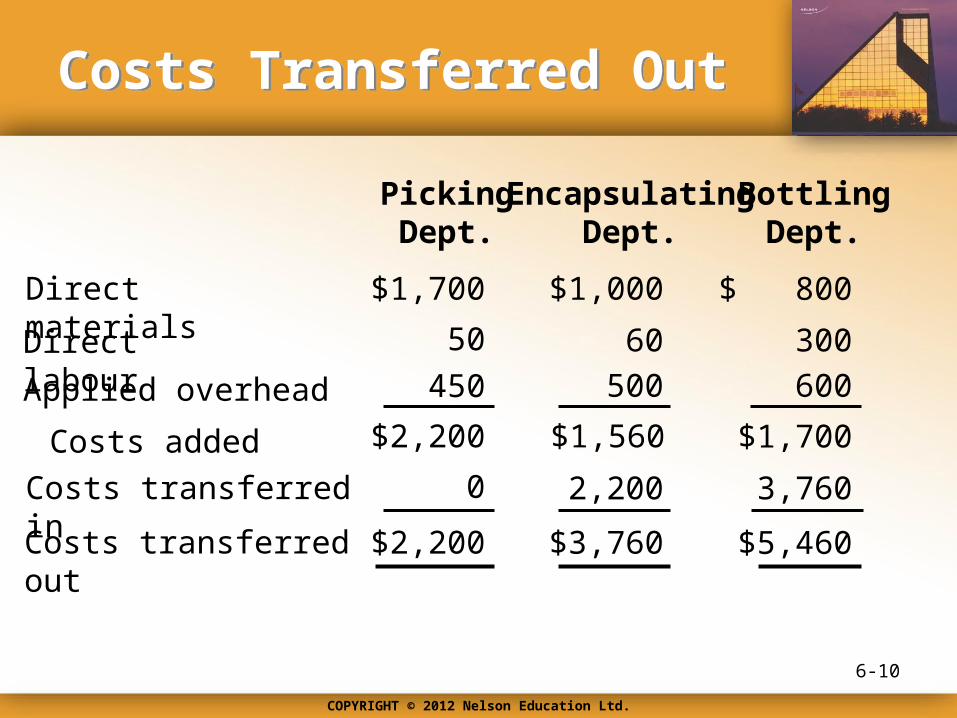
Costs Transferred OutCosts Transferred Out
6-10
Picking Dept.
Encapsulating Dept.
Direct materials
Direct labour
$1,700
Applied overhead
Bottling Dept.
$1,000 $ 800
50 60 300
450 500 600
Costs added $2,200 $1,560 $1,700
Costs transferred in 0 3,7602,200
Costs transferred out $2,200 $3,760 $5,460

COPYRIGHT © 2012 Nelson Education Ltd.
Journal EntriesJournal Entries
Work in Process (Encapsulating)
Work in Process (Picking)
$2,200
$2,200
Work in Process (Bottling)
Work in Process (Encapsulating)
$3,760
$3,760
Finished Goods $5,460
Work in Process (Bottling) $5,460
6-11

COPYRIGHT © 2012 Nelson Education Ltd.
Transferred-In CostsTransferred-In Costs
Transferred-In Costs are costs transferred from a prior process to a subsequent process
From the viewpoint of the subsequent process, transferred-in costs are a type of raw material cost
6-12
COPYRIGHT © 2012 Nelson Education Ltd.
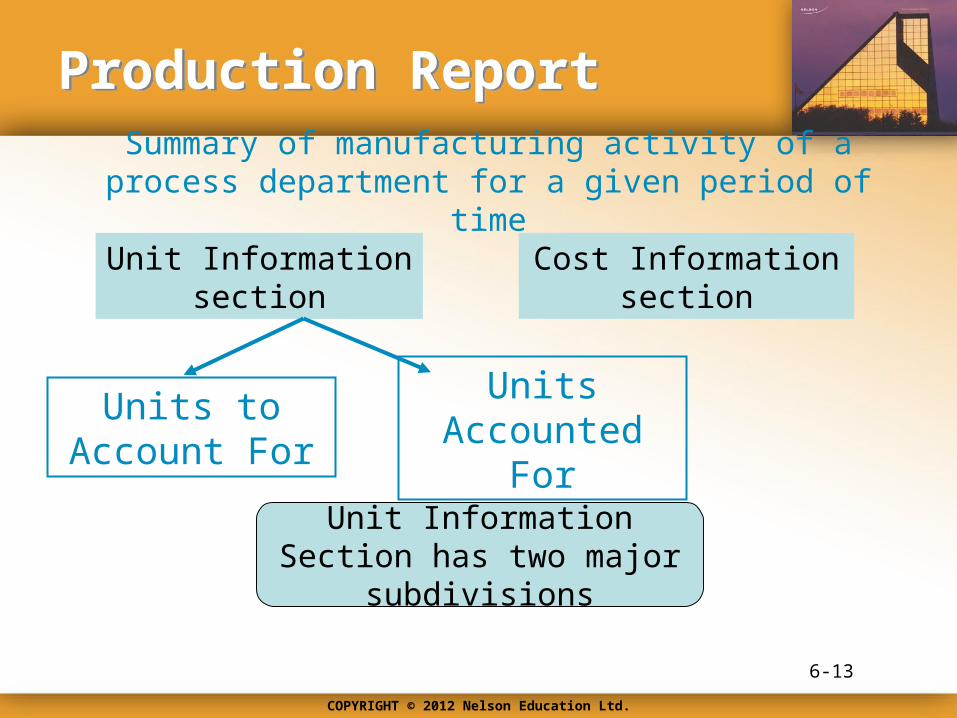
Production ReportProduction Report
Summary of manufacturing activity of a process department for a given period of time
Unit Information section
Cost Information section
Units to Account For
Units Accounted For
Unit Information Section has two major subdivisions
6-13

COPYRIGHT © 2012 Nelson Education Ltd.
Production ReportProduction Report
Unit Information section
Cost Information section
Costs to Account For
Costs Accounted For
Cost Information Section has two major subdivisions
6-14

OBJECTIVE OBJECTIVE 22
Define equivalent units and explain their role in process
costing. Explain the differences between the weighted average
method and the FIFO method of accounting for process costs
COPYRIGHT © 2012 Nelson Education Ltd.
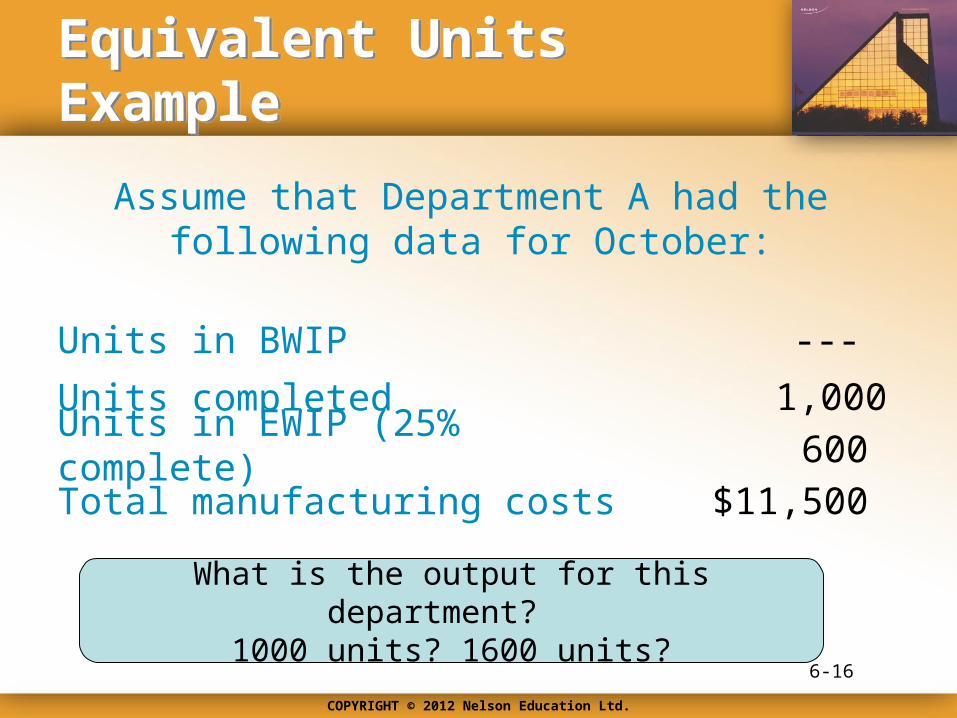
Equivalent Units ExampleEquivalent Units Example
Assume that Department A had the following data for October:
Units in BWIP ---
Units completed 1,000Units in EWIP (25% complete) 600
Total manufacturing costs $11,500
What is the output for this department? 1000 units? 1600 units?
6-16
COPYRIGHT © 2012 Nelson Education Ltd.
Equivalent Units of OutputEquivalent Units of Output
• Equivalent units– Total number of complete units that could have been
produced given the total manufacturing effort used during the period
• Dilemma– Some units are physically complete– Some units are not complete
6-17

COPYRIGHT © 2012 Nelson Education Ltd.
Example: Cornerstone 6-2Example: Cornerstone 6-2
6-18
Information:
October Data:
Calculate the equivalent units for October
1,000 units completed
600 units25 percent complete
Required:
How to Calculate Equivalent Units of Production:No Beginning Work-In-Process

COPYRIGHT © 2012 Nelson Education Ltd.
Equivalent UnitsEquivalent Units
6-19
Equivalent Units
1,150
Units Completed 1,000
Units in Ending WIP × 25% complete 150

COPYRIGHT © 2012 Nelson Education Ltd.
Example: Cornerstone 6-3Example: Cornerstone 6-3
6-20
Information:
Manufacturing Costs for the period
Units Transferred Out11,500
Units in Ending Work In Process(25% Complete) 600
1,000
How To Measure Output and Assign Costs: No Beginning Work-In-Process
• Calculate the unit cost• Calculate the cost of goods transferred out and
the cost of ending work-in-process (EWIP)
Required:
COPYRIGHT © 2012 Nelson Education Ltd.
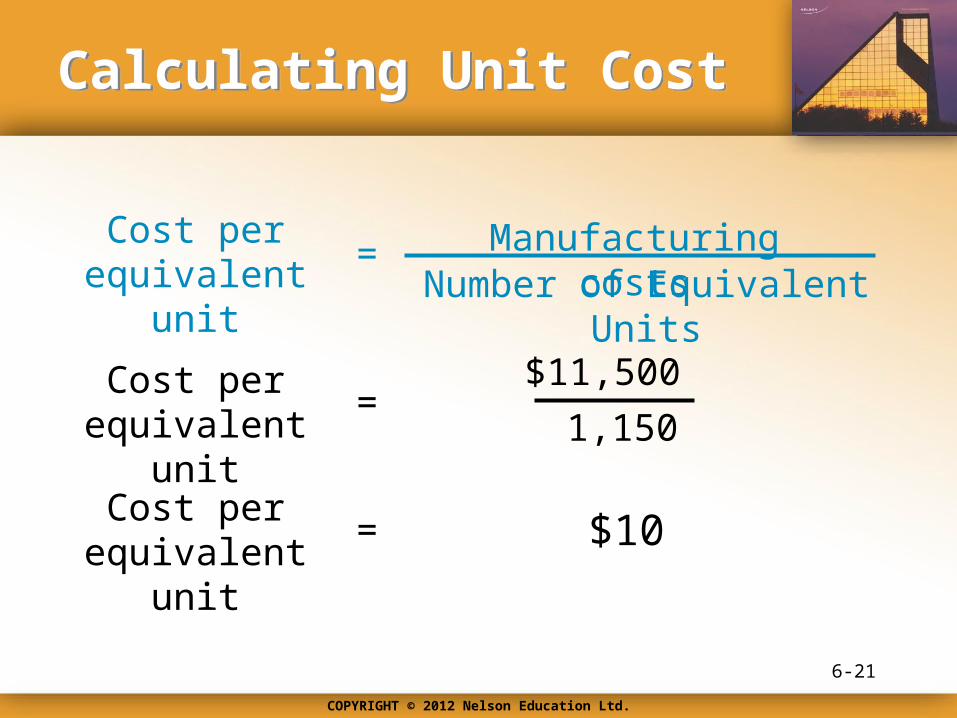
Calculating Unit CostCalculating Unit Cost
Cost per equivalent unit = Manufacturing costs
Number of Equivalent Units
$11,500
1,150=
$10
Cost per equivalent unit
Cost per equivalent unit
=
6-21

COPYRIGHT © 2012 Nelson Education Ltd.
Cost of Goods Transferred OutCost of Goods Transferred Out
Cost of goods transferred out
=
$10
= $10,000
× 1,000 units
Cost of goods transferred out
Unit Cost
× Units
Transferred Out
6-22

COPYRIGHT © 2012 Nelson Education Ltd.
Cost of Ending Work-In-Process (EWIP)Cost of Ending Work-In-Process (EWIP)
Cost of ending work in process =
$10
= $1,500
× 150
Cost of ending work in process
Unit Cost
× Units in EWIP
Things get more complicated if there are units in work-in-process at the
beginning of the period
6-23
COPYRIGHT © 2012 Nelson Education Ltd.
Beginning Work In ProcessBeginning Work In Process
• Work done on these beginning inventory units– Represents prior period costs
• How should these costs figure into the computation of current period unit costs?1. Weighted Average method
2. FIFO method
6-24

COPYRIGHT © 2012 Nelson Education Ltd.
Weighted Average MethodWeighted Average Method
• Combines– Beginning inventory costs– Current period costs
• Calculates Unit Cost for the period– By averaging
• Unit cost is used to compute costs for:– Goods transferred out– Goods remaining in work-in-process
6-25

COPYRIGHT © 2012 Nelson Education Ltd.
FIFO MethodFIFO Method
Only current work and costs are used to calculate this
period’s unit cost
Separates work and costs for the equivalent units in beginning inventory from work and costs of the
equivalent units produced during the current period
6-26

OBJECTIVE OBJECTIVE 33
Prepare a departmental production report using the weighted average method
COPYRIGHT © 2012 Nelson Education Ltd.
Preparing a Weighted Average Production ReportPreparing a Weighted Average Production Report
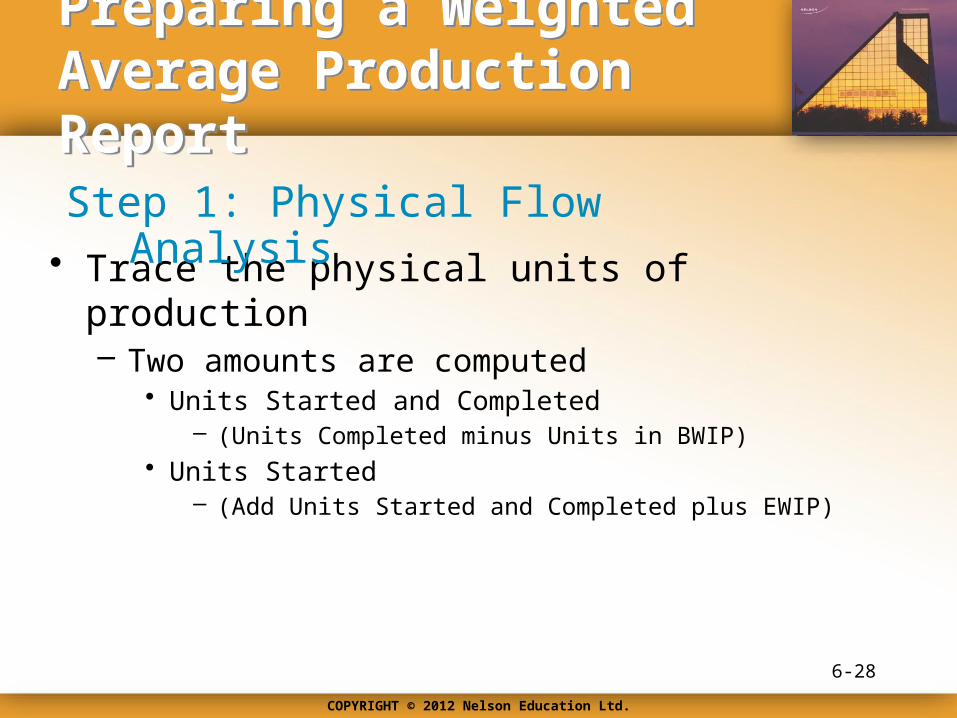
• Trace the physical units of production– Two amounts are computed
• Units Started and Completed – (Units Completed minus Units in BWIP)
• Units Started– (Add Units Started and Completed plus EWIP)
Step 1: Physical Flow Analysis
6-28

COPYRIGHT © 2012 Nelson Education Ltd.
Preparing a Weighted Average Production ReportPreparing a Weighted Average Production Report
• Adding together– Units Completed– Units in Ending Work In Process × Fraction Complete
• Beginning Inventory– Included in the units completed– Treats beginning inventory as if it was started and
completed the current period
Step 2: Calculation of Equivalent Units
6-29

COPYRIGHT © 2012 Nelson Education Ltd.
Preparing a Weighted Average Production ReportPreparing a Weighted Average Production Report
• Manufacturing Costs ÷ Equivalent Unit– Costs include:
• Prior period costs associated with beginning work-in-process• Current period manufacturing costs
Step 3: Computation of Unit Cost
6-30

COPYRIGHT © 2012 Nelson Education Ltd.
Preparing a Weighted Average Production ReportPreparing a Weighted Average Production Report
• Computing cost of goods transferred out– Multiplying
• Unit cost (computed in step #3)• Units completed (computed in step #1)
• Computing cost of ending work in process – Multiplying
• Unit cost (computed in step #3)• Equivalent units (computed in step #2)
Step 4: Valuation of Inventories
6-31

COPYRIGHT © 2012 Nelson Education Ltd.
• Checks to see if:– Costs to account for
• Beginning Work In Process + Costs incurred during the period
– Equal• Costs assigned to inventory
– Transferred out + Ending Work-In-Process
Step 5: Cost Reconciliation
Cornerstones 6-4, 6-5, and 6-6 will walk us through an example
6-32
Preparing a Weighted Average Production ReportPreparing a Weighted Average Production Report

COPYRIGHT © 2012 Nelson Education Ltd.
Example: Cornerstone 6-4Example: Cornerstone 6-4
Units in process, July 1, 75% completeProduction:
20,000 litres
Units completed and transferred out 50,000 litres
Units in process, July 31, 25% complete 10,000 litres
Information:
6-33
How to Measure Output and Assign Costs: Weighted Average
Work in process, July 1Costs:
$3,525Costs added during July $10,125
COPYRIGHT © 2012 Nelson Education Ltd.
ExampleExample
• Calculate an output measure for July
• Assign costs to units transferred out and ending work in process using the weighted average method
Required:
6-34
COPYRIGHT © 2012 Nelson Education Ltd.
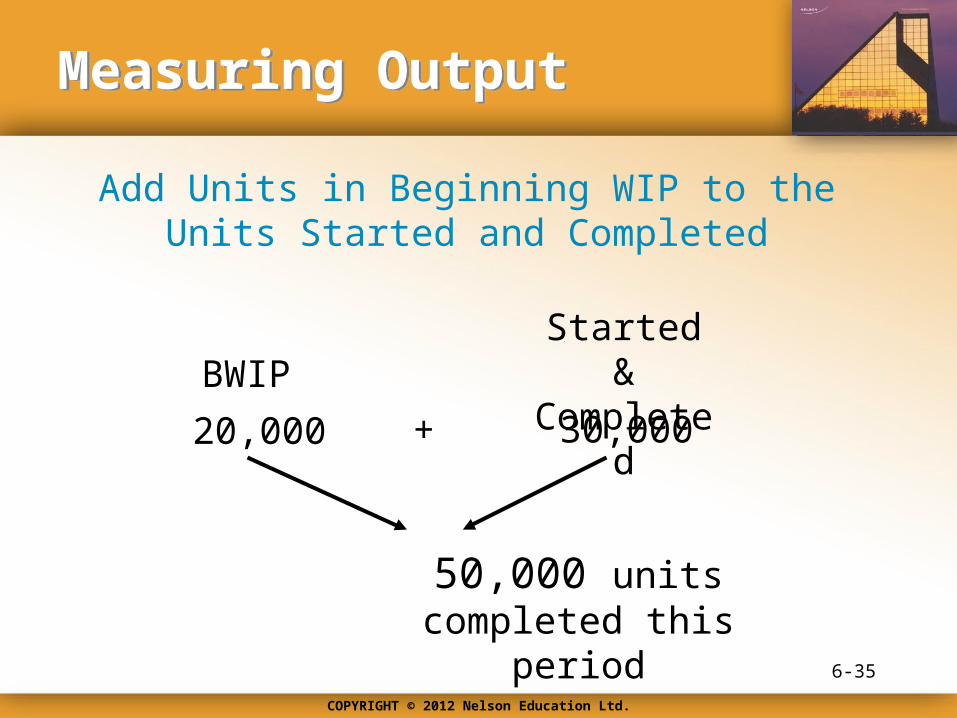
Measuring OutputMeasuring Output
20,000 + 30,000
Add Units in Beginning WIP to the Units Started and Completed
50,000 units completed this period
BWIPStarted &
Completed
6-35
COPYRIGHT © 2012 Nelson Education Ltd.
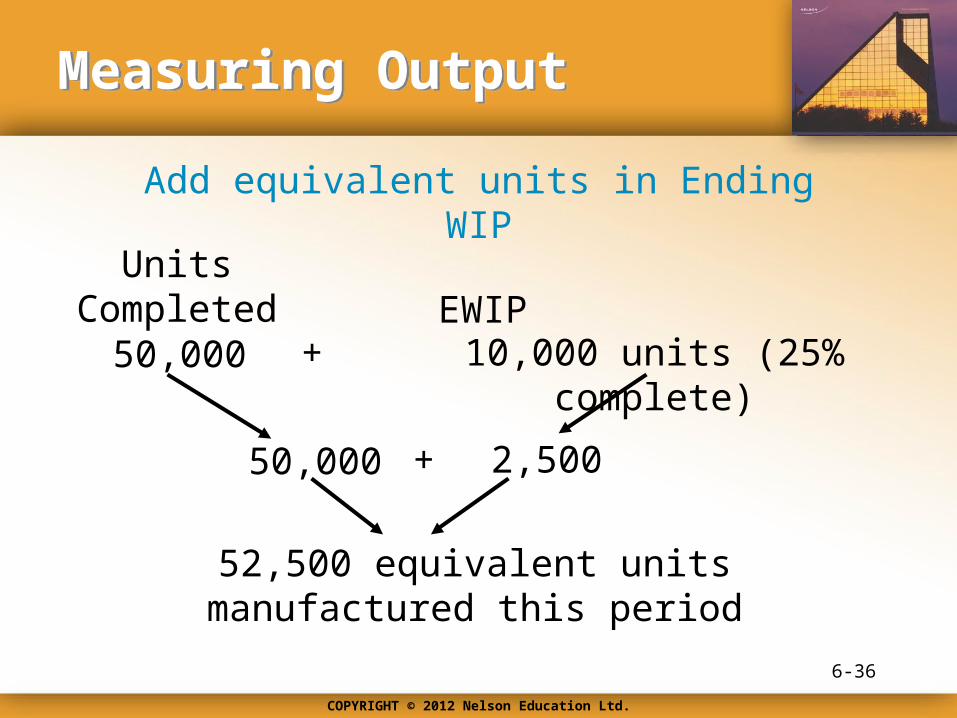
Measuring OutputMeasuring Output
50,000 + 10,000 units (25% complete)
Add equivalent units in Ending WIP
52,500 equivalent units manufactured this period
50,000 2,500+
Units Completed EWIP
6-36

COPYRIGHT © 2012 Nelson Education Ltd.
Assigning CostsAssigning Costs
Costs added during July 10,125$13,650
Work in process, July 1
Total costs assigned
$ 3,525
Unit cost = $13,650/52,500 equivalent units
Unit cost = $0.26 per equivalent unit
Compute Unit Cost
6-37
COPYRIGHT © 2012 Nelson Education Ltd.
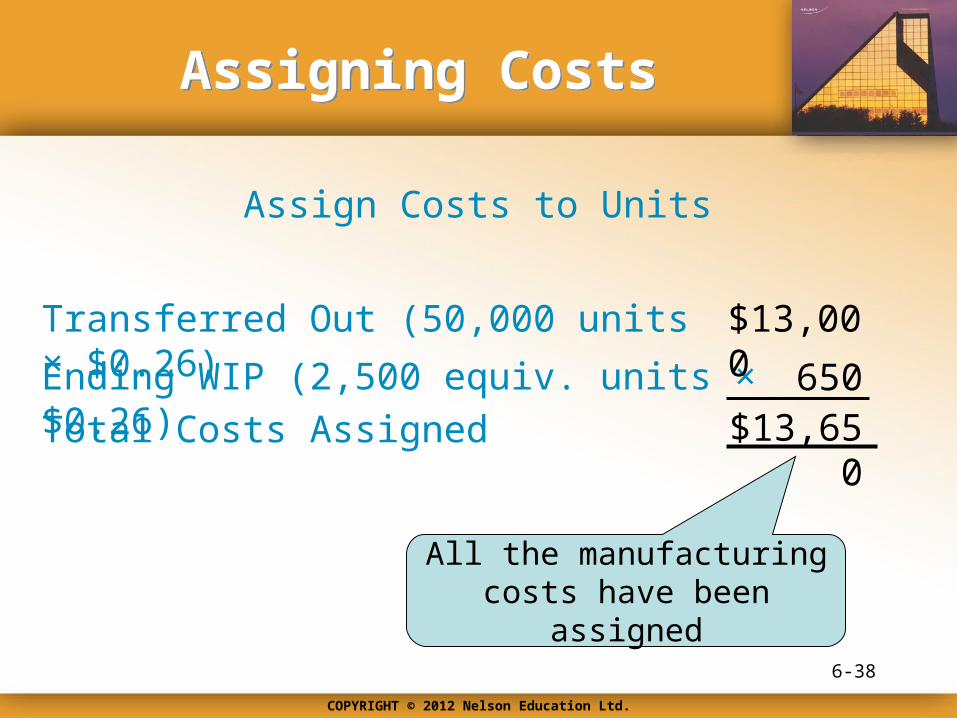
Assigning CostsAssigning Costs
Ending WIP (2,500 equiv. units × $0.26) 650$13,650
Transferred Out (50,000 units × $0.26)
Total Costs Assigned
$13,000
Assign Costs to Units
All the manufacturing costs have been assigned
6-38

COPYRIGHT © 2012 Nelson Education Ltd.
Example: Cornerstone 6-5Example: Cornerstone 6-5
Units in process, July 1, 75% completeProduction:
20,000 litresUnits completed and transferred out 50,000 litresUnits in process, July 31, 25% complete 10,000 litres
Information:
Required:
Prepare a physical flow schedule
6-39
How to Prepare a Physical Flow Schedule
COPYRIGHT © 2012 Nelson Education Ltd.
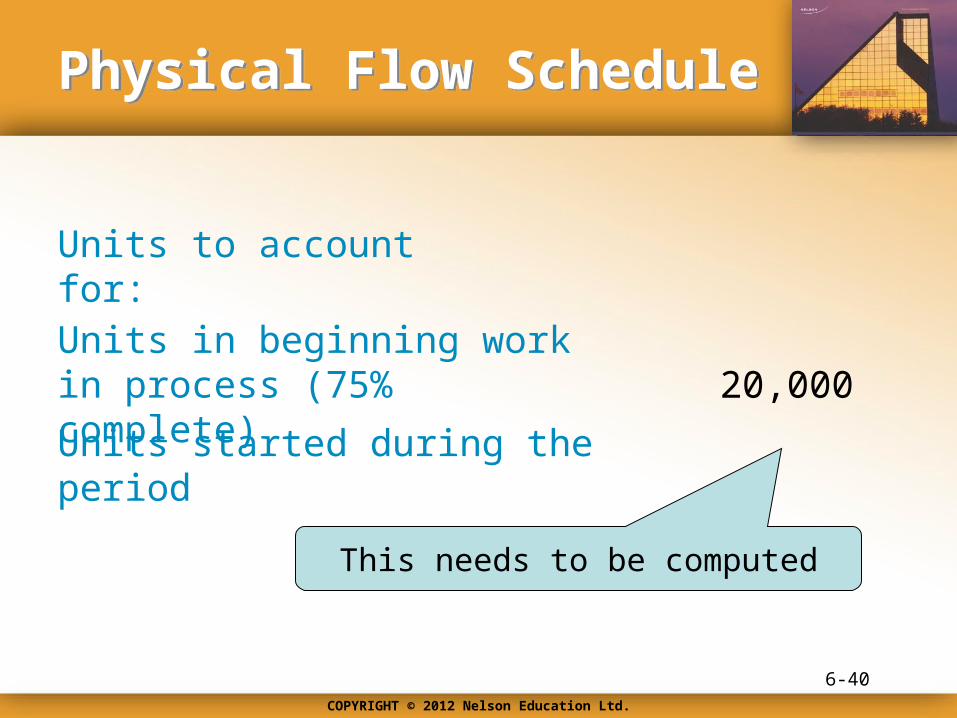
Physical Flow SchedulePhysical Flow Schedule
Units in beginning work in process (75% complete) 20,000
Units started during the period
Units to account for:
This needs to be computed
6-40

COPYRIGHT © 2012 Nelson Education Ltd.
Units Started and CompletedUnits Started and Completed
Units started and completed =
Units completed
= 50,000
– Units, BWIP
– 20,000Units started and
completed
Units started and completed = 30,000
6-41

COPYRIGHT © 2012 Nelson Education Ltd.
Units StartedUnits Started
Units started =Units
started and completed
= 30,000
+ Units, EWIP
+ 10,000
Units started = 40,000
Units started
6-42

COPYRIGHT © 2012 Nelson Education Ltd.
Physical Flow SchedulePhysical Flow Schedule
Units in beginning work in process (75% complete) 20,000
Units started during the period 40,000Total units to account for 60,000
Units to account for:
6-43
COPYRIGHT © 2012 Nelson Education Ltd.
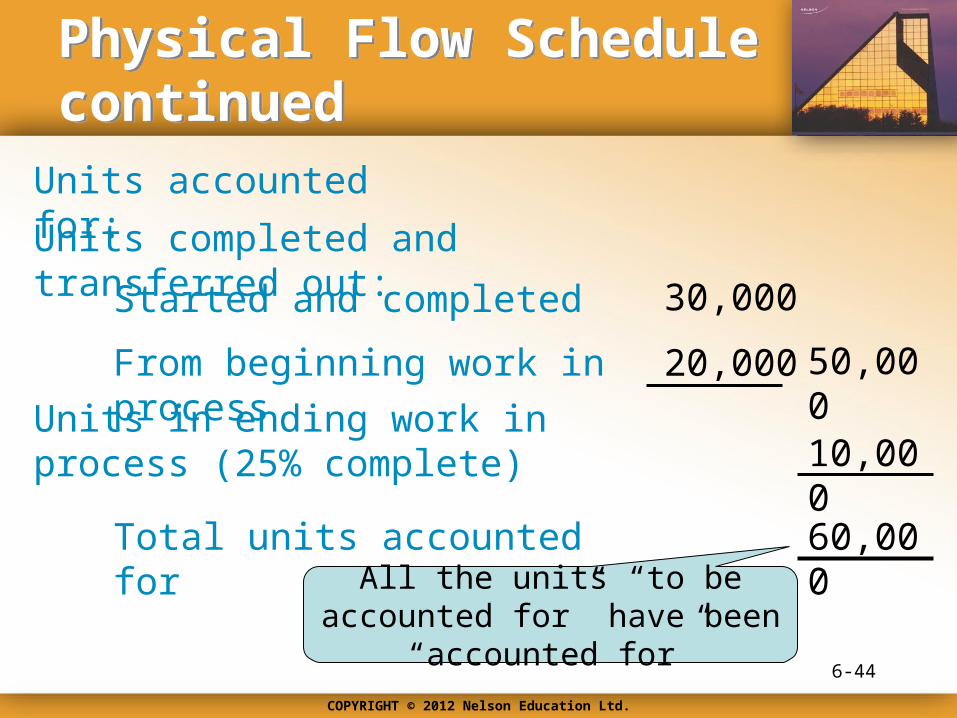
Physical Flow Schedule continuedPhysical Flow Schedule continued
Units completed and transferred out:
30,000Started and completed
20,000
Total units accounted for 60,000
Units accounted for:
From beginning work in process
Units in ending work in process (25% complete)
50,000
10,000
All the units “to be accounted for” have been “accounted for”
6-44

COPYRIGHT © 2012 Nelson Education Ltd.
ExampleExample
Calculation of Equivalent Units
Units completed 50,000
Now we need to calculate the unit cost
Add: Units in ending work in process × fraction complete 2,500
52,500Equivalent units of output
6-45
10,000 × 25%
COPYRIGHT © 2012 Nelson Education Ltd.
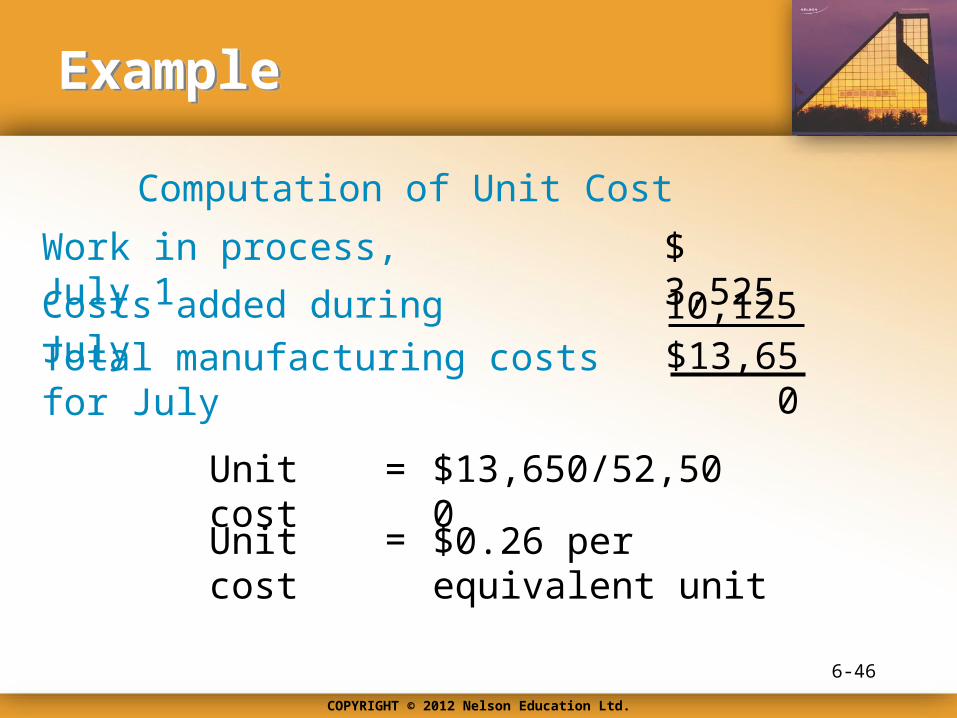
ExampleExample
Computation of Unit Cost
Costs added during July 10,125$13,650
Work in process, July 1
Total manufacturing costs for July
$ 3,525
Unit cost = $13,650/52,500
Unit cost = $0.26 per equivalent unit
6-46

COPYRIGHT © 2012 Nelson Education Ltd.
ExampleExample
Goods in ending work in process 650
Total manufacturing costs assigned to inventories are as follows:
$13,000Goods transferred out
Total costs accounted for $13,650
Cost Reconciliation
6-47
50,000 units × $0.26
2,500 units × $0.26

COPYRIGHT © 2012 Nelson Education Ltd.
Example: Cornerstone 6-6Example: Cornerstone 6-6
Information:Calculations in Cornerstones 6-4 & 6-5
Prepare a production reportRequired:
6-48
How to Prepare a Production Report: Weighted Average Method

COPYRIGHT © 2012 Nelson Education Ltd.
Healthblend CompanyPicking Department
Production Report for July 2011
Unit InformationPhysical FlowUnits To Account For:
20,00040,000
Units in Beg. WIPUnits started
Total units to account for 60,000
Units Accounted For:Units completed 50,000Units in End. WIP 10,000
Total units accounted for 60,000
Equivalent Units
Units completed 50,000Units in EWIP 2,500
52,500Total equivalent units
6-49

COPYRIGHT © 2012 Nelson Education Ltd.
Healthblend CompanyPicking Department
Production Report for July 2011
(Continued)
Cost Information
Costs to account for:
$ 3,525
10,125
Beginning Work In Process
Incurred during the period
Total costs to account for $13,650
Cost per equivalent unit $ 0.26
6-50

COPYRIGHT © 2012 Nelson Education Ltd.
Healthblend CompanyPicking Department
Production Report for July 2011
(Continued)
Costs accounted for:$13,000
$650Goods transferred out
Total costs accounted for $13,650
Transferred Out
Ending WIP Total
Goods in Ending WIP ---
$13,000
--- $13,000
$650
650
6-51

COPYRIGHT © 2012 Nelson Education Ltd.
Evaluation of the Weighted Average MethodEvaluation of the Weighted Average Method
Major benefit of this method is the simplicity
Main disadvantage is reduced accuracy in computing unit costs
If greater accuracy is desired, a company should use the FIFO method to determine unit costs
6-52

OBJECTIVE OBJECTIVE 44
Explain how nonuniform inputs and multiple
processing departments affect process costing
COPYRIGHT © 2012 Nelson Education Ltd.
Nonuniform Application of Manufacturing InputsNonuniform Application of Manufacturing Inputs
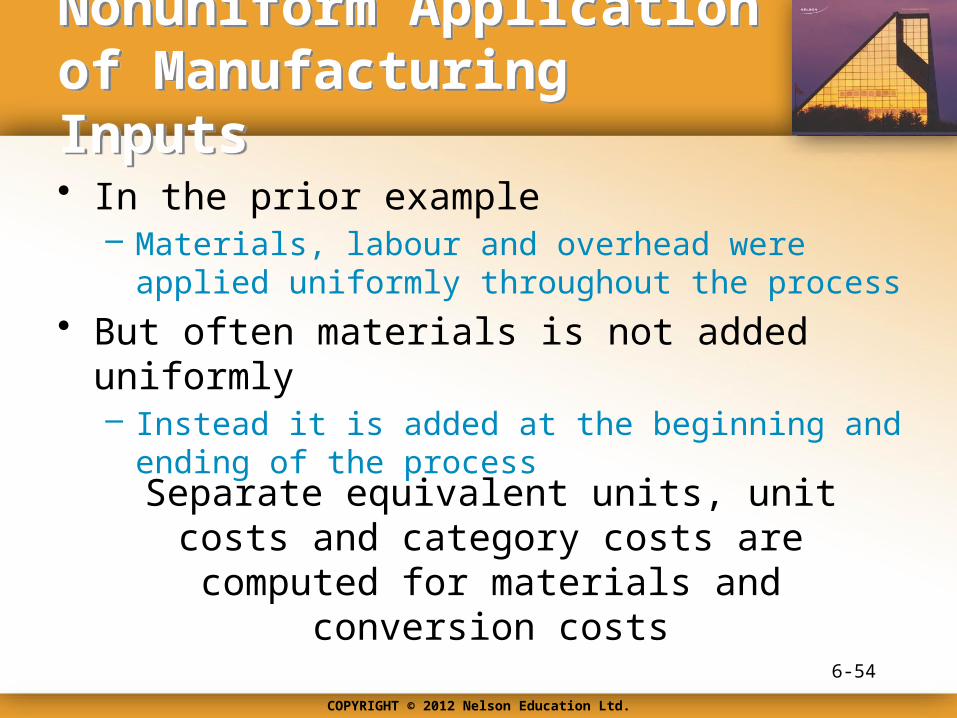
• In the prior example– Materials, labour and overhead were applied uniformly
throughout the process
• But often materials is not added uniformly– Instead it is added at the beginning and ending of the
process
6-54
Separate equivalent units, unit costs and category costs are computed for materials
and conversion costs

COPYRIGHT © 2012 Nelson Education Ltd.
Example: Cornerstone 6-7Example: Cornerstone 6-7
Units in process, Sept 1, 50% complete*Production:
10,000Units completed and transferred out 60,000Units in process, Sept 30, 40% complete* 20,000
Information:
* Percentage complete as to conversion costs
6-55
How to Calculate Equivalent Units, Unit Costs, and Value Inventories with Nonuniform Inputs
COPYRIGHT © 2012 Nelson Education Ltd.
ExampleExample
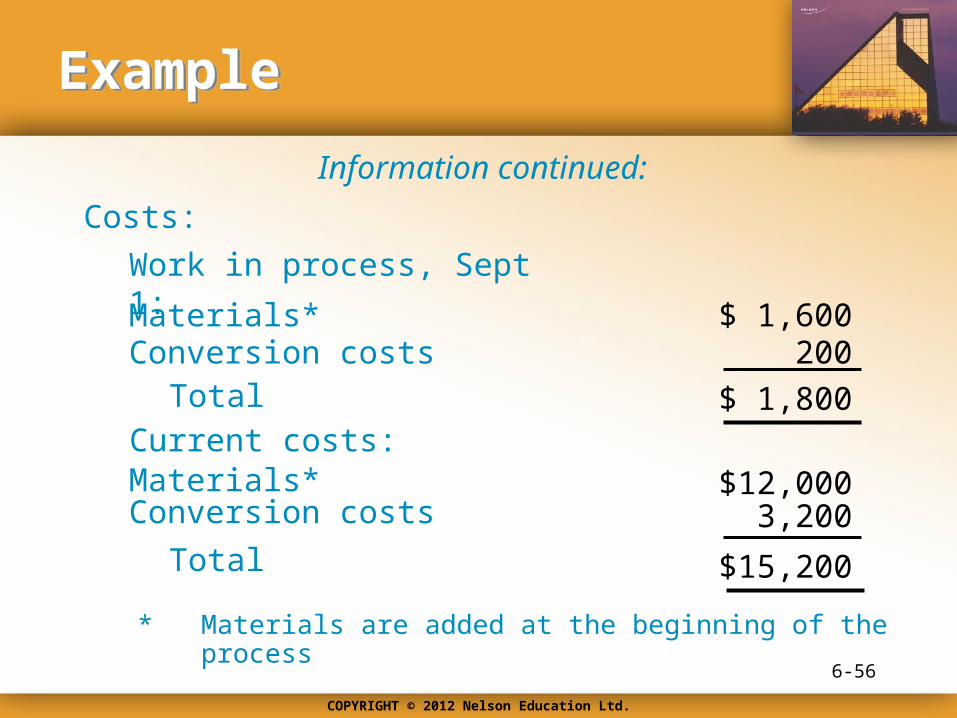
Work in process, Sept 1:
Costs:
$ 1,600
Current costs:
Information continued:
Materials* Conversion costs 200
$ 1,800Total
$12,000Materials* Conversion costs 3,200
$15,200Total
* Materials are added at the beginning of the process
6-56

COPYRIGHT © 2012 Nelson Education Ltd.
ExampleExample
• Calculate equivalent units
• Calculate unit cost
• Calculate the valuation of the inventories
Required:
6-57
COPYRIGHT © 2012 Nelson Education Ltd.
ExampleExample
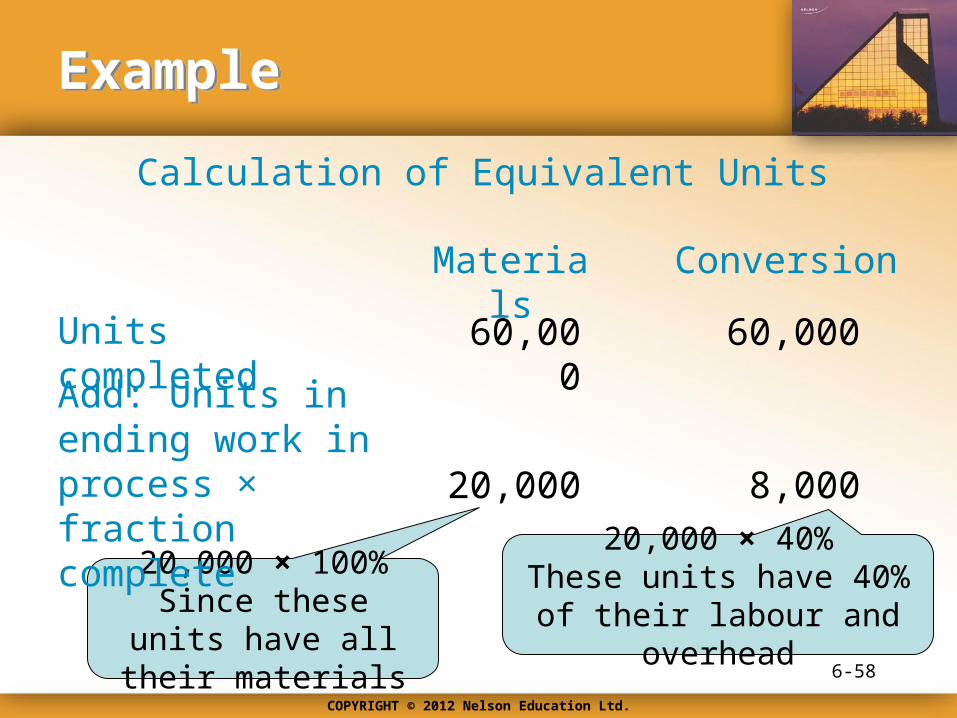
20,000 × 100%Since these units
have all their materials
Materials
Calculation of Equivalent Units
Conversion
Units completed
Add: Units in ending work in process × fraction complete
60,000 60,000
20,000
6-58
8,000
20,000 × 40%These units have 40% of their labour and overhead

COPYRIGHT © 2012 Nelson Education Ltd.
ExampleExample
Materials
Calculation of Equivalent Units
Conversion
Units completed
Add: Units in ending work in process × fraction complete
60,000 60,000
20,000 8,000
Equivalent units of output 80,000 68,000
6-59

COPYRIGHT © 2012 Nelson Education Ltd.
ExampleExample
Calculation of Unit Cost
Unit materials cost = ($1,600 + $12,000)/80,000
Unit conversion cost
Unit materials cost = $0.17
= ($200 + $3,200)/68,000Unit conversion cost = $0.05
Total unit cost = $0.17 + $0.05Total unit cost = $0.22
6-60

COPYRIGHT © 2012 Nelson Education Ltd.
ExampleExample
Valuation of Ending Work in Process and Goods Transferred Out
Cost of ending work in process:$3,400Materials $0.17 × 20,000
Conversion $0.05 × 8,000 400Total cost $3,800
Valuation of goods transferred out:Cost of goods transferred out $13,200
$0.22 × 60,0006-61

COPYRIGHT © 2012 Nelson Education Ltd.
Multiple DepartmentsMultiple Departments
Some departments receive partially completed goods from prior departments
Usual approach is to treat transferred-in goods as a separate material category
Cost of this material is the cost of the goods transferred out as computed in
the prior department
6-62
COPYRIGHT © 2012 Nelson Education Ltd.
Example: Cornerstone 6-8Example: Cornerstone 6-8
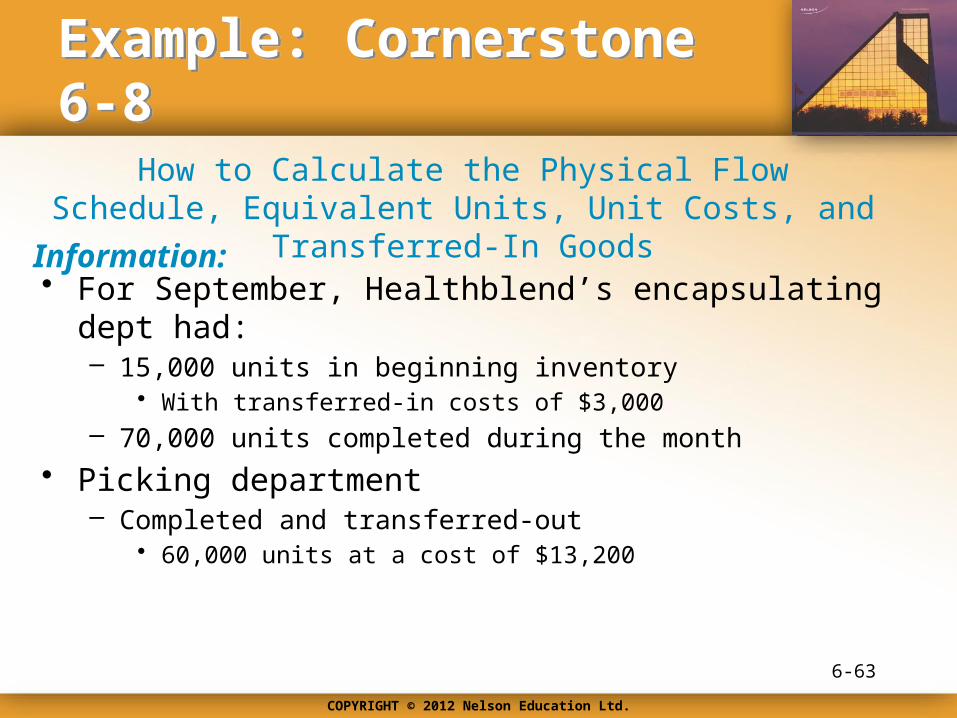
• For September, Healthblend’s encapsulating dept had:– 15,000 units in beginning inventory
• With transferred-in costs of $3,000– 70,000 units completed during the month
• Picking department– Completed and transferred-out
• 60,000 units at a cost of $13,200
Information:
6-63
How to Calculate the Physical Flow Schedule, Equivalent Units, Unit Costs, and Transferred-In Goods
COPYRIGHT © 2012 Nelson Education Ltd.
ExampleExample
• Prepare a physical flow schedule with transferred-in goods• Calculate equivalent units for the transferred-in category• Calculate unit cost for the transferred-in category
Required:
6-64

COPYRIGHT © 2012 Nelson Education Ltd.
ExampleExample
Physical Flow Schedule
Units to account for:Units in beginning work in process 15,000
60,000Units transferred in during Sept.Total units to account for 75,000
6-65
COPYRIGHT © 2012 Nelson Education Ltd.
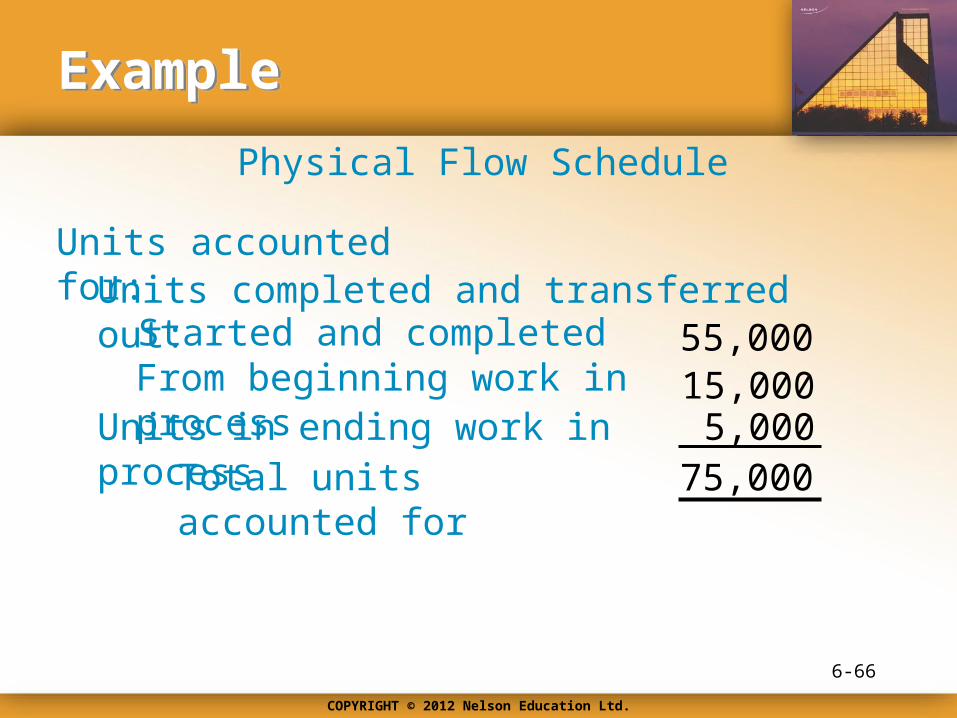
ExampleExample
Physical Flow Schedule
Units accounted for:Units completed and transferred out:
55,000Started and completedFrom beginning work in process 15,000
Units in ending work in processTotal units accounted for
5,00075,000
6-66

COPYRIGHT © 2012 Nelson Education Ltd.
ExampleExample
67
Equivalent Units for the transferred-in category
Units completedAdd: Units in ending work in process × fraction complete
70,000Transferred-in:
5,000
Equivalent units of output 70,000
5,000 × 100%since
these units have all
their materials

COPYRIGHT © 2012 Nelson Education Ltd.
ExampleExample
Calculation of Unit Cost for the Transferred-in Category
Unit cost = ($13,200 + $3,000)/75,000
$0.216
Unit cost = $16,200 / 75,000
Unit cost =
6-68
For the transferred-in category

OBJECTIVE OBJECTIVE 55
Appendix:
Prepare a departmental production report using
the FIFO method

COPYRIGHT © 2012 Nelson Education Ltd.
Production ReportFIFO CostingProduction ReportFIFO Costing
• Separates the cost of BWIP from cost of current period
• Review:– Cornerstone 6-9, How to calculate output and cost
assignments: FIFO method, page 264; and– Cornerstone 6-10, How to prepare a production report:
FIFO method, page 267
6-70