Chapter Seven Hypothesis Testing with ONE Sample.
23
Chapter Seven Chapter Seven Hypothesis Testing with ONE Sample
-
Upload
gavin-wiggins -
Category
Documents
-
view
228 -
download
3
Transcript of Chapter Seven Hypothesis Testing with ONE Sample.

Chapter SevenChapter SevenHypothesis Testing with ONE Sample

Section 7.1Section 7.1Introduction to Hypothesis Testing

Hypothesis TestsHypothesis Tests… A process that uses sample
statistics to test a claim about a population parameter.
Test includes:◦Stating a NULL and an ALTERNATIVE
Hypothesis.◦Determining whether to REJECT or to
NOT REJECT the Null Hypothesis. (If the Null is rejected, that means the Alternative must be true.)

Stating a HypothesisStating a HypothesisThe Null Hypothesis (H0) is a statistical hypothesis that contains some statement of equality, such as =, <, or >
The Alternative Hypothesis (Ha) is the complement of the null hypothesis. It contains a statement of inequality, such as ≠, <, or >

Left, Right, or Two-Tailed Left, Right, or Two-Tailed TestsTestsIf the Alternative Hypotheses, Ha , includes <, it is considered a LEFT TAILED test.
If the Alternative Hypotheses, Ha , includes >, it is considered a RIGHT TAILED test.
If the Alternative Hypotheses, Ha , includes ≠, it is considered a TWO TAILED test.

EX: State the Null and EX: State the Null and Alternative Hypotheses.Alternative Hypotheses.26. As stated by a company’s
shipping department, the number of shipping errors per mission shipments has a standard deviation that is less than 3.
28. A state park claims that the mean height of oak trees in the park is at least 85 feet.
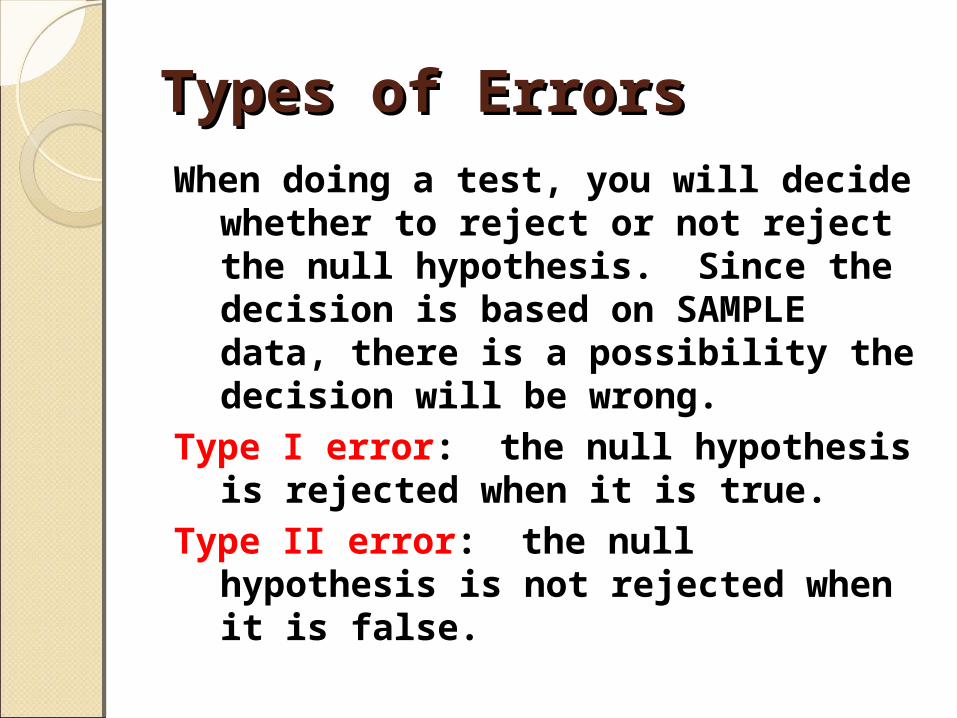
Types of ErrorsTypes of ErrorsWhen doing a test, you will decide
whether to reject or not reject the null hypothesis. Since the decision is based on SAMPLE data, there is a possibility the decision will be wrong.
Type I error: the null hypothesis is rejected when it is true.
Type II error: the null hypothesis is not rejected when it is false.

4 possible outcomes…4 possible outcomes… TRUTH OF H0
DECISION H0 is TRUE H0 is FALSE
Do not reject H0
Correct Decision
Type II Error
Reject H0 Type I Error
Correct Decision

Level of SignificanceLevel of SignificanceThe level of significance is the maximum allowed probability of making a Type I error. It is denoted by the lowercase Greek letter alpha.
The probability of making a Type II error is denoted by the lowercase Greek letter beta.

p-Valuesp-ValuesIf the null hypothesis is true, a p-Value of a hypothesis test is the probability of obtaining a sample statistic with a value as extreme or more extreme than the one determined from the sample data.
The p-Value is connected to the area under the curve to the left and/or right on the normal curve.

Making and Interpreting Making and Interpreting your Decisionyour DecisionDecision Rule based on the p-ValueCompare the p-Value with alpha.◦If p < alpha, reject H0
◦If p > alpha, do not reject H0
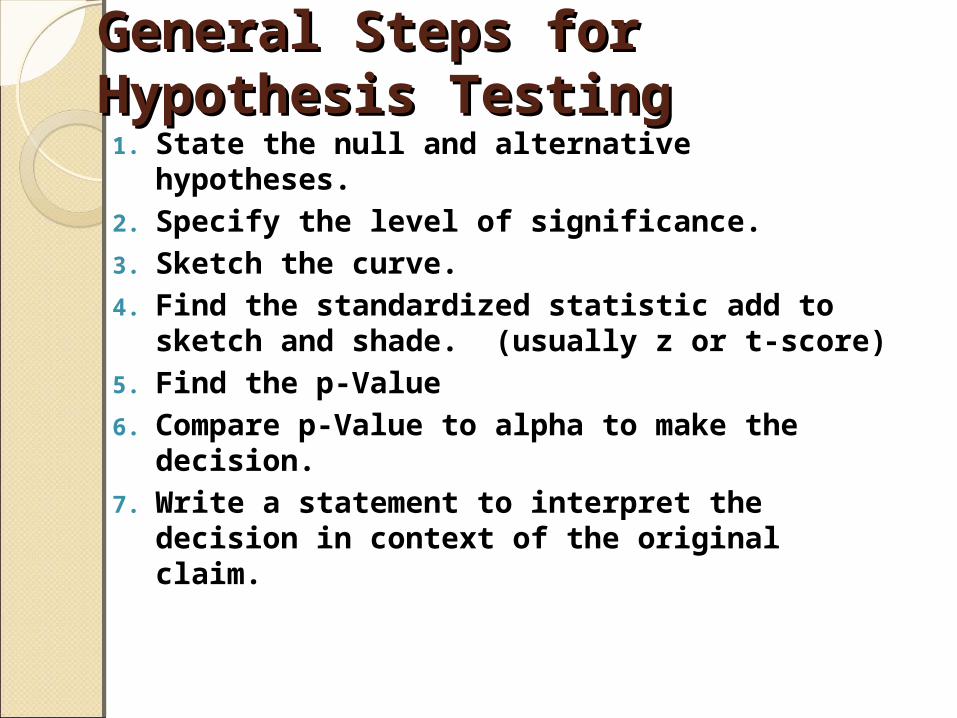
General Steps for General Steps for Hypothesis TestingHypothesis Testing1. State the null and alternative
hypotheses.2. Specify the level of significance.3. Sketch the curve.4. Find the standardized statistic add to
sketch and shade. (usually z or t-score)5. Find the p-Value6. Compare p-Value to alpha to make the
decision.7. Write a statement to interpret the
decision in context of the original claim.
Section 7.2Section 7.2
Hypothesis Testing for the MEAN (Large Samples)

Using p-Value to Make Using p-Value to Make DecisionsDecisionsDecision Rule based on the p-ValueCompare the p-Value with alpha.◦If p < alpha, reject H0
◦If p > alpha, do not reject H0

Finding the p-Value for Finding the p-Value for a Hypothesis Test – a Hypothesis Test – using the tableusing the tableTo find p-Value◦Left tailed: p = area in the left tail◦Right tailed: p = area in the right tail◦Two Tailed: p = 2(area in one of the tails)
This section we’ll be finding the z-values and using the standard normal table.
Find the p-value. Decide Find the p-value. Decide whether to reject or not whether to reject or not reject the null hypothesisreject the null hypothesis4. Left tailed test, z = -1.55, alpha = 0.05
8. Two tailed test, z = 1.23, alpha = 0.10

Using p-Values for a z-Using p-Values for a z-TestTestZ-Test used when the population is normal, δ is known, and n is at least 30. If n is more than 30, we can use s for δ.

Guidelines – using the p-Guidelines – using the p-valuevalue1. find H0 and Ha
2. identify alpha3. find z4. find area that corresponds to z (the p-value)
5. compare p-value to alpha6. make decision7. interpret decision

30. A manufacturer of sprinkler systems designed for fire protection claims the average activating temperature is at least 135oF. To test this claim, you randomly select a sample of 32 systems and find mean = 133, and s = 3.3. At alpha = 0.10, do you have enough evidence to reject the manufacturer’s claim?

Rejection Regions & Rejection Regions & Critical Values Critical Values The Critical value (z0) is the z-score that corresponds to the level of significance (alpha)
Z0 separates the rejection region from the non-rejection region
Sketch a normal curve and shade the rejection region. (Left, right, or two tailed)

Find zFind z00 and shade and shade rejection regionrejection region18. Right tailed test, alpha = 0.08
22. Two tailed test, alpha = 0.10

Guidelines – using Guidelines – using rejection regionsrejection regions1. find H0 and Ha
2. identify alpha3. find z0 – the critical value(s)4. shade the rejection
region(s)5. find z6. make decision (Is z in the
rejection region?)7. interpret decision

38. A fast food restaurant estimates that the mean sodium content in one of its breakfast sandwiches is no more than 920 milligrams. A random sample of 44 sandwiches has a mean sodium content of 925 with s = 18. At alpha = 0.10, do you have enough evidence to reject the restaurant’s claim?