Chapter One INTRODUCTION - Michigan ö?î L a k e S u p ... Lower Dead River, Watershed Mgmt. Plan...
95
1 Lower Dead River, Watershed Mgmt. Plan 2003 The primary goal of the Lower Dead River Watershed Management Plan is to develop a strategy for the protection and enhancement of natural resources within the Lower Dead watershed. This management plan is designed to provide long-term water quality and aquatic habitat benefits to the Dead River, its tributaries, and Lake Superior. In addition to the environmental benefits associated with proper watershed management, this approach can help to shape the development patterns of an area to ensure they are sustainable. Such careful development practices can result in not only the protection of the environment, but the quality of life for the residents of the watershed as well. Goals of the Lower Dead River Management Plan: • Identify areas of sedimentation, erosion, and stormwater runoff contributing to the decline of water quality and aquatic habitat in the Lower Dead River watershed • Create stream monitoring programs, improve riparian zoning ordinances, and develop better stormwater management techniques that will help to protect the water quality and aquatic habitat in the Lower Dead River watershed • Identify open space planning and low impact development practices in order to protect ecological resources while still supporting economic and social growth within the community • Create a watershed management plan that assists in the realization of the vision for Lake Superior as defined by the Lake Superior Binational Forum This management plan includes an inventory and analysis of both the natural and built features of the watershed. It also includes a discussion of specific areas of concern and their effects on the health of the watershed. From the inventory conducted on the natural features, the watershed council prioritized these areas based on human disturbances (altered hydrology, transportation issues, increased development, and recreational activities). Finally, a series of management strategies and recommendations are presented. These strategies are designed to allow local communities to continue their growth without compromising the environmental quality and designated uses of the watershed. Stakeholders: • Riparian landowners • Localresidents • Marquette Township • Negaunee Township • City of Marquette • Marquette County Conservation District • Central Lake Superior Watershed Partnership • Northern Michigan University INTRODUCTION Chapter One - Introduction • Planning Commissioner • Marquette County Road Commissioner • Marquette County Drain Commissioner • Non-profit Organizations • Michigan DEQ • Michigan DNR • Industrial and Commerical Developers Upper Harbor at dusk Lower Dead River Chapter One
Transcript of Chapter One INTRODUCTION - Michigan ö?î L a k e S u p ... Lower Dead River, Watershed Mgmt. Plan...
1
Lower Dead River, Watershed Mgmt. Plan 2003
The primary goal of the Lower Dead River Watershed Management Plan is to develop a strategyfor the protection and enhancement of natural resources within the Lower Dead watershed.This management plan is designed to provide long-term water quality and aquatic habitatbenefits to the Dead River, its tributaries, and Lake Superior. In addition to the environmentalbenefits associated with proper watershed management, this approach can help to shape thedevelopment patterns of an area to ensure they are sustainable. Such careful developmentpractices can result in not only the protection of the environment, but the quality of life for theresidents of the watershed as well.
Goals of the Lower Dead River Management Plan:• Identify areas of sedimentation, erosion, and stormwater runoff contributing
to the decline of water quality and aquatic habitat in the Lower Dead River watershed• Create stream monitoring programs, improve riparian zoning ordinances, and
develop better stormwater management techniques that will help to protect thewater quality and aquatic habitat in the Lower Dead River watershed
• Identify open space planning and low impact development practices in order toprotect ecological resources while still supporting economic and social growthwithin the community
• Create a watershed management plan that assists in the realization of the visionfor Lake Superior as defined by the Lake Superior Binational Forum
This management plan includes an inventory and analysis of both the natural and built featuresof the watershed. It also includes a discussion of specific areas of concern and their effects onthe health of the watershed. From the inventory conducted on the natural features, thewatershed council prioritized these areas based on human disturbances (altered hydrology,transportation issues, increased development, and recreational activities). Finally, a series ofmanagement strategies and recommendations are presented. These strategies are designed toallow local communities to continue their growth without compromising the environmentalquality and designated uses of the watershed.
Stakeholders:• Riparian landowners• Local residents• Marquette Township• Negaunee Township• City of Marquette• Marquette County Conservation District• Central Lake Superior Watershed Partnership• Northern Michigan University
INTRODUCTIONChapter One - Introduction
• Planning Commissioner• Marquette County Road Commissioner• Marquette County Drain Commissioner• Non-profit Organizations• Michigan DEQ• Michigan DNR• Industrial and Commerical Developers
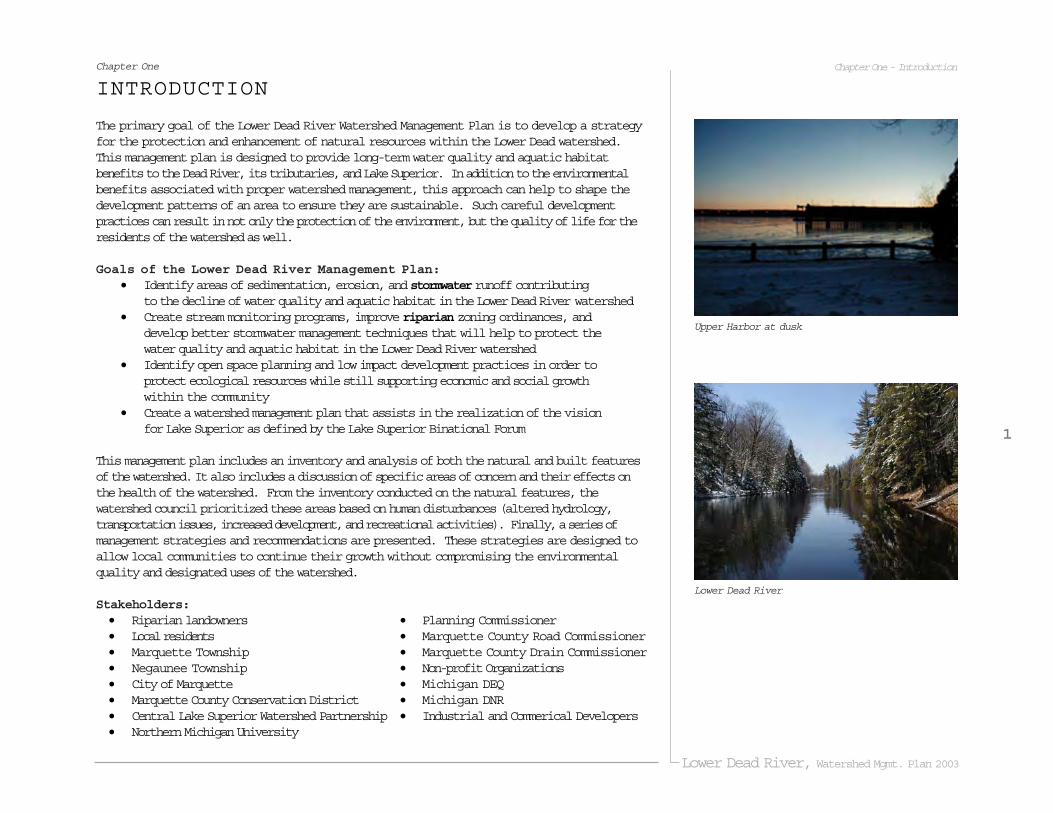
Upper Harbor at dusk
Lower Dead River
Chapter One

2
H a r l o w C r e e k W a t e r s h e d
C o m p e a u C r e e k W a t e r s h e d
W h e t s t o n e B r o o k /
O r i a n n a C r e e k
W a t e r s h e d
C a r p R i v e r W a t e r s h e d
D e a d R i v e r W a t e r s h e d
L o w e r
D e a d R i v e r
W a t e r s h e d C i t y o f M a r q u e t t e
M a r q u e t t e T w p .
N e g a u n e e T w p .
N e g a u n e e
IÀ ?ì
IÀ?ì
IÀ ?ìIÂ
%g5 50
%g492
%g49 2
?ó%g48 0
?ö
?î
L a k e S u p e r i o r
1 0 1 2 MilesLOWER DEAD RIVER WATERSHED MANAGEMENT PLAN
Regional Context

3
Lower Dead River, Watershed Mgmt. Plan 2003
Chapter Two - Natural Environment
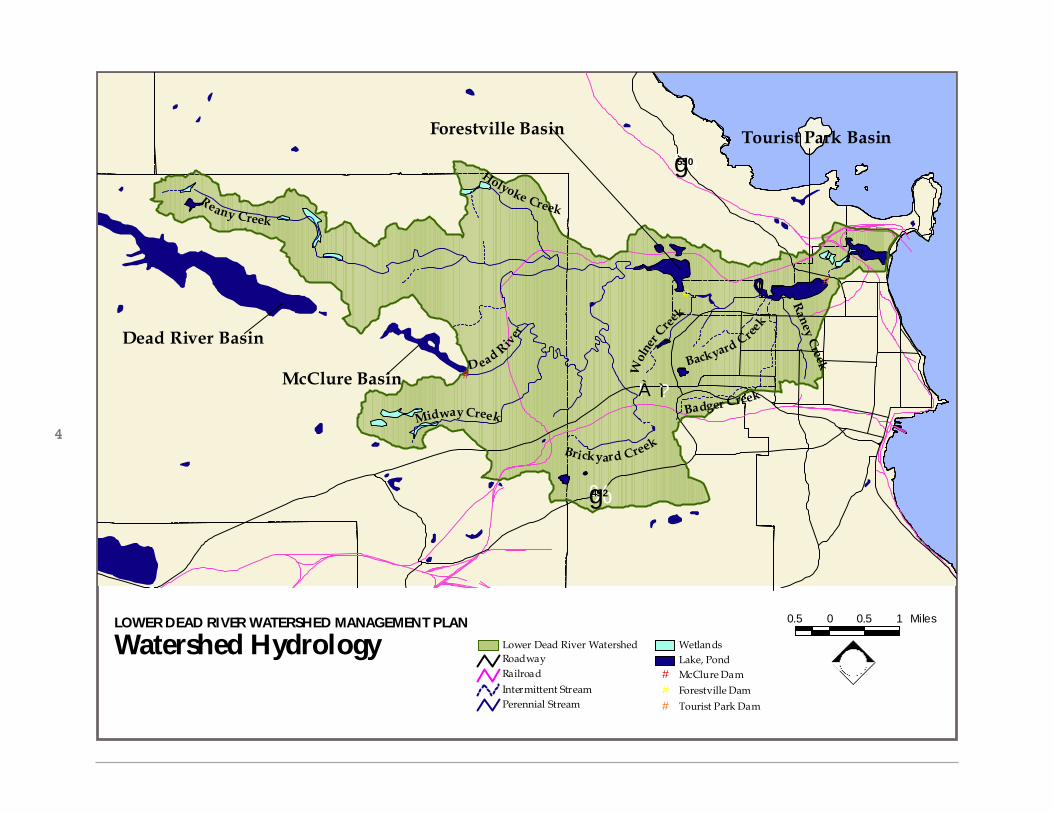
The Lower Dead River Watershed covers a 22 square mile area located within the Lake SuperiorBasin. The watershed includes the main stem of the Dead River as well as several tributaries, astorm drainage outlet, and the mouth of the river, which empties into Lake Superior. Althoughthe entire Dead River Watershed from headwaters to mouth covers a 164 square mile area, themost heavily impacted region is found within the boundaries of the Lower Dead River sub-watershed. This sub-watershed is located within the municipalities of Negaunee Township,Marquette Township, and the City of Marquette. A map of the regional context for the LowerDead River watershed is shown on the facing page.
ANALYSIS OF THE NATURAL ENVIRONMENTChapter Two
4
Lower Dead River WatershedRoadwayRailroad
Perennial StreamIntermittent Stream
WetlandsLake, Pond
Tourist Park Dam
McClure DamForestville Dam
###
LOWER DEAD RIVER WATERSHED MANAGEMENT PLAN
Watershed Hydrology0.5 0 0.5 1 Miles
%g550
%g492
?ìIÀ
Reany Creek
Holyoke Creek
Midway Creek
D ead R
iver
Brickyard Creek
Badger Creek
Wol
ner C
reek
#
Forestville Basin
#
##
#
McClure Basin
#
Dead River Basin
#
Tourist Park Basin
Raney CreekBackyard Creek

5
Lower Dead River, Watershed Mgmt. Plan 2003
HYDROLOGY
Eight main tributaries, along with several smaller, unnamed streams feed into the main stem ofthe Dead River. The Watershed Hydrology map (see facing page) shows the location of each ofthese tributaries, while a general description of each tributary is given in Table 2.1. As the DeadRiver makes its way towards its final outlet into Lake Superior, it is impounded 3 times: McClureDam, located just downstream of the McClure Storage Basin, Forestville Dam, located at theForestville Storage Basin, and Tourist Park Dam, located at the Tourist Park Storage Basin. Inaddition to these man-made impoundments, streams are affected by various beaver dams orother debris that interrupt the natural flow regime.
In general, the tributaries located within the Lower Dead River watershed are relatively highquality. In an analysis of coastal tributaries conducted in July of 2001 by the MDEQ (Godby2002), 5 of the main tributaries in the watershed were given a habitat rating of fair or good(See Table 2.2). The analysis also showed each were meeting the requirements outlined in theMichigan Water Quality Standards (Godby 2002).
There are 2 major water bodies within the Lower Dead River watershed: Forestville Basin andthe Tourist Park Basin. In addition to these large impoundments, there are several smallerponds and lakes scattered throughout the watershed including Bishop Pond, Long Lake, andthe Three Lakes. In total, 295 acres (2%) of the watershed is covered by water with an addi-tional 130 acres (1%) of associated wetlands. Bishop Pond is considered the headwaters ofBrickyard Creek and begins as a flat system of wetland drainage (Simandl 2002). These wet-lands are of particular significance, as they serve to help buffer Brickyard Creek and adjacentstreams from spikes in water volume or velocity, while using these natural fluctuations in waterlevel to maintain biological diversity. According to the Lake Superior Lakewide ManagementPlan updated in 2002, the “greatest threat to wetlands are water level regulations and site-specific stresses such as shoreline development” (LaMP 2002).
Chapter Two - Natural Environment
Stream Branch Headwater Location Avg. Stream Substrate MaterialWidth Depth
Reany Creek T48N, R26W Section 06 5-10’ 1.5 – 4’ gravelMidway Creek T48N, R26W Section 22 4’ 1-2’ gravelly sandHolyoke Creek T48N, R26W Section 02 1-3’ 1-2’ sand/gravelly sandBrickyard Creek T48N, R25W Section 20 2.5 – 9’ 1-2’ sand/gravelly sandWolner Creek T48N, R25W Section 17 4’ 1-1.5’ sand/gravelBackyard Creek T48N, R25W Section 16 1-2.5’ 1-2’ sandBadger Creek T48N, R25W Section 20 4-6’ 1-2’ sandRaney Creek T48N, R25W Section 15 1-3’ 1-2’ sand/gravel
Table 2.1: Description of Dead River Tributaries
Stream Branch Habitat MacroinvertebrateRating Rating
Dead River (Bypassed Channel) Good AcceptableReany Creek Good ExcellentMidway Creek Fair ExcellentBrickyard Creek Fair Acceptable
Badger Creek Fair Acceptable
Table 2.2: Habitat Rating
Brickyard Hydrology StudyIn an attempt to further understand thepotential effects of U.S.-41 corridor develop-ment, the Lower Dead River WatershedCouncil sought out engineering services fromSTS Consultants to complete a detailedanalysis of Brickyard Creek. Please seeAppendix B for the results of this report,including its field investigation, hydrologicmodeling, conclusions, and recommenda-tions.

6
0.5 0 0.5 1 MilesLOWER DEAD RIVER WATERSHED MANAGEMENT PLAN
Dead River Bypass Lower Dead River WatershedRoadwayRailroad
Perennial StreamIntermittent Stream
WetlandsLake, Pond
Tourist Park Dam
McClure DamForestville Dam
###
Bypassed Reach of Dead River
%g550
%g492
%g480
#
McClure Basin
#
Dead River Basin
#
Tourist Park Basin
#
Tourist Park Basin
#
Dead River Basin#
McClure Basin
##
#
#
Forestville Basin
Wol
ner C
reek
Badger Creek
Brickyard Creek
Dead R
iver
Midway Creek
Holyoke CreekReany Creek
IÀ ?ì
%g480
%g492
%g550
Raney CreekBackyard Creek

7
Lower Dead River, Watershed Mgmt. Plan 2003
High-risk AreasAreas of the watershed that have suffered degradation of habitat or water quality are generallybeing impacted by human changes made to the hydrology, either through the creation ofimpoundments, or simply due to the additional stress that expanding development places onwatershed resources.
Dead River BypassOne area of the watershed whose hydrology and aquatic habitat has been particularly impactedby the creation of impoundments, is the Dead River between the McClure Dam and theForestville Storage Basin. In this area, the main flow of water is being diverted via a pipeline tothe McClure Powerhouse further downstream. From the McClure Dam, downstream for 6.1miles, the Dead River is bypassed and receives only dam leakage and tributary flow that isestimated to be 7 cubic feet per second (cfs) (Godby and Suppnick 2001). The map on thefacing page identifies the location of the bypass channel in the Dead River. In August of 2000,the Michigan Department of Environmental Quality conducted an analysis of this bypassedreach of the Dead River to ascertain its effect on the fish community and temperature of thisstretch of river. Results of their analysis are summarized below (Godby and Suppnick 2001).
Fish CommunitiesThe MDEQ sampled fish populations in three reaches of the Dead River bypassed channel:Reach A (from the LS& I railroad tracks to the mouth of Midway Creek), Reach B (from MidwayCreek to the mouth of unnamed tributary), and Reach C (from unnamed tributary to the mouthof Brickyard Creek). Brook trout were the most abundant fish, however, their size was substan-tially smaller than what would be expected. Only 2.7% of the fish sampled were of legal size,while 63% of all captured trout were the young of the year. This imbalance is due to the lowvolume of water that exists in the bypassed reach (average depth = 1.1 feet). This shallowchannel does not provide suitable habitat for larger trout.
TemperaturesTemperatures in the bypassed reach met Michigan’s temperature standard for coldwater fisher-ies and were found to be suitable habitat for trout. According to the readings taken by MDEQ,temperatures increased an average of 5.2 degrees centigrade from the upstream start of thebypass to the downstream end.
Chapter Two - Natural Environment

8
Expanding development is contributing to the reduced water quality of local streams

9
Lower Dead River, Watershed Mgmt. Plan 2003
Flow AugmentationPlans have been made to augment the flow in the bypassed channel by requiring the UpperPeninsula Power Company to release a minimum flow of 20 cfs from the McClure Dam to thebypassed river channel in the 2004-2005 timeframe. The augmented flow is expected toincrease the velocity and average depth of the water in the bypass, resulting in improvedhabitat for larger trout. There may be some changes in the channel shape in areas that aresusceptible to scouring due to the increased velocity. The temperature of the water is notexpected to be affected, due to the deep-water draw at the McClure Dam.
Expanding Development
A second potential cause for water quality degradation is the influence of expanding develop-ment. Because most of this development is taking place near the City of Marquette and alongthe US41-M28 corridor, water quality in the southeastern portion of the watershed is most atrisk. This increased development prompted the Central Lake Superior Watershed Partnership toconduct a stream monitoring study of 3 local streams: Reany Creek, Brickyard Creek, andWhetstone Brook. Researchers used water quality, aquatic habitat conditions, and fish popula-tions to help determine the general health of each stream. Their study showed that the reachesdirectly affected by development (Brickyard and Whetstone) had lower overall stream healththan Reany Creek, which is still in a relatively undisturbed area of the watershed. “Althoughthese streams are less than 3 miles apart respectively, they are light years apart in terms ofoverall stream health. Monitoring showed that an increase in the amount of development andimpervious surfaces (roads, parking lots, roofs) directly correlated with a decrease in waterquality, aquatic habitat conditions, and fish populations” (CLSWP 2002).
Other analyses of this area have found that, while development has not yet had a significantimpact on the water quality, the potential exists for streams to suffer from future degradation.For example, in the areas of Brickyard and Wolner Creeks, erosion is beginning to affect streambanks, while poorly placed culverts increase the scouring of the stream channel due to excessivevelocity (ALNM 2002, Simandl 2002).
Chapter Two - Natural Environment
Erosion along the Brickyard Creek access road
Scouring of stream bank along Brickyard Creek

1 0
0.5 0 0.5 1 MilesLOWER DEAD RIVER WATERSHED MANAGEMENT PLAN
Sampling Stations# Macroinvertebrate
Sampling Stations
Lake, PondWetlandsLower Dead River Watershed
RoadwayRailroad
Perennial StreamIntermittent Stream
%g550
%g492
%g480
#
McClure Basin
#
Dead River Basin
#
Tourist Park Basin
Backyard Creek
Raney C
reek#
Tourist Park Basin
#
Dead River Basin#
McClure Basin#
#
Forestville Basin
Wol
ner C
reek
Badger Creek
Brickyard Creek
Dead R
iver
Midway Creek
Holyoke CreekReany Creek
IÀ ?ì
%g480
%g492
%g550
##
#
##
##
#1
#7 #8
#2
#5#3
#4
#6

1 1
Lower Dead River, Watershed Mgmt. Plan 2003
Chapter Two - Natural Environment
MACROINVERTEBRATE STUDIES
The number and diversity of macroinvertebrates found within a stream system can be anindicator of the habitat’s quality. In 2002, the Michigan Department of Natural Resourcesconducted a field study of the macroinvertebrates present at five of their eight samplingstations within the Lower Dead River watershed (see map on facing page for sampling loca-tions). The results of this study are presented in Table 2.3. All streams studied received a rating
of “Fair” with the exception ofBadger Creek, which received arating of “Poor”. Badger Creekcontained a limited amount ofmacroinvertebrate activity withonly eight taxa present. Of theeight types of organisms found,only three were found in quanti-ties greater than ten organismsper stream reach. Badger Creek isa designated storm drain for thecity of Marquette and is locatedwithin the most developed areaof the watershed. This wouldexplain the reduced aquatichabitat that often accompaniesthis type of heavy development.
TAXA Station
1 Station
2 Station
4 Station
5 Station
7
Group 1 (Sensitive) Midway
Crk Brickyard
Crk Badger
Crk Wolner
Crk Reany
Crk Coleoptera (Adult beetles) R R Coleoptera (Water penny) R R Diptera (Black fly larvae) R Ephemeroptera (Mayfly nymphs) R C R C C Gastropoda (Gilled snails) Megaloptera (Hellgrammites) R R Plecoptera (Stonefly nymphs) R R R C C Trichoptera (Caddisfly larvae) C C C C C Group 2 (Somewhat-sensitive) Amphipoda (Scuds) C Coleoptera (Beetle larvae) R R R R Decapoda (Crayfish) Diptera (Crane Fly larvae) R R R Megaloptera (Alderfly larvae) R R Odonata (Damselfly nymphs) R Odonata (Dragonfly nymphs) R R R R R Pelecypda (Clams) Group 3 (Tolerant) Diptera (Midge larvae) R R R Diptera (Other) R R Gastropoda (Pouch snails) R Hemiptera (True bugs) Hirudina (Leeches) R R R Isopoda (Sowbugs) R Oligochaeta (Aquatic worms) C C C C C Stream Quality Rating Fair Fair Poor Fair Fair NOTE: R = 1-10 organisms in each taxa found in stream reach C = 11+ organisms in each taxa found in stream reach
Table 2.3: Results of Macroinvertebrate Sampling
Macroinvertebrates, such as this dragonfly, are anindicator of stream health(Source: NABS 1999)

1 2
0.5 0 0.5 1 MilesLOWER DEAD RIVER WATERSHED MANAGEMENT PLAN
Topography Lower Dead River Watershed
Intermittent StreamPerennial Stream
WaterContours
RailroadRoadway
%g550
%g492
IÀ ?ì
%g492
%g550

1 3
Lower Dead River, Watershed Mgmt. Plan 2003
TOPOGRAPHY
The effects of the Pleistocene ice age can be seen in the varying topography throughout theLower Dead River watershed. This variety includes relatively flat areas, gently rolling hills, andvery steep slopes, particularly adjacent to stream and river corridors (Godby and Suppnick 2001,CUPPAD 1998). In Marquette Township nearly 25% of the township has slopes greater than15% (Sundberg et al. 1995). The map on the facing page shows the topography of thewatershed area.
This varied topography can be a determining factor in the pattern of development in thewatershed. Current construction techniques and the market’s strong desire to take advantageof long views and attractive vistas exerts significant development pressure on these fragileareas. However, when development occurs near steep slopes there is an increased risk oferosion, sedimentation, and damage to aquatic habitat. In their comprehensive developmentplans, both Marquette and Negaunee Townships discourage high-density development onmoderate slopes (15%-25%), preferring such development be located on areas with less relief(Sundberg et al. 1995, CUPPAD 1998). According to Marquette Township’s development plan,improper planning as it relates to the area’s topography can result in not only the destruction ofan aesthetic feature, but also “soil stability disturbances, altering of established drainageways,elimination of natural windscreens (vegetation), land slippage, and rapid erosion which adds siltand sediment to downstream waterways” (Sundberg et al. 1995).
Chapter Two - Natural Environment
Protecting Steep Slopes:The Lower Dead River watershed containssteeply sloped areas, many of which areadjacent to waterways. In order to protectthese fragile slopes, it is recommended thatvegetation along the edge of the stream notbe disturbed. This vegetation helps to controlerosion and prevents polluted stormwaterfrom flowing into the stream. Figure 2.1gives general guidelines for how large thisriparian buffer area should be. More infor-mation on riparian buffers is presented inChapter Five - Strategies & Recommenda-tions.
Figure 2.1: Vegetated Buffers Protect Steep Slopes

1 4
IÀ ?ì
%g480
%g492
%g550
0.5 0 0.5 1 MilesLOWER DEAD RIVER WATERSHED MANAGEMENT PLAN
Existing Vegetation Aspen, BirchConiferCroplandHardwoodHerbaceous OpenlandShrubland
WaterPerennial StreamIntermittent Stream
RailroadRoadway
1 5
Lower Dead River, Watershed Mgmt. Plan 2003
VEGETATION
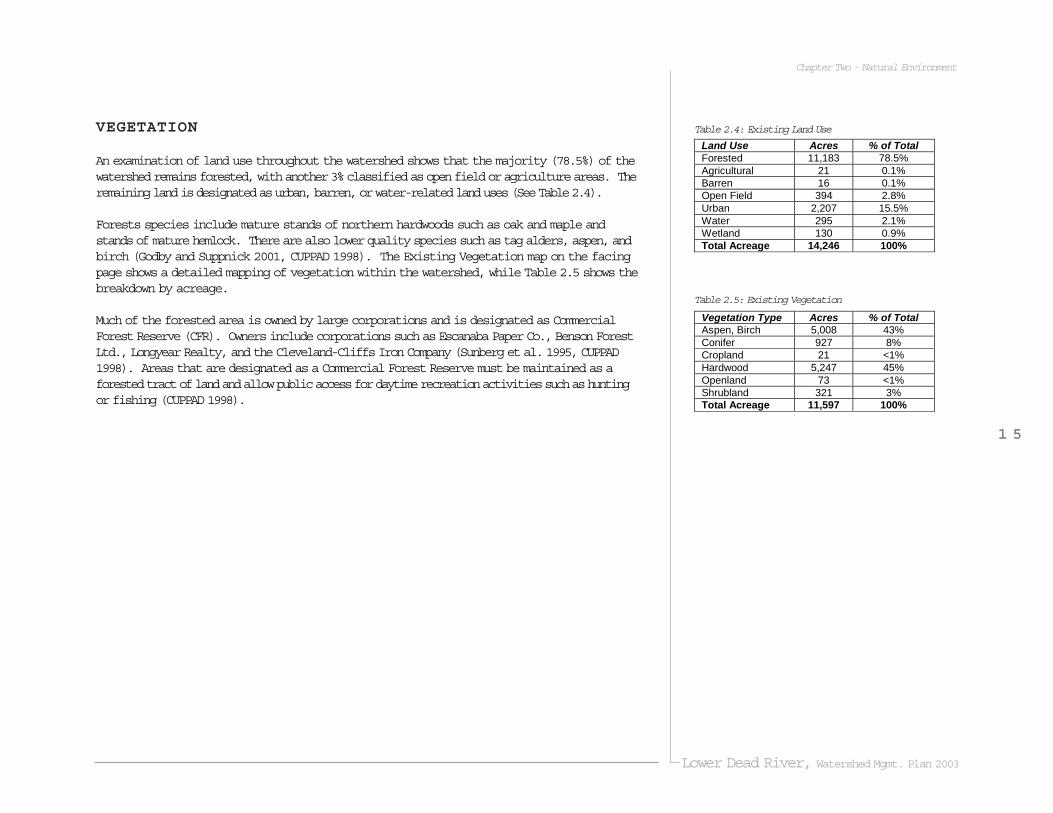
An examination of land use throughout the watershed shows that the majority (78.5%) of thewatershed remains forested, with another 3% classified as open field or agriculture areas. Theremaining land is designated as urban, barren, or water-related land uses (See Table 2.4).
Forests species include mature stands of northern hardwoods such as oak and maple andstands of mature hemlock. There are also lower quality species such as tag alders, aspen, andbirch (Godby and Suppnick 2001, CUPPAD 1998). The Existing Vegetation map on the facingpage shows a detailed mapping of vegetation within the watershed, while Table 2.5 shows thebreakdown by acreage.
Much of the forested area is owned by large corporations and is designated as CommercialForest Reserve (CFR). Owners include corporations such as Escanaba Paper Co., Benson ForestLtd., Longyear Realty, and the Cleveland-Cliffs Iron Company (Sunberg et al. 1995, CUPPAD1998). Areas that are designated as a Commercial Forest Reserve must be maintained as aforested tract of land and allow public access for daytime recreation activities such as huntingor fishing (CUPPAD 1998).
Chapter Two - Natural Environment
Vegetation Type Acres % of Total Aspen, Birch 5,008 43% Conifer 927 8% Cropland 21 <1% Hardwood 5,247 45% Openland 73 <1% Shrubland 321 3% Total Acreage 11,597 100%
Table 2.5: Existing Vegetation
Land Use Acres % of Total Forested 11,183 78.5% Agricultural 21 0.1% Barren 16 0.1% Open Field 394 2.8% Urban 2,207 15.5% Water 295 2.1% Wetland 130 0.9% Total Acreage 14,246 100%
Table 2.4: Existing Land Use

1 6
0.5 0 0.5 1 MilesLOWER DEAD RIVER WATERSHED MANAGEMENT PLAN
Surface GeologyLower Dead River WatershedRoadwayRailroad
Perennial StreamIntermittent Stream
Water
Coarse-textured glacial till
Glacial outwash sand and gravel and postglacial alluviumLacustrine sand and gravel
Thin to discontinuous glacial till over bedrock
IÀ ?ì
%g480
%g492
%g550

1 7
Lower Dead River, Watershed Mgmt. Plan 2003
SURFACE GEOLOGY
The surface geology and soil composition of a watershed can be important factors whenseeking ways to best protect the water quality of an area. Within the Lower Dead River water-shed the surface geology consists primarily of 4 categories (as shown in the map of SurfaceGeology on the facing page):
• Coarse-textured glacial till• Thin till over bedrock• Glacial outwash sand and gravel• Lacustrine sand and gravel
The areas of glacial outwash, sand and gravel are of particular importance since they serve asgroundwater recharge areas. These sandy soils provide opportunities for infiltration and serve toreplenish local water systems through groundwater recharge (ALMN 2002). Areas wherebedrock is near to the surface do not provide good sources of groundwater.
Chapter Two - Natural Environment

1 8 New development along the US41-M28 corridor

1 9
Lower Dead River, Watershed Mgmt. Plan 2003
Although a large portion of the Lower Dead River watershed still remains in its natural state,existing growth and development are already having an effect on the quality of the watershed’snatural resources. In order to better understand the pattern of this development, this chapterwill focus on identifying the watershed’s designated uses, the pattern of existing land use, andareas that are likely to experience future growth.
DESIGNATED USES
According to Brown et al. (2000) the identification of designated uses within a particularwatershed is a critical first step toward analyzing those uses that are not being met and thosethat are being threatened by activities on land. These “designated uses” are defined as theprotected uses of water as they are established by state and federal water quality programs(Brown et al. 2000). The state of Michigan provides a set of designated uses that all surfacewaters in the state are required to meet. The following list identifies the designated uses thatare currently being met by the Lower Dead River Watershed:
• Industrial water supply - The WeEnergies Presque Isle Power Plant, located at themouth of the Dead River, extracts water to cool their generating facility. The water isthen discharged into Lake Superior.
• Public water supply at the point of intake – Potable water is supplied to the City ofMarquette by the city water system. The municipal water intake is located near LowerHarbor. Townships within the watershed boundaries extract groundwater astheir means of potable water.
• Navigation – The Dead River system is considered navigable waters with public accesssites located at the McClure Basin, the Forestville Basin, and the Tourist Park Basin.
• Coldwater fishery – Streams in the watershed are known to support coldwater fishhabitat
• Indigenous aquatic life and wildlife – According to natural resources inventory theLower Dead River Watershed is recognized to support a variety of aquatic and wildlifespecies.
Chapter Three - Built Environment
ANALYSIS OF THE BUILT ENVIRONMENTChapter Three

2 0
Table 3.1: Threatened Uses in the Lower Dead River Watershed
Threatened Uses Source of Impairment Pollutants Sources Public Water Supply Increased stormwater inputs
Sedimentation Oils, grease, and metals Urban Runoff
Navigation Dam impoundments Stream channelization
Sediment Stream banks
Coldwater fishery Sedimentation Nutrient Loading Stream crossings Hydrologic flow Dam impoundments
Sediment Nutrients
Stream crossings Failing septic systems Residential fertilizer use
Indigenous Aquatic life/Wildlife
Eroding stream crossings River flooding Transportation/Utility corridors Increased development Loss of riparian vegetation
Sediment Hydrologic flow
Stream crossings Stream banks Hydrologic flow Urban stormwater

2 1
Lower Dead River, Watershed Mgmt. Plan 2003
• Partial body contact recreation – Waters are considered suitable for partial bodycontact recreation, with minimal threat to public health due to water quality.
• Total body contact recreation between May 1 and October 31 – All waters within theLower Dead River Watershed are considered suitable for full body contact during therecreation season.
As development continues and the effects of the built environment have a greater effecton the quality of natural resources, many of these designated uses can be at risk.Pollutants, sediments, stormwater runoff, and other man-made impairments cansignificantly reduce the number of designated uses that a particular water body cansupport. The Lower Dead River Watershed is beginning to see some of these designateduses being threatened due to impacts from the built environment. Table 3.1 identifiesthese threatened uses along with potential sources for impact within the watershed.
2 2
0.5 0 0.5 1 MilesLOWER DEAD RIVER WATERSHED MANAGEMENT PLAN
Existing Land UseIntermittent StreamPerennial Stream
RailroadRoadways
Forested
CommercialIndustrialInstitutionalMulti-Family ResidentialSingle-Family Residential
CroplandExposed RockExtractiveWater
Recreational / Cultural
Utilities / Transportation
Shrub/ Herbaceous
IÀ ?ì
%g492
%g550

2 3
Lower Dead River, Watershed Mgmt. Plan 2003
EXISTING LAND USE
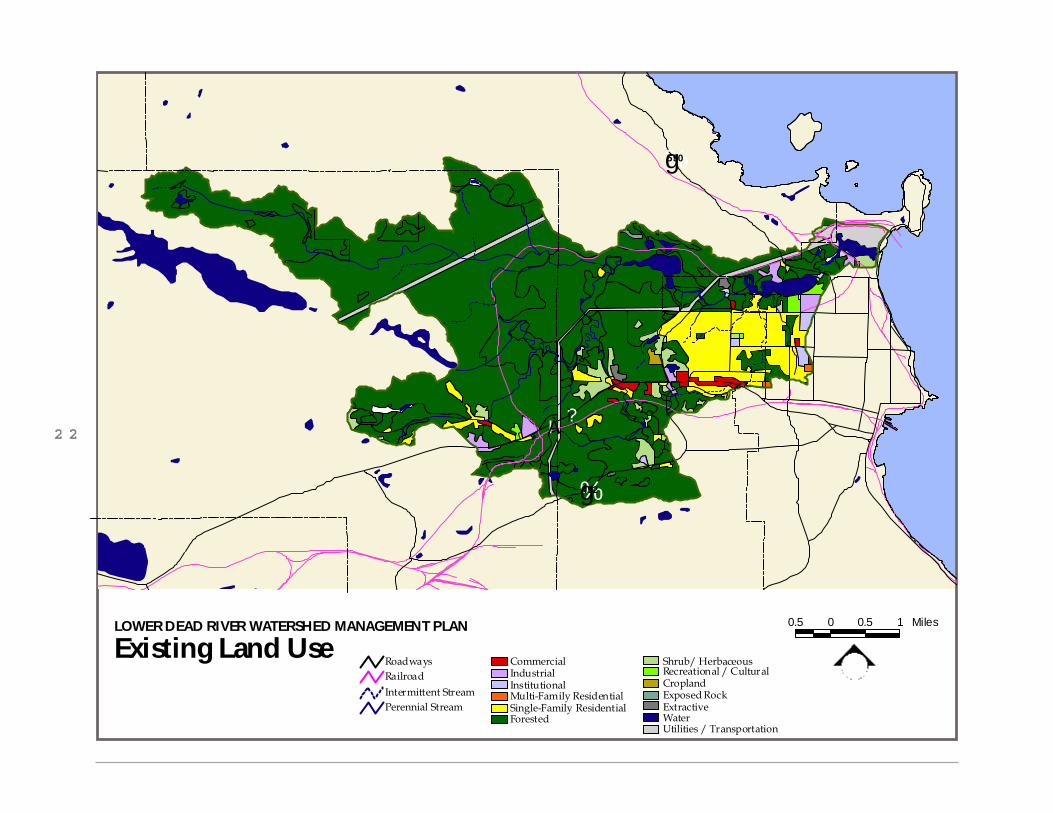
Understanding the current pattern of development within the watershed is a critical first steptoward identifying key areas of the watershed that may be impacted by further urban develop-ment. A map of Existing Land Use is presented on the facing page, while a breakdown of thehigh-level land uses is given in Table 3.2. Approximately 2,207 acres (15.5%) of the totalwatershed is currently developed for urban uses. Within this “urban” designation, the land usecan be further broken down into a variety of specific uses. This breakdown is given in Table 3.3.
As is shown on the land use map, the majority of development is located in the southeasternportion of the watershed, adjacent to the City of Marquette and along the US41-M28 transpor-tation corridor in Marquette Township.
Chapter Three - Built Environment
Table 3.3: Breakdown of Urban Land Uses
Land Use Acres % of TotalCemetery 26 1 %
Commercial 130 6 %
Extractive 34 1.5%
Industrial 171 7.75%
Institutional 67 3 %
Multi-Family 14 < 1 %Residential
Recreation 36 1.6%
Single-Family 1,258 58%Residential
Utilities, Waste 451 20%Disposal
Total Acreage 2,207 100%
Land Use Acres % of Total Forested 11,183 78.5% Agricultural 21 0.1% Barren 16 0.1% Open Field 394 2.8% Urban 2,207 15.5% Water 295 2.1% Wetland 130 0.9% Total Acreage 14,246 100%
Table 3.2: Existing Land Use

2 4
0.5 0 0.5 1 MilesLOWER DEAD RIVER WATERSHED MANAGEMENT PLAN
Future Development Areas Intermittent StreamPerennial Stream
Water
RoadwayCity of Marquette (Built Out)RailroadIndustrial
Development DistrictResidential
Lower Dead River Watershed Commercial
Wol
ner C
reek
Badger Creek
Brickyard Creek
Dead R
iver
Midway Creek
Holyoke CreekReany Creek
IÀ ?ì
%g480
%g492
%g550
Backyard Creek
Raney Creek

2 5
Lower Dead River, Watershed Mgmt. Plan 2003
FUTURE GROWTH AREAS
Because the area of the watershed that is within the City of Marquette is fully developed, mostof the future growth within the watershed will happen in the Marquette and Negaunee Town-ships. Both townships have experienced rapid growth over the last 50 years. MarquetteTownship saw a 62% increase in population between 1970-1990 (Sundberg et al. 1995), whileNegaunee’s population increased over 300% since 1940 (CUPPAD 1998). This growth hasprompted both townships to develop comprehensive plans to help guide future growth and toensure the protection of their existing natural resources. Both townships have placed a priorityon protecting their rural image and are making concerted efforts to control the pattern ofdevelopment. In general, future growth will be directed towards infill areas north and south ofthe US41-M28 highway and in areas where infrastructure and services are already available(Sundberg et al. 1995, CUPPAD 1998). These potential development areas are indicated on themap of Future Development Areas.
The US41-M28 highway serves as the backbone for much of the development in these twotownships. According to the Comprehensive Plan for Marquette Township, the commercialdevelopment and regional shopping malls along the US41-28 corridor serve as a “major corefor a variety of functions” (Sundberg et al. 1995). While this development area provides a setof retail amenities it is not without issues. According to Marquette’s Comprehensive Plan, thecost of development has included “environmental degradation, traffic congestion, housingshortages, changes in the rural landscape and the skyrocketing costs of municipal services”(Sundberg et al. 1995).
In addition to the new commercial development along the US41-M28 corridor, several areaswithin Negaunee and Marquette Townships are experiencing new residential developmentpressures in their outlying rural areas and adjacent to the large storage basins, particularly DeadRiver and McClure Basins. Unfortunately, much of this new development is not served bymunicipal services and residents rely on septic fields and private wells to meet their infrastruc-ture needs (CUPPAD 1998). These outlying areas of residential development can be a burdenon municipalities due to the increased cost of services to these areas. They can also have adetrimental impact on the environment, particularly where development exceeds the capacity ofan area to support septic systems, thus posing a risk for groundwater contamination. Though itmay be possible to extend the public infrastructure, planning for additional service areas is adifficult task. Currently, Marquette Township is exploring options to extend municipal wastewa-ter in the Trowbridge Park area. While utilities such as city sewer and water can allow for moredense development, perhaps halting the sprawling tendencies of large lot development, thisexpansion can also have significant detrimental effects on the environmental resources of thesenewly developed areas.
Chapter Three - Built Environment

2 6
0.5 0 0.5 1 MilesLOWER DEAD RIVER WATERSHED MANAGEMENT PLAN
Areas of Stream DegradationLower Dead River WatershedIntermittent StreamPerennial StreamRoadwayRailroad Water
$T Dam#S Erosion%U Physical Hazard
Water QualityÊÚ
%U%U
#S$T
#S
$T
#S
%U
#S
ÊÚ
%U %U
ÊÚ
#S
ÊÚ#S
ÊÚ
%U
#S
#S
#S
#S#S
#S
#S
ÊÚ
#
Tourist Park Basin
#
Dead River Basin#
McClure Basin $T
#
Forestville Basin
Wol
ner C
reek
Badger Creek
Brickyard Creek
Dead R
iver
Midway Creek
Holyoke CreekReany Creek
IÀ ?ì
%g492
%g550
$T$T
%g550
%g492
#
McClure Basin
#
Dead River Basin
#
Tourist Park Basin
Raney CreekBackyard Creek

2 7
Lower Dead River, Watershed Mgmt. Plan 2003
The Lower Dead River Watershed is impacted in myriad ways from human interaction with thewatershed’s natural systems. In its 2002 Progress Report, the Lake Superior Lakewide Manage-ment Plan identified a number of stressors that can have a direct effect on the health of awatershed. These included items such as increased levels of contamination, dam construction,habitat fragmentation, recreation, road construction, and shoreline residential development(LaMP 2002) (See map on facing page showing existing areas of stream degradation). Whiletheir effects may be easily demonstrated, it can sometimes be difficult to diagnose the source ofthese problems due to the variety of ways in which our actions can affect the health and vitalityof the watershed. Evidence of human impact ranges from the obvious, such as direct manipula-tion of the stream hydrology, to the subtle effects that even small personal choices can have onthe health of a stream system miles away. In the face of increasing development pressures,establishing protective measures to buffer these disturbances is paramount if the biotic integrityof the river system is to be protected according to the established goals of this study. Addition-ally, the protection of these watersheds directly affects the quality of the aquatic ecosystem inLake Superior.
In the Lower Dead River watershed system, the following human disturbances have led tosubstantial impacts on the watershed’s health:
1) Altered Hydrology – dam impoundments and stream channelization hasresulted in decreased stream length and severe loss of aquatic habitat.
2) Transportation Issues – creation of transportation and utility corridors includingstream crossings and the use of riparian corridors for roads and utilities, has ledto increased sediment, nutrient, and contaminant inputs, and the reduction ofhabitat quality.
3) Impacts of Development – increasing urbanization within the watershed hasresulted in increased impervious surfaces, increased stormwater inputs, point andnon-point source pollution, sedimentation, surface water drainage, nutrientinputs, and loss of riparian vegetation.
4) Recreational Activities – recreational access can result in the trampling ofvegetation, soil compaction, soil erosion, and other disturbances leading toincreased sedimentation and nutrient inputs into the stream system.
Chapter Four - Areas of Concern
AREAS OF CONCERN
New development along US41-M28
Chapter Four
New development within the watershed

2 8
Marquette Valley Milling Company
Historical Highlight – Remnants of History Along the Dead RiverThere were several industries that once lined the banks of the Dead River. Areas along the waterway saw the establishment of dams,generating plants, blast furnaces, silver and gold mines, flour mills, sawmills, and blasting furnaces. One such industry’s remains that canstill be found in the Lower Dead River watershed is the foundation of the late Marquette Valley Milling Company.
The first flour mill in the U.P. was owned and operated by Alphonse Bertrand in 1887. The original site was situated on a small creek thatemptied into the Dead River, downriver from the town of Collinsville. The creek was dammed and served as an abundant water supply formilling operations. 600 bushels of locally raised wheat were ground in the fall in addition to rye and grain for feed.
During the next few years, the mill experienced insufficient water supply. In March 1891, Mr. Bertrand sold the mill to local businessmenand the Marquette Valley Milling Company was established. The Milling Company negotiated with the city to purchase a new site alongthe Dead River. The first flour was ground in March 1892. The best grades of flour were sent to its U.P. merchants while various othergrades were shipped to New York, Georgia, and as far as England.
After the turn of the century, the flour mill business began to wane. Competition from bigger mills, higher freight costs, and the loss ofwater power from the Dead River attributed to the Marquette Valley Milling Company closing its doors. The last flour was milled in June1904 and soon thereafter the mill and elevator buildings were torn down. The ruins of the old stone foundation can still be seen on thesouth bank of the Dead River, east of the old light plant on Wright Street.

2 9
Lower Dead River, Watershed Mgmt. Plan 2003
ALTERED HYDROLOGY
Man has modified the Dead River for over 130 years. Since the original settlers to Marquettediscovered the river, dams were constructed to aid in log drives, assist in power for sawmills,and to create hydroelectricity for the community. Beginning in 1889 when the city built awooden dam for its first electrical plant (currently known as the Tourist Park dam) there hasbeen a series of changes to the natural flow regime of the Dead River system. By 1919 threemore dams had been built on the Lower Dead River including the Forestville and McClure Dams.These impoundments contribute to the 2.5 million dams found on rivers and streams through-out the United States. While dams and the hydroelectric facilities they power can be importantenergy producers for an area, they also exact a toll on the health of the river system theydepend on. Although the reduction in the use of coal-fired plants can reduce the amount oftoxic output being emitted into the system, the change in the river hydrology can lead todegraded aquatic habitat. By holding the water, there is potential for lowered stream depth,increased water temperatures, and a reduction in the dissolved oxygen levels in the water, all ofwhich can affect aquatic species (LaMP 2002).
As dams become decommissioned and dilapidated, there are compelling reasons to considerremoval of these structures. Aside from the potential cost of dam maintenance and repair,there are ecological reasons to consider their removal:
• Dams fragment rivers and block the movement of fish and other species
• Dams harm water quality, both above and below the structure
• Dams impede the river’s natural “flushing” functions
• Dam failure can be devastating to people, animals, property, and habitat
Chapter Four - Areas of Concern
Forestville Dam
Small residential dam along Brickyard Creek

3 0
0.5 0 0.5 1 MilesLOWER DEAD RIVER WATERSHED MANAGEMENT PLAN
Stream Crossings Lower Dead River WatershedIntermittent StreamPerennial StreamRoadwayRailroad Water
Ford
BridgeCulvert
#S#S#S#S Crossing (type unknown)
#S
#S#S
#S
#S
#S#S
#S#S#S
#S#S
#S#S
#S
#S#S
#S#S#S#S#S#S#S
#S
#S#S#S
#S#S
#S
#S#S#S
#S#S#S
#S#S#S#S
#S#S
#S
#S
#S
#S
%g550
%g492
%g480
#
McClure Basin
#
Dead River Basin
#
Tourist Park Basin
#
Tourist Park Basin
#
Dead River Basin#
McClure Basin
%g480
%g492
%g550%g550
%g492
%g480
?ìIÀ
Reany Creek
Holyoke Creek
Midway Creek
Dead R
iver
Brickyard Creek
Badger Creek
Wol
ner C
reek
#
Forestville Basin
#
McClure Basin
#
Dead River Basin
#
Tourist Park Basin
Raney CreekBackyard Creek

3 1
Lower Dead River, Watershed Mgmt. Plan 2003
TRANSPORTATION ISSUES
For any developing municipality, a transportation system that can adequately serve the needs ofits population is crucial. According to Marquette Township’s Comprehensive Plan, “to a signifi-cant degree, the success of a given land use area is determined by the ability of streets to affordvehicular access” (Sundberg et al. 1995). While this network of roads is critical to ensure themovement of people and goods throughout an area, they can also have a significant effect onthe ecology of the area. Specifically, the installation of culverts to provide for river crossings canpotentially reduce the habitat quality of streams and may directly contribute to the reduction infish populations in some instances. The map on the facing page shows the locations of existingstream crossings that may be contributing to habitat degradation.
Culverts have long been used in stream crossings because they are much less expensive thanbridges and are easier to install. However using culverts can reduce the habitat and fisheriespotential of streams. Habitat can be degraded through increased sedimentation and plungepools, which create waterfalls at the culvert outlet and can block fish migrating upstream.
Plunge pools are caused by the installation of culverts too small in diameter for the amount ofstream flow. As water collects upstream of the culvert, a hydraulic “head” is created whichcauses the water to shoot through the culvert with increasing velocity. This causes erosion onthe downstream end of the culvert as soil is scoured from the stream bottom and transporteddownstream. In severe cases, the downstream end of the culvert is left hanging above thestream, potentially blocking fish from migrating upstream. An example of just such a situationcan be found along Brickyard Creek. According to a hydrologic study of the Brickyard Creeksystem, STS Consultants found the stream was being routed through a 4’ culvert to accommo-date a railroad grade (Simandl 2002). When it was originally installed, the culvert was set toohigh and resulted in a free-fall of water for 3.5 feet into a pool that was the result of scouringby the force of the water. In order to help reduce the effect of this increased velocity, this areawas stabilized along the bank with large boulders and rip-rap.
Chapter Four - Areas of Concern
Improperly installed culvert
Culvert on Brickyard Creek

3 2
The impervious surface associated with new development can have a detrimental effect on the health of the watershed

3 3
Lower Dead River, Watershed Mgmt. Plan 2003
IMPACTS OF DEVELOPMENT
Research has shown that increased development can have profound effects on the waterquality and habitat potential within a watershed. Most municipalities, however, recognize thathalting all development is not a practical way to address these issues. This management planidentifies some of the most common factors that contribute to watershed degradation. Byconcentrating on addressing these issues, communities can protect their natural resources,while still protecting their community’s quality of life. Some of the worst offenders that con-tribute to the degradation of habitat and water quality include:
• Impervious Surfaces
• Stormwater
• Sedimentation / Erosion
• Temperature Fluctuations
Impervious SurfaceAs the need for development in Marquette County continues, so does the amount of landcleared for impervious surfaces. While the upper reaches of the Dead River watershed system ismostly forested, the land use within the Lower Dead River watershed includes 2,207 acres(15.5%) of developed land. Structures within this area, such as roads and rooftops, all contrib-ute to the amount of impervious surface found in the watershed.
While some naturally impervious sources, such as rock-outcroppings or clay soils, do exist, themajority of them are man-made. As more impervious surfaces are created, the amount ofwater running off of these surfaces and into local water systems also increases (See Figure 4.1).Studies show that on average, a typical city block generates nine times more runoff than anatural woodland area of the same size (EPA 1996). According to studies conducted by theMichigan DNR, “higher runoff correlates to decreased ground water recharge, decreasedbaseflow, increased and flashier stream flow, increases in temperature, turbidity, pollutants,erosion, and changes in aquatic biota” (Premo et al. 2001). Experts generally consider awatershed that has 11%-25% impervious surface to be “impacted”, while areas that containmore than 25% impervious surfaces are considered “degraded” (Premo et al. 2001).
Fortunately, there are steps that can be taken to reduce the impact of impervious surfaces onthe health of the watershed. Developers and stakeholders have shown a concern regardingstormwater and related non-point source pollution, and are looking for innovative ways to helpmitigate some of their effects. Specific strategies for reducing the impact of impervious sur-faces will be addressed in the “Management Strategies & Recommendations” section of thiswatershed management plan.
Chapter Four - Areas of Concern
Figure 4.1: Impacts of Impervious Surfaces(Source: Schueler 1994)

3 4
Figure 4.2: Depiction of Stormwater “Flash”(Source: Ferguson 1998)
Figure 4.3: High Level of Contamination in “First Flush”(Source: Ferguson 1998)

3 5
Lower Dead River, Watershed Mgmt. Plan 2003
StormwaterBecause the issue of stormwater is closely related to that of impervious surfaces, stormwaterissues are typically associated with broad land use categories, such as residential, commercial, orindustrial uses. As rainwater falls on an impervious surface, it is quickly collected in stormwatersystems and released into the local stream system, usually with no pre-treatment. When therate at which this stormwater is released is not properly managed, it can enter the streamsystem at a much higher velocity and temperature than water would naturally enter (See Figure4.2). This “flash” of water entering the stream can erode stream banks, damage riparianvegetation, and alter the shape of stream channels. Since the stormwater is often a muchhigher temperature than the natural stream water, it can also cause significant fluctuations inthe temperature of the waterway, resulting in damage to aquatic species.
Stormwater is also a transport mechanism for sediment and pollutants that can adversely affectthe health of a stream system. According to the EPA, “sediments and solids constitute thelargest volume of pollutant loads to receiving waters in urban areas” (EPA 1996). These pollut-ants are collected from areas such as construction sites, parking lots, roadways, and residentiallawns, and enter the stream system with the initial runoff (referred to as “first flush”) (SeeFigure 4.3). Contaminants can include “oil, grease, and toxic chemicals from automobiles;nutrients and pesticides from turf management and gardening; viruses and bacteria from failingseptic systems; road salts; and heavy metals” (EPA 1996). See Table 4.1 for a list of principalcontaminants commonly found in stormwater.
In 1997, Steuer et al. (1997) conducted an analysis of stormwater runoff for 12 storm eventswithin a 300-acre watershed in the Marquette area. Although these studies are not specific tothe Lower Dead River watershed, these data may reflect stormwater trends in the Marquettearea and offer ideas in better management practice.
According to these studies, the highest runoff coefficient was recorded for commercial parkinglots, followed by streets. Parking lots produced a disproportionately high load of hydrocarbonsand metals compared to all other source areas (Pitt, R. and J. Voorhees. 1989). As such,watershed managers can justifiably classify many parking lots as stormwater “hotspots”. Withdevelopment increasing along the US41-M28 corridor, proper stormwater treatment willbecome a critical component of watershed protection as more roadways and parking lots areconstructed.
Chapter Four - Areas of Concern
Pollutants Examples Metals zinc, cadmium, copper,
chromium, arsenic, lead Organic compounds pesticides, oil, gasoline, grease Pathogens viruses, bacteria, protozoa Nutrients nitrogen, phosphorus Biochemical Oxygen Demand (BOD)
grass clippings, fallen leaves, hydrocarbons, human / animal waste
Sediment sand, soil, silt Salts sodium chloride, calcium chloride
Table 4.1: Principal Contaminants in Stormwater(Source: NRDC 2001)

3 6
Sedimentation in Reany Creek

3 7
Lower Dead River, Watershed Mgmt. Plan 2003
Erosion and SedimentationSediment deposition in trout streams is a chronic problem in the Lower Dead River watershed.As stream banks erode or as stormwater washes into streams, sediment is deposited into thewaterway. These deposits can have a serious effect on aquatic species, particularly trout.According to Michigan DNR fisheries biologists, the number one pollutant affecting fisheries inthe area is sediment (Sundberg et al. 1995). These deposits can fill the holes and spawningareas of cold-water streams, leaving the trout with inadequate habitat for reproduction.
The source of this sediment is varied. Roadways that have inadequate ditches, banks, andvegetation can all contribute to the release of sediment into waterways. Construction sites canalso release tons of sediment if preventative measures are not taken to control erosion. Poorlyplanned development adjacent to lakes and streams can also create unstable conditions,particularly if a vegetated buffer is not maintained along the river’s course.
Chapter Four - Areas of Concern
Severe erosion adjacent to Brickyard access road
Erosion along Brickyard Creek

3 8
Coldwater streams in the Lower Dead River watershed support trout populations like the Brook Trout shown here

3 9
Lower Dead River, Watershed Mgmt. Plan 2003
Temperature FluctuationsBased on current fish community and stream temperature data collected by the MichiganDepartment of Environmental Quality, the Lower Dead River continues to be classified as acoldwater fishery. At present, however, the trend of the watershed is leading towards a warmwater fishery due to environmental degradation, a decline in mature fish population, andexisting dam impoundments. The Lower Dead River Watershed Council, whose missionincludes a commitment to sustain the coldwater fisheries in the Lower Dead River watershed,is seeking ways to reverse this degradation and protect the existing coldwater habitat for fishpopulations in the Lower Dead River.
Most types of environmental degradation (e.g. discharges, channelization, watershed develop-ment) increase summer temperatures in streams (Hynes 1970; Warren 1971; Kara andSchlosser 1978). Open canopies, decreased shading, and wider, shallower stream channelscreate more effective solar radiation absorption and lead to warmer stream temperatures.Culverts and ponds intensify the problem by backing up water and allowing suspendedsediments to settle to the bottom, thus decreasing depth, widening the stream, and increasingwater temperature. Stormwater runoff, which is generally at a much higher temperature, canalso raise the average temperature of local stream systems and may be a source for non-pointsource pollution.
In August 2000, a study was performed by the Michigan DEQ to measure the temperature ofthe Dead River along the bypassed channel between the McClure dam and the ForestvilleStorage Basin (Godby and Suppnick 2001). This study documented temperature trends in thisbypassed area and compared them to readings taken from Reany Creek, which is only affectedby natural weather patterns. Results confirmed a general pattern of increasing temperaturefrom one monitoring station to the next, with an average temperature increase of 5.2° centi-grade along the entire bypassed reach. While the stream segment still meets Michigan WaterQuality Standards for a coldwater stream, the fluctuation in temperature may point to poten-tial future problems. The expansion of development in the watershed coupled with man-madeand natural impoundments are factors in warming temperature trends resulting in degradationof coldwater streams and a decrease in biotic integrity.
Chapter Four - Areas of Concern
Sampling of local fish population

4 0
Footpaths can encourage erosion, particularly on slopesDesignated stream crossings should be used to protect fragile stream banks

4 1
Lower Dead River, Watershed Mgmt. Plan 2003
RECREATIONAL ACTIVITIES
Activities such as boating and hiking can often lead to the gradual degradation of thewatershed. The loading and unloading of watercraft can impact stream banks by tramplingthe vegetation, creating a footpath to the water’s edge, and encouraging erosion. Thesethreats can be eliminated by establishing public access sites and permanent dock structuresalong navigable water bodies. As new hiking trails are created, constant foot traffic to theseareas can lead to soil compaction and erosion. By directing hikers to a designated trail orcreating permanent walkways in areas that are susceptible to erosion, these threats can beeliminated.

4 2
Stream monitoring is an important tool for assessing the health of a watershed(Source: USDA Forest Service 2003)

4 3
Lower Dead River, Watershed Mgmt. Plan 2003
It can be discouraging to consider that human actions and the impact of our expanding devel-opment remain the primary sources of environmental degradation within the Lower Dead Riverwatershed. Fortunately, our involvement can also be the starting point for meaningful changethat results in the protection of the integrity of the Lower Dead River watershed. In order toaffect this change, the sustained commitment from a variety of involved parties is required.These participants include local government, community leaders, city and township planners,developers, business owners, landowners, and local residents. This chapter focuses on severalmanagement strategies participants can use to address many of the issues described in ChapterFour as well as a watershed protection goal for each recommendation.
STREAM MONITORINGIn order to clearly track the impact of development on the health of the watershed, a thoroughinventory of resources and periodic monitoring of local waterways should be undertaken.Although several studies have been done on individual reaches of the watershed, it is necessaryto compile a complete inventory of baseline data from which future progress can be measured.One recommendation is to employ the SWQAS Procedure #51 Survey Protocols for WadableRivers (formerly known as the GLEAS Procedure #51) as defined by the Michigan Department ofEnvironmental Quality Surface Water Quality Division (Schneider 2000). This protocol involvesthe measurement of biological and habitat indicators that result in a rating of the relative healthof a stream system. The survey consists of 3 parts; evaluation of the macroinvertebrate commu-nity, evaluation of the fish community, and evaluation of habitat quality. (Schneider 2000). Aseries of metrics are used to evaluate the water system at a number of sampling locations and arating indicating the level of stream quality is assigned (excellent, good, fair, or poor). Thisrating system also incorporates an analysis of limiting factors that can be a useful diagnostic toolwhen a detailed analysis of the cause for stream impairment is required. Stream surveyors notestream disturbances such as impoundments, canopy removal, or the presence of invasive fish orplant species. This thorough collection of baseline data will serve as a starting point from whichfuture progress can be measured, and the success of remediation strategies can be evaluated.
WATERSHED PROTECTION GOALIt is the objective of the Lower Dead River Watershed Council to maintain the establishedstream monitoring program. As watershed enhancement projects are installed, streams will beassessed with the goal of water quality ratings to be improved by five points on each tributary.Additional sites will be created as the need for monitoring arises.
MANAGEMENT STRATEGIES, RECOMMENDATIONS, &WATERSHED PROTECTION GOALS
Chapter Five - Strategies, Recommendations, and Goals
SWQAS Procedure No. 51:For a more detailed description of the P51protocol, an outline of this process ispresented through Michigan’s Department ofNatural Resources website. For additionalassistance, contact the Surface Water QualityDivision of the Michigan Department ofEnvironmental Quality or the MichiganDepartment of Natural Resources.www.michigan.gov/dnr/www.michigan.gov/deq/
Chapter Five

4 4Table 5.1: Guidelines for Two-zone Buffer
Zone Location Guidelines Zone 1: Streamside Zone Extends 25 feet from stream
edge Protects the physical and ecological integrity of the steam system. Should consist of undisturbed natural vegetation.
Zone 2: Outer Zone
Extends 25 feet from edge of streamside zone
Allowable uses include biking or hiking paths, stormwater management facilities, recreational uses, and removal of mature tree cover.
Voluntary Management Area
Recommended for area adjacent to buffer zone
Do not site septic fields, impervious surfaces, or permanent structures adjacent to buffer zone. Retain native vegetation when possible.
Table 5.2: Exceptions to Buffer Width
Sensitive area Additional buffer width Steep Slopes 15%-17% + 10 feet 18%-20% + 30 feet 21%-23% + 50 feet 24%-25% + 60 feet > 25% + 70 feet Wetlands Extend to encompass wetland
+ 20 feet past wetland edge Water Pollution Hazards
Site 150’-300’ from edge of waterway
Figure 5.1: Two-zone Riparian Buffer

4 5
Lower Dead River, Watershed Mgmt. Plan 2003
RIPARIAN BUFFERSOne simple, yet extremely effective tool for protecting the health and integrity of local waterwaysis the use of vegetated buffers along riparian corridors. These riparian buffers are areas ofvegetation located immediately adjacent to a water body or stream system. According to theEPA, these simple strips of vegetated land can offer enormous environmental benefits, including:
• Restoring and maintaining the physical and biological integrity of the water resources
• Removing pollutants from urban stormwater
• Stabilizing stream banks resulting in reduced erosion and sedimentation
• Providing infiltration of stormwater runoff
• Maintaining base flow of streams
• Contributing organic matter that serves as a source of food and energy for theaquatic ecosystem
• Providing tree canopy to shade streams and regulate temperature (EPA 2002)
To help establish guidelines for permitted and restricted uses, the EPA and the Michigan Depart-ment of Environmental Quality recommend using a multi-zone approach to differentiate appro-priate levels of activity within different areas of the riparian corridor. The Central Lake SuperiorWatershed Partnership is currently working on a draft of a riparian buffer ordinance in hopes thatit might be applied to waterways in Marquette County. Such an ordinance would recommend abuffer of 50 feet in total width for both sides of the stream system. Within this 50 feet, thebuffer would be divided into two distinct zones, a Streamside Zone and an Outer Zone (SeeFigure 5.1). Corresponding to each zone would be a set of permitted and restricted uses thatwould help to protect the water quality and aquatic habitat in the adjacent stream (See Table 5.1for a summary of these guidelines).
While the 50’ buffer is considered the general standard, there are situations where the presenceof an ecologically sensitive area requires a modification to this buffer width. In order to ensurethe protection of stream integrity, buffer expansions would be required for wetlands and areas ofsteep slope. See Figures 5.2 for a summary of these buffer extensions.
WATERSHED PROTECTION GOALIt is the goal of the Lower Dead River Watershed Council to work cooperatively with the CentralLake Superior Watershed Partnership and local city and township officials to establish therecommended buffer strip and setback guidelines. Special areas of concern that needremediation include approximately 5,000 feet of eroded streambank caused by the Dead Riverflood. In conjunction with the mentioned agencies, the Watershed Council will also support themission of the Central Lake Superior Land Conservancy by promoting conservation easementswith riparian land owners.
Chapter Five - Strategies, Recommendations, and Goals
Model Ordinance:To see a full copy of the draft riparian bufferordinance that is being developed by theCLSWP, please see Appendix C. Both the EPAand Michigan’s Department of EnvironmentalQuality have also specified best managementpractices for the implementation of theseriparian buffers and offer additional informa-tion regarding their use. For additionalassistance with this process, contact the EPA’sOffice of Wetlands, Oceans, and Watershedsor the Michigan Department of Environmen-tal Quality.www.epa.gov/owow/www.michigan.gov/deq/

4 6
Figure 5.2: Bioretention System

4 7
Lower Dead River, Watershed Mgmt. Plan 2003
STORMWATER MANAGEMENTThere are several stormwater management strategies that can be adopted in areas experiencingincreased development in the Lower Dead River watershed. These strategies are designed toaddress the three most critical components of a successful stormwater management plan:treatment of contaminants, management of water release rates, and temperature moderation.The strategies outlined below are designed to address these issues, ultimately resulting in theincreased protection of local waterways.
Infiltration SystemsInfiltration systems most closely resemble natural hydrologic processes. These systems allowstormwater to naturally infiltrate back into groundwater aquifers that eventually replenish localstreams and waterways. According to a study conducted by Ayres, Lewis, Norris, & May, Inc(2002), strategies “such as infiltration trenches, rain gardens, and bioretention areas should beutilized, site permitting”. Unfortunately, the success of an infiltration system is highly depen-dent on the specific characteristics of a site, such as soil properties and potential for groundwa-ter contamination. Generally, it is also only feasible for small drainage areas (Bobrin 2000).
Because they can be implemented on a smaller scale, infiltration systems may be a goodalternative for retrofit projects where existing development does not allow for the necessaryspace to install a conventional detention basin. For example, an existing parking lot can bemodified to include a bioretention swale that can process runoff from the lot and direct it into asmall infiltration system. Figure 5.2 shows how such a system could be implemented in arelatively small area.
Grassed SwalesIn a natural, undeveloped system, water often takes a slow, circuitous route toward its finaldestination. Today, with our increased attention toward efficiency and safety, our use of pipesand engineered stormwater systems “focus on directing and draining water off of pavedsurfaces as quickly and efficiently as possible” (Arnold and Gibbons 1996). This system ofconveyance, while efficient, has serious environmental impacts. The use of grassed swales andsediment forebays attempt to more closely mimic the natural system of water conveyance.Grassed swales help to slow the water and allow the water to be “cleaned” by the vegetationas it moves through the system.
Detention/Retention PondsOne of the most common strategies for addressing on-site stormwater treatment is the use ofstorage facilities such as detention or retention ponds. Generally, the goal of these systems is tocollect stormwater runoff from the developed area of a site, hold it for a predetermined periodof time, and release the water at a rate that is similar to pre-development rates. By holding the
Chapter Five - Strategies, Recommendations, and Goals

4 8
The “daylighting” of a local stream demonstrates how vegetation can help encourage infiltration of stormwater run-off

4 9
Lower Dead River, Watershed Mgmt. Plan 2003
Chapter Five - Strategies, Recommendations, and Goals
A detention basin retains and treats stormwater
water, particulate matter such as sediment, heavy metals, and other pollutants are allowed tosettle out of the water. This process results in less contamination being released into the localstream system. The effectiveness of this system can be increased by incorporating sedimentforebays into the design of the detention basin (Ayres, Lewis, Norris, & May 2002). Sedimentforebays are small, shallow pools located near the inlet of the storage basin. Forebays serve as atype of pre-treatment, allowing coarse sediments to drop out prior to entering the largerstorage basin. In areas where the basin will be discharging to a coldwater stream, temperature,as well as pollution control must be considered. In this cases, the use of a bottom-draw dis-charge should be considered as a way to ensure water entering the local stream system will notcause significant peaks in water temperature.
MaintenanceRegardless of the type of stormwater strategy employed, the success of any system is highlydependent on regular maintenance. Maintenance may include inspection of facilities, removalof contaminated sediment, maintenance of vegetation, and replacement of filters or othersupporting mechanisms.
Homeowner EffortsHomeowners can also take steps to control the stormwater on their own property. Significantamounts of rainwater and snowmelt are collected from rooftops and driveways of privatehomes and become part of the larger volume of stormwater that is directed into local stormsewers. The following is a list of easy steps that local homeowners can take to reduce theamount of stormwater that flows off of their property and into the stormwater system:
• Direct downspouts to discharge into yards or other vegetated areas ratherthan onto driveways or other impervious surfaces.
• Reduce the amount of fertilizer or pesticides used. These can be transportedvia stormwater into local waterways.
• Park automobiles on lawns before washing them. Lawns will appreciate theextra water and will help breakdown the soap, keeping it out of nearby streams.
• Use native vegetation when possible. These species generally have deep rootsystems that will soak up excess water, preventing it from becoming runoff.
WATERSHED PROTECTION GOALIt is the goal of Lower Dead River Watershed Council to encourage alternative stormwatermanagement strategies that will result in increased protection of the tributaries leading intothe Dead River. The council envisions a 20% load reduction from parking lots and impervioussurfaces over the next three years.
5 0
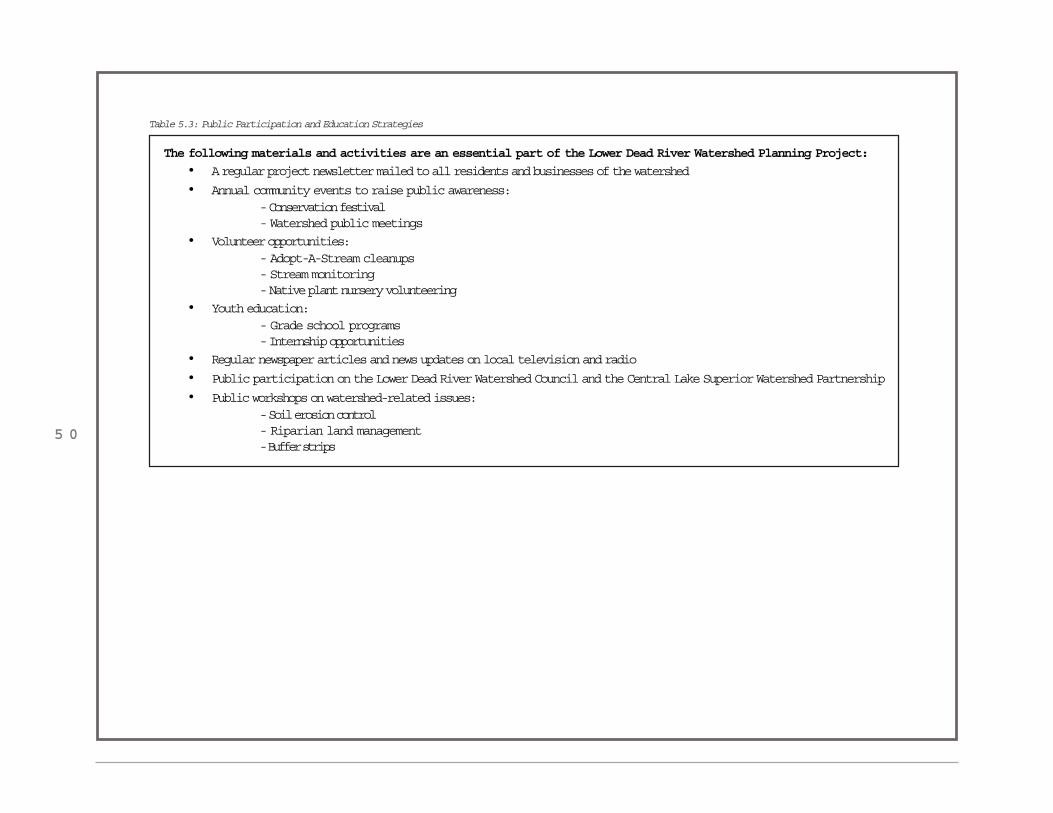
The following materials and activities are an essential part of the Lower Dead River Watershed Planning Project:
• A regular project newsletter mailed to all residents and businesses of the watershed
• Annual community events to raise public awareness:- Conservation festival- Watershed public meetings
• Volunteer opportunities:- Adopt-A-Stream cleanups- Stream monitoring- Native plant nursery volunteering
• Youth education:- Grade school programs- Internship opportunities
• Regular newspaper articles and news updates on local television and radio
• Public participation on the Lower Dead River Watershed Council and the Central Lake Superior Watershed Partnership
• Public workshops on watershed-related issues:- Soil erosion control- Riparian land management- Buffer strips
Table 5.3: Public Participation and Education Strategies

5 1
Lower Dead River, Watershed Mgmt. Plan 2003
PUBLIC PARTICIPATION & EDUCATIONInvolving the public in watershed protection through education and stewardship practicesmaintains the integrity of our local streams and reinforces a connection with our natural re-sources. The participation of local residents is extremely important to the success of a watershedmanagement plan, since the “majority of behavioral changes that will be needed to address thesources and causes of pollution in the watershed will be voluntary, rather than be required bylaw” (Brown et al. 2000). The power of an effective public education component cannot beoverestimated in a watershed management project. The Lower Dead River Watershed Councilcontinually recognizes this fact and is working to ensure that public education opportunitiescontinue to be available to residents of the Lower Dead River Watershed.
The Watershed Management Planning ProcessA critical first step in the public participation and education process is the actual developmentand implementation of the Watershed Management Plan. In order to ensure that there areopportunities for pubic input and education, The Lower Dead River Watershed Council willpresent the plan for public comment at the Peter White Public Library. During a two-weekperiod, the management plan will be available for the public to read and make comments. TheLower Dead River Watershed Council will also host a public hearing at the Marquette TownshipHall as an additional means to solicit public comment and discuss issues relative to the water-shed. All partners, agencies, and watershed land owners will be encouraged to attend.
In addition to the efforts being conducted by the Lower Dead River Watershed Council as a partof the watershed management plan effort, there are numerous other methods of outreach thatcan be used to promote involvement by a variety of community members.
Resident / Land Owner Education“Potentially unsustainable activities are not conducted by large, industrial polluters alone.Individual land use choices can either support or undermine sustainability in a given area” (LaMP2002). Because of the important role watershed residents and riparian homeowners play in theprotection of water quality, information on how their actions around the home impact waterquality is a key message to address in a public education effort. Bi-annual newsletters andpublic seminars are two methods of informing residents on happenings in the watershed andwill continually keep the door open for participation. Informational inserts in regular mailingssuch as residential water bills can alert people as to how their actions affect the resources wedepend on everyday. Field days and volunteer stream clean-up projects get watershed membersactively involved while increasing their awareness of their watershed surroundings. Table 5.3presents a list of activities that are included in the Lower Dead River watershed managementeffort, that enable residents to become involved. Such participation offers people an opportu-nity to witness first-hand the impacts of proper stormwater management and watershed protec-tion.
Chapter Five - Strategies, Recommendations, and Goals
Boy Scout Troop #305 stenciled drains to helpeducate residents about their stormwater system

5 2
A volunteer works with a group of school children at the annual Conservation Festival

5 3
Lower Dead River, Watershed Mgmt. Plan 2003
Chapter Five - Strategies, Recommendations, and Goals
Youth education at Vandenboom Elementary School
Developer EducationThrough contact with the Soil Erosion and Sediment Control Program, developers should beencouraged to view site planning in terms of watershed-wide effects and promote low impactdevelopment into the site design process. Assistance with riparian buffers, bioretention, andinfiltration methods can be offered to lessen the impact of stormwater run off.
Youth EducationWatershed education to area school children is a fundamental tool that encourages futurestewards of the environment. Watershed education in the classroom, field day exercises, aswell as the annual Conservation Fest hosted by the Marquette County Conservation District aresome ways that children learn of human impact on the environment. Such educationalprojects should include information on natural features of the local area, erosion, watershedprotection, and tips for how they can individually make an impact on the health of theirenvironment.
Involvement from MunicipalitiesLocal municipalities are an integral connection in overseeing local development withoutcompromising the sustainability of the watershed. Involvement of township and city boardmembers with the Lower Dead River Watershed Council will help maintain an active relation-ship and encourage a dialogue regarding zoning issues, upcoming development, and bestmanagement practices.
WATERSHED PROTECTION GOALIt is the goal of the council to continuously improve resident awareness of the Lower DeadRiver Watershed. Outreach activities such as project newsletters, newspaper articles, andpublic workshops on watershed-related issues are ways to increase this awareness, with thehopes of increasing council participation by 50%.

5 4
Component Definition Potential Examples Purpose Goals and objectives for the enactment of the overlay zone Definitions Definition of terminology Watershed Overlay Zone Boundary Physical boundary defined by the natural drainage basin of
the watershed being protected
Review Authority Identification of parties responsible for the review and enforcement of the overlay zone
Application Use and Provisions Specifications of restricted and permitted uses within environmentally sensitive areas
Sensitive areas include: - Riparian corridors - Recharge areas - Wetlands - Critical slopes
Development Guidelines Specification of restricted and permitted uses during site development
May include restrictions on: - Grading and filling - Use of fertilizer and pesticides - Roads and infrastructure - Treatment of existing conditions
Table 5.4: Components of a Watershed Overlay Ordinance

5 5
Lower Dead River, Watershed Mgmt. Plan 2003
PLANNING STRATEGIES
Because watershed boundaries typically span multiple municipal jurisdictions, the successfulimplementation of a watershed management plan depends on the cooperation of a number ofdifferent governmental organizations.
Creating Lines of CommunicationAn important first step toward the protection of watershed resources is the creation of commu-nication channels between the three municipalities located within the Lower Dead River water-shed. While most of the new development will take place within the townships of Marquetteand Negaunee, the City of Marquette, as the community located in the lowest reaches of thewatershed, may be most directly affected by the health and stability of the watershed. Theinterconnectedness of all of these communities as they relate to the Lower Dead River water-shed was made painfully obvious in the Spring of 2003, when the City of Marquette sufferedsevere flooding due to degraded conditions further upstream in the watershed. By establishingregular communication among the governing and planning boards in each of the municipali-ties, each community will be better informed and prepared to make the necessary changes toensure the protection of the entire Lower Dead River watershed.
Build Out AnalysisIn Chapter Three’s analysis of existing built conditions, several areas were designated as likelydevelopment sites based on existing land use plans and zoning. To better understand the effectthat fully building these development areas would have on the health of the watershed, adetailed build out analysis of these areas should be conducted. This process uses existingzoning and land use plans to identify the fullest extent to which development could occur. Thisanalysis takes into account the scope of “buildable land” based on physical characteristics(slope, suitable soils, etc.) as well as the what impact current ownership patterns might have ondevelopment. For example, if the large tracts of CFR forest land currently held by privatecorporations were to become available for private development, the effect on potential build-able areas would be significant.
Watershed Overlay OrdinanceBecause the Lower Dead River watershed crosses several jurisdictional boundaries, the imple-mentation of a watershed overlay ordinance can be a convenient way to ensure the sameprotection measures are applied in multiple municipalities. An overlay zone is a separate zoningdesignation that is placed on top of the existing zoning classification. Overlay zones areroutinely used for the protection of specific areas such as floodplains, wetlands, historicaldistricts, and stream setbacks. Table 5.4 shows information typically addressed in a watershedoverlay ordinance.
Chapter Five - Strategies, Recommendations, and Goals
Communication between involved municipalities iscritical

5 6
Figure 5.3: Example of a Conservation Subdivision (Source: Adapted from Arendt et al. 1994)
Conventional Subdivision Design
Conservation Subdivision Design
Ballfield
Park
Natural Area
5 7
Lower Dead River, Watershed Mgmt. Plan 2003
PLANNING STRATEGIES (CONTINUED)
Open Space PlanningAll of the communities located within the Lower Dead River watershed have expressed aninterest in maintaining the natural qualities of their communities. This not only protects theirvital natural resources, but also the quality of life for local residents. A number of planning toolscan be employed to facilitate this process. Such tools include the use of cluster developmentand conservation subdivision design for new residential development, greenways and conserva-tion corridors for the protection of open space, and Planned Unit Developments (PUDs) tocontrol the speed and pattern of new commercial development within the watershed.
Each of these tools attempts to mitigate the effects of development by maintaining areas ofopen space where natural ecological systems are still permitted to function (See Figure 5.3).Open space areas often encompass environmentally sensitive areas, such as unique forest standsor large wetland areas. In some cases, however, the purpose of the designated open space is topromote public access and appreciation of these “green” spaces. City parks, greenway corri-dors, or interpretive trails can all be useful tools for promoting conservation behavior within thelocal community. It also helps to maintain the rural aesthetic preferred by local residents. In astudy conducted by the Central Lake Superior Watershed Partnership, local residents expressedtheir concern regarding fragmentation of forest areas, loss of green space, and commercialsprawl without consistent land use planning among municipalities. They also expressed a desireto protect the rural character, natural viewshed, and public access to the extensive naturalresources of the Lower Dead River watershed (People and Land).
Low Impact DevelopmentLow Impact Development (LID) is defined by Ayres, Lewis, Norris, & May, Inc (2002) as a develop-ment process that “integrates site hydrology considerations into the site design process in orderto achieve storm water control through the development of a landscape that mimics the naturalhydrologic regime of the site”. This type of development includes a suite of tools that can behelpful in protecting the natural hydrology of a newly developed site. These include:
• Reducing the amount of impervious surface
• Protecting natural resources and ecosystems
• Maintaining natural drainage courses
• Minimizing the amount of grading
• Specifying proper maintenance of stormwater control measures
Chapter Five - Strategies, Recommendations, and Goals

5 8
The following materials and activities are an essential part of the Lower Dead River Watershed Planning Project:
• A regular project newsletter mailed to all residents and businesses of the watershed
• Annual community events to raise public awareness:- Conservation festival- Watershed public meetings
• Volunteer opportunities:- Adopt-A-Stream cleanups- Stream monitoring- Native plant nursery volunteering
• Youth education:- Grade school programs- Internship opportunities
• Regular newspaper articles and news updates on local television and radio
• Public participation on the Lower Dead River Watershed Council and the Central Lake Superior Watershed Partnership
• Public workshops on watershed-related issues:- Soil erosion control- Riparian land management- Buffer strips
Table 6.1: Public Participation and Education Strategies

5 9
Lower Dead River, Watershed Mgmt. Plan 2003
Chapter Six - Implementation
IMPLEMENTATIONChapter Six
THE PLANNING PROCESSThe Lower Dead River Watershed Planning project was developed with the assistance andoversight of several local agencies. Members of the Lower Dead River Watershed councilinclude representatives from:
• Marquette Township
• Negaunee Township
• City of Marquette
• Marquette County Board of CommissionersA complete list of participants by name and agency is included on the inside cover of thisreport.
Throughout the course of this plan, the Lower Dead River Watershed Council will host publicinformation meetings to review the progress of the study and discuss issues relative to thewatershed. As a means to solicit public involvement, meetings will be advertised in the MiningJournal, local radio, and local television stations. In addition to these public meetings, thewatershed council will continue to pursue a number of other public participation and educationopportunities as described in Chapter Five’s “Public Participation and Education” section (SeeTable 6.1 for a review of the materials and activities that will be included in the council’s publiceducation efforts). Throughout the planning process, the watershed council will continue towork with the local media to reach a wider watershed audience.
It is the function of the Lower Dead River Watershed Council to advise the project manager inthe planning process and to help coordinate the implementation strategies outlined in the plan.
• Marquette County Drain Commission
• Michigan DEQ
• Trout Unlimited
• Watershed Property Owners

6 0
Residents want to protect scenic resources, such as Reany FallsEnforcement of zoning ordinances and buffer guidelines will helpprotect the existing stream system

6 1
Lower Dead River, Watershed Mgmt. Plan 2003
PRIORITIZING AREAS OF CONCERNIn order to identify threatened uses, pollutants, and their potential sources, the WatershedCouncil will conduct a physical inventory and analysis of the Lower Dead River Watershed.Methods used to inventory the watershed include:
• Road crossing inventory – create a baseline inventory of culverts, identify areas wherestormwater or sediment may be reaching the stream, recognize associated land useand future development that may occur.
• Macroinvertebrate monitoring – evaluate habitat for macroinvertebrate and fishcommunity, establish baseline data from which future progress can be measured,identify sources or areas that may be impacting the stream.
Using the identified “Areas of Concern”, the Lower Dead River Watershed Council created anoverall prioritization methodology based on the following water quality concerns:contaminated stormwater runoff, flashy stormwater flow, obstructions to fish migration,stream crossings, lack of public education, water quality impacts to Lake Superior, andpotential impacts to drinking water supply. These concerns were organized into generalcategories – stormwater, fish migration obstruction, erosion, sedimentation, transportation,and public education – and ranked individually within each category. Each project wasassigned a priority of “high,” “medium,” or “low.” The results of this prioritization processwas the identification of the watershed enhancement projects identified later in this chapter.
IDENTIFYING DESIRED USESIn addition to water quality concerns, desired uses for the Lower Dead River Watershed shouldalso be identified. A desired use is based on factors important to the watershed community,how residents want to use the watershed, or how they want it to look. The following listidentifies the desired uses for the watershed:
• Restoration of the designated uses to the Lower Dead River Watershed that includesphysical improvements and quantifiable protection goals
• Protection of the Dead River system through enforcement of zoning ordinances, bufferstrip and setback guidelines, and permanent conservation easements
• Creation of better stormwater management techniques through education/demonstration sites and stormwater ordinances implemented by local municipalities
• Continuation of watershed outreach through bi-annual newsletters, communitywatershed events, youth education, and volunteer clean ups and monitoring
• Identification of open space planning and low impact development practices that willprotect the ecological resources of the watershed.

6 2
Table 6.2: Summary of Watershed Enhancement Projects
Site #
Watershed Enhancement Project Estimated Cost
Priority Suggested BMP
14 Railroad culvert replacement, Midway Creek 100,000 Low Replace old 1912 railroad culvert, improve stream channel
5 Sanderson’s culvert, Brickyard Creek 5,000 Low Remove culvert, stabilize stream banks
1 Reany Creek fords 50,000 Medium Improve stream crossings/ Construct bridges with higher load restrictions
19 Unnamed Creek Drainage Improvements 200,000 High Install storm sewers, curb and gutter, and drainage structures to eliminate flashy stormwater flow
9 Exposed culvert, Holyoke Creek 10,000 High Install new culvert, stabilize banks with rock riprap
4 CR510 Culvert Improvements, Midway Creek
25,000 High Stabilize sedimentation, fix railing supports, create water diversions
8 Wright Street erosion, Badger Creek 2,000 Low Stabilize banks with rock riprap 2 US 41/Brickyard Creek site 2,000 Low Stabilize stream banks 21 Raney Creek residential erosion site 10,000 Medium Eliminate erosion problems caused by
flashy stormwater flow 12
Dead River Falls erosion project 75,000 High Stabilize undercut banks, work with Longyear Realty to create alternative trail route
13 Vehicle removal, Badger Creek 2,000 Low Remove vehicle, dredge excess sediment
3 Earthen/residential dams, Brickyard Creek 3,000 Medium Remove dams 11 Forestville Road erosion site, Wolner Creek 2,500 Low Extend rock riprap 15 Vehicle removal, Badger Creek 2,000 Low Removal vehicle, dredge excess
sediment 18 White Bear Road sedimentation site, Reany
Creek 12,000 High Install permanent sediment traps,
work with White Bear Road Association to create road maintenance guidelines
10 Brookton Road crossing improvements, Badger Creek
15,000 Low Bank stabilization
17 LS&I perched culvert, Brickyard Creek 10,000 Medium Create riffle control structure 20 Montgomery Street crossing improvements,
Unnamed Creek 25,000 Medium Replace culvert, stabilize banks
7 Nature trail proposal, Badger Creek 75,000
High Native plant installation, stairs to eliminate soil compaction/ Information and education component
16 Culvert improvements, Unnamed tributary 10,000 Medium Create riffle control structure, stabilize banks
22 American Site 150,000 Medium Eliminate parking lot runoff and pollutants from entering Badger Creek
6 510 erosion site, Reany Creek 50,000 High Install bottomless arch culvert, stabilize banks
Estimated Total Cost $835,500

6 3
Lower Dead River, Watershed Mgmt. Plan 2003
Chapter Six - Implementation
IDENTIFYING WATERSHED ENHANCEMENT PROJECTSThe Lower Dead River Watershed Council compiled a list of watershed enhancement projectsbased on the findings of the management plan. In total, they identified twenty-two projectswith an estimated value of $835,500 (See Table 6.2). Many of the projects focus on the elimina-tion of excessive storm flows, erosion and sedimentation, and reduction of stream velocities.The council then prioritized each project as “high”, “medium”, or “low”, estimated the cost ofeach project, and compiled a phasing schedule for each.
Table 6.3 presents a summary of the prioritized expenditures for the Lower Dead River Water-shed. Fifty-four percent (54%) of the expenditures are for high priority projects in the water-shed. Some of these projects include drainage improvements for Unnamed Creek, installationof a new culvert on Holyoke Creek, bank stabilization on the Dead River Falls trail, and theinstallation of permanent sediment traps and creation of road maintenance guidelines for theWhite Bear Road Association. Thirty-one percent (31%) of watershed enhancement expendi-tures are considered medium priority while fifty-four percent (54%) are considered to be lowpriority projects.
Based on the priority of each project, a phasing schedule with the forecasted expenditures wascreated. Each project was ranked “immediate”, “near term”, or “long term” with anticipatedresults for all watershed enhancement projects to be completed within ten years. Table 6.4highlights the phasing schedule and expenditures.
Approximately 30% of the forecasted expenditures are designated as “Immediate” in nature.Projects were almost evenly distributed amongst these categories, with all enhancement projectsto be completed within ten years. This phasing strategy will allow various units of governmentsufficient time to budget for the projects and secure other funding sources.
EVALUATION PROCESSThe success of the implementation program outlined in the Lower Dead River WatershedManagement Plan will be measured by an improvement in water quality. Because this planincluded an assessment of stream quality using SWQAS Procedure 51 it would be suggestedthat this analysis was used as a baseline for future assessments. Conducting a SWQAS Proce-dure 51 within the same stream reaches on regular intervals (5 years) would provide a measureof how well the implementation plan is progressing, and if the goal of the program is beingachieved.
Table 6.4: Expenditures by Phasing Schedule
Immediate (1-2 Years)
Near Term (3-5 Years)
Long Term (6-10 Years)
Total
$247,000 30%
$329,000 39%
$259,500 31%
$835,500 100%
Lower Dead River Watershed
Table 6.3: Expenditures by Priority
High Medium Low Total $447,000
54% $258,000
31% $130,500
54% $835,500
100%
Lower Dead River Watershed

6 4
Table 7.1: Assessment of Areas Impacted by the Dead River Flood
Site # Area of Concern Linear feet of erosion
Section 3 From McClure Dam to McClure Power House 1a. Erosion below the McClure Dam, caused by basin overflow 40 ft 2a. Scoured bank 20 ft 3a. Rock deposits and eroded bank 160 ft 4a. Shoreline erosion 180 ft 5a. Undercut river bank 80 ft 6a. Longyear bridge washout, damaged shoreline 50 ft Total linear feet of erosion in Section 3 530 feet
Section 4 Forestville Dam to upper end of Tourist Park Basin
1b. Bank erosion next to Forestville Dam 250 ft 2b. Scoured bank 200 ft 3b. Undercut bank 30 ft 4b. Large debris pile 5b. Low undercut bank 200 ft 6b. Low undercut bank 200 ft 7b. Scouring along rip rap and bedrock below dam #1 8b. Scouring under wood penstock, bank failure exposing old foundation 15 ft 9b. Undercut river bank 150 ft 10b. Large debris pile, stream bank erosion 30 ft 11b. Large debris pile, stream bank erosion 30 ft 12b. Bank erosion 50 ft 13b. Bank erosion 20 ft 14b. Slumping bank 100 ft 15b. Bank failure 50 ft Total linear feet of erosion in Section 4 1,325 feet Section 5 From Tourist Park Dam to Mouth of Dead River
1c. East bank below Tourist Park, eroded bank 2,100 ft 2c. West bank below Tourist Park, eroded bank 2,150 ft 3c. Railroad bridge, footings washed out, 40 ft wide, 8 ft tall 320 ft 4c. Vertical bank failure, 40 ft long, 15 ft tall 600 ft Total linear feet of erosion in Section 5 5,170 feet Total linear feet of erosion in the Lower Dead River Watershed 7,025 feet

6 5
Lower Dead River, Watershed Mgmt. Plan 2003
Chapter Seven - Flood Update
FLOOD UPDATE - IMPACTS & OPPORTUNITIESChapter Seven
The severe damage done by the May flooding along the Lower Dead River serves to highlightthe importance of protective measures discussed in the management plan. Rushing watersfrom an upstream breach in the Silver Lake caused the earthen dam at Tourist Park to give way,resulting in the draining of the Tourist Park Basin. In addition to the Silver Lake breach,immediate effects of the flood damage included:
Nine bridges either damage or destroyedMonth-long shutdown of a major coal-fired power plantTwo parks and three public access sites damagedMajor river channel scouring and realignmentMajor soil erosion and vegetation loss along stream banksSignificant amounts of sediment deposited along the river and into Lake SuperiorDamage to Chinook salmon hatchery fish-pens, stressing or killing 130,000 fishLimited road access for residents and emergency vehicles north of the riverSignificant economic impacts to dozen of local businessesTemporary shut down of two iron-mines, laying off over 1,000 workers
In the weeks immediately following the flood, numerous federal, state, and local officialssurveyed and assessed the flood damage by helicopter, boat, and on-ground inventories. TheFederal Emergency Management Administration (FEMA) was requested to evaluate the disasterin hope of receiving federal aid and assistance. Though FEMA refused to declare Marquette adisaster area, funds were secured through the Natural Resources Conservation Service‘Emergency Watershed Protection’ program to remediate several severe areas of erosion andsedimentation.
To help remediate these damaged areas, banks were regraded and stabilized with rock rip-rap,and both Silver Lake and Tourist Park basin were hydroseeded to prevent further erosion. Thestatus of rebuilding the earthen dike at Silver Lake Basin and the dam at Tourist Park basinremains unknown as options are investigated and analyzed. The affected municipalitiescontinue to work together to seek additional funding sources.
Site of the drained Tourist Park Basin(Source: Peterson 2003)
Tourist Park dam gave way under pressure fromfloodwaters
Rip-rap and newly seeded grass help prevent erosion

6 6
6 7
Lower Dead River, Watershed Mgmt. Plan 2003
The following is a partial list of some grants and funds that can be used to help in the imple-mentation of the Lower Dead River watershed management plan. Funding sources are continu-ally changing and becoming available. Information on new sources of funding can be foundthrough the EPA, Michigan’s DNR and DEQ, and through many non-profit organizations dedi-cated to the protection of natural resources and water quality.
Inland Fisheries Resource Grants (MDNR)These funds are intended to encourage and enhance inland fishing opportunities and toprotect, maintain, or restore inland aquatic environments. Projects might include bank stabiliza-tion, piers, erosion control, and access sites. Applicants must demonstrate they can contributeat least 50% of the project’s cost as a match to the state-sponsored grant. Contact ToddGrischke, DNR, Fisheries Division, at 517-373-6762 for more application information.
Urban and Community Forestry Program (MDNR)Funds under this program are used to provide information and technical assistance to municipalgovernments and volunteer groups for urban and community forest activities. Appropriateprojects include tree inventories, land management plans, planting, and other maintenanceactivities. These funds are specifically set aside for local governments and nonprofit develop-ment in local communities. Appropriate projects would include reforestation or revegetation ofdegraded areas, community education projects that specifically address forestry or reforestationissues, and tree plantings. The deadline for project proposals is May of each year.
Michigan Natural Resources Trust FundThis fund provides grants to local units of government for acquisition and development of landsand facilities for outdoor recreation or the protection of Michigan’s significant natural resources.Appropriate uses include the creation or protection of wildlife or ecological corridors throughthe connection or buffering of state or local natural areas, forests, or game areas. Applicantsmust include their community’s adopted recreation plan along with their submission. Thedeadline for application is April 1 of each year.
Coastal Management Program (MDNR)These funds can be used to create or enhance public access to the great lakes, redevelopmentof a deteriorating urban waterfront, protection of sensitive coastal features, erosion/hazardcontrol in coastal areas and restoration of historic coastal features.
Non-Point Source Pollution Control Grant (MDNR)The purpose of this grant is to implement improvements outlined in approved watershedmanagement plans. These improvements can be used to address sources of non-point sourcepollution. Applicants must contribute a 25% match to the state-sponsored grant.
Chapter Eight - Funding Sources
FUNDING SOURCESChapter Eight

6 8

6 9
Lower Dead River, Watershed Mgmt. Plan 2003
FUNDING SOURCES (CONTINUED)
Great Lakes Protection FundThis fund seeks and selects projects based on the anticipated benefits to the health of the GreatLakes ecosystem. To be successful, tying the project work into a larger, basin-wide effort wouldtherefore be necessary. Projects should anticipate and prevent impacts to the Great Lakesecosystem or the specific component (like a developed watershed) of the Great Lakes ecosystemrather than attempt to correct areas already impacted. Applications are accepted at any time.
EPA Grant through Great Lakes National Program Office (EPA)These funds are distributed to action-oriented, collaborative efforts, leveraged by other fundingsources. Like the Great Lakes Protection Fund, this program selects projects based on theircontribution to the health of the Great Lakes system.
Watershed Surveys and PlanningThis organization provides planning assistance to Federal, State, and local agencies for thedevelopment of coordinated water and related land resources programs in watersheds and riverbasins. Priority will be given to studies which: (1) Contribute to achieving the National Conser-vation Program high priority objectives; (2) have a high likelihood of being implemented; (3) willbe implemented with no or relatively little Federal assistance; (4) have State and local assistancein the study; and (5) are of short duration (2 to 4 years) and (6) low cost. Special priority isgiven to the objectives of setting priorities in helping to solve problems of upstream ruralcommunity flooding, water quality improvement coming from agricultural non-point sources,wetland preservation and drought management for agriculture and rural communities. Specialemphasis is given to assisting communities which desire to adopt floodplain managementregulations to meet the requirements of the National Flood Insurance Program and Stateagencies in developing a strategic water resource plan. Types of assistance include provision ofspecialized services, advisory services and counseling.
Watershed Protection and Flood PreventionThis group provides technical and financial assistance in carrying out works of improvement toprotect, develop, and utilize the land and water resources in small watersheds. Technicalassistance is provided in designing, and installing watershed works of improvement. Financialassistance is provided for sharing costs of measures for watershed protection, flood prevention,agricultural water management, sedimentation control, public water-based fish, wildlife, andrecreation; and in extending long term credit to help local interests with their share of the costs.Watershed areas must not exceed 250,000 acres. Capacity of a single structure is limited to25,000 acre-feet of total capacity and 12,500 acre-feet of floodwater detention capacity. Typesof assistance include provision of specialized services, advisory services and counseling.
Chapter Eight - Funding Sources

7 0

7 1
Lower Dead River, Watershed Mgmt. Plan 2003
FUNDING SOURCES (CONTINUED)
Conservation Reserve ProgramThis program’s goal is to protect the Nation’s long-term capability to produce food and fiber; toreduce soil erosion; to reduce sedimentation; to improve water quality; to create a betterhabitat for wildlife. Eligible owners or operators may place highly erodible or other environ-mentally sensitive land into a 10-15 year contract. The participant, in return for annual pay-ments, agrees to implement a conservation plan approved by the local conservation district forconverting highly erodible cropland or other environmentally sensitive land to a long-termresource conserving cover i.e., eligible land must be planted with a vegetative cover, such as,perennial grasses, legumes, shrubs, or trees. Financial and technical assistance are available toparticipants to assist in the establishment of a long-term resource conserving cover.
Anadromous Fish Conservation Act ProgramThis program assists organizations in the conservation, development, and enhancement of thenation’s Anadromous fish stocks and the fish in the Great Lakes that ascend streams to spawn.Funds can be used for spawning area improvement, installment of fishways, data collection,construction of fish protection devices and hatcheries, and research to improve managementand increase Anadromous fish resources. Funds cannot be used for law enforcement, publicrelations, or construction of facilities and vessels, the primary purpose of which is to commer-cially harvest, handle, and process fishery products.
Chapter Eight - Funding Sources

7 2

7 3
Lower Dead River, Watershed Mgmt. Plan 2003
References
REFERENCES
Arendt, R., E. Brabec, H.L. Dodson, C. Reid, and R. D. Yaro. 1994. Rural by Design: MaintainingSmall Town Character. Chicago: American Planning Association.
Arnold Jr., Chester l. and C. James Gibbons. 1996. Impervious Surface Coverage – The Emer-gence of a Key Environmental Indicator. Journal of the American Planning Association. Vol. 62No. 2, Spring.
Ayres, Lewis, Norris, & May, Inc. (ALMN). 2002. Marquette Township Watershed Analysis.Project No. 73418-04.
Bobrin, Janis A. 2000. Rules of the Washtenaw County Drain Commissioner: Procedures andDesign Criteria for Storm Water Management Systems. May 2000.
Brown, E., A. Peterson, R. Kline-Robach, K. Smith and L. Wolfson. 2000. Developing a Water-shed Management Plan for Water Quality: An Introductory Guide. Lansing: Millbrook Printing.
Central Lake Superior Watershed Partnership (CLSWP). 2002. People and Land. Marquette, MI.
CUPPAD Regional Commission. 1998. Negaunee Township Comprehensive Plan.
Environmental Protection Agency (EPA). 1996. Managing Urban Runoff. Pointer No. 7, EPA841-F-96_004G.
Ferguson, Bruce K. 1998. Introduction to Stormwater: Concept, Purpose, Design. John Wiley &Sons, Inc.
Godby, Neal and John Suppnick. 2001. Channel Morphology, Fish Community, and TemperatureConditions of the Dead River Bypassed Channel Prior to Flow Augmentation. Michigan Depart-ment of Natural Resources, Surface Water Quality Division Report: MI/DEQ/SWQ-00/104.
Godby, Neal. 2002. A Biological Survey of Lake Superior Costal Tributaries in NorthernMarquette County. Michigan Department of Environmental Quality, Surface Water QualityDivision Report MI/DEQ/SWQ-02/017.
Hynes, H.B.N. 1970. The ecology of running waters. University of Toronto Press. Toronto.
Kara, J.R., and I. J. Schlosser. 1978. Water Resources and the Land-water Interface. Science201:229-234.
Lake Superior Work Group (LaMP). 2002. Lake Superior Lakewide Management Plan - LaMP:2002 Progress Report. Lake Superior Binational Program.

7 4

7 5
Lower Dead River, Watershed Mgmt. Plan 2003
REFERENCES (CONTINUED)
Natural Resources Defense Council (NRDC). 2001. Stormwater Strategies: Community Re-sponses to Runoff Pollution. CD-ROM.
North American Benthological Society (NABS). 1999. Freshwater Algae and MacroinvertebrateSlide Library [online]. [cited 25 July 2003]. Available <http://www.benthos.org/info/conserv/freshwslidelib.htm>.
Peterson, Aaron. 2003. FEMA Assesses Flood. The Mining Journal Online [online]. 21 May[cited 30 May 2003]. Available <http://www.miningjournal.net>.
Pitt, R. and J. Voorhees. 1989. Source load and management model (SLAMM) - An urbannonpoint source water quality management model. Wisconsin Department of Natural Re-sources. PUBL-WR-218-89.
Premo, B.J., D.T. Long, R.J. Huggett, D. Premo, W.W. Taylor, G.T. Wolff and K.G. Harrison. 2001.Recommended Environmental Indicators Program for the State of Michigan, July 2001. Michi-gan Environmental Science Board, Lansing.
Schueler, Tom. 1994. The Importance of Imperviousness. Watershed Protection Techniques.Vol. 1 No. 3, Fall.
Schneider, James C. (ed.) 2000. Manual of Fisheries Survey Methods II: With Periodic Updates.Michigan Department of Natural Resources, Fisheries Special Report 25, Ann Arbor.
Simandl, Kurt J. 2002. Brickyard Creek Hydrologic Study. STS Consultants Ltd, Project No. 2-10251.
Steuer, J., W. Selbig, N. Hornewer, and J. Prey. 1997. Sources of Contamination in an UrbanBasin in Marquette, Michigan and an Analysis of Concentrations, Loads, and Data Quality. U.S.Geological Survey, Water-Resources Investigations Report 97-4242.
Sundberg, Carlson and Associates, Inc. 1995. Charter Township of Marquette - ComprehensiveDevelopment Plan. Project #93-464.
USDA Forest Service. 2003. Field Work and Forest Inventory and Analysis [online]. [cited 22 July2003]. Available <http://www.srs.fs.usda.gov/gallery/field_work.htm>.
Warren, C.E. 1971. Biology and water pollution control. Saunders, Philadelphia.
References

7 6

Appendix A
APPENDIX A - Glossary
Lower Dead River, Watershed Mgmt. Plan 2003
Impervious surface1
Hard ground cover that prevents or retards the entry of water into the soil and increases runoff, such as asphalt, concrete, or rooftops.
Lacustrine2
Relating to, formed in, living in, or growing in lakes.
Riparian2
Relating to or located on the bank of a natural watercourse, such as a river, lake, or tidewater.
Stormwater1
Precipitation that accumulates in natural and/or constructed storage and stormwater systems during and immediately following a storm event.
1 Forester Communications, Inc. 2003. Stormwater [online]. [cited 21 July 2003]. Available <http://www.forester.net/sw.html>.2 Merriam-Webster. 2003. Merriam-Webster On-line – The Language Dictionary [online]. [cited 21 July 2003]. Available <http://www.m-w.com/home.htm>
7 7

7 8

Appendix B
APPENDIX B - Brickyard Creek Hydrologic Study
Lower Dead River, Watershed Mgmt. Plan 2003
TABLE OF CONTENTS1. Introduction2. Summary3. Descriptive Watershed Narrative4. Design Storm Runoff Analysis5. Conclusions6. Recommendations7. Tables
a. TR-55 Summaryb. Base Flow Summary
8. Figuresa. Watershed Map (USGS)b. Soils Map (USDA/SCS)
9. Appendicesa. SCS TR-55 Data Sheetsb. USDA/SCS Soils Classification
INTRODUCTION
The Lower Dead River Watershed Council was formed as one of the watershed groups under the Central Lake Superior Watershed Partnership for thepurpose of observing and studying the Dead River and its tributaries from the McClure Dam to Lake Superior. Members of the council include land-owners and other concerned citizens, commercial and industrial representatives, environmental/engineering consultants and student interns.
The council was formed in response to a request from Marquette Township to observe the existing and further potential effects from US 41 corridordevelopment, establish a basis for further study, raise public awareness, and make recommendations for corrective measures through cooperativeeffort.
For this study, the Marquette County Conservation District issued a Request for Proposals for engineering services to provide hydrologic analyses,observations and recommendations for watershed and stream stabilization for two tributary streams of the lower Dead River watershed. The twostreams designated for study were Erie Creek, which is a watershed in Trowbridge Park, and Brickyard Creek. Due to funding limitations, the studywas revised to only one watercourse, and because of its proximity to current commercial development, Brickyard Creek was selected as the morecritical of the two streams.
This report presents the results of field investigation, hydrologic modelling, conclusions and recommendations.
7 9

S U M M A R Y
In particular, the reach extending from the US 41 crossing upstream to the outlet from the Bishop Pond wetlands was designated as the study area.This reach begins adjacent to the Bishop Woods residential subdivision and flows by culvert through the railroad grade, Northwoods Road, BrickyardRoad and US 41. Within this reach, four sites were selected for measuring base flow and design storm flow for the 24 hour 2 year, 10 year and 100year events. Except for the Bishop Pond wetland outlet, these points are located at the downstream ends of culvert crossings: at the railroad grade,Brickyard Road and US 41.
Base stream flows were taken at these points by direct measurement using channel section/culvert geometry, gradient and stream velocity. Fieldverification was made to identify any points of “significant discharge” to the stream, with significant discharge defined as any flow greater than 50%of base flow for the stream at that point. Design storm flow rates at these points were calculated using the following sources: USDA Soils Conserva-tion Service Technical Release No 55 (TR-55); the MDEQ Land & Water Management Division publication, “Computing Flood Discharges for SmallUngauged Watersheds” by Richard Sorrell PE, Hydrologic Studies Group, 2000; aerial mapping by Aerometric for Marquette Charter Township; USGS7.5’ Marquette quadrangle; and USDA Soils Conservation Service Atlas for Marquette County, Michigan (sheet 47). Findings, conclusions and recom-mendations made in this report are based on the above methods and informational sources.
NARRATIVE
While base flows were measured directly from the four designated gauging sites, determination of design storm flows required characterization andmodelling of the entire upper watershed. The watershed which is drained by Brickyard Creek may be considered as consisting of two reaches: fromthe headwaters to Bishop Pond and surrounding wetlands, and from the Bishop Pond wetlands to the Dead River.
In general, the upper watershed is characterized by areas of rock outcrop and intermittent wetland, and is heavily wooded by a mixed hardwood andconifer forest in highland areas and boreal coniferous typical of isolated wetlands in this region. It is approximately 1483 acres and extends south ofCounty Road 492, west to the LS&I trestle at US 41, and east to the Bishop Woods residential subdivision. Elevations in the upper watershed rangeform 1320 ft in the western highlands to 1100 ft in the Bishop Pond wetlands.
Below 1100 ft, relief of the watershed becomes progressively less pronounced, and makes a transition to an area predominated by open and scrubwetlands which surrounds Bishop Pond. This area, including Bishop Pond is approximately 129 acres in extent. It is in this lower area, elevation 1100to 1060 ft, that the two tributaries from the western watershed form a confluence at Bishop Pond. As seen in the watershed map (Figure a), thedrainage pattern shifts, flowing toward the Dead River in a northwesterly direction. The topography and geomorphology of the southeastern upperwatershed area suggests that the area west of Bishop Pond in later Pleistocene times may have served as headwaters for the Badger and Whetstonewatershed systems, with Bishop Pond and surrounding wetlands the headwater for Brickyard Creek.
Bishop Woods is a 70 acre residential development located immediately east of Bishop Pond, and is served by paved roads and utilities which include astormwater collection and conveyance system. Stormwater outfalls from the system do not discharge directly into the Bishop Pond wetlands, but arerouted to retention/detention basins constructed with overflow discharge structures. Upon inspection of these basins, it is apparent that they havebeen designed as “dry” basins, with the floor of the basin situated above the groundwater table. In addition, the overflow structures do not showevidence of flowing water, which would indicate that these basins have thus far operated by retention and infiltration to groundwater.
8 0

Appendix B
Lower Dead River, Watershed Mgmt. Plan 2003
Locally, the outlet of Bishop Pond is considered to be the headwater/beginning of Brickyard Creek. Base flow was determined to be about 2 to 3cubic feet per second (cfs). From the outlet, the stream flows through about 1,000 feet of an indeterminate relatively flat system of wetland drainage,and from there begins to drop at an average gradient of about 1% until the gradient again decreases north of US 41.It is apparent that the Bishop Pond/wetlands area provides a very significant runoff storage factor, and it is this watershed characteristic which in effectseparates the upper and lower reaches of the watershed.
As Brickyard Creek flows out of the Bishop Pond wetlands, it forms into a well-defined permanent watercourse. It is at this point in the stream,approximately 1,000 feet downstream of Bishop Pond, that the first gauging point was established. Beginning at the north end of the wetlands, it isevident that the base flow of the creek as it descends is maintained by the hydrogeology of the sand/gravel aquifer driven by the source at the wet-lands. The creek flows from the wetlands through an undeveloped area to the railroad grade. This area is heavily wooded with thick undergrowth.The stream channel through this area is 3 to 4 feet in width and 1 foot in depth, with depth of flowing water 3 to 4 inches.
The stream passes through the railroad grade by means of a 4 foot diameter culvert set at a gradient which conducts flow from an upstream pool at avelocity visibly greater than that of the existing stream. Base flow was determined to be about 3 to 4 cfs. This flow discharges from the culvert byfree-falling about 3.5 feet to a pool 5 to 6 feet in diameter and 3 to 4 feet deep, which has evidently been scoured from the streambed. Backwaterand tailwater conditions suggest that the culvert was set (circa 1910) too high, and velocity suggests that it was set at an excessive gradient relative tothe existing streambed. The outfall area has been stabilized by the placement of rock riprap and larger ballast at the toe of the slope and surroundingbank areas.
From this point the stream passes through a relatively flat wetlands floodplain 40 to 50 feet wide, with the stream channel section geometry remain-ing fairly constant at 3 to 4 feet wide by 1 foot in depth from streambed to overbank. Base flow through this section, which runs from the railroadgrade crossing to the Northwoods Road crossing at a depth of 3 to 4 inches, appears to be variable. These observations suggest that the streamchannel is of adequate depth to accommodate some amount of stormwater flow, with the wetland/floodplain acting as reserve storage/detention inlarger events.
The stream passes through a 3 foot diameter culvert under Northwoods Road, flows for a short distance along the north side of the road in the formof a ditch, then passes under Brickyard Road through another 3 foot diameter culvert. Both the Northwoods Road culvert and the Brickyard Roadculverts are well situated, having been set with upstream and downstream inverts at or slightly below the existing streambed.
Base flow measurement at the downstream end of the Brickyard Road culvert indicates a flow of about 3 cfs. This in turn would indicate that there isa degree of loss in volume as the stream flows through the wetlands floodplain area between the railroad grade and Northwoods Road.
The most likely cause for this loss is the groundwater divide (of the Wollner Creek watershed) located immediately east of Brickyard Creek. Terrainelevations only 300 feet east of Brickyard Creek are lower than this section of the stream. It is of interest to note that groundwater from the sand/gravel aquifer in this area was encountered in very significant quantities during the construction of foundations for Menards. An extensive system offoundation and perimeter grade drains was constructed to alleviate the high groundwater levels. The outfall for the Menards subgrade drain systemis located at the head of the constructed mitigation wetlands at the northeast corner of the property. This outfall is always flowing.
From Brickyard Road, the stream begins flow in a well-defined ravine with a relatively narrow floodplain. This characteristic section geometry deepensand widens as the stream approaches its confluence with the Dead River. From Brickyard Road to US 41 the stream drops about 30 feet over a flowdistance of approximately 1,200 feet at a gradient of about 3%.
8 1

At a distance of 35 feet upstream of US 41 are the remnants of a low head dam which impounds a small pool. The backwater discharges through aspillway/low section in the dam and flows to the box culvert under US 41. The box culvert consists of two 6 ft deep by 6 ft wide barrels well situatedwith respect to the existing streambed. As is typical of tandem box culverts, one side (in this case the west barrel) takes most of the flow while theother becomes partially obstructed with stream sediment. The base flow measurement made at the downstream end of the US 41 culvert indicatedthat two thirds of the volume flowing through the west barrel and one third flowing through the east barrel, totalling about 3 to 4 cfs.
The above point is the last designated gauging point. Much of the stream from this point downstream to the Dead River is inaccessible, due toproperty ownership and the considerable physical barrier posed by the floodplain wetlands which widen as the stream approaches its confluence withthe Dead River. However, the following observations may be made: 1) north of US 41 and west of the power line service road, the channel deepens,widens and begins to exhibit sinusoidal meandering typical of low gradient and sediment load with tailwater control (at the Dead River); 2) the ravinewidens with progression downstream, encompassing increasing areas of floodplain wetlands; 3) the Brickyard Creek/Dead River floodplain confluenceis complex and contains a system of cutoff meander ponds and meander scars; 4) the vertical depth of the ravine, from upland edge to water surfaceranges from 35 to 40 feet, and 5) the depth of flow in Brickyard Creek increases and the velocity decreases progressively toward the confluence.These observations indicate that the lower reach of Brickyard Creek from the power line service road to confluence with Dead River provides a verysignificant storage of volume and detention of stormwater flow to the Dead River.
CONCLUSIONS
• The stormwater collection and retention/detention system for Bishop Woods residential development is observed to be designedand maintained adequately. Direct or “significant” flow to the Bishop Pond wetlands is not evident.
• The culvert passing under the railroad grade is set high and at an excessive grade relative to the existing streambed.
• The area west of the stream between the railroad grade and Northwoods Road is the location of a rental storage facility, and itappears as if the gravel parking lot for this facility has displaced some of the floodplain wetlands.
• By direct measurement the stream appears to lose volume as it flows from the railroad grade to the Brickyard Road culvert,probably from exfiltration to the Wollner Creek headwaters aquifer immediately east of Brickyard Creek.
• From the Brickyard Road culvert downstream to the Dead River, the watershed morphology is unusual in that it is relatively verynarrow and as a result flow increases very little with progression downstream.
• Runoff from the commercial establishments along Northwoods and Brickyard Roads is in the form of sheet flow which is a non-pointdischarge, and therefore does not constitute a “significant flow” of any degree.
• The existing small dam immediately south of the highway is in a deteriorated condition and impounds a small backwater.
• Runoff from US 41, although causing some erosion immediately off the shoulder on the south side of the road, is in the form ofsheet flow/non-point discharge and does not constitute a significant flow.
8 2

Appendix B
Lower Dead River, Watershed Mgmt. Plan 2003
• The access to the powerline service road from Brickyard Road north of US 41 is subject to repeated washout, erosion and streamsedimentation.
• West of the powerline service road, the stream enters a deeply incised and increasingly wide wetland floodplain capable of adetaining a considerable volume of storm runoff from immediate discharge to the Dead River.
• The Bishop Pond/wetlands complex acts as a very significant stormwater runoff detention/retention area of the upper watershed.
RECOMMENDATIONS
• Occasionally monitor the Bishop Woods subdivision retention/detention basin discharges.
• Since it would be impractical to replace or adjust the railroad grade culvert, an energy dissipation structure should bedesigned and constructed to further stabilize the outfall pool area.
• Runoff and erosion from the rental storage facility parking area should be monitored for sedimentation and/or pollutants.
• The gravel shoulders of Northwoods and Brickyard Roads and any commercial or residential establishments adjacent to thecreek should be monitored on occasion for erosion.
• Following removal of the deteriorated dam south of US 41, the stream should be restored as nearly as possible to its originalcondition. In the event of significant upstream development such as the Menards No 3 outlot, this area could be considered foran offset detention/settling basin.
• The eroded bank off the south shoulder of US 41 should be graded and seeded/planted with an appropriate ground cover.
• The access from Brickyard Road north of US 41 to the powerline service road should be graded and stabilized against erosionand sedimentation to the stream. A sedimentation trap downstream of the culvert should be considered in any case.
• In order to more accurately determine the existing storage/detention capacity and groundwater infiltration characteristics of theBishop Pond/wetlands complex (and proposed design enhancements), a more detailed study of this area in the upper watershedshould be undertaken.
8 3

Flow class
(K) coefficient
(L) Length (ft.)
Elevation Change (ft.)
(s) Slope (%)
v=K(s)exp0.5 velocity (ft/sec)
T= L/v Travel time (hrs)
headwaters sheet 0.48 2,000 50 2.5 0.76 0.73 waterway 1.2 200 20 10.0 3.79 0.02 “ “ 600 20 3.33 2.19 0.08 “ “ 2,600 20 0,77 1.05 0.69 “ “ 1,200 20 1.67 1.55 0.21 “ “ 1,000 20 2.00 1.70 0.16 “ “ 700 20 2.86 2.03 0.10 “ “ 1,300 20 1.54 1.49 0.24 “ “ 3,000 20 0.67 0.98 0.85 “ “ 2,500 20 0.80 1.07 0.65 Tributary 2.1 1,900 2 0.11 0.70 0.75 “ “ 160 2 1.25 2.35 0.02 Bishop Pond Outlet
16,620 234 1.44 1.026 4.50
Tributary 2.1 800 18 2.25 3.15 0.07 Railroad grade
17,420 252 1.45 1.059 4.57
Tributary 2.1 560 14 2.50 3.32 0.05 Brickyard Road
17.980 266 1.48 1.081 4.62
Tributary 2.1 1,150 37 3.22 3.37 0.08 U.S.-41 19.130 303 1.58 1.131 4.70
Table (a): TR-55 SUMMARY
8 4

Appendix B
Lower Dead River, Watershed Mgmt. Plan 2003
Although a detailed stormwater detention design and analysis are beyond the scope and intent of this report, the following observations and conclu-sions may be made. The wetlands area immediately upstream of Bishop Pond is about 15 acres in extent and could store approximately 30 acre-feetor more of runoff from a significant event. The relatively small outlet from Bishop Pond appears to accommodate a more or less constant flow. Inaddition to detention in the wetlands, there is also apparently considerable infiltration to the underlying aquifer. In this analysis, we have used aponding factor (F(p)) of 0.65 as per the above methods. However, it is suspected that this factor should be less, and design storm flows particularlythose for the 100 year event will likely be 30% to 40% less than as given above.
design storm P(in) SRO(in) F(p) 2 yr 2.39 0.03 0.59 10 yr 3.48 0.24 0.62 100 yr 5.32 0.95 0.65 Gauging point
T© (hrs)
Q(base) (cfs)
Q(u)* (cfs/in/sqmi)
A(m) (sqmi)
Q(2) (cfs)
Q(10) (cfs)
Q(100) (cfs)
Bishop Pond
4.50 3 80.11 2.32 3.29 27.66 114.8
Railroad Grade
4.57 4 79.11 2.39 3.35 28.13 116.7
Brickyard Road
4.62 3 78.42 2.43 3.37 28.36 117.6
US 41 4.70 3 77.34 2.48 3.39 28.54 118.3
Table (a) - Continue: TR-55 SUMMARY
Table (b): BASE FLOW SUMMARY
*Q(u) = 270.9 (T© exp -0.81), bylogarithmic linear regression analysis from“Computing Flood Discharges for SmallUngauged Watersheds” by RichardSorrell, PE; MDEQ Land & WaterManagement Division Hydrologic StudiesUnit, 2000.
8 5
Gauging Site
Channel Slope (%)+/-
Observed Velocity (ft/sec)
d/D q/Q Q(full) (cfs)
Q (cfs)
Bishop pond
3 ft x 4” depth
- 3 - - - 3
Railroad grade
4’ dia cmp 2.5 - 0.083 0.020 200 4
Brickyard road
3’ dia cmp 1.0 - 0.056 0.030 100 3
US 41 twin 6’x6’
box culverts 1.0 - 0.021 0.008 500 3

FIGURE (a) – USGS WATERSHED MAP (see original study for figures)FIGURE (b) - USDA/SCS SOILS MAP (see original study for figures)
APPENDIX (a) - SCS TR-55 DATA SHEETS (see original study for data sheets)APPENDIX (b) - USDA SOILS CLASSIFICATION & HYDROLOGIC GROUPS (see below)
Appendix (b) - USDA SOILS CLASSIFICATION & HYDROLOGIC GROUPS
Soils Designation
Description Hydrologic Group
Upland Soils 125D Keweenaw/Kalkaska rock outcrop complex A 125F Keweenaw/Kalkaska dissected complex
(moraine formation) A/B
40B Waiska cobbly/loamy sand B 13B Kalkaska sand A 12B Rubicon sand (outwash plains & stream terraces) A Wetlands Soils 93 Tawas/Deford Muck/Sand D/A 57 Carbondale/Tawas Muck/Sand D/A
8 6

Appendix C
Lower Dead River, Watershed Mgmt. Plan 2003
APPENDIX C - Riparian Buffer Ordinance (Draft)
Riparian Buffer Ordinance - OutlineThe following riparian buffer ordinance was adapted from the EPA’s model buffer ordinance and designed to suit the specific needs of MarquetteCounty.
PurposeThe purpose of a riparian buffer ordinance in Marquette County is to ensure the protection of water quality and aquatic habitat within the localstream systems. The protection of the natural vegetation adjacent to waterways is intended to protect the physical integrity of the system, reduce theamount of non-point source pollution entering these systems, and to protect and enhance the aquatic habitat of the region.
Outline of OrdinanceThe proposed ordinance includes the following information:
Section I - IntentOutlines the purpose of the ordinance
Section II - BackgroundReviews the benefits such an ordinance would have for the local stream system
Section III - DefinitionsEstablishes standard definitions to ensure clear communication of the ordinance
Section IV - Design Standards for Riparian BuffersDescribes the detailed design of the riparian buffer including permitted and restricted uses
Section V - Buffer Management and MaintenanceOutlines permitted and restricted activities related to buffer management and maintenance
Section VI - Enforcement ProceduresReviews the procedures for enforcement of the ordinance
Section IX - Waivers / VariancesDescribes the process for obtaining a waiver or variance related to the buffer ordinance
8 7

8 8
Section I. IntentThe purpose of this ordinance is to establish minimal acceptable requirements for the design of buffers to protect the streams, wetlands, and flood-plains of ___________________ [jurisdiction]; to protect the water quality of watercourses, reservoirs, lakes, and other significant water resourceswithin ___________________[jurisdiction]; to protect ___________________ ‘s [Jurisdiction’s] riparian and aquatic ecosystems; and to provide for theenvironmentally sound use of ___________________ ‘s [jurisdiction’s] land resources.
Section II. BackgroundBuffers adjacent to stream systems and coastal areas provide numerous environmental protection and resource management benefits that can includethe following:
1. Restoring and maintaining the chemical, physical, and biological integrity of the water resources2. Removing pollutants delivered from urban stormwater3. Reducing erosion and sediment entering the stream4. Stabilizing stream banks5. Providing infiltration of stormwater runoff6. Maintaining base flow of streams7. Contributing the organic matter that is a source of food and energy for the aquatic ecosystem8. Providing tree canopy to shade streams and promote desirable aquatic organisms9. Providing riparian wildlife habitat10. Furnishing scenic value and recreational opportunity
It is the desire of the ____________________________[jurisdiction] to protect and maintain the native vegetation in riparian and wetland areas byimplementing specifications for the establishment, protection, and maintenance of vegetation along all stream systems and/or coastal zones withinour jurisdictional authority.
Section III. DefinitionsActive ChannelThe area of the stream channel that is subject to frequent flows (approximately once per one and a half years) and that includes the portion of thechannel below the floodplain.
Best Management Practices (BMPs)Conservation practices or management measures that control soil loss and reduce water quality degradation caused by nutrients, animal wastes,toxics, sediment, and runoff.
BufferA vegetated area, including trees, shrubs, and herbaceous vegetation, that exists or is established to protect a stream system, lake, reservoir, or coastalestuarine area. Alteration of this natural area is strictly limited.

Lower Dead River, Watershed Mgmt. Plan 2003
Appendix C
8 9
Development1. The improvement of property for any purpose involving building2. Subdivision or the division of a tract or parcel of land into two or more parcels3. The combination of any two or more lots, tracts, or parcels of property for any purpose4. The preparation of land for any of the above purposes
Nontidal WetlandsThose areas not influenced by tidal fluctuations that are inundated or saturated by surface water or groundwater at a frequency and duration suffi-cient to support, and that under normal circumstances do support, a prevalence of vegetation typically adapted for life in saturated soil conditions.
Nonpoint Source PollutionPollution that is generated by various land use activities rather than from an identifiable or discrete source and is conveyed to waterways throughnatural processes, such as rainfall, stormwater runoff, or groundwater seepage rather than direct discharges.
PollutionAny contamination or alteration of the physical, chemical, or biological properties of any waters that will render the waters harmful or detrimental to1. Public health, safety, or welfare2. Domestic, commercial, industrial, agricultural, recreational, or other legitimate beneficial uses3. Livestock, wild animals, or birds4. Fish or other aquatic life
Stream ChannelPart of a watercourse either naturally or artificially created that contains an intermittent or perennial base flow of groundwater origin. Base flows ofgroundwater origin can be distinguished by any of the following physical indicators:1. Hydrophytic vegetation, hydric soil, or other hydrologic indicators in the area(s) where groundwater enters the stream channel in the vicinity
of the stream headwaters, channel bed, or channel banks2. Flowing water not directly related to a storm event3. Historical records of a local high groundwater table, such as well and stream gauge records.
Stream SystemA stream channel together with one or both of the following:1. 100-year floodplain2. Hydrologically related nontidal wetland
StreamsPerennial and intermittent watercourses identified through site inspection and US Geological Survey (USGS) maps. Perennial streams are those whichare depicted on a USGS map with a solid blue line. Intermittent streams are those which are depicted on a USGS map with a dotted blue line.
Water Pollution HazardA land use or activity that causes a relatively high risk of potential water pollution.

9 0
Section IV. Design Standards for Riparian BuffersA. A riparian buffer for a stream system shall consist of a forested strip of land extending along both sides of a stream and its adjacent
wetlands or steep slopes. The riparian buffer width shall be adjusted to include contiguous sensitive areas, such as steep slopes andwetlands, where development or disturbance may adversely affect water quality, streams, wetlands, or other waterbodies.
B. The riparian buffer shall begin at the edge of the stream bank of the active channel.
C. The riparian buffer shall be composed of two distinct zones, with each zone having its own set of permitted and restricted uses(See Figure 1).
1. Zone 1 - Streamside Zone1. Protects the physical and ecological integrity of the stream ecosystem.2. Begins at the edge of the stream bank of the active channel and extends 25 feet from the top of the bank plus any additional
buffer width as specified in this section.3. Allowable uses within this zone are highly restricted to:
1. Flood control structures2. Utility right of ways3. Footpaths4. Road crossings, where permitted.
4. Streamside Zone contains undisturbed natural vegetation.
Figure 1: Two-zone Riparian Buffer

Lower Dead River, Watershed Mgmt. Plan 2003
Appendix C
9 1
2. Zone 2 - Outer Zone1. Protects key components of the stream and provides distance between upland development and the Streamside Zone.2. Begins at the outer edge of the Streamside Zone and extends 25 feet.3. Allowable uses within the Outer Zone are restricted to
1. Biking or hiking paths2. Stormwater management facilities, with the approval of ____________ [jurisdiction].3. Recreational uses as approved by _____________ [jurisdiction].4. Removal of mature tree cover
4. Middle Zone requires the retention of the shrub layer and herbaceous ground cover to allow infiltration of runoff.
Extensions to Minimum Buffer WidthA. The required width for the Riparian Buffer totals 50 feet (Zone 1 = 25’, Zone 2 = 25’). This buffer shall be extended if wetlands or steep
slopes are present.
1. Wetlands: When wetlands are present, the width of the Streamside Zone shall be adjusted so that the Zone 1 buffer will consistof the extent of the wetland plus 20-feet beyond the wetland edge.
2. Percent Slope: The riparian buffer width shall be modified if steep slopes are within close proximity to the stream and drain intothe stream system. The following extensions will be added to the standard 50’ Riparian Buffer in relation to the slopeof the stream bank. The extensions are calculated as follows:Percent Slope Buffer Extension Total Width of Riparian Buffer15%-17% add 10 feet 60 feet18%-20% add 30 feet 80 feet21%-23% add 50 feet 100 feet24%-25% add 60 feet 110 feet> 25% add 70 feet 120 feet
B. Water Pollution Hazards: The following land uses and/or activities are designated as potential water pollution hazards, and mustbe set back from any stream or waterbody by the distance indicated below:
1. Storage of hazardous substances - (150 feet)2. Above ground or underground petroleum storage facilities - (150 feet)3. Drainfields from onsite sewage disposal and treatment systems (i.e., septic systems) - (100 feet)4. Raised septic systems - (250 feet)5. Solid waste landfills or junkyards - (300 feet)6. Confined animal feedlot operations - (250 feet)7. Subsurface discharges from a wastewater treatment plant - (100 feet)8. Land application of biosolids - (100 feet)

9 2
Section V. Buffer Management and MaintenanceA. The riparian buffer, including wetlands shall be managed to enhance and maximize the unique value of these resources.
Management includes specific limitations on alteration of the natural conditions of these resources. The following practices andactivities are restricted withinboth zones of the riparian buffer, except with approval by _____________ [jurisdiction]:
1. Clearing of existing vegetation (except as noted previously)2. Soil disturbance by grading, stripping, or other practices3. Filling or dumping4. Drainage by ditching, underdrains, or other systems5. Use, storage, or application of pesticides, except for spot spraying of noxious weeds or non-native species consistent with
recommendations of _____________ [jurisdiction]6. Housing, grazing, or other maintenance of livestock7. Storage or operation of motorized vehicles within Zone 1, except for maintenance or emergency use.
B. The following structures, practices, and activities are permitted in the riparian buffer, with specific design or maintenance features, subjectto the review of _____________ [jurisdiction]:
1. Roads, bridges, paths, and utilities:1. An analysis needs to be conducted to ensure that no economically feasible alternative is available.2. The right-of-way should be the minimum width needed to allow for maintenance access and installation.3. The angle of the crossing shall be perpendicular to the stream or buffer in order to minimize clearing requirements.4. The minimum number of road crossings should be used within each subdivision, and no more than one fairway crossing
is allowed for every 1,000 feet of buffer.
2. Stormwater management:1. An analysis needs to be conducted to ensure that no economically feasible alternative is available and that the project is
either necessary for flood control, or significantly improves the water quality or habitat in the stream.2. In new developments, onsite and nonstructural alternatives will be preferred over larger facilities within the stream buffer.3. When constructing stormwater management facilities (i.e., BMPs), the area cleared will be limited to the area required for
construction and adequate maintenance access, as outlined in the most recent edition of ___________ [refer to localjurisdiction’s stormwater requirements].
4. Material dredged or otherwise removed shall be stored outside the buffer.
3. Stream restoration projects, facilities and activities approved by _________ [jurisdiction] are permitted within the riparian buffer.
4. Water quality monitoring and stream gauging are permitted within the riparian buffer, as approved by ___________ [jurisdiction].
5. Individual trees within the riparian buffer that are in danger of falling, causing damage to dwellings or other structures, orcausing blockage of the stream may be removed.
6. Other timber cutting techniques approved by the agency may be undertaken within the riparian buffer under the advice andguidance of _______________ [jurisdiction] if necessary to preserve the forest from extensive pest infestation, disease infestation,or threat from fire.

Lower Dead River, Watershed Mgmt. Plan 2003
Appendix C
9 3
C. All plans prepared for recording and all right-of-way plans shall clearly:1. Show the extent of any riparian buffer on the subject property2. Label the riparian buffer3. Provide a note to reference each zone of the riparian buffer stating: “There shall be no clearing, grading, construction or
disturbance of vegetation except as permitted by the agency”.4. Provide a note to reference any protective covenants governing all riparian buffers areas stating: “Any riparian buffer shown
hereon is subject to protective covenants that may be found in the land records and that restrict disturbance and use of these areas.”
D. All riparian buffer areas shall be maintained through a declaration of protective covenant, which is required to be submitted for approvalby ____________ [jurisdiction]. The covenant shall be recorded in the land records and shall run with the land and continue in perpetuity.
E. All lease agreements must contain a notation regarding the presence and location of protective covenants for riparian buffer areas andshall contain information on the management and maintenance requirements for the forest buffer for the new property owner.
F. An offer of dedication of a riparian buffer area to the agency shall not be interpreted to mean that this automatically conveys to thegeneral public the right of access to this area.
G. __________ [jurisdiction] shall inspect the buffer annually and immediately following severe storms for evidence of sediment, deposition,erosion, or concentrated flow channels and corrective actions taken to ensure the integrity and functions of the riparian buffer.
H. Riparian buffer areas may be allowed to grow into their vegetative target state naturally, but methods to enhance the successionalprocess such as active reforestation may be used when deemed necessary by ______________ [jurisdiction] to ensure the preservationandpropagation of the buffer area. Riparian buffer areas may also be enhanced through reforestation or other growth techniques as aform of mitigation for achieving buffer preservation requirements.
Section VI. Enforcement ProceduresA. _____________ [jurisdiction] is authorized and empowered to enforce the requirements of this ordinance in accordance with the
procedures of this section.
B. If, upon inspection or investigation, the _____________ [jurisdiction] is of the opinion that any person has violated any provision of thisordinance, he/she shall with reasonable promptness issue a correction notice to the person. Each such notice shall be in writing and shalldescribe the nature of the violation, including a reference to the provision within this ordinance that has been violated. In addition, thenotice shall set a reasonable time for the abatement and correction of the violation.
C. Violations of these provisions are subject to the enforcement provisions of ______________ [jurisdiction’s] zoning ordinance.

9 4
Section VII. Waivers/VariancesA. This ordinance shall apply to all proposed development except for activities that were completed prior to the effective date of this
ordinance and had received the following:1. A valid, unexpired permit in accordance with development regulations2. A current, executed public works agreement3. A valid, unexpired building permit4. A waiver in accordance with current development regulations.
B. The _________________ [jurisdiction’s] Zoning Board of Appeals may grant a variance for the following:1. Those projects or activities for which it can be demonstrated that strict compliance with the ordinance would result in a practical
difficulty.2. Those projects or activities serving a public need where no feasible alternative is available.3. The repair and maintenance of public improvements where avoidance and minimization of adverse impacts to nontidal wetlands
and associated aquatic ecosystems have been addressed.4. Those developments which have had buffers applied in conformance with previously issued requirements.
C. Waivers for development may also be granted in two additional forms, if deemed appropriate by the Zoning Board of Appeals:1. The buffer width made be reduced at some points as long as the average width of the buffer meets the minimum requirement.
This averaging of the buffer may be used to allow for the presence of an existing structure or to recover a lost lot, as long as theStreamside Zone (Zone I) is not disturbed by the reduction and no new structures are built within the 100-year floodplain.
2. _________________ [jurisdiction] may offer credit for additional density elsewhere on the site in compensation for the loss ofdevelopable land due to the requirements of this ordinance. This compensation may increase the total number of dwellingunits on the site up to the amount permitted under the base zoning.
D. The applicant shall submit a written request for a variance to the _________________ [jurisdiction] . The application shall include specificreasons justifying the variance and any other information necessary to evaluate the proposed variance request. The agency may require analternative analysis that clearly demonstrates that no other feasible alternatives exist and that minimal impact will occur as a result of theproject or development.
E. In granting a request for a variance, the _________________ [jurisdiction] may require site design, landscape planting, fencing, signs, andwater quality best management practices to reduce adverse impacts on water quality, streams, wetlands, and floodplains.
Section VIII. Conflict With Other RegulationsWhere the standards and management requirements of this ordinance are in conflict with other laws, regulations, and policies regarding streams,steep slopes, erodible soils, wetlands, floodplains, timber harvesting, land disturbance activities, or other environmental protective measures, the morerestrictive shall apply.

Lower Dead River, Watershed Mgmt. Plan 2003
Appendix C
9 5
Follow-up InformationAdditional information on the creation and establishment of riparian corridors can be found at the EPA or the Michigan DEQ websites. Examples suchas model ordinances or best management practices for the implementation of riparian buffers are provided.Visit:<http://www.epa.gov/owow><http://www.michigan.gov/deq>
ReferencesEnvironmental Protection Agency (EPA). 1996. Managing Urban Runoff. Pointer No. 7, EPA841-F-96_004G.
Environmental Protection Agency (EPA). 2002. Model Ordinances to Protect Local Resources [online]. [cited 27 May 2003]. Available <http://www.epa.gov/owow/nps/ordinance/mol1.htm>.
Premo, B.J., D.T. Long, R.J. Huggett, D. Premo, W.W. Taylor, G.T. Wolff and K.G. Harrison. 2001. Recommended Environmental Indicators Program forthe State of Michigan, July 2001. Michigan Environmental Science Board, Lansing.
Tonello, M., C. Frieburger, A. Nuhfer, and S. Sutton. Riparian Zone Management and Trout Streams: 21st Century and Beyond. Michigan Department ofNatural Resources, Fisheries Division Report.
Michigan Department of Environmental Quality (MDEQ). 1997. Best Management Practices – Buffer/Filter Strips [online]. [cited 29 May 2003]. Avail-able <http://www.deq.state.mi.us/documents/deq-swq-nps-bfs.pdf>.
Welsch, D. 1991. Riparian forest buffers. FS Pub. No. NA-PR-07-91. US Department of Agriculture, Forest Service. Forest Resources Management,Radnor, PA.