Chapter One Crude Oil and Natural Gas Resources and Supply · of crude oil and natural gas that can...
123
CHAPTER 1 - RESOURCES AND SUPPLY 43 Abstract Prudent development of North American crude oil and natural gas resources should begin with a reliable understanding of the resource base, particularly as that understanding has changed significantly in recent years. It had been widely assumed for decades that natural gas and oil pro- duction potential in North America was in termi- nal decline. is belief was shared by governments, the public, and even the oil and gas industry, and it was one of the main filters through which energy supply and security issues were examined. To support this view, many observers referred to the Hubbert curve* delineating resource depletion, a theory that was first demonstrated by analyzing conventional oil production in the United States. On the natural gas side, the perception of immi- nent declining supply led to expectations that North America would soon be importing lique- fied natural gas (LNG) to meet domestic demand, and thus to the construction of several new LNG regasification and import terminals in the United States and Canada. However, the widespread deployment of recent advances in drilling and completion technologies, in particular horizontal drilling and multi-stage hydraulic fracturing, have dramatically changed the outlook and prospects for North American natural gas and oil supply potential. is chapter describes the revised potential for North Ameri- can gas and oil supply, identifies the technology innovations responsible for expanding resource potential, and examines the implications for resource development. It sets out recent ranges of assessments of the natural gas and oil recov- erable resource base in the United States and Canada, and looks at how these resources may be prudently developed, leading to productive capac- ity potential, depending on choices made in three areas: (1) access and regulatory regimes; (2) sus- tained technology development; and (3) success in managing environmental impact and risk, within the context of whether the size of oil and natural gas resources is near the high or low end of cur- rent understanding. e outline of the Resource and Supply chapter is as follows: y Summary and Key Findings y North American Oil and Natural Gas Resources y Analysis of North American Oil and Natural Gas Resource and Production Outlooks y Prospects for North American Oil Development y Prospects for North American Gas Develop- ment y North American Oil and Natural Gas Resource Development Prospects to 2050. Chapter One Crude Oil and Natural Gas Resources and Supply * e Hubbert curve was first proposed by geologist M. King Hubbert in a 1956 paper for the American Petroleum Insti- tute. It hypothesizes that fossil fuel production follows a symmetrical bell-shaped curve, with peak production occurring when about 50% of the estimated ultimate recov- erable resource has been produced. is approach correctly predicted the peak of U.S. conventional oil production around 1970 but has proved less reliable in other geogra- phies and for other hydrocarbon resource types.
Transcript of Chapter One Crude Oil and Natural Gas Resources and Supply · of crude oil and natural gas that can...
Chapter 1 - resourCes and supply 43
Abstract
Prudent development of North American crude oil and natural gas resources should begin with a reliable understanding of the resource base, particularly as that understanding has changed significantly in recent years. It had been widely assumed for decades that natural gas and oil pro-duction potential in North America was in termi-nal decline. This belief was shared by governments, the public, and even the oil and gas industry, and it was one of the main filters through which energy supply and security issues were examined. To support this view, many observers referred to the Hubbert curve* delineating resource depletion, a theory that was first demonstrated by analyzing conventional oil production in the United States. On the natural gas side, the perception of immi-nent declining supply led to expectations that North America would soon be importing lique-fied natural gas (LNG) to meet domestic demand, and thus to the construction of several new LNG regasification and import terminals in the United States and Canada.
However, the widespread deployment of recent advances in drilling and completion technologies, in particular horizontal drilling and multi-stage
hydraulic fracturing, have dramatically changed the outlook and prospects for North American natural gas and oil supply potential. This chapter describes the revised potential for North Ameri-can gas and oil supply, identifies the technology innovations responsible for expanding resource potential, and examines the implications for resource development. It sets out recent ranges of assessments of the natural gas and oil recov-erable resource base in the United States and Canada, and looks at how these resources may be prudently developed, leading to productive capac-ity potential, depending on choices made in three areas: (1) access and regulatory regimes; (2) sus-tained technology development; and (3) success in managing environmental impact and risk, within the context of whether the size of oil and natural gas resources is near the high or low end of cur-rent understanding.
The outline of the Resource and Supply chapter is as follows:
y Summary and Key Findings
y North American Oil and Natural Gas Resources
y Analysis of North American Oil and Natural Gas Resource and Production Outlooks
y Prospects for North American Oil Development
y Prospects for North American Gas Develop-ment
y North American Oil and Natural Gas Resource Development Prospects to 2050.
Chapter One
Crude Oil and Natural Gas Resources and Supply
* The Hubbert curve was first proposed by geologist M. King Hubbert in a 1956 paper for the American Petroleum Insti-tute. It hypothesizes that fossil fuel production follows a symmetrical bell-shaped curve, with peak production occurring when about 50% of the estimated ultimate recov-erable resource has been produced. This approach correctly predicted the peak of U.S. conventional oil production around 1970 but has proved less reliable in other geogra-phies and for other hydrocarbon resource types.

44 prudent deVelopMent: realizing the potential of north america’s abundant natural Gas and oil resources
INTRODUCTION AND SUMMARY
Summaries and Key Findings
Supply Summary
The North American crude oil and natural gas resource and supply system is a complex network that includes several major components: (1) the natural endowments or physical store of oil and/or natural gas in the subsurface; (2) the commercial quantities of crude oil and natural gas that can be produced from the overall subsurface source rock using known or expected technologies; (3) access to oil and natural gas resources through drilling wells or surface mining; and (4) the physical network of crude oil and natural gas pipelines to transport crude oil and natural gas to refineries and natural gas processing centers and to end-use consumers. Included in this chapter is an evaluation of the principal types of crude oil and natu-ral gas supply within the United States and Canada, as well as those new areas of oil and natural gas resource types that could become available for development and production by the middle of this century. These include:
y Arctic oil and natural gas (United States, Canada, and Greenland)
y Offshore United States and Canadian oil and natu-ral gas (non-Arctic)
y Onshore natural gas (including conventional and unconventional sources)
y Onshore conventional oil (including enhanced oil recovery [EOR] operations and opportunities)
y Unconventional oil (including Canadian and U.S. oil sands, oil shale, and tight oil)
y Methane hydrates.
(This study does not include a detailed review of oil and gas resource and development potential in Mexico, although hydrocarbon prospects in that country are described in a topic paper that is avail-able on the National Petroleum Council (NPC) web-site [www.npc.org] and briefly summarized later in this chapter. Mexico is geographically part of North America and is recognized as an important crude oil supplier to the United States as well as a current importer from the United States of approximately 1 billion cubic feet per day [Bcf/d] of natural gas.)
The principal focus of this analysis is the United States and Canada. Both countries are major oil and natural gas producers with very significant future oil and gas supply potential. This chapter describes and analyzes the infrastructure systems that make these resources available to markets. It covers the cur-rent situation as well as a framework for developing infrastructure needs over the next several decades. For natural gas, the infrastructure system includes field gathering systems, gas processing facilities, gas storage fields, and long distance high-capacity trans-mission pipelines. Natural gas liquids infrastruc-ture is also discussed, given the potential for growth in liquids, such as ethane, propane, and butane, extracted from produced natural gas. This study does not report on local utility distribution pipeline systems that deliver natural gas to residential, com-mercial, and industrial customers. In the case of oil, infrastructure to transport produced crude oil from production areas to refineries is also assessed. The parallel NPC study on Future Transportation Fuels, referred to in the Preface, will assess refinery capac-ity, upgrading, and downstream infrastructure for refined products, which are not within the scope of this study.
Environmental questions related to oil and natu-ral gas production and transportation are discussed in detail in Chapter Two, Operations and Environ-ment, although their critical importance to enabling the development of supply potential in most areas is described here.
Data Sources
Multiple data and analysis sources inform this chapter. It relies first on existing, publicly available studies to compare and contrast resource estimates and production views to 2050. In addition, the Resource & Supply Task Group conducted a confiden-tial survey of proprietary outlooks, primarily from oil and gas companies and specialized energy consulting groups, to add additional breadth and depth to the source material. Details include:
y Public Data. Approximately 50 publicly available energy outlooks from government, industry, and consultant sources were examined. The U.S. and Canadian governments provided integrated energy outlooks – e.g., the Energy Information Adminis-tration (EIA), the National Energy Board of Canada (NEB), the International Energy Agency (IEA), the

Chapter 1 - resourCes and supply 45
Figure 1-1. north american natural Gas resources Can Meet decades of demand
United States Geologic Survey (USGS), and the Bureau of Ocean Energy Management, Regulation and Enforcement (BOEMRE).
y Proprietary Data. More than 80 energy and con-sultant companies received a request to complete a comprehensive resource, production, and supply chain survey. More than 25 industry and consul-tant templates were returned. The public account-ing firm Argy, Wiltse & Robinson, P.C. received, aggregated, and protected the proprietary data responses. The aggregation resulted in 12 unique outlook cases.
Resource Summary
Natural gas resource assessments have recently increased as a result of technologies that can produce gas economically from source rock (such as tight gas, shale gas, and coalbed methane) in ways previously not feasible (the so-called “shale gas revolution”). Although these sources of natural gas have been known for many years, the application of certain technologies, including drilling horizontal wells and hydraulic fracturing, has enabled resource assess-
ments to include much higher volumes of gas in the technically recoverable categories. This change, above all, has transformed the outlook for natural gas supply in North America from one of declining domestic supply and increasing imports, to one of abundant supply from within the region for decades to come, most likely at moderate cost.
A 2011 Massachusetts Institute of Technology (MIT) study on North American natural gas analyzes the range and cost of natural gas resources. The MIT study lays out a number of different cases based on various assumptions, from which this study has chosen three to illustrate the sustainability of the resource at current or greatly expanded market size. These cases are summarized in Figure 1-1, where the horizontal axis shows total ultimately recoverable natural gas resources, under the three cases, and the vertical axis shows wellhead cost of supply (not to be confused with the market price of natural gas, in which many other factors come into play). The three cases featured here are the mean resource estimate with current technology (in green), the mean resource estimate with advanced technology (in blue), and the high resource estimate with advanced technology
3
6
8
4
10
0 1,000 2,000 3,000
WEL
LHEA
D D
EVEL
OPM
ENT
COST
(200
7 D
OLL
ARS
PER
MIL
LIO
N C
UBI
C FE
ET)
Figure 1-1. North American Natural Gas Resources Can Meet Decades of Demand
ALSO used as Fig. ES-3
RANGE OF CUMULATIVE DEMAND 2010–2035
TRILLION CUBIC FEET
LOWDEMAND
HIGH DEMAND
Notes: The vertical axis represents estimated wellhead cost of supply. The cost of supply can vary over time and place, in light of di�erent regulatory conditions, di�erent technological developments and deployments, and other di�erent technical conditions. In none of these cases is “cost of supply” to be interpreted as an indicator of market prices or trends in market prices, since many factors determine prices to consumers in competitive markets. MIT = Massachusetts Institute of Technology.Source of MIT information: The Future of Natural Gas: An Interdisciplinary MIT Study, 2011.
MIT MEAN RESOURCE CASEMIT ADVANCED TECHNOLOGY CASEMIT HIGH RESOURCE TECHNOLOGY CASE

46 prudent deVelopMent: realizing the potential of north america’s abundant natural Gas and oil resources
(in red). Because these technologies were viewed as advanced when the MIT study was developed but are now considered standard by the industry, they do not take into account future technology improvements.
Figure 1-2 highlights a number of natural gas resource assessments from more than a decade and clearly shows the difference between estimates before and after unconventional gas began to be understood in the mid-2000s. Over an even longer period, it has been generally observed that oil and natural gas recov-erable resource estimates tend to increase.
The range of future technically recoverable natu-ral gas resources used here is between 1,900 and 3,600 trillion cubic feet (Tcf), representing about 25% of global natural gas resources. This does not include potentially vast resources of methane hydrates pres-ent in the Gulf of Mexico and in the North American Arctic, some of which could become economically producible in the 2035–2050 time frame if develop-ment of technologies for production and environmen-tal impact management is successful.
North America is home to world-class crude oil resources in several different basins and plays. The mean undiscovered technically recoverable oil resources potential in the U.S. lower-48 offshore is estimated at nearly 60 billion barrels, of which pro-duction has only begun in one area, the central and western zones of the Gulf of Mexico, with scope for significant further development in other offshore zones. The Arctic, another world-class resource area, contains an estimated 100 billion barrels of recov-erable oil (and an additional equivalent amount in recoverable natural gas). The Alberta oil sands have a recoverable oil potential of more than 300 billion bar-rels. These resources are relatively concentrated, but onshore conventional oil also has significant recover-able oil resources, estimated at close to 80 billion bar-rels, not including the potential for tens of billions of barrels present in low saturation and residual oil zones. Recent growth in unconventional “tight oil” production has highlighted a short to medium term resource that could be as high as 34 billion barrels. In the long term, oil shale plays, such as those in the Green River formation in Colorado, Utah, and Wyo-ming, are known to have an enormous amount of kerogen-rich oil shale deposits. Developing new com-mercially viable technology that heats the kerogen oil shale to produce recoverable oil could yield producible resources estimated at 800 billion barrels.
Production Potential
The United States and Canada are significant pro-ducers of both natural gas and crude oil, among the top world producing countries. The United States now surpasses Russia as the top natural gas producer in the world, as can be seen in Figure 1-3. Canada and the United States together now produce over 40% more gas than Russia and provide 25% of global gas supply. (Since the North American market represents about 25% of global gas demand, the region can now be considered self-sufficient in natural gas, unlike other major gas-consuming economies around the world, such as Western Europe, Japan, and China).
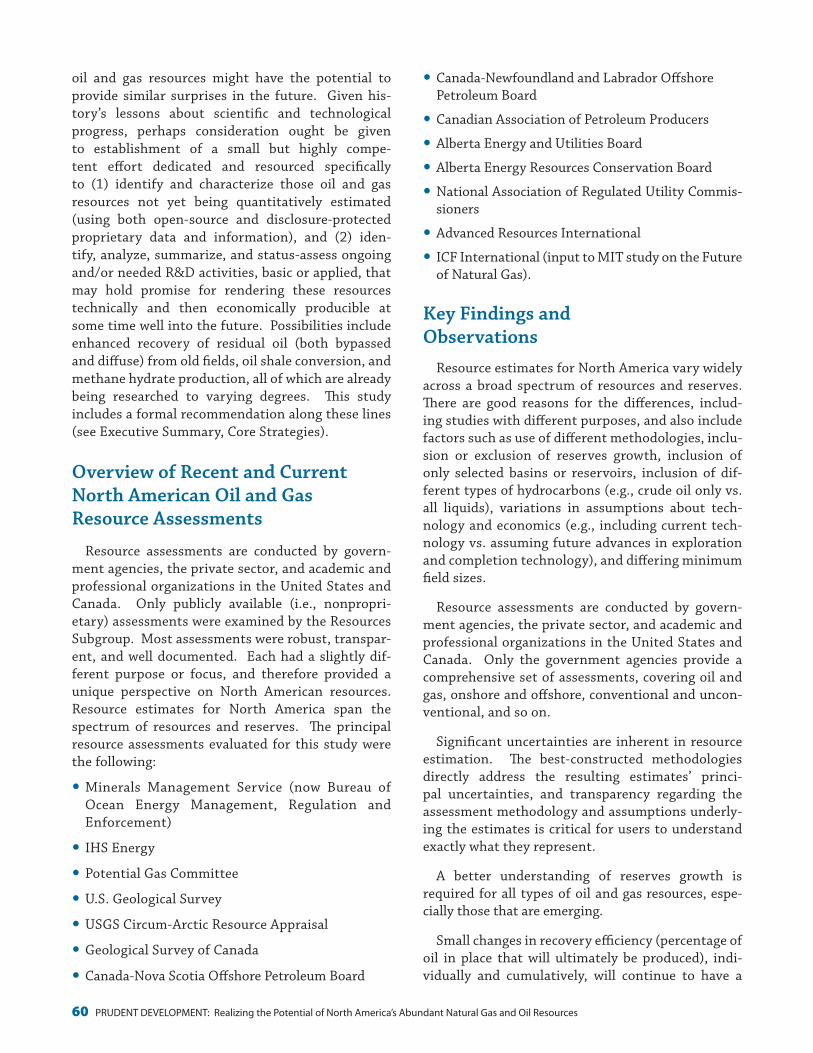
The United States and Canada also produce crude oil at a globally significant scale. As shown in Figure 1-4, the United States is the third largest pro-ducer, behind Russia and Saudi Arabia. The U.S. and Canada together now produce 10.5 million barrels per day, or about 4% more oil than Russia. Figure 1-4 shows the positions of the United States and Canada among the top producers. Mexico also features promi-nently in this list, although this study does not detail Mexican oil production prospects. “Oil” as represented in this chart includes crude oil, condensate, and natu-ral gas liquids.
Success in achieving production levels of this mag-nitude has been built over many years of developing technologies, exploring new plays and improving operating practices, and has created a strong platform for enhanced production potential during the next several decades. However, the oil and natural gas industry must adhere to sound risk mitigation and prudent environmental management practices and the marketplace must be allowed to function within a framework of appropriate access and regulation.
Making Reserve Development Choices
This study has examined the potential for resource development and production potential from all the identified major current and future sources of natu-ral gas and oil production in North America. The objective was to identify the level of production that could be achieved by 2035, in a high potential envi-ronment in which: (1) reasonable resource access will be available; (2) appropriate regulation will be applied; (3) industry will continue improvements in production and environmental operating prac-tices; and (4) there will be sustained research and

Chapter 1 - resourCes and supply 47
0
1,00
0
2,00
0
3,00
0
4,00
0
Figu
re 1
-2.
U.S
. Nat
ural
Gas
Tec
hnic
ally
Rec
over
able
Res
ourc
es A
re In
crea
sing
TRILLION CUBIC FEET
YEA
RN
ote:
Min
eral
s M
anag
emen
t Ser
vice
(MM
S) n
o lo
nger
exi
sts;
its
func
tions
are
now
adm
inis
tere
d by
the
Bure
au o
f Oce
an E
nerg
y M
anag
emen
t, Re
gula
tion
and
Enfo
rcem
ent (
BOEM
RE).
Fo
r a d
etai
led
disc
ussi
on o
f the
sur
vey
that
the
NPC
use
d to
pre
pare
thes
e “lo
w,” “
mid
,” and
“hig
h” e
stim
ates
, see
the
Pref
ace
as w
ell a
s th
is c
hapt
er.
Sour
ces:
Pot
entia
l Gas
Com
mitt
ee; E
nerg
y In
form
atio
n Ad
min
istr
atio
n; D
epar
tmen
t of E
nerg
y; M
iner
als
Man
agem
ent S
ervi
ce; I
nter
stat
e N
atur
al G
as A
ssoc
iatio
n of
Am
eric
a;
IC
F In
tern
atio
nal,
Inc.
; Mas
sach
uset
ts In
stitu
te o
f Tec
hnol
ogy;
and
Am
eric
a’s N
atur
al G
as A
llian
ce.
1999
2000
2003
2004
2005
2006
2007
2008
2009
2010
2011
POTE
NTI
AL
GA
S CO
MM
ITTE
E
ENER
GY
INFO
RMA
TIO
N A
DM
INIS
TRA
TIO
N/
DEP
ART
MEN
T O
F EN
ERG
Y/M
INER
ALS
MA
NA
GEM
ENT
SERV
ICE
NA
TIO
NA
L PE
TRO
LEU
M C
OU
NCI
L (N
PC)
ICF
INTE
RNA
TIO
NA
L, IN
C.
MA
SSA
CHU
SETT
S IN
STIT
UTE
OF
TECH
NO
LOG
Y
NPC
SU
RVEY
LO
W
NPC
SU
RVEY
MID
NPC
SU
RVEY
HIG
H
AM
ERIC
A’S
NA
TURA
L G
AS
ALL
IAN
CE
INTE
RSTA
TE N
ATU
RAL
GA
S A
SSO
CIA
TIO
N O
F A
MER
ICA ALS
O u
sed
as F
ig. E
S-2
Figu
re 1
-2.
u.s
. nat
ural
Gas
tec
hnic
ally
rec
over
able
res
ourc
es a
re In
crea
sing

48 prudent deVelopMent: realizing the potential of north america’s abundant natural Gas and oil resources
Figure 1-4. united states and Canada are among leading oil producers
MIL
LIO
N B
ARR
ELS
PER
DA
Y
0
4
8
12
Figure 1-4. United States and Canada Are among Leading Oil Producers
WAS Figure ES-4
Source: BP Statistical Review of World Energy.
RUSSIA SAUDIARABIA
USA IRAN CHINA CANADA MEXICO UNITEDARAB
EMIRATES
IRAQVENEZUELA
Figure 1-3. united states and Canada are among leading natural Gas producers
Figure ES-1. United States and Canada Are Among Leading Natural Gas Producers
0
20
40
60
USA RUSSIA CANADA IRAN NORWAYQATAR CHINA ALGERIASAUDIARABIA
INDONESIA
Source: BP Statistical Review of World Energy.
BILL
ION
CU
BIC
FEET
PER
DA
Y
Chapter 1 - resourCes and supply 49
development of new technologies and techniques to support development of additional resources that will become available over the long term (such as oil shale and methane hydrates).
This high potential is then contrasted with a lim-ited production potential over the same time frame, should resource development be subject to con-straints, including lack of access, increased regula-tory barriers, lower resource potential, or lack of technology-related research and development. Nei-ther of these extremes represents the most likely out-come, which is likely to be a point between the two. The limited and high potential cases show the impact of resource development choices made in investment and public policy.
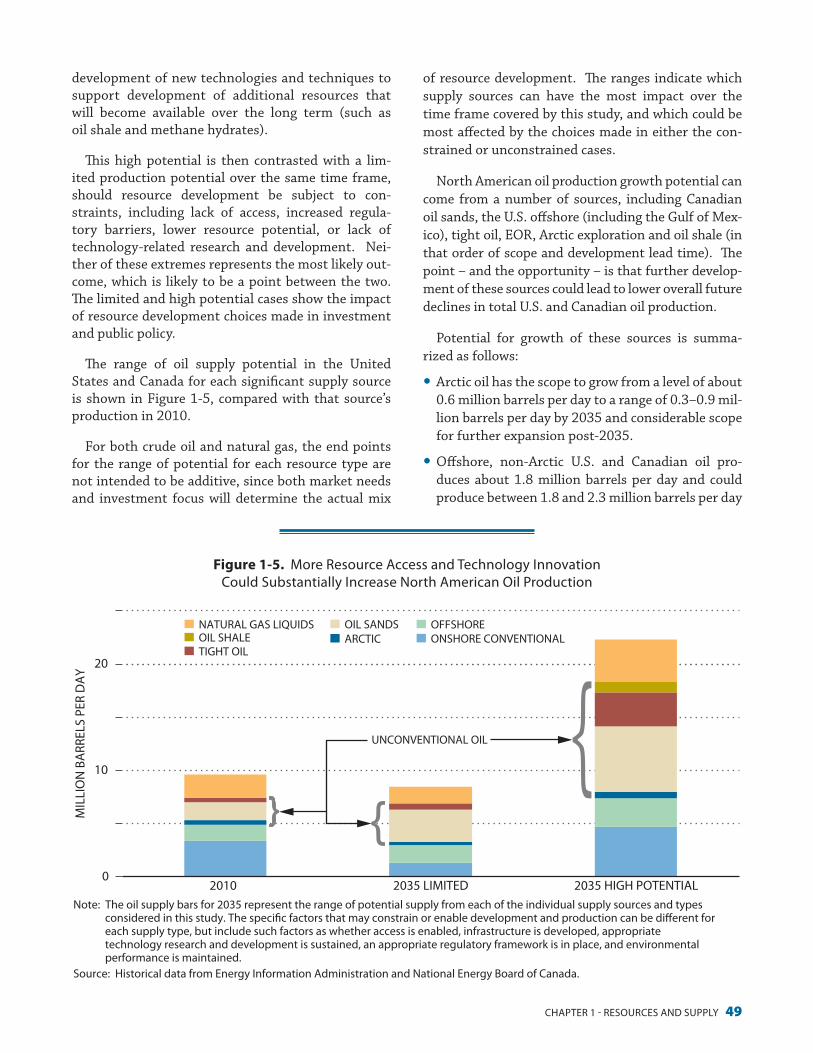
The range of oil supply potential in the United States and Canada for each significant supply source is shown in Figure 1-5, compared with that source’s production in 2010.
For both crude oil and natural gas, the end points for the range of potential for each resource type are not intended to be additive, since both market needs and investment focus will determine the actual mix
of resource development. The ranges indicate which supply sources can have the most impact over the time frame covered by this study, and which could be most affected by the choices made in either the con-strained or unconstrained cases.
North American oil production growth potential can come from a number of sources, including Canadian oil sands, the U.S. offshore (including the Gulf of Mex-ico), tight oil, EOR, Arctic exploration and oil shale (in that order of scope and development lead time). The point – and the opportunity – is that further develop-ment of these sources could lead to lower overall future declines in total U.S. and Canadian oil production.
Potential for growth of these sources is summa-rized as follows:
y Arctic oil has the scope to grow from a level of about 0.6 million barrels per day to a range of 0.3–0.9 mil-lion barrels per day by 2035 and considerable scope for further expansion post-2035.
y Offshore, non-Arctic U.S. and Canadian oil pro-duces about 1.8 million barrels per day and could produce between 1.8 and 2.3 million barrels per day
Figure 1-5. More resource access and technology Innovation Could substantially Increase north american oil production
2010 2035 LIMITED 2035 HIGH POTENTIAL
ONSHORE CONVENTIONALOFFSHORE
ARCTICNATURAL GAS LIQUIDS OIL SANDS
TIGHT OILOIL SHALE
UNCONVENTIONAL OIL
{}
0
10
20
MIL
LIO
N B
ARR
ELS
PER
DA
Y
Figure 1-5. More Resource Access and Technology Innovation Could Substantially IncreaseNorth American Oil Production
ALSO used as Figure ES-6
Note: The oil supply bars for 2035 represent the range of potential supply from each of the individual supply sources and types considered in this study. The speci�c factors that may constrain or enable development and production can be di�erent for each supply type, but include such factors as whether access is enabled, infrastructure is developed, appropriate technology research and development is sustained, an appropriate regulatory framework is in place, and environmental performance is maintained.Source: Historical data from Energy Information Administration and National Energy Board of Canada.

50 prudent deVelopMent: realizing the potential of north america’s abundant natural Gas and oil resources
by 2035, depending on choices made to expand access and lease availability to new offshore zones and on the pace of technology development.
y Onshore, non-Arctic conventional oil in the United States and Canada contributes about 3.4 million barrels per day. Access, technology and availabil-ity of CO2 for EOR are key factors that could lead to a decline to around 1.5 million barrels per day by 2035 or an expansion to over 4 million barrels per day by 2035, with these factors also playing into longer term potential.
y Unconventional oil has several categories; each is at a different stage of development.
− The largest unconventional oil production comes from the Canadian oil sands in Alberta. These produce about 1.5 million barrels per day and by 2035 could reach between 3 and 6 million barrels per day, depending on the pace of development as influenced by access, the regulatory environment, and technology and supply chain issues.
− Heavy oil in Canada is a mature resource that produces about 0.4 million barrels per day, and by 2035 this could decline to about 0.15 million barrels per day or stabilize to maintain current output levels.
− Tight oil, such as that produced in the North Dakota/Montana Bakken play, is an emerging resource type, which has ramped up to about 0.4 million barrels per day within the past three or four years. This type of production is likely to grow to between 2 and 3 million barrels per day, depending on access to new plays and continued technology development, and the pace at which new drilling can offset decline rates of existing production.
− U.S. oil shale, predominantly represented by the huge deposits identified in the Green River Formation in Colorado, is a longer-term development prospect. While there have been historical attempts at production and some research projects have been underway in recent years, there is no commercial production today. It is uncertain whether this can be developed by 2035, so its potential ranges from zero to an upside of 1 million barrels per day within this time frame. In a success case, this resource would continue to grow production over a much longer period post 2035. Development of economic
production technologies is the key requirement for this play, with access and appropriate environ-mental risk management also playing a key role.
− Oil sands resources also exist in the United States, primarily in Utah, but these are not yet developed. They represent somewhat different challenges than the Alberta oil sands and are significantly smaller, but represent another longer-term potential prospect. By 2035, the range of output is estimated at between zero and 0.15 million barrels per day, again with longer-term growth prospects if initial activities are successful.
For natural gas, the main components of supply, current and potential, are illustrated in Figure 1-6.
Recent technology advances have enabled the development of widespread and large-scale tight gas and shale gas resources across North America.
The study group estimated that between five and nine decades of production at moderate cost at today’s market size is available from the resource base, as currently understood, if production development can continue to use critical horizontal drilling and hydrau-lic fracturing technologies. Natural gas supply poten-tial can be augmented and extended with improve-ments in technologies to increase recovery factors or new technology development to tap into new resource types, such as methane hydrates.
The dominant source of U.S. and Canadian natural gas production in the near, medium, and long terms is likely to be onshore unconventional gas, such as tight gas, shale gas, and coalbed methane, as is cur-rently the case. In addition, other sources can play an important role:
y Onshore, non-Arctic gas in the United States and Canada currently produces 24 Tcf per year. By 2035, this could grow to around 36 Tcf as required by the market, if onshore gas development is facili-tated by an appropriate business environment and regulatory framework, but could decline to around 18 Tcf if development is constrained by regulatory, access, or technology restrictions.
y Arctic gas, currently stranded because of lack of pipelines to market, does not contribute to current supply apart from a small quantity for local market consumption in Alaska. Depending on whether one or more natural gas pipelines are developed from

Chapter 1 - resourCes and supply 51
the Alaska North Slope and the Mackenzie Delta, the 2035 Arctic production could range from 0 to 2.7 Tcf.
y Offshore, non-Arctic natural gas currently contrib-utes about 1.7 Tcf, almost exclusively from the U.S. Gulf of Mexico. This has declined in recent years as the resources available from the shallow water con-tinental shelf have matured. Looking out to 2035, the range of potential offshore supply is estimated at between 2.2 and 4.8 Tcf on the high side, depend-ing mainly on the success of new Gulf of Mexico play types and the pace and scope of opening of access to new offshore zones, particularly the eastern Gulf of Mexico and offshore Atlantic and Pacific zones.
Substantial methane hydrate resources have also been identified, particularly in the Gulf of Mexico and portions of the Arctic. These could be available for development in the long term, beginning in the 2030–2050 period, leading to production of 1–10 Tcf per year by 2050, and with the potential for sustained growth over the remainder of the century.
This domestic supply potential has completely trans-formed the outlook for imported LNG to North Amer-ica. LNG regasification capacity of about 18.5 Bcf/d
was developed at multiple locations in the United States and Canada over the past decade with capac-ity to supply almost one-third of current mar-ket demand, anticipating expanded need for gas imports. Although this capacity may not be used to the extent foreseen, it will play a valuable role in pro-viding flexibility of supply sources and supporting energy security. With expanded U.S. and Canadian supply potential, LNG export options are now being considered.
Infrastructure
The 2007 NPC Hard Truths study described infra-structure as a key link in the chain, connecting sup-ply to markets, and found that knowledge of existing infrastructure and planning for new infrastructure capacity could fall short of meeting market needs. Sufficient natural gas midstream infrastructure, including gathering systems, processing plants, trans-mission pipelines, storage fields, and LNG termi-nals, is crucial for efficient delivery and functioning markets. Insufficient infrastructure, can contribute to price volatility, delivery bottlenecks, stranded gas supplies, and reduced economic activity.
Figure 1-6. North American Natural Gas Production PotentialTR
ILLI
ON
CU
BIC
FEET
PER
YEA
R
TIME
TECHNICAL COMPLEXITY
0–10
20–30
30–40+
10–20
ONSHORE (CONVENTIONAL + UNCONVENTIONAL)
2010 2035–2050
LOW HIGH
HYDRATESARCTIC
OFFSHORE (GULF OF MEXICO + ATLANTIC/PACIFIC)
Note: North American oil and gas resource types have varying capabilities to in�uence future supply requirements. This chart demonstrates the growth potential and technical complexity required to develop each resource. Relative bubble sizes and vertical scale indicate supply potential for each resource type in current and future views. The bubble color provides an indication of the technical complexity required to develop each resource. While many of the resource types have growth potential under the right regulatory and market conditions, those most likely to underpin future demand are what today are considered “unconventional” oil and gas.
Figure 1-6. north american natural Gas production potential

52 prudent deVelopMent: realizing the potential of north america’s abundant natural Gas and oil resources
This study has examined infrastructure for both natural gas and crude oil in North America and con-cluded that expansion and regional change in supply sources will require new infrastructure development over the next several decades, including more than 30,000 miles of long-distance natural gas pipelines and up to 600 Bcf of natural gas storage capacity, a scale of expansion that is consistent with historical rates of system growth.
Market signals and existing regulatory structures have been effective in bringing about appropriate infrastructure expansions. In particular, regulatory frameworks implemented by the Federal Energy Regulatory Commission (FERC) in the United States and the National Energy Board in Canada have sup-ported expansion of natural gas storage and pipeline systems in recent years, and should facilitate pru-dent development of new infrastructure expansions in the future. As these agencies do not oversee oil pipeline permitting, developers must navigate mul-tiple jurisdictions to construct new crude oil pipe-lines. Permitting has usually been completed with-out undue delay, but large-scale pipelines needed to supply markets from new or growing supply sources such as in Alaska or Alberta will require a more inte-grated approach.
New infrastructure will be required to move natu-ral gas from regions where production is expected to grow to areas where demand is expected to increase. Not all areas will require new gas pipeline infra-structure, but many (even those that have a large amount of existing pipeline capacity) may require new investment to connect new supplies to markets. In recent years, natural gas producers and marketers have been the principal shippers on these new “sup-ply push” pipelines. These “anchor shippers” have been willing to commit to long-term, firm contracts for natural gas transportation service that provide the financial basis for moving forward with these projects. Looking ahead, producers should continue to be motivated to ensure outlets for their gas sup-plies via pipelines. Abundant and geographically diverse shale gas contributes to a competitive natu-ral gas market if connected to adequate storage and delivery systems.
A recent Interstate Natural Gas Association of America (INGAA) Foundation study on North American Midstream Infrastructure through 2035 found that the United States and Canada will require
annual average midstream natural gas investment of $8.2 billion per year, or $205.2 billion (in real 2010 dollars) total, over the nearly 25-year period from 2011 to 2035 to accommodate new gas supplies, par-ticularly from the prolific shale gas plays, and growing demand for gas in the power-generation sector. This capital investment requirement includes mainlines, laterals, processing, storage, compression, and gath-ering lines.
Key Findings y There is significant potential for sustained produc-tion at current or higher levels for natural gas and oil in the United States and Canada resulting from recent developments in technologies and increased understanding of the resource base. Declines in production, expected until fairly recently, would come as a result of policy choice, not as a conse-quence of resource limitations. Growth is now a real opportunity, particularly in natural gas produc-tion. Prospects for mitigating overall oil declines are improving and, if access for development and delivery improves, new sources of North American oil supply could be developed.
y The public and policymakers need to be better informed on the scale of resources available and the implications to security, competitiveness, and commercial opportunity, to help reverse the long-standing perception that North American oil and natural gas is in decline or unavailable for develop-ment.
y Natural gas and oil producing plays and new supply resource opportunities provide a rich and diverse portfolio of options to support North American oil and gas markets for decades to come. A port-folio approach to resource development requires sustaining current and near-term sources of production, while creating the conditions for lon-ger-term options to be exercised with technology advances, and when environmental practices and market conditions are right. It would be a mistake to neglect segments of the portfolio because near-term production from a current source is strong.
y Much higher assessments of recoverable natural gas resources in the United States and Canada, now totaling around 3,000 Tcf or more, have given this region the opportunity to be largely self-sufficient in natural gas for many years. A portfolio of options exists, including: sustaining current large-scale

Chapter 1 - resourCes and supply 53
gas production from the Gulf of Mexico and from onshore conventional and unconventional gas, while also opening access; crafting appropriate reg-ulatory frameworks; and developing technologies and production techniques to enable new sources of supply, including from Arctic exploration, new off-shore areas, and methane hydrates. Importantly, the newly identified large natural gas resources appear to have a moderate cost of supply, underpin-ning the competitiveness of natural gas with other energy sources.
y U.S. and Canadian oil production, despite its high levels, currently falls well short of satisfying demand in the region. The North American oil supply potential discussed here does not indicate U.S. and Canadian oil production could grow suf-ficiently to bridge this gap, unless there are also significant declines in demand for oil. Energy security considerations must, therefore, be met by openness to trade and investment with a diversity of crude oil producers around the world. However, a strong portfolio of U.S. and Canadian oil develop-ment options exists to cover current and near-term production and long-term development prospects. If these options are exploited, there are grounds for optimism that North America can continue to be a major crude oil producer to 2050 and beyond, meeting a significant proportion of its market needs. In a reasonably unconstrained case, the United States and Canada could produce up to 15–18 million barrels per day by 2035, potentially a much higher proportion of regional demand than today. However, if future development were con-strained it is likely that production would fall even further below market needs, requiring greater dependence on imports. Near and medium term production potential comes from the offshore Gulf of Mexico, U.S. and Canadian conventional onshore oil production, the Alberta oil sands and the emerging production from tight oil plays. In the medium to long term, significant development options have been identified in new offshore areas, the Arctic, and possibly U.S. oil shale and oil sands.
y Higher end supply potential ranges described in this study must meet four prerequisites:
− Sound and prudent development practices that balance responsible environmental impact risk management and mitigation with the economic and energy security benefits of hydrocarbon production.
− Access to the resource, where the industry can demonstrate that sound and prudent development practices will be deployed in all cases. This includes creating and sustaining a framework for access in itself as well as the terms and conditions of access such as length of leases and other lease stipulations.
− Predictable regulatory regimes that can evolve with advancing technology and best practices to allow long-term investment decisions within a predictable framework. Onshore, the federal government should defer to robust state regulations, recognizing that state regulators are often more familiar with regional geology and environmental conditions. Offshore, the federal government should seek input from the natural gas and oil industry in development of any new regulations, since industry expertise can inform the regulatory process and avoid unintended consequences such as delays in bringing needed supply online.
− Sustained technology development and deploy-ment, appropriate for each resource type and geographic and geologic setting, covering development and production techniques and environmental risk management. Oil and natural gas companies are able to develop appropriate technologies for accessible, prospectively commercial areas, while longer term resource opportunities may require partnership with government agencies and academic institutes to ensure sustained technology development efforts occur.
Summary of Scope and Objectives
To summarize the scope and objectives of this chapter as they have been discussed earlier, the funda-mental question here is how the oil and gas resources in the United States and Canada can be developed to meet long-term market needs, using a development model that ensures energy security and prudent envi-ronmental risk management, while bringing the ben-efits of continued and expanded development of sig-nificant resources within the region.
This chapter focuses on the hydrocarbon develop-ment potential in the United States and Canada. Demand issues and operational management and environmental questions are addressed in separate chapters of the report.

54 prudent deVelopMent: realizing the potential of north america’s abundant natural Gas and oil resources
This work examines the principal oil and gas pro-ducing areas within the United States and Canada and new areas or types of oil and gas resource that could become available for development and production by the middle of the century. These include:
y The Arctic (U.S., Canadian, and Greenland Arctic regions)
y Offshore U.S. and Canada (non-Arctic)
y Onshore natural gas
y Onshore conventional oil (including EOR opera-tions and opportunities)
y Unconventional oil (including Canadian and U.S. oil sands, oil shale, and tight oil)
y Methane hydrates.
The scope of this work includes studies of current and future infrastructure needs for both oil and nat-ural gas, as hydrocarbon development can only pro-ceed if there is a way to transport produced volumes to market. Therefore, we have examined the cur-rent pipeline system for crude oil between the major U.S. and Canadian producing regions and the major refining centers, analyzed future pipeline needs, and described the regulatory and investment framework necessary for future pipeline development. This cov-ers the major crude oil pipeline systems that deliver to refineries, but does not cover refined product pipeline systems downstream of the refining facili-ties. For natural gas, the analysis covers major inter-state transmission pipeline infrastructure, as well as gas storage and processing facilities, but does not address lower-pressure local utility natural gas pipe-line distribution systems. Natural gas liquids infra-structure needs are also included within the scope of this analysis.
Although LNG is discussed in one of this study’s topic papers, it is not a major focus of this work. However, LNG is referenced within this chapter, both as a source of imported natural gas as well as a potential future option for developing export capac-ity.
The objectives of this chapter are to:
y Describe the current best level of understanding of the technically recoverable resource base for U.S. and Canadian oil and natural gas available for devel-opment in the first half of this century.
y Describe the range of production potential until 2035 for each of the identified oil and gas resource types and regions. This range sets out to encompass a reasonably unconstrained production pathway, in which technological and development choices facil-itate development and today’s regulations are not significantly tightened, down to a reasonably con-strained production pathway in which regulatory choices, access limitations, or a slower pace of tech-nological development create barriers to develop-ment. Expected development pathways lie between these two limits.
y Describe the key current and future advances in technologies that will allow development and pro-duction of this region’s oil and gas resources, and comment on the role of innovation led by the U.S. oil and gas sector and public research initiatives in expanding global oil and gas resource potential.
y Assess current and future major infrastructure requirements to support oil and gas development and describe the key factors that could either enable or delay new infrastructure or modification of exist-ing pipeline delivery systems and natural gas stor-age facilities.
y Describe how oil and gas production potential could develop to 2050 and beyond, through technological improvement and/or access to new resource types.
y Frame the implications of the oil and gas resource development potential identified for investors and policymakers.
The contents of this chapter are supplemented and completed by a set of detailed topic papers on each of the major study areas, available on the NPC website.
Summary of Methodology
The NPC constituted a task group within the broader scope of this study to specifically focus on oil and gas resources and productive potential within North America. The Resource & Supply Task Group divided the work among nine specialized subgroups, each focusing on a specific portion of the study. The subgroups are as follows:
y Oil and gas resources and resource assessments
y Analysis of data and studies collected for the pur-pose of this study
y Arctic oil and gas (onshore and offshore)

Chapter 1 - resourCes and supply 55
y Offshore (non-Arctic) oil and gas
y Onshore gas
y Conventional onshore oil, including EOR
y Unconventional oil
y Oil infrastructure
y Natural gas infrastructure.
In addition, smaller groups or individuals were tasked with researching and writing focused white papers on particular subjects that were not included within the framework of the main subgroups. These white papers cover the following topics:
y LNG
y Methane hydrates
y Mexican oil and gas supply
y Natural gas liquids (NGLs).
In order to develop a sound assessment of the range of possible outcomes for North American oil and gas resources and production, together with the key challenges and enablers to this development, two approaches were taken in parallel – analysis of existing public studies and a confidential survey of private, pro-prietary studies.
There are numerous public, government, and indus-try organizations that have made macroeconomic and energy demand, supply, and infrastructure outlooks assessments. While some have made available to the public, many companies develop their own internal analysis as a support for their long-term investment strategies.
The Resource & Supply Task Group established a data and studies subgroup to collect and analyze as much accessible existing resource data as possible. Their objective and evaluation methodology was designed to capture the wide spectrum and range of outlooks, including the underlying assumptions and supply challenges identified by various organizations. This subgroup also designed and conducted a confidential survey of private organizations, primarily oil and gas companies and consulting groups, using an auditable procedure to capture respondents’ and industries’ views and insights. The auditable process protected the proprietary data of survey respondents and survey results were aggregated to ensure confidentiality (indi-vidual responses couldn’t be directly attributed to any particular source). The survey results added important
data and insights to the public studies record. Govern-ment organizations such as the Energy Information Administration, the U.S. Geological Survey, the Bureau of Ocean Energy Management, the National Energy Board of Canada, and the International Energy Agency also contributed data and time to this work.
The resources and resource assessment team estab-lished appropriate resource definitions to be used in the study, described the sources for resource assess-ments, and commented on the differences between resource assessments coming from different organi-zations. This team studied a range of resource assess-ments from government, academic, and private sector sources. Understanding the nature of resource assess-ments and the range of resource potential is considered a crucial component for the development of long-term national energy policy, and this subgroup set out to document and explain the best current understanding of this area.
Oil and gas development potential and driving forces can vary significantly between regions and resource types. For this reason, the NPC study estab-lished specialized subgroups for each of the major resource types (Arctic, offshore, onshore gas, conven-tional oil, and unconventional oil). Each subgroup was staffed by expert contributors, specialized in that particular resource area, from the oil and gas industry, academia, government, and consultancies. The sub-groups developed a set of complete and credible esti-mates of current production and future production potential of each area based on specific technologies, resource size estimates, hydrocarbon development practices and regulatory frameworks as applicable in each resource type and area. Thus the individual teams developed a consistent and credible view of supply potential that could in most cases go into more depth and detail than the information provided through the data and studies analysis.
Finally, two subgroups were established to discuss current and future oil and natural gas infrastructure development. The oil infrastructure subgroup ana-lyzed the crude oil pipeline system, from major North American producing basins to major refining centers. The natural gas infrastructure subgroup analyzed major interstate pipeline systems, natural gas storage capacity, and gas processing plants, and discussed nat-ural gas liquids infrastructure to the extent that this may influence natural gas development. Both infra-structure groups were tasked with describing current infrastructure networks as well as the ability of the

56 prudent deVelopMent: realizing the potential of north america’s abundant natural Gas and oil resources
system to evolve to meet future needs, either because of expansion of supply or because of regional shifts in supply patterns across North America.
Each subgroup was asked to structure its work to respond to a set of framing questions defined early in the study (see “Framing Questions” in Text Box). Sub-groups met regularly at focused meetings or workshops with wider participation to advance their research and analysis and to formulate conclusions and implications. Subgroup leaders and/or their representatives par-ticipated in Task Group meetings to share and review progress and to comment on broader aspects of the study. Each subgroup prepared a topic paper specific to its area, which explores issues in greater detail than can be included in this summary chapter. The topic papers are available on the NPC website.
The remaining sections of this chapter explore the analysis and evidence that has led to these findings, and give more detail on the specific enablers and chal-lenges relevant to each component of North American oil and gas supply and its supporting infrastructure.
NORTh AMeRICAN OIl AND NATURAl GAS ReSOURCe eNDOwMeNT
The objective of this section is to provide detailed background about resource assessments, described in the section above; define the hydrocarbon related terms prevalent in the assessments; summarize the finding of the key public assessments; and set down key findings from the material.
Hydrocarbon Resource Assessment Uses and Definitions
Use of Resource Assessments
Oil and natural gas resource assessments serve a variety of fundamental needs of consumers, policy-makers, land and resource managers, investors, regu-lators, industry planners, and others. Governments utilize resource assessments to exercise responsible
Framing Questions
The Resource & Supply Task Group (as with the work of the study as a whole) was designed to answer a set of framing questions. The ques-tions were formulated early in the study process, tested and refined with input from the study lead-ership, and then became the basis to guide the specific work processes and outputs from each of the specialized subgroups. The framing questions were also used over the course of the study as a test to determine whether newly identified issues were within the overall scope and objectives of the work.
The following framing questions were used to guide the research and analysis of the Resource & Supply Task Group.
y What is the scope of technically recoverable conventional and unconventional oil and gas resources available in the United States and Canada, according to most recent estimates?
y How much of these oil and gas resources can be translated into productive capacity by 2050 under reasonable technical and economic assumptions?
y What are the main drivers or assumptions behind existing North American oil and gas sup-ply projections?
y What factors could significantly increase or decrease the productive potential of these resources (e.g., geology, geography, access, tech-nology, non-environmental regulation, etc.)?
y What could be the particular contribution of each of the major types of oil and gas resource considered in this study and what specific devel-opment challenges may they face?
y How will sufficient infrastructure (gathering sys-tems, gas processing plants, crude oil, gas pipe-lines, and gas storage) be developed to link these resources to the market?
The framing questions have allowed this sup-ply analysis to focus on the key areas of resource scope, hydrocarbon development pathways, pro-duction potential, technology and innovation, and the diverse set of enablers and challenges that can help achieve the potential of the domestic oil and natural gas resources available or constrain their development below their potential contribution.

Chapter 1 - resourCes and supply 57
stewardship on public lands, to estimate future rev-enues to the government, and to establish energy, fiscal, and national security policies. The petroleum industry and the financial community use resource estimates to establish corporate strategies and make investment decisions. Regulatory organizations such as government energy ministries, corporation com-missions, and the Bureau of Land Management and Bureau of Ocean Energy Management of the U.S. Department of the Interior utilize resource estimates in designating acreage for leasing and drilling.
Hydrocarbon Definitions
Petroleum is a collective term for hydrocarbons in the gaseous, liquid, or solid phase; in other words – natural gas, crude oil, NGLs, and bitumen. The hydro-carbon resource endowment includes crude oil, natu-ral gas, and NGLs. Following are definitions for the different forms of petroleum:1
y Crude Oil is defined as a mixture of hydrocarbons that exists in a liquid phase in natural underground reservoirs and remains liquid at atmospheric pressure after passing through surface separation facilities.
y Natural Gas is a mixture of hydrocarbon compounds existing in the gaseous phase or in solution with oil in natural underground reservoirs at reservoir tem-perature and pressure conditions and produced as a gas under standard temperature and pressure condi-tions. Natural gas is principally methane, but may contain ethane, propane, butanes, and pentanes, as well as certain non-hydrocarbon gases, such as car-bon dioxide, hydrogen sulfide, nitrogen, and helium.
y Natural Gas Liquids are those portions of the hydrocarbon resource that exist in the gaseous phase when in natural underground reservoir con-ditions, but are liquid at surface conditions (that is, standard temperature and pressure conditions: 60º F/15º C and 1 atmosphere) or at higher pressure and/or lower temperature conditions. The NGLs are separated from the produced gas and liquefied at the surface in lease separators, field facilities, or gas processing plants.
Oil and gas accumulations are usually treated sepa-rately in the assessment process. Gas-to-oil ratios (GOR) are calculated for each accumulation to identify
1 American Petroleum Institute, “Standard Definitions for Petroleum Statistics,” 1995.
the proportions of the two major commodities (oil or gas). An oil accumulation is commonly defined as hav-ing a GOR of less than 20,000 cubic feet of gas per bar-rel of oil at standard temperature and pressure; a gas accumulation is defined as having a GOR equal to or greater than 20,000 cubic feet of gas per barrel of oil.
Reserves are those quantities of petroleum antici-pated to be commercially recoverable by application of development projects to known accumulations from a given date forward under defined conditions (such as prevailing economic conditions, operating practices, and government regulations). Reserves must sat-isfy four criteria: they must be discovered, recoverable, commercial, and remaining based on the development project(s) applied. Reserves are further subdivided as Proved, Probable, or Possible, also commonly referred to as P1, P2, or P3, respectively, in accordance with the level of certainty associated with the estimates and their development and production status.
Resources are those quantities of petroleum esti-mated, as of a given date, to be potentially (or tech-nically) recoverable from known or undiscovered accumulations, exclusive of Reserves. Such resources are classified by some as Contingent or Prospective Resources depending on whether the accumulation is known or undiscovered, respectively.
In-Place and Technically Recoverable Resources – oil and gas reserves and resources in known or yet to be discovered accumulations represent at a given time only the technically recoverable portion of the in-place oil or gas endowment. Failure to clearly char-acterize an announced resource estimate as in-place, technically recoverable, or economically recoverable is a common occurrence of which users of resource esti-mates must always be wary. Developments in tech-nology as well as geologic understanding of a reser-voir or commodity can make previously uneconomic resources economic and commercially viable. Exam-ples of such progress include the development of coal-bed gas, tight gas and shale gas reservoirs, shale oil reservoirs, deeper conventional targets, and offshore deepwater development. In addition, improvement of recovery factors can take place over time, thus grow-ing the resource estimate for a given reservoir.
Undiscovered Resources are postulated to exist outside of known accumulations on the basis of geo-logic knowledge and theory. Examination of size char-acteristics of known accumulations, together with an analysis of how many have already been discovered, is

58 prudent deVelopMent: realizing the potential of north america’s abundant natural Gas and oil resources
used to project numbers and sizes of those which may remain to be discovered. This is the general manner in which conventional, undiscovered resources are esti-mated or assessed. Often, when there are few or no data for the basin or region under study, analogs to known petroleum regions, including their character-istics and properties, are used to estimate resources.
The predicted volumes to be found in the undrilled population of potential accumulations reflect esti-mated undiscovered resources. These estimates must take into account the average prospecting success rate, number of undrilled remaining prospects, and the predicted size characteristics for the future dis-coveries. The results of such analyses carry a much greater uncertainty (wider range of volumetric out-comes) than the uncertainty associated with remain-ing reserves in existing fields because there are fewer data on which to base the estimate.
It must always be kept in mind that resource esti-mates are snapshots in time. Since the earth has a finite endowment of liquid hydrocarbons, from which we produce more and more each year, the logical con-clusion would be that the estimates for what remains to be found should be going down, but this is not the case. Usually, resource estimates conducted by an individual organization tend to increase over time owing to some combination of the availability of more and better data, new acreage that was previously inac-cessible or incorrectly considered non-prospective, or new play types (such as shale gas or subsalt oil) made feasible by technological progress.
Conventional and Unconventional Hydrocar-bon resources. In most contemporary definitions, a primary difference between “conventional” and “unconventional” liquids is viscosity, that is, a fluid’s resistance to flow. Enormous deposits of potentially productive liquid hydrocarbons exist in nature that cannot flow under either reservoir or surface condi-tions – an unconventional resource. This category includes huge deposits of low viscosity oil and bitu-men deposits (oil sands) in western Canada. The volu-metric potential of these deposits may dwarf that of conventional accumulations.
The following definitions reflect these viscosity-based differences, and other relevant differences:
y Conventional Oil: Petroleum found in liquid form flowing naturally or capable of being pumped with-out further processing or dilution.
y Unconventional Oil: Heavy oil, very heavy oil, oil shale, and oil sands are all currently considered unconventional oil resources. Most have a high viscosity and flow very slowly (if at all) and require processing or dilution to be produced through a wellbore. However, not all unconventional oil is heavy. The definition of unconventional oil can also include such resources as tight oil, which has low viscosity, but which is not produced using conven-tional techniques. Some unconventional oils may also require special transportation and refining technology.
y Heavy Oil: Heavy crude oils are understood to include only those liquid or semiliquid hydrocar-bons with a gravity of 20o API or less. These include fuel oils remaining after the lighter oils have been distilled off during the refining process.
y Very Heavy Oil: Very heavy oil is defined as having a gravity of less than 10o to 12o API.
y Oil Shale: A fine-grained sedimentary rock contain-ing kerogen, a solid organic material. The kerogen in oil shale can be converted to oil through the chemi-cal process of pyrolysis. (“Oil shale” is unrelated to liquid petroleum produced from wells drilled into more thermally mature shales, that is sometimes called “shale oil.”)
y Oil Sands: Also referred to as bituminous sands, oil sands are a combination of sand, water, and bitu-men. Bitumen is a semisolid, degraded form of oil that will not flow unless heated or diluted with lighter hydrocarbons.
y Continuous Type Resources (e.g., shale gas, tight gas, coalbed methane): Some organizations, such as the USGS, use the term continuous accu-mulation to define those unconventional oil and gas resources that are economically produced but are not found in conventional reservoirs such as coalbed gas, tight gas sands, shale gas, and many of the tight oil plays. Continuous accumulations are petroleum accumulations (oil or gas) that have large spatial dimensions and indistinctly defined boundaries, and which exist more or less indepen-dently of the subsurface water column. Another key difference between conventional and uncon-ventional accumulations is that some of these (shales and coals) are both source rock and reser-voir rock.
Chapter 1 - resourCes and supply 59
North American Hydrocarbon Resource Classification Systems
Several different classification systems have been developed to systematically describe and label mea-sured and estimated hydrocarbon resource volumes according to two or three of the principal uncertain-ties (primarily geologic and economic uncertainty, and sometimes commercial status). Though these systems have many similarities as well as overlaps, each was developed with its own intended estimation focus. Each also has its own terms that do not always have exact equivalents in the other system’s lexicons.
The principal systems in use are the following, and each is described in detail in Topic Paper #1-1, “Oil and Gas Geologic Endowment,” which is available on the NPC website.
y The Potential Gas Committee classification system, introduced in 1964
y The McKelvey system, dating from 1972
y The United Nations system, adopted by the United Nations in 2004
y The Petroleum Resources Management System, developed by several collaborating organizations and approved by the Society of Petroleum Engi-neers in 2007.
Uncertainty
Significant uncertainties are an inherent part of resource estimation. The best-constructed methodol-ogies have two key elements: (1) they directly address the resulting estimates’ principal uncertainties; and (2) they are transparent regarding the assessment methodology. These factors are critical for users to understand exactly what the assessments represent.
What constitutes a resource has changed over time. Twenty years ago, coalbed methane was not a viable part of the U.S. energy mix. It now accounts for about 8% of domestic natural gas production. Technological developments and developments in geologic and engi-neering understandings continually move the edge of what makes a resource a reserve.
The history of the petroleum industry is replete with instances of overly pessimistic predictions and “good” resource-related surprises. Salient U.S. exam-ples include:
y “Experts” predicted at the beginning of the last cen-tury that the modern domestic oil era, initiated in
Pennsylvania during the mid-1800s, would soon end owing to lack of sufficient resources. Instead, major finds in other places soon proved them wrong, such as the 1901 discovery of Spindletop Field in the Texas Gulf Coast region, and the 1890–1920s discoveries of several large fields in California’s Los Angeles and San Joaquin basins.
y Many believed in the early 1940s that oil and gas either did not exist in, or could not be produced from, the open ocean – until 1947 that is, when Kerr-McGee used a platform-plus-barge combina-tion to drill the first successful well out of sight of land in the Gulf of Mexico.
y Similarly pessimistic views that production from the large California oil fields would dwindle to a trickle due to resource exhaustion have been repeat-edly negated by technological advancements. Such advances include the introduction of waterflood-ing prior to the 1960s and, more importantly, the application of thermal recovery methods to heavy oil reservoirs since the 1960s.
y Few “experts” held out hope that oil and gas could exist in deep water (over 5,000 feet) at great sub-seabed depths (on the order of 30,000 feet total vertical depth) until Shell’s 1986 Mensa prospect discovery proved they did.
y The late 1980s advent of large-scale coalbed meth-ane production was virtually unheralded, and there-fore unanticipated.
y The late 1990s advent of large-scale natural gas and NGLs production from massively hydrauli-cally fractured organic-rich shales, initiated in the Barnett Shale of Texas’ Fort Worth Basin, was also unanticipated.
y Although small-scale hydraulic fracturing of oil-bearing “shale” formations such as California’s Monterrey Formation began in the 1980s, the adaptation of combined horizontal drilling and massive hydraulic fracturing as originally developed for gas in the Barnett Shale, to productive develop-ment of the oil-bearing Bakken Formation of Mon-tana, North Dakota, Saskatchewan, and Manitoba, was also unheralded and unanticipated until its rapid adoption and expansion began in 2001.
This long and continuing history of unanticipated “good” resource-related surprises begs the ques-tion as to what currently ignored and discounted
60 prudent deVelopMent: realizing the potential of north america’s abundant natural Gas and oil resources
oil and gas resources might have the potential to provide similar surprises in the future. Given his-tory’s lessons about scientific and technological progress, perhaps consideration ought be given to establishment of a small but highly compe-tent effort dedicated and resourced specifically to (1) identify and characterize those oil and gas resources not yet being quantitatively estimated (using both open-source and disclosure-protected proprietary data and information), and (2) iden-tify, analyze, summarize, and status-assess ongoing and/or needed R&D activities, basic or applied, that may hold promise for rendering these resources technically and then economically producible at some time well into the future. Possibilities include enhanced recovery of residual oil (both bypassed and diffuse) from old fields, oil shale conversion, and methane hydrate production, all of which are already being researched to varying degrees. This study includes a formal recommendation along these lines (see Executive Summary, Core Strategies).
Overview of Recent and Current North American Oil and Gas Resource Assessments
Resource assessments are conducted by govern-ment agencies, the private sector, and academic and professional organizations in the United States and Canada. Only publicly available (i.e., nonpropri-etary) assessments were examined by the Resources Subgroup. Most assessments were robust, transpar-ent, and well documented. Each had a slightly dif-ferent purpose or focus, and therefore provided a unique perspective on North American resources. Resource estimates for North America span the spectrum of resources and reserves. The principal resource assessments evaluated for this study were the following:
y Minerals Management Service (now Bureau of Ocean Energy Management, Regulation and Enforcement)
y IHS Energy
y Potential Gas Committee
y U.S. Geological Survey
y USGS Circum-Arctic Resource Appraisal
y Geological Survey of Canada
y Canada-Nova Scotia Offshore Petroleum Board
y Canada-Newfoundland and Labrador Offshore Petroleum Board
y Canadian Association of Petroleum Producers
y Alberta Energy and Utilities Board
y Alberta Energy Resources Conservation Board
y National Association of Regulated Utility Commis-sioners
y Advanced Resources International
y ICF International (input to MIT study on the Future of Natural Gas).
Key Findings and Observations
Resource estimates for North America vary widely across a broad spectrum of resources and reserves. There are good reasons for the differences, includ-ing studies with different purposes, and also include factors such as use of different methodologies, inclu-sion or exclusion of reserves growth, inclusion of only selected basins or reservoirs, inclusion of dif-ferent types of hydrocarbons (e.g., crude oil only vs. all liquids), variations in assumptions about tech-nology and economics (e.g., including current tech-nology vs. assuming future advances in exploration and completion technology), and differing minimum field sizes.
Resource assessments are conducted by govern-ment agencies, the private sector, and academic and professional organizations in the United States and Canada. Only the government agencies provide a comprehensive set of assessments, covering oil and gas, onshore and offshore, conventional and uncon-ventional, and so on.
Significant uncertainties are inherent in resource estimation. The best-constructed methodologies directly address the resulting estimates’ princi-pal uncertainties, and transparency regarding the assessment methodology and assumptions underly-ing the estimates is critical for users to understand exactly what they represent.
A better understanding of reserves growth is required for all types of oil and gas resources, espe-cially those that are emerging.
Small changes in recovery efficiency (percentage of oil in place that will ultimately be produced), indi-vidually and cumulatively, will continue to have a

Chapter 1 - resourCes and supply 61
significant impact on the size of technically and eco-nomically recoverable resources. Present and future R&D could also result in additional production from older fields. In addition, support of field trials of new and advanced technologies is critical to advanc-ing new methods needed to grow North American oil and gas supply.
Mature onshore areas in the United States and Canada have some, but limited, conventional opportunities. CO2 EOR, assuming anthropo-genic sources are available, has the potential for substantial additional oil production. Offshore North America conventional resources still have significant potential, especially the Gulf of Mexico. There is potential, as well, in the offshore Atlantic and Pacific. The Arctic holds very large potential, undiscovered resources.
The role of unconventional resources in the North American energy endowment will continue to have a growing and profound impact on the future energy supply outlook. Onshore unconventional resources, in particular, will be very important. Shale gas, Canadian oil sands, tight gas, tight oil, gas hydrates, and possibly oil shale are expected to provide further scope for additions to reserves.
There are many unknowns regarding unconven-tional, offshore, and Arctic sources. Additional data and information are required to make informed pol-icy and commercial decisions about these potential resources.
ANAlYSIS OF ReSOURCe AND PRODUCTION OUTlOOkS AND STUDIeS
Overview
As was clear in the previous sections, an important element of the work done for this study was to col-lect and analyze data and outlooks published by gov-ernmental agencies, independent forecasting groups, industry associations, or others, as well as data sup-plied on a confidential basis by individual companies. This section presents a detailed view of the ranges of outlooks for future North American oil and gas sup-ply that were analyzed in this process and the insights gained.
The objective of the Data and Study Analysis Team was to understand and interpret the:
y Uncertainty surrounding the size of North Ameri-ca’s conventional and unconventional oil and natu-ral gas resource base, as reflected in published anal-yses and proprietary data and forecasts
y Challenges and enablers to convert this resource endowment into production and supply volumes that can help meet the future energy needs of North America.
The Data and Study Analysis Team comprised diverse skill sets, experiences, and expertise from participants from large integrated energy compa-nies (e.g., Chevron, ExxonMobil, Shell); major inde-pendent oil and gas producers with representatives of the American Natural Gas Alliance (e.g., Encana, Questar); large industry service companies (e.g., Hal-liburton); consultant companies (e.g., ICF Interna-tional, Nehring Associates, Wood Mackenzie); and U.S. and Canadian government agencies.
In conducting a “study of studies,” the Team evalu-ated a broad, diverse range of energy outlooks. The study scope was limited to North America with focus on the 2010–2050 time frame. Data were collected from public, government, industry, and consultant sources. Approximately 50 publicly available energy outlooks were examined. The U.S. and Canadian gov-ernments provided integrated energy outlooks – e.g., the Energy Information Administration, the National Energy Board of Canada, the International Energy Agency, the United States Geologic Survey, and the Bureau of Ocean Energy Management, Regulation and Enforcement.
More than 80 energy and consultant compa-nies received a request to complete a comprehen-sive resource, production, and supply chain survey/template. More than 25 industry and consultant templates were returned, and then aggregated to maintain the confidentiality of the individual com-pany’s proprietary data. The aggregation resulted in 12 unique outlook cases compiled for this study.
The current North America oil resource and sup-ply situation is relatively straightforward. Canada and Mexico are currently exporting oil into the U.S. markets and the only question is whether their resource base/supply capacity can continue to be meet internal demand while also enabling exports. U.S. production, plus Canadian exports to the United

62 prudent deVelopMent: realizing the potential of north america’s abundant natural Gas and oil resources
States, have not been sufficient to meet the more than 20 million barrels a day that are consumed today. Therefore, the analysis focused on whether the resource base and future production capacity could reach internal demand levels, and/or how large the domestic/import supply gap could grow to in the future. The results suggest that North American production capacity will likely not grow fast or large enough to meet the growing needs for oil in the region.
The North American gas resource and supply situa-tion has changed in recent years. The industry’s rela-tively recent application of horizontal drilling com-bined with hydraulic fracturing has led to a greater understanding of the potential magnitude of the U.S. and Canadian recoverable resource base, now believed to have grown considerably (perhaps two and a half times or more over estimates from as recently as 2003). In the last decade, there was a perception that domestic supplies could not meet internal demand requirements and significant volumes of LNG imports would be required to satisfy demand. Thus, our goal was to assess if there are sufficient, affordable domes-tic gas resources that can be utilized to meet all poten-tial demand scenarios. The spread in demand out-looks for the gas (20 to 40+ Tcf/yr) reflect:
y Low side cases – low economic growth and/or cur-tailing energy use to minimize carbon emission and other environmental impacts
y “Mid” cases that reflect a historical percentage share in the overall fuel mix and moderate economic growth consistent with historical rates
y High side cases that contemplate increased pen-etration in the power and even transportation sec-tors. This also would likely improve the resultant environmental impact for these demand growth scenarios and/or reduce the liquid import gap that has both economic and energy security advantages for the United States.
The supply outlooks studied here seem to fall into three general types of future scenarios: (1) There are constrained supply cases corresponding to a more stringently regulated industry environment, and/or curtailment of access/development of new opportuni-ties; (2) The vast majority of the outlooks (spectrum of “mid” cases) reflect iterations of industry, public, and government “business as usual” cases, where economic growth and product prices will be the primary determi-nants of market needs and investment in new supply;
(3) The high production cases will require considerable alignment among industry, government, and public stakeholders towards a common, shared, long term vision for the future direction of the energy sector.
The oil cases require significant long-term commit-ments to diversifying the portfolio of North Ameri-can supply areas; early and increased data collection to understand the new play areas (some currently in moratoria areas); research and technology to assess the commercial viability and development of large Rockies unconventional oil resources; and a new long-distance pipeline network (targeting U.S. Gulf Coast refiners or for crude oil export to Asia Pacific via a Western Canadian facility/port) to support the growth potential of Canadian oil sand production.
The low and mid gas supply cases are likely to be driven by similar conditions to the oil outlooks described above; however, the high gas production scenarios are associated with natural gas serving an increasing gas share of the overall energy mix in the United States and Canada including in the power and transportation sectors. We have assessed the indus-try requirements and fundamentals to achieve this possible paradigm shift for gas, and while we believe it is feasible from a resource base and industry capabil-ity standpoint, considerable alignment and coopera-tion between industry, government, and public stake-holders will be required to ramp up production rapidly and sustain 30 to 40 or more Tcf/yr production levels for future decades.
A Range of Assessments
Given the wide range of assessments from diverse groups, made over a number of years and covering var-ious geographic areas, developing a view of potential resources and development potential is a critical and complex process. Confidence is gained by compar-ing resource estimates to better understand the data available and the input assumptions. Those that assessed onshore oil may use different assumptions from those assessing offshore gas; those that made an assessment five years ago may have different data than an assessment done a year ago. Furthermore, some assessments may include conventional and unconventional hydrocarbons while others may not. The estimates and assumptions can be further veri-fied by comparison with industry activity and perfor-mance. A promising resource that attracts little inter-est or activity may be either optimistically assessed or

Chapter 1 - resourCes and supply 63
activity is restricted because of policy or operational constraints. Greater confidence in resource estimates leads to greater confidence in future energy supply’s potential from the different sources studied.
Estimating a future resource is challenged by the fact that most of the resource is hidden deep in the subsurface, often in deep water or even beneath Arc-tic ice. Some areas have moratoria on drilling or the collection of seismic data such that even rudimentary estimates are difficult to achieve. That said, much of the world’s thick sequences of sediments do contain oil and gas, and therefore, by analogue with producing areas, we can project at least the existence of oil and gas, if not their quantities even in unexplored areas. Where known commercial accumulations occur we can identify additional, on-trend, undrilled features that are likely to be productive, but even here the full extent of the hydrocarbon province and accumula-tion sizes are far from precisely known. In existing fields where the volumes of in-place oil or gas is bet-ter understood, there are complicating factors such as variations in permeability, communication with the borehole and reservoir energy issues that make the amount that is recoverable uncertain. Industry activ-ity and performance is another leading indicator of the underlying assumptions and fundamentals associ-ated with the existing resource estimates. In addition to these “below ground” uncertainties there are many “above ground” factors such as demand, cost, infra-structure, policy, environmental factors and the rate of technology development that may limit or enable the beneficial extraction of the resource.
For these reasons, resource outlooks and forecasts vary on the nature and amount of available resources. The tables and charts included in this section capture this uncertainty by stating ranges as observed in the data collection from academic, industry, and govern-mental sources. The ranges attempt to capture 80% of the values presented; therefore, there are outliers that extend beyond what is shown here. These ranges represent irreducible uncertainty due to the inherent variability of the assumptions rather than variations in fundamental data.
These resource estimates are further qualified by observations of what the industry can do and is doing now. These “resource–industry activity” comparisons have three categories:
1. Robust resource estimate and demonstrated commerciality (for example: shale gas, Gulf of
Mexico oil, oil sands and possibly tight oil). Interrupting development of these resources means going to less robust, more technically challenging and more expensive resource types.
2. Less robust resource estimate with limited or no industry access (e.g., Arctic, Pacific, Atlantic, and Eastern Gulf of Mexico). These areas need sufficient study and data collection to understand their potential. Seismic surveys and drilling will enable more accurate resource estimates, which may be much smaller or greater than currently known. Industry first needs to fully demonstrate its readiness and capability to explore and develop that resource in ways that protect workers, safeguard the environment, and provide a positive return on capital. Only when industry has won the confidence of government and public is this possible and, even then, may depend on other considerations of political process.
3. Least robust resource estimate, wherein industry has access but little activity (e.g., kerogen oil shale to oil, EOR using anthropogenic CO2, deep offshore gas). These are more uncertain. They may be the next big resource opportunity or they may always be just one step away from being a commercial reality. Government and industry need to develop policies and technologies that increase the probabilities of these potential resources contributing to future production.
From this analysis, it is likely that some resources will dominate early because of their abundance, access, availability, and relative cost, while others will play a supporting role and be available for later development. Usually lower cost natural gas and oil resources are developed before moving to higher cost resources as lower cost sources are depleted, within the constraints of access and the availability of appro-priate and cost-effective technology.
Natural Gas
With abundant supplies in the United States and Canada, North America is amply supplied with natural gas to meet domestic demand over the next several decades even at growing production levels. This is largely driven by recent advances in horizon-tal drilling and hydraulic fracturing that have allowed gas to be extracted from shale and low permeability formations. As a result of these advances, estimated future resources are large and growing. Currently

64 prudent deVelopMent: realizing the potential of north america’s abundant natural Gas and oil resources
the range is 1,500 to 4,000 Tcf for the United States and 500 to 1,250 Tcf for Canada. These numbers have grown rapidly in recent years (from 100s of Tcf) and may grow further as more of these new plays are tested. This potential is being realized as seen in recent production increases.
There may be opportunities to augment these sup-plies with Arctic natural gas if infrastructure is devel-oped. Another possible upside to gas supply may come from offshore exploration in the little explored moratorium areas and in the long term, methane hydrates. Overall natural gas supply is driven by unconventional shale gas and tight gas (without these, natural gas production would still be in decline). But other important resources will be important contributors in the longer term.
Crude Oil
Oil production has been in long-term decline, but Canadian oil sands, deepwater Gulf of Mexico oil, and, with less certainty, tight oil could help slow or even arrest the decline as seen over the last year or two. Onshore U.S. conventional discoveries peaked in 1938 and the industry has adapted by moving to the Arctic, offshore, oil sands and now tight oil. Oil sands have the largest upside, as only 70 of the 170 billion barrels of oil potential are currently under development.
Additional oil resources may come from enhanced oil recovery. For example, the 35 to 80 billion barrels of oil onshore U.S. is largely due to new advances in EOR. A larger and longer-term upside resource may come from heating kerogen shale deposits (some-times called oil shale). This requires heating the rock to accelerate maturation of organic material and con-verting it to oil and gas.
Crude Oil
Resource Estimates
The United States’ oil resource base has increased over time due to technology enhancements and a greater understanding of new “frontiers.” The U.S. oil in place endowment (the broadest possible definition of the resource) for conventional reservoirs is about 11% of the world’s total, while the country’s uncon-ventional reservoirs are 23%. Adding in Canada’s unconventional bitumen endowment, thought to be in excess of two trillion barrels, would increase this percentage.
While U.S. crude oil production peaked in the early 1970s at around 9.6 million barrels per day, except for the start-up of Prudhoe Bay and periods of high oil prices, it has been on a downward slope (44% from the peak) since 1985 (Figure 1-7). In total, the United States imports about half its petroleum liquids con-sumption of nearly 20 million barrels per day – equiv-alent to about a quarter of the world’s liquid demand.
Current and recent data and studies indicate that the remaining North American resource base is likely to be in excess of 500 billion barrels.
In the U.S. resource base table (Table 1-1), we have included three industry cases that represent the range of remaining resource estimates received from indus-try, plus the most recent EIA-released data, as of the time of this study. The industry’s assessment of the United States’ remaining resource base ranged from 106 to 270 barrels, which is almost entirely contained in conventional reservoirs at this point. The United States’ remaining technically recoverable conven-tional resources are only 6% of the world’s total. The United States has produced about 200 billion barrels of its original oil in place. To date, that is about 17% of all oil produced in the world. There are still remain-ing North American resources that can provide signif-icant recoverable totals if technical and environmen-tal issues can be addressed (Table 1-2).
The largest remaining North American oil resource potential is the unconventional Canadian oil sands (150–300+ billion barrels of recoverable resources) and U.S. Rockies shale kerogen plays (over 1 trillion barrels in place). The U.S. unconventional Rockies oil plays, while having significant in place volumes, need considerable research, experimentation, technology advancements, and the resolution of above ground environmental challenges before technically recover-able resources can be realized. Moreover, these issues all need to be addressed to assess the commercial via-bility before proceeding with large-scale production projects that could materially impact the oil supply situation. This is not expected until after 2030.
In 2010, Canadian oil sands were already contribut-ing around 1.5 million barrels per day and could grow to over 5 million barrels per day out beyond 2030, which could represent approximately 40–50% of all U.S. and Canadian crude oil production. Infrastruc-ture expansion to transport this heavy crude to suit-able upgrading facilities and refineries will be neces-sary to achieve these large growth aspirations.
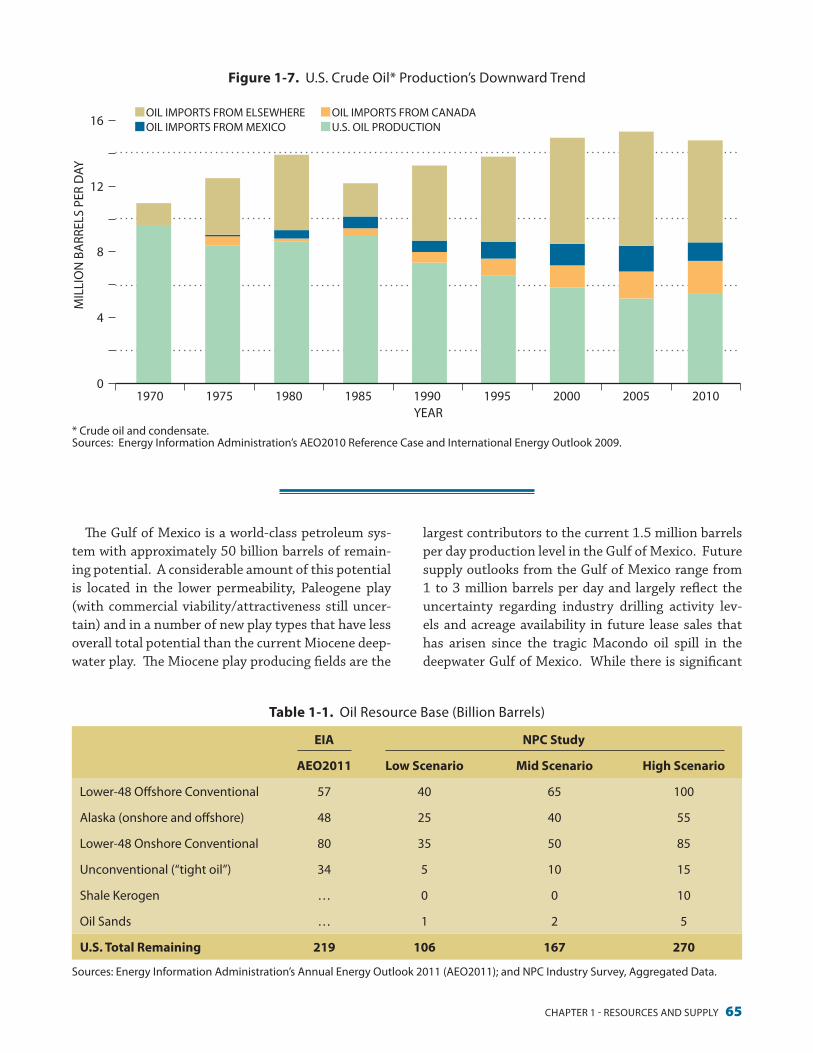
Chapter 1 - resourCes and supply 65
The Gulf of Mexico is a world-class petroleum sys-tem with approximately 50 billion barrels of remain-ing potential. A considerable amount of this potential is located in the lower permeability, Paleogene play (with commercial viability/attractiveness still uncer-tain) and in a number of new play types that have less overall total potential than the current Miocene deep-water play. The Miocene play producing fields are the
largest contributors to the current 1.5 million barrels per day production level in the Gulf of Mexico. Future supply outlooks from the Gulf of Mexico range from 1 to 3 million barrels per day and largely reflect the uncertainty regarding industry drilling activity lev-els and acreage availability in future lease sales that has arisen since the tragic Macondo oil spill in the deepwater Gulf of Mexico. While there is significant
Figure 1-7. U.S. Crude Oil* Production’s Downward Trend
0
4
8
12
16
1970 1975 1980 1985 1990 1995 2000 2005 2010
MIL
LIO
N B
ARR
ELS
PER
DAY
YEAR* Crude oil and condensate.Sources: Energy Information Administration’s AEO2010 Reference Case and International Energy Outlook 2009.
OIL IMPORTS FROM ELSEWHERE OIL IMPORTS FROM MEXICO
OIL IMPORTS FROM CANADA U.S. OIL PRODUCTION
Figure 1-7. u.s. Crude oil* production’s downward trend
Table 1-1. oil resource Base (Billion Barrels)
EIA NPC Study
AEO2011 Low Scenario Mid Scenario High Scenario
lower-48 offshore Conventional 57 40 65 100
alaska (onshore and offshore) 48 25 40 55
lower-48 onshore Conventional 80 35 50 85
unconventional (“tight oil”) 34 5 10 15
shale Kerogen … 0 0 10
oil sands … 1 2 5
U.S. Total Remaining 219 106 167 270
sources: energy Information administration’s annual energy outlook 2011 (aeo2011); and npC Industry survey, aggregated data.

66 prudent deVelopMent: realizing the potential of north america’s abundant natural Gas and oil resources
near- to mid-term potential in other lower-48 off-shore areas (e.g., world class petroleum system – off-shore California) and the U.S. and Canadian Arctic (80–100 billion barrels overall), new regulatory and permitting requirements plus acreage access will drive activity levels in these areas.
Finally, the liquid-rich areas in the shale plays and the Bakken/Three Forks and Monterey tight oil res-ervoirs have been actively pursued by industry over the last five years. Production has grown to around 400 thousand barrels a day from these plays. The current resource assessment of the tight oil plays is 6–34 billion barrels. Production levels could grow significantly, to 2–3 million barrels per day in the future. Additionally, it is still unclear how much crude oil and condensate versus natural gas liquids will ultimately be recovered from the shale gas plays. The individual crude oil and condensate production rates for new wells are relatively low after the steep initial decline in the first year of production; however, they are profitable and contributing to growth in the lower-48 onshore sector. As the U.S. onshore conven-tional oil field production levels continue to decline, the increased “tight oil” activity may partially offset this decline in the next 10 to 20 years.
The only other area that could contribute material volumes to offset natural field declines in the mature U.S. lower-48 onshore, which is producing around
3 million barrels a day, is from enhanced oil recovery resulting from injecting carbon dioxide (CO2) into the reservoir. The industry has been successful in recov-ering additional oil from older fields by applying this technology and utilizing natural sources of CO2. There is considerable debate as to how much additional oil can be recovered from the fields that haven’t been flooded with CO2 as some of these are not suitable, while others are currently not “connected” to a natural source of CO2, requiring infrastructure development in these fields. While anthropogenic (man-made CO2) capture, transportation, injection and storage for enhanced oil recovery is another potential source of CO2, there is significant uncertainty regarding the cost of supply, regulatory requirements, and con-struction of new onshore CO2 pipelines necessary for commercial project viability.
More detail on the regional and play-type oil resource profiles can be found in oil-related topic papers, including Topic Paper #1-2, “Data and Studies Evaluation,” available on the NPC website.
Production Outlooks
In addition to published outlooks, the Data and Study Analysis Team obtained a wide range of indus-try and consultant views on oil resources and pro-duction supply capacity to develop its outlook on
Table 1-2. high potential north american oil resources
Resource Type Resource Potential Resource Development Enablers
Canadian oil sands recoverable resource potential = 150–310 billion barrels; future production levels possibly in excess of 5+ million barrels per day
long-distance pipeline and infrastructure project to u.s. Gulf Coast or Canadian West Coast?
u.s. Gulf of Mexico oil recoverable resource potential = 40–60 billion barrels; future near- and mid-term production levels of 1.5–3.0 million barrels per day?
resumption of pre-Macondo deepwater drilling activity levels; paleogene reservoir performance and commerciality
u.s. and Canadian tight “shale” liquid plays
recoverable resource potential = 10–20 billion barrels; future north american production levels possibly in excess of 1+ million barrels per day
hydraulic Fracturing; resource intensive – people, equipment, materials; how much is crude oil/condensate (refined transportation products) vs. natural gas liquids
new u.s. lower-48 offshore & u.s. and Canadian arctic areas
recoverable resource potential = 80–100 billion barrels; mid-term (e.g., u.s. West Coast) and longer-term (e.g., arctic) production levels in excess of several million barrels per day
opening of moratoria areas and data collection; timely exploration/development program approvals

Chapter 1 - resourCes and supply 67
production. In this section, we examine both govern-ment and industry outlooks and assumptions to pro-vide perspective on the future.
The total U.S. production volumes in the EIA refer-ence case and the industry mid case were relatively similar by 2035, as seen in Figure 1-8. The industry/consultant mid case oil total production forecasts were lower by 1 million barrels per day than the EIA’s Annual Energy Outlook (AEO) 2011 forecast in 2035. Consequently, the industry’s oil production com-pound average growth rate (CAGR) from 2009 until 2035 was 0.1% versus 0.3% in the AEO2011 Refer-ence Case. Generally, the industry’s median case showed lower growth for the onshore sector than the EIA’s reference case.
The industry was more bullish for the offshore; however, there is uncertainty regarding assumptions for future activity levels in the offshore (lower-48 and Arctic) following the Macondo oil spill in the deepwa-ter Gulf of Mexico in April 2010. The 2011 EIA ref-erence case and industry views were relatively simi-lar for growing production in the Arctic. This likely represents general alignment on the relatively high
supply costs anticipated for future exploration and development projects in the Arctic and the perceived challenges associated with offshore drilling.
The industry’s high case U.S. production levels were significantly greater than the EIA’s AEO2011 refer-ence case, with a 2.3% CAGR. In this case, industry cited big production gains in Alaska and offshore, no doubt based on the assumption of increased acreage access in areas that are currently under moratoria. Consultant studies on the behalf of various U.S. government agencies suggested there are between 30 and 50 billion barrels that are inac-cessible to industry. Finally, we also compared the range of industry cases with the IEA World Energy Outlook Current Policies case. The IEA production output levels generally coincided with the low indus-try case.
NGL production may be an increasingly important source of liquids produced in the United States and Canada, particularly as shale gas focused companies shift activity towards some of the more liquids-rich gas plays. The Data Study Analysis Team obtained some industry/consultant U.S. NGL outlooks. The
Figure 1-8. U.S. Oil Production by Type: Industry High/Med/Low Survey Responses versus AEO2011 Reference Case
0
4
8
2009 2025AEO2011
LOW2025 INDUSTRY 2035 INDUSTRY
MED HIGH 2035
AEO2011LOW MED HIGH
MIL
LIO
N B
ARR
ELS
PER
DAY
KEROGEN CONVENTIONAL OFFSHORE
CONVENTIONAL ONSHORE ARCTIC
Sources: Energy Information Administration’s AEO2010 Reference Case and International Energy Outlook 2009.
Figure 1-8. u.s. oil production by type: Industry high/Med/low survey responses versus aeo2011 reference Case

68 prudent deVelopMent: realizing the potential of north america’s abundant natural Gas and oil resources
industry’s mid (2.3 million barrels per day) and high (2.9 million barrels per day) forecasts in 2030 span either side of the AEO2011 forecast of 2.7 million barrels per day, while the industry’s low (2.0 million barrels per day) forecast is relatively flat through 2030.
The study team received a wide range of industry/consultant views regarding future Canadian oil pro-duction. The industry mid case oil total production forecasts were lower than EIA’s forecast, and also below IEA’s forecast total in all years. At 1.9%, indus-try’s median Canadian oil production CAGR from 2009 until 2030 was just slightly less than IEA at 2.0%, but well below the EIA’s Reference Case Canadian oil pro-duction CAGR at 2.9%. The industry/consultant high scenario provided a 2.8% CAGR, just below EIA’s ref-erence case CAGR estimate. In all the cases, conven-tional oil production from the onshore and offshore was projected to decline due to the high field decline rates and relatively small remaining potential in both Western Canada and the offshore (Atlantic). More-over, no significant production was anticipated in the Canadian Arctic, probably a result of the high supply
cost of these large, remaining resources, along with the absence of infrastructure or cost-effective trans-portation mechanisms to get these remote resources into the marketplace.
The major differences between the cases in Figure 1-9 are predominantly due to the range of pro-duction levels for the Canadian oil sands. The indus-try’s median case is only 3.6 million barrels per day – a significant 600 thousand barrels per day below the agency forecasts of commercially available resource plays in North America. Even the industry’s high case at about four million barrels per day is below both the EIA and IEA cases at 4.2 million barrels per day. Clearly, industry is more conservative about overcoming the above ground challenges to rapidly increase production, especially in light of the addi-tional pipeline infrastructure that will be required to either bring additional volumes down the refiners on the U.S. Gulf Coast (e.g., the currently proposed Keystone XL project) or consider exporting crude oil to Asia Pacific, which would require a new infrastruc-ture network from Alberta to the Canadian west coast, and export facilities.
Figure 1-9. Industry Forecast of Canadian Oil Production by Type versus EIA and IEA Totals
Sources: Energy Information Administration (EIA) Annual Energy Outlook 2010 (AEO2010) and International Energy Outlook 2010 (IEO 2010); International Energy Agency (IEA) World Energy Outlook 2010 (WEO 2010).
2009LOW
2015 MID HIGH LOW
2020 MID
HIGH LOW
2025 MID HIGH LOW
2030 MID
HIGH
2.0 2.2 2.4 2.6 1.4 2.1 2.8 3.2 3.6 2.1 2.8 3.4 4.0
0
2
4
6
MIL
LIO
N B
ARR
ELS
PER
DAY
INDUSTRY OIL SANDS INDUSTRY CONVENTIONAL OFFSHORE INDUSTRY CONVENTIONAL ONSHORE
INDUSTRY ARCTIC EIA TOTAL OIL IEO 2010 IEA TOTAL OIL WEO 2010*
ACTUAL
* New Policies Case.
Figure 1-9. Industry Forecast of Canadian oil production by type versus eIa and Iea totals

Chapter 1 - resourCes and supply 69
In summary, the future of North American future oil supplies in the near to medium term is heavily dependent on the U.S. offshore (40–100 billion bar-rels “economically” recoverable resources) and Cana-dian oil sands (150–310 billion barrels of “economi-cally” recoverable resources). Existing oil production from Alaska also delivers a significant near-term contribution amounting to over 10% of U.S. crude oil production, and maintaining this production has an important role in the time until Arctic exploration can deliver new oil supply. Production from EOR, tight oil, shale oil, and liquids from coal or natural gas will contribute some growth volumes. More impor-tantly, if U.S. federal government regulation prevents access to the U.S. offshore resources, or constrains transport of Canadian oil sands production, then North American oil production could decline.
The U.S. and Canadian combined total conven-tional oil production (Figures 1-10 and 1-11) has undulated from 8.4 million barrels per day in 1995, to 7.5 million barrels per day in 2005, to 8.1 mil-lion barrels per day in 2010. The EIA is forecasting that conventional oil sectors will slowly trend down to 7.3 million barrels per day in 2035. However, EIA shows Canadian oil sands production grow-ing significantly and driving total North American oil production to over 11 million barrels per day by 2035. When comparing EIA’s U.S. and Canada oil production forecast with IEA’s and the indus-try’s, the EIA case is the most optimistic, with the exception of the industry’s high case. The IEA is forecasting 2030 U.S. and Canadian production 1.5 million barrels per day lower than EIA. The industry’s median case ends up being about the same in 2030 as IEA’s, whereas its low case forecasts only 7.3 million barrels per day, a full 3.6 million barrels per day lower than EIA’s forecast.
Natural Gas
Resource Estimates
Historically, North American gas production has generally kept pace with growing consumption requirements. Canadian production has continued to exceed demand, while just in the past decade the United States and Mexico have received LNG imports in addition to the pipeline gas from within North America to supplement their domestic supply base. As a result of drilling technology advances and
the emergence of the recent “game changing” shale gas plays, the gap between U.S. demand and produc-tion is closing rapidly and likely to reduce greatly the future need for LNG imports (see Figures 1-12 and 1-13).
North America contains both conventional and unconventional oil and gas resources. Until the last decade, most oil and gas resource estimates largely included conventional in place and recoverable vol-umes. The vast majority of historical production from North America has been from conventional res-ervoirs and our understanding of both the in-place and ultimate recoverable volumes is more mature than for unconventional accumulations.
While the size of the North American conventional resource base is relatively well understood, our knowl-edge of the unconventional gas endowment is growing rapidly given increased industry activity and focus on shale and tight gas. The gas assessments of the ulti-mate, technically, commercially, remaining recover-able resource base for both Canada and United States vary considerably (Table 1-3). This is largely a func-tion of the vintage of the assessments and whether they included the most recent data and insights from the unconventional gas sector, especially shale gas. The ultimate remaining recoverable resources for the United States ranged from 1,000 to 4,500 Tcf of gas, while Canada ranged from 500 to 1,250 Tcf of gas. The United States has produced around 1,140 Tcf, which suggests it has consumed around 20 to 40% of the total domestic gas endowment based on the range of collected data. Canada has produced around 175 Tcf, which is around 10% to a quarter of its total gas resource base. If Canada used its domestic supplies for only internal demand requirements at current consumption rates, this would be equivalent to 140 to 360 years of domestic supply.
The U.S. conventional, remaining recoverable resource base is approximately 25 to 40% of the total remaining natural gas volumes in the United States and ranges from 515 to 1,160 Tcf of gas. The cur-rent EIA (2011 reference case) assessment of over 1,000 Tcf of gas is at the upper end of the indus-try estimates and may suggest a difference of views regarding the technical and commercial viability of some of the remaining conventional resource base. The EIA and industry have a relatively similar view of the conventional onshore, with the low and mid cases for industry ranging from 215 to 290 Tcf and

70 prudent deVelopMent: realizing the potential of north america’s abundant natural Gas and oil resources
Figure 1-11. U.S. and Canadian Oil Production Cases
* Includes condensate, natural gas liquids, and re�nery gain.
0
2
4
6
8
10
12
14
2010 2015 2020 2025 2030
IEA* U.S. + CANADA OIL PRODUCTION INDUSTRY HIGH OIL PRODUCTION INDUSTRY MEDIAN OIL PRODUCTION
INDUSTRY LOW OIL PRODUCTION EIA U.S. + CANADA* OIL PRODUCTION
MIL
LIO
N B
ARR
ELS
PER
DAY
YEAR
Sources: International Energy Agency (IEA) World Energy Outlook 2010; Energy Information Administration (EIA) Annual Energy Outlook 2010.
Figure 1-11. u.s. and Canadian oil production Cases
Figure 1-10. U.S. and Canadian Oil Production Forecast
0
4
8
12
MIL
LIO
N B
ARR
ELS
PER
DAY
YEAR1980 1990 2000 2010 2020 2030 2040
* Includes condensate, natural gas liquids, and re�nery gain.Source: Energy Information Administration’s International Energy Outlook 2010.
CANADIAN UNCONVENTIONAL PRODUCTION CANADIAN CONVENTIONAL PRODUCTION*
U.S. CONVENTIONAL PRODUCTION U.S. + CANADA CONVENTIONAL
Figure 1-10. u.s. and Canadian oil production Forecast

Chapter 1 - resourCes and supply 71
FIgure 1-12. U.S. Natural Gas Production and Consumption
0
10
20
1981 1986 1991 1996 2001 2006 2011
TRIL
LIO
N C
UBI
C FE
ET P
ER Y
EAR
YEAR
DRY GAS PRODUCTIONCONSUMPTION
Source: Energy Information Administration’s AEO2011 Reference Case.
Figure 1-13. Canadian Natural Gas Production and Consumption
0
2
4
6
1980 1985 1990 1995 2000 2005 2010
TRIL
LIO
N C
UBI
C FE
ET P
ER Y
EAR
YEAR
DRY GAS PRODUCTIONCONSUMPTION
Source: Energy Information Administration’s AEO2011 Reference Case.
Figure 1-12. u.s. natural Gas production and Consumption
Figure 1-13. Canadian natural Gas production and Consumption

72 prudent deVelopMent: realizing the potential of north america’s abundant natural Gas and oil resources
the EIA (2011 reference case) was 290 Tcf. This is probably the most mature exploration and produc-tion area in North America. The industry remaining recoverable resource range for the offshore region was 160–375 Tcf and the EIA (2011 reference case) was at the upper end at 320 Tcf. The vast majority of the remaining resources are located in the Gulf of Mexico with estimates ranging from 200 to 300+ Tcf, with the Pacific and the Atlantic Coast each around 20 to 30+ Tcf. The 2011 EIA reference case had the highest estimate of the Arctic remain-ing recoverable gas of 418 Tcf, which exceeded the
industry’s range of 130–345 Tcf and the Potential Gas Committee (2008) assessment of 194 Tcf. The largest remaining recoverable resources in the Arc-tic are located in the Alaska North Slope and include the approximately 35+ Tcf already discovered, plus additional exploration and growth potential bring-ing the total potential to over 100 Tcf. The Chukchi Outer Continental Shelf (OCS) (~90 Tcf), Beaufort (~30 Tcf), and Bering Shelf (~20 Tcf) also may con-tain material gas resources. Finally, various consul-tants (ICF International 2008, Science Applications International Corporation/Gas Technology Institute
Table 1-3. natural Gas resource Base
(Trillions of Cubic Feet)
PGC 2008 (2010)
EIA AEO2011 Low Scenario* Mid Scenario* High
Scenario*
produced 1,140
u.s. total remaining 2,074 (2,170) 2,543 1,500 2,300 4,000
arctic 194 290 130 210 345
lower-48 offshore Conventional 869 446 160 260 375
lower-48 onshore Conventional 352 215 290 440
tight Gas 455 200 350 550
shale 616 (687) 862 700 1,000 1,800
(lower-48) Coalbed Methane 99 (159) 138 90 120 150
NEB 2010 Low Scenario* Mid Scenario* High Scenario*
produced 175
Canada total* remaining 1,027 500 900 1,250
offshore Conventional 100 85 100 105
arctic 116 45 75 125
onshore Conventional 115 100 145 185
tight Gas 104 40 70 100
shale Gas (neB doesn’t include Montey)
82 (+>200–400+) 200 400 600
Coalbed Methane 34 30 80 140
* low-high range based on spread of all data.
sources: potential Gas Committee (pGC) 2008 and 2010; energy Information administration’s annual energy outlook 2011 (aeo2011); national energy Board of Canada (neB) 2010; and npC Industry survey, aggregated data.
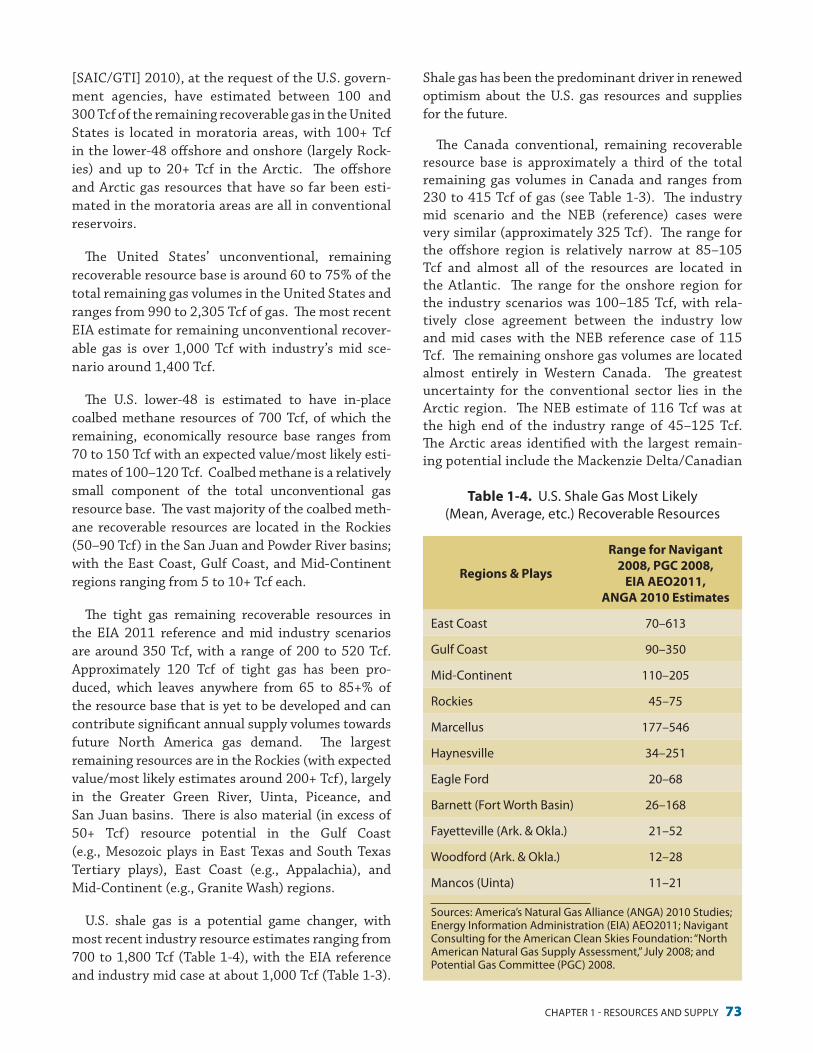
Chapter 1 - resourCes and supply 73
[SAIC/GTI] 2010), at the request of the U.S. govern-ment agencies, have estimated between 100 and 300 Tcf of the remaining recoverable gas in the United States is located in moratoria areas, with 100+ Tcf in the lower-48 offshore and onshore (largely Rock-ies) and up to 20+ Tcf in the Arctic. The offshore and Arctic gas resources that have so far been esti-mated in the moratoria areas are all in conventional reservoirs.
The United States’ unconventional, remaining recoverable resource base is around 60 to 75% of the total remaining gas volumes in the United States and ranges from 990 to 2,305 Tcf of gas. The most recent EIA estimate for remaining unconventional recover-able gas is over 1,000 Tcf with industry’s mid sce-nario around 1,400 Tcf.
The U.S. lower-48 is estimated to have in-place coalbed methane resources of 700 Tcf, of which the remaining, economically resource base ranges from 70 to 150 Tcf with an expected value/most likely esti-mates of 100–120 Tcf. Coalbed methane is a relatively small component of the total unconventional gas resource base. The vast majority of the coalbed meth-ane recoverable resources are located in the Rockies (50–90 Tcf) in the San Juan and Powder River basins; with the East Coast, Gulf Coast, and Mid-Continent regions ranging from 5 to 10+ Tcf each.
The tight gas remaining recoverable resources in the EIA 2011 reference and mid industry scenarios are around 350 Tcf, with a range of 200 to 520 Tcf. Approximately 120 Tcf of tight gas has been pro-duced, which leaves anywhere from 65 to 85+% of the resource base that is yet to be developed and can contribute significant annual supply volumes towards future North America gas demand. The largest remaining resources are in the Rockies (with expected value/most likely estimates around 200+ Tcf), largely in the Greater Green River, Uinta, Piceance, and San Juan basins. There is also material (in excess of 50+ Tcf) resource potential in the Gulf Coast (e.g., Mesozoic plays in East Texas and South Texas Tertiary plays), East Coast (e.g., Appalachia), and Mid-Continent (e.g., Granite Wash) regions.
U.S. shale gas is a potential game changer, with most recent industry resource estimates ranging from 700 to 1,800 Tcf (Table 1-4), with the EIA reference and industry mid case at about 1,000 Tcf (Table 1-3).
Shale gas has been the predominant driver in renewed optimism about the U.S. gas resources and supplies for the future.
The Canada conventional, remaining recoverable resource base is approximately a third of the total remaining gas volumes in Canada and ranges from 230 to 415 Tcf of gas (see Table 1-3). The industry mid scenario and the NEB (reference) cases were very similar (approximately 325 Tcf). The range for the offshore region is relatively narrow at 85–105 Tcf and almost all of the resources are located in the Atlantic. The range for the onshore region for the industry scenarios was 100–185 Tcf, with rela-tively close agreement between the industry low and mid cases with the NEB reference case of 115 Tcf. The remaining onshore gas volumes are located almost entirely in Western Canada. The greatest uncertainty for the conventional sector lies in the Arctic region. The NEB estimate of 116 Tcf was at the high end of the industry range of 45–125 Tcf. The Arctic areas identified with the largest remain-ing potential include the Mackenzie Delta/Canadian
Table 1-4. u.s. shale Gas Most likely (Mean, average, etc.) recoverable resources
Regions & Plays
Range for Navigant 2008, PGC 2008,
EIA AEO2011, ANGA 2010 Estimates
east Coast 70–613
Gulf Coast 90–350
Mid-Continent 110–205
rockies 45–75
Marcellus 177–546
haynesville 34–251
eagle Ford 20–68
Barnett (Fort Worth Basin) 26–168
Fayetteville (ark. & okla.) 21–52
Woodford (ark. & okla.) 12–28
Mancos (uinta) 11–21
sources: america’s natural Gas alliance (anGa) 2010 studies; energy Information administration (eIa) aeo2011; navigant Consulting for the american Clean skies Foundation: “north american natural Gas supply assessment,” July 2008; and potential Gas Committee (pGC) 2008.

74 prudent deVelopMent: realizing the potential of north america’s abundant natural Gas and oil resources
Beaufort (~60 Tcf) and the Arctic Islands/ Sverdrup Basin (~35 Tcf).
The Canada unconventional, remaining recover-able resource base is approximately two-thirds of the total remaining gas volumes in Canada and ranges from 270 to 840 Tcf of gas. The NEB and industry believe there is around 150 Tcf of remaining recov-erable resources in coalbed methane and tight gas reservoirs in the mid/reference cases. Additionally, the incremental upside for coalbed methane plus tight gas in the industry high scenario was less than 100 Tcf. These plays types are located almost entirely in Western Canada close to the existing infrastructure network.
Canadian shale gas is another potential game changer. The industry estimate of remaining recover-able resource potential estimates of 200–600 Tcf could be almost half of the remaining gas resource potential for Canada. These plays are in the early development phase and thus we can expect the “mean” or most likely values and the range to be better delineated as we get additional well and production performance data over the next decade. Whereas in conventional reservoirs where as much as 95% of the natural gas can be recovered, the ultimate recoverable volume from shale reservoirs may reach up to 20–30% of the in-place resource, with recovery from some less rich reservoirs down below 10%. Cretaceous, Juras-sic, Triassic, Mississippian, and Devonian shales are potential targets with the largest resource potential located in Western Canada.
In summary, the outlook for North America natu-ral gas production has changed dramatically in just the past few years. The gas resource base in both the United States and Canada is believed to have increased significantly and will have profound impacts on the North American energy market from an economic, energy security and environmental standpoint. The gas resource base does not appear to be a limiting fac-tor on bringing new North American supplies to mar-ket. Estimates of technically recoverable shale gas are highly likely to change over time as new information is gained through drilling, production, and technolog-ical and managerial development.
Production Outlooks
Only in the most optimistic, high-side cases were the outlooks for U.S. conventional production lev-els forecast to increase above the current 10 Tcf/yr
(Figure 1-14). The amount of new conventional gas wells required to simply maintain production levels continues to increase over time and industry has been focusing its capital in lower cost and/or higher pro-ductivity wells in other sectors (e.g., unconventional and offshore supply regions). Recent exploration discovery sizes have been small, wildcat success rates have been low, and much of the remaining resource potential is in small field fractions in the U.S. lower-48 onshore conventional sector.
There is a wide range in the future productive capac-ity of the lower-48 offshore, with current production levels of around 2.5 Tcf/yr falling to 1.5 Tcf/yr in 2035 in the low-side cases and rising as high as 3.2 Tcf in the high-side cases. While initial flow rates from off-shore wells can exceed 50 million cubic feet per day (MMcf/d), these wells have steep decline rates and thus active drilling programs to replenish supplies are needed to maintain and grow production. We inter-pret the outlooks for decline in U.S. lower-48 offshore production levels in the cases we collected from indus-try to reflect concerns about the resumption of his-torical drilling activity levels in the Gulf of Mexico and the timing of access to new areas in the Gulf, Pacific, and Atlantic.
The Arctic (Alaska) region currently is producing less than 0.3 Tcf/yr; however, there are consider-able discovered (in excess of 35+ Tcf) and additional undiscovered resources that could supply in excess of 2+ Tcf/yr if the necessary infrastructure was in place to move gas into the U.S. lower-48 markets. As with the Mackenzie project in the Canadian Arctic, the tim-ing of the Alaska pipeline project continues to slip and most outlooks now question whether these supplies will be entering the market before 2035, a major devi-ation from past studies that foresaw Arctic gas online as early as this decade.
By the 2020s, more than 60% of the total U.S. gas supplies are likely to come from domestic, unconven-tional resources. The studies indicate that the small-est unconventional resource contributor will be coal-bed methane, with current production levels around 2 Tcf/yr, and future production capacity ranging from 1.5 to 2.5 Tcf/yr by 2035. Three quarters of the cur-rent production is from the Rocky Mountains, with the lion’s share from the San Juan and Powder River basins. The majority of regional data for the coal-bed methane sector suggested the approximately 0.5 Tcf/yr of production from the Gulf Coast, East
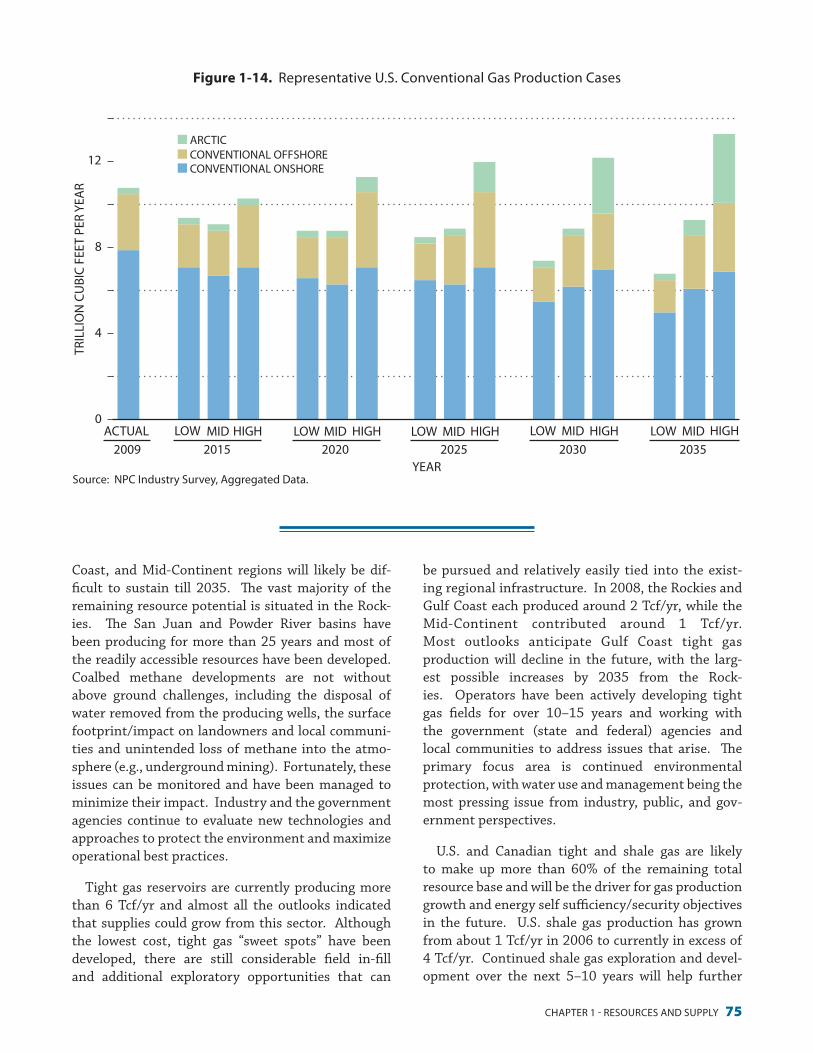
Chapter 1 - resourCes and supply 75
Coast, and Mid-Continent regions will likely be dif-ficult to sustain till 2035. The vast majority of the remaining resource potential is situated in the Rock-ies. The San Juan and Powder River basins have been producing for more than 25 years and most of the readily accessible resources have been developed. Coalbed methane developments are not without above ground challenges, including the disposal of water removed from the producing wells, the surface footprint/impact on landowners and local communi-ties and unintended loss of methane into the atmo-sphere (e.g., underground mining). Fortunately, these issues can be monitored and have been managed to minimize their impact. Industry and the government agencies continue to evaluate new technologies and approaches to protect the environment and maximize operational best practices.
Tight gas reservoirs are currently producing more than 6 Tcf/yr and almost all the outlooks indicated that supplies could grow from this sector. Although the lowest cost, tight gas “sweet spots” have been developed, there are still considerable field in-fill and additional exploratory opportunities that can
be pursued and relatively easily tied into the exist-ing regional infrastructure. In 2008, the Rockies and Gulf Coast each produced around 2 Tcf/yr, while the Mid-Continent contributed around 1 Tcf/yr. Most outlooks anticipate Gulf Coast tight gas production will decline in the future, with the larg-est possible increases by 2035 from the Rock-ies. Operators have been actively developing tight gas fields for over 10–15 years and working with the government (state and federal) agencies and local communities to address issues that arise. The primary focus area is continued environmental protection, with water use and management being the most pressing issue from industry, public, and gov-ernment perspectives.
U.S. and Canadian tight and shale gas are likely to make up more than 60% of the remaining total resource base and will be the driver for gas production growth and energy self sufficiency/security objectives in the future. U.S. shale gas production has grown from about 1 Tcf/yr in 2006 to currently in excess of 4 Tcf/yr. Continued shale gas exploration and devel-opment over the next 5–10 years will help further
Figure 1-14. Representative U.S. Conventional Gas Production Cases
0
4
8
12
TRIL
LIO
N C
UBI
C FE
ET P
ER Y
EAR
YEAR2009
LOW 2015 MID
HIGH LOW
2020 MID
HIGH LOW
2025 MID HIGH LOW
2030 MID HIGH ACTUAL LOW
2035 MID HIGH
CONVENTIONAL OFFSHORE CONVENTIONAL ONSHORE
ARCTIC
Source: NPC Industry Survey, Aggregated Data.
Figure 1-14. representative u.s. Conventional Gas production Cases

76 prudent deVelopMent: realizing the potential of north america’s abundant natural Gas and oil resources
reduce the current uncertainty over the long term for the U.S. and Canadian resource base. While conven-tional, coalbed methane and tight gas developments are becoming increasingly costly and/or complex, “lower” cost shale developments provide potential to grow U.S. and Canadian production. If the higher-end recoverable resource estimates are affirmed, a robust production plateau can be maintained for many decades. In the mid and high industry cases in Figure 1-15, shale gas production is anticipated to grow to more than 10 Tcf/yr by 2035. The main chal-lenges associated with large-scale shale gas develop-ments are potential concerns about water use/man-agement associated with the hydraulic fracturing applications required to produce commercial quanti-ties of gas from shale reservoirs, and other surface impacts.
In all cases studied, the Canadian onshore conven-tional sector production output is expected to decline over the next 20 years (see Figure 1-16) and con-tinue the trend of declining production (in excess of 1 Tcf/yr) over the last 10 years. These supplies are almost entirely in Western Canada, and we anticipate
industry will continue to maximize ultimate recovery from these plays; however, most new additions will be small pool sizes around existing fields or infill drill-ing projects. The rate of decline in the existing res-ervoirs/fields in Western Canada is greater than 10% per annum. Without large, new discoveries, it will be impossible to reverse this trend. Deep, high pressure, and/or sour gas remaining resources/opportunities are likely to be higher cost developments and may not attract investment in light of lower cost unconven-tional plays in the area.
Future gas production capacity from the Canadian offshore (Atlantic) is believed to be relatively small (less than 0.2 Tcf/yr). Unless large new discoveries are made in the Atlantic (e.g., Orphan basin), this area is unlikely to have a material impact on Canada’s con-ventional production capacity.
The only area that can provide substantive new conventional gas volumes is the Canadian Arctic; however, there is considerable diversity of views as to when this generally “higher” cost gas will enter the market. The anticipated Mackenzie gas project
Figure 1-15. Representative U.S. Unconventional Gas Production Cases
TRIL
LIO
N C
UBI
C FE
ET P
ER Y
EAR
YEAR2009
LOW 2015 MID HIGH LOW
2020 MID
HIGH LOW
2025 MID HIGH LOW
2030 MID
HIGH ACTUAL LOW
2035 MID HIGH
0
10
20
30
SHALE GASCOALBED METHANETIGHT GAS
Source: NPC Industry Survey, Aggregated Data.
Figure 1-15. representative u.s. unconventional Gas production Cases

Chapter 1 - resourCes and supply 77
timing has slipped considerably since the first NPC North America gas study in 1999, largely a result of the challenges associated with building a large export pipeline from the discovered fields (with significant follow-up potential in the Arctic) to existing Western Canada infrastructure.
Unconventional gas production is expected to off-set the overall decline for the conventional sources in Canada (Figure 1-17). Shale gas is the potential game changer and is anticipated to grow from the 0.1 to 1.5 Tcf/yr (low) to 2.4 Tcf/yr (high) by 2030. Coal-bed methane production is anticipated to be between 0.3 Tcf/yr and 0.6 Tcf/yr in the above scenarios by 2030. While it is difficult to distinguish the transi-tion from conventional to tight and shale gas reser-voirs in Western Canada, the perception is that there is more remaining resource potential to exploit tight and shale gas in the study time frame than conven-tional sources.
All the outlooks collected indicated that Canadian gas production will exceed even the largest inter-nal demand requirement scenarios (up from 2.8 to
4 Tcf/yr), and, therefore, the main driver for Cana-dian output will be “pull” from the United States and other export markets. Most outlooks suggested that without shale gas and in some instances Arctic gas production, Canadian gas production is likely to continue its decline from historical levels. Both the industry “mid” and reference cases indicate that Canadian conventional, tight gas, and coalbed meth-ane supplies would likely decline to around 4 Tcf/yr by 2025. The industry view was more optimistic about the contributions likely from shale gas plays, whereas the NEB saw the Arctic gas and pipeline com-ing into play earlier than industry.
The combined outlooks from all sources for U.S. and Canadian production potential over the next two and a half decades (as seen in Figure 1-18) indicate rea-sonable scope for continued growth in production to the high 30s Tcf level. Clearly, actual growth rates will depend just as much on market factors as on supply potential, but the outlooks show there would be scope for supply to support quite significant market expan-sion, which would bring economic and energy security as well as greenhouse gas benefits.
Figure 1-16. Representative Canadian Conventional Gas Production Cases
2009LOW
2015 MID HIGH LOW
2020 MID
HIGH LOW
2025 MID HIGH LOW
2030 MID HIGH
TRIL
LIO
N C
UBI
C FE
ET P
ER Y
EAR
YEAR
ACTUAL 0
1
2
3
4
Source: NPC Industry Survey, Aggregated Data.
CONVENTIONAL OFFSHORE CONVENTIONAL ONSHORE
ARCTIC
Figure 1-16. representative Canadian Conventional Gas production Cases

78 prudent deVelopMent: realizing the potential of north america’s abundant natural Gas and oil resources
Figure 1-17. Representative Canadian Unconventional Gas Production Cases
2009LOW
2015 MID HIGH LOW
2020 MID
HIGH LOW
2025 MID HIGH LOW
2030 MID HIGH
YEAR
ACTUAL 0
1
2
3
4
5
TRIL
LIO
N C
UBI
C FE
ET P
ER Y
EAR
SHALE GASCOALBED METHANETIGHT GAS
Source: NPC Industry Survey, Aggregated Data.
Figure 1-18. Industry Estimates of Potential Natural Gas Production from North American Supply Sources
0
10
20
30
40
2000 2005 2009 2015 2020 2025 2030 2035
TRIL
LIO
N C
UBI
C FE
ET P
ER Y
EAR
YEAR
Sources: Energy Information Administration’s AEO2010 Reference Case; and International Energy Agency’s WEO 2010.
CANADA SHALE HIGH CANADA SHALE MID U.S. ARCTIC MID U.S. SHALE HIGH
U.S. LOWER-48 SHALE MID U.S. LOWER-48 CONVENTIONAL + TIGHT + CBM MID 2010 AEO LG DEMAND 2010 WEO FP DEMAND
Notes: CBM = coalbed methane; LG = low growth; FP = future policies; WEO = World Energy Outlook.
Figure 1-17. representative Canadian unconventional Gas production Cases
Figure 1-18. Industry estimates of potential natural Gas production from north american supply sources

Chapter 1 - resourCes and supply 79
Development Challenges and Enablers
While the gas base resource is large, there are chal-lenges to delivering U.S. and Canadian gas production growth. A long-term approach is necessary to address the energy trade-offs that will provide the optimal solution for North America’s energy future. Follow-ing is a brief discussion of these challenges at various stages along the value chain. All were identified by respondents to the confidential data survey as issues of concern. A typical development path is outlined in Figure 1-19.
Resource Access is essential to sustaining and grow-ing production. Since most unconventional gas plays are on private rather than government held acreage, several issues pertain: many conventional offshore opportunities in the lower-48 states and Alaska are currently not available to industry; recent proposed lease sales in the Gulf of Mexico have been delayed and cancelled in the Alaska OCS; and the lease “expiry” clock is winding down on currently held acreage. Con-sultant studies done on the behalf of the various U.S.
government agencies have estimated that between 100 and 300 Tcf are currently in moratoria areas inac-cessible to industry.
Opportunity Identification/Research & Technology Development is the enabler to unlock future oppor-tunities. Industry will typically focus its resources (people, funding) in the areas it believes will have the most commercial impact. For example, although the Atlantic, Pacific, and some Arctic offshore is cur-rently inaccessible, modern methods of seismic data collection and interpretation would help improve our understanding of their resource potential and the commercial viability of these areas, which can only help shorten the time between opening them up and the production of oil and gas.
In the E&P Project Planning and Execution area, per-mitting and compliance with all regulatory require-ments is becoming increasingly difficult and time con-suming. In the offshore sector, industry is actively seeking to begin operating again in the Gulf of Mex-ico deepwater and pursue exploratory activities on leases in the Arctic. However, significant delays are
Figure 1-19. A Typical Production Pathway
IDENTIFICATION OF TECHNICALLY VIABLE ENERGY RESOURCES
ASSESSMENT OF RESOURCE BASE SIZE AND COMMERCIAL VIABILITY/DOABILITY
RESOURCE (OPPORTUNITY, ACREAGE, ETC.) ACCESS
EXPLORATION (VALIDATE; QUANTIFY; DECISION POINT TO TRIGGER LARGE DEVELOPMENT INVESTMENTS)
PROJECT DEVELOPMENT (INDUSTRY CAPACITY – PEOPLE, MATERIALS, EQUIPMENT, ETC.; CAPITAL AVAILABILITY; PROJECT MANAGEMENT PRACTICES; PERMITTING)
INFRASTRUCTURE/TRANSPORTATION TO END USERS (AVAILABILITY; TIMING OF NEW TRANSPORTATION ROUTES/NETWORKS)
PRODUCTION OPERATIONS (BEST PRACTICES)
Figure 1-19. a typical production pathway

80 prudent deVelopMent: realizing the potential of north america’s abundant natural Gas and oil resources
being encountered, likely delaying future production volumes. A timely solution is needed and coopera-tion between government officials, industry, and the public that can accelerate resolution to this challenge would be welcomed.
Since an increasing share of future production will be from shale and tight oil and gas opportunities that require hydraulic fracturing, all permitting/opera-tional/regulatory concerns regarding unconventional gas and tight oil must be addressed in a timely manner to continue allowing volumes to grow from these large resources. Water cycle management is one of the most important focus areas that will enable exploratory and development activities. In addition to provid-ing a clear, timely process to drill and complete wells, industry and other stakeholders should continue to explore innovative ways to reduce water use and improve recycling and disposal technology/practices. Additional surface, air, and other areas are being stud-ied by industry and government agencies. However, there is a need to apply the most cost-effective solu-tions that help reach an optimal balance for economic, environment, and energy security considerations.
Industry Capacity needs to be evaluated on a total energy system basis, since increased activity in any one sector or area may only result in a shift in resources, rather than a material increase in the oil and gas industry’s ability to grow total supplies.
As originally noted in the 2007 NPC Hard Truths report, the oil and gas industry is facing a consider-able human resource challenge. Nearly 50% of the workforce will be eligible for retirement in the next 10 years and fewer university graduates have entered the workforce over the past generation. Industry and government have roles to play in helping to rebuild the science and engineering capabilities and commu-nicating the benefits of employment with oil and gas companies. An increased focus on training younger employees is essential, especially if activity levels con-tinue to increase, with an emphasis on operational best practices, safety and environmental protection in order to address the retirements of many highly experienced industry personnel.
While growth in the gas sector can be partially offset by shifting resources from other parts of the industry, the system could become stretched or incapable of meeting a high growth scenario in the unconventional gas and tight oil areas, Canadian oil sands, expansion of E&P in the offshore and Arctic, and finally resource
intensive plays like oil shale in the Rockies. Growth in all these areas would put a large strain on people, materials, and equipment.
Industry/Government/Public Cooperation can be the linchpin to work through obstacles and/or challenges to our energy future. The most rapid and effective way to resolve issues is to work together to under-stand the fundamentals; quantify the benefits and concerns; openly discuss the trade-offs with all con-cerned stakeholders; and then jointly support and proceed with a “solution” to accelerate energy “gains” (that should include increased efficiency/reduction in energy use, increased supply, increased environmen-tal protection, and increased energy security).
One way to improve the data sharing and knowledge of the fundamentals would be to work through exist-ing organizations to develop a more systematic pro-cess for governments, industry, and public to collect, discuss and share data that would be kept in a well-managed repository. Improving full-cycle, energy value chain modeling (tools, data, interpretation, and workshops) could expand a more rounded discussion of alternative energy visions, strategic directions, and overall energy policy options. Periodic studies by the industry, government committees, and public institu-tions are both helpful and useful.
PROSPeCTS FOR NORTh AMeRICAN OIl DevelOPMeNT
Overview
Both the United States and Canada are major oil resource-holding and -producing countries on a global scale and have been for many years. However, since the United States is also a large oil importer, the focus of attention has been on reducing imports and improving energy security by demand-side measures, such as efficiency standards for vehicles, rather than supply-side measures, such as enabling domestic oil supply development in new areas. This section of the report sets out the opportunities for continued North American oil development and production activities at scale. Major producing areas now contributing sig-nificant volumes of crude oil to North American sup-ply are profiled, such as the offshore Gulf of Mexico, the Alberta oil sands, and the multiple producing basins focusing on conventional oil distributed across the United States and Canada. Opportunities for sus-taining and growing these sources are examined and

Chapter 1 - resourCes and supply 81
assessed. In addition, emerging and new sources of crude oil in the region are examined. These include new exploration in the Arctic regions of the United States and Canada, the emerging tight oil plays, the poten-tial from offshore zones where access has been under development restrictions, and the potential emergence of new unconventional oil sources such as U.S. oil shale. Each major heading in this section describes one seg-ment of this portfolio of current and future oil supply, and includes an overview of the context and produc-tion history, where applicable. Also included are the key technologies required for development, the poten-tial production pathways to 2035 and beyond, and an outline of the key findings. The section concludes with an overview of the crude oil pipeline network required to deliver this supply to market. Each of these topics is described in more detail in the topic papers to this report, available on the NPC website.
Offshore
Development and Production History and Context
U.S. Lower-48 Offshore
Offshore oil and gas development and produc-tion have been on the rise in North America over an extended period. In the U.S. lower-48, federal OCS oil production has increased its contribution to total U.S. production from less than 1% in 1954 to more than 30% in 2009. The expansion of offshore development and production is ascribed overall to technological progress keeping pace with more challenging offshore environments leading to larger field discoveries in ever-increasing water depths.
Currently, U.S. lower-48 offshore oil and gas produc-tion is restricted to the Gulf of Mexico, with a minor contribution from the Pacific OCS region (about 4% of U.S. offshore production). Much of the Eastern Gulf of Mexico is expected to be restricted to drilling until the year 2022, and the Pacific and Atlantic OCS areas were restricted from leasing consideration up until 2008. For the purposes of this study, oil and gas development on the Alaska OCS is included as part of the Arctic region, rather than in the U.S. offshore region.
From its beginning in late 1940s, the U.S. federal offshore oil and gas industry has grown tremen-dously. In 1954, federal offshore crude oil and con-
densate production was around 2.5 million barrels or nearly 7,000 barrels per day. That figure peaked at around 600 million barrels in 2002 or 1.64 million barrels per day, accounting for 29% of total U.S. crude oil and condensate production. A surge in Gulf of Mexico deepwater oil production led to an increase of OCS crude oil production to around 591 million bar-rels in 2009 or 1.62 million barrels per day; account-ing for 30% of total U.S. oil production. Figure 1-20 shows offshore oil production as a percentage of total U.S. production from 1960 to 2009.
The move to deep water was made possible by con-tinuous advancements in technologies that permit-ted drilling and development in these environments. Examples of these advancing deepwater technology “firsts” in the Gulf of Mexico include the first fixed platform, “Cognac” installed in 1979 at water depth of 1,023 feet, while the tallest steel jacket “Bullwinkle,” considered the economic limit for this fixed plat-form type, was installed in 1989 at water depth of 1,353 feet. The first tension leg platform, “Joliet” was installed in 1989 at water depth of 1,760 feet, fol-lowed by “Neptune,” the first Spar/Subsea platform installed in 1997 in a water depth of 1,930 feet. On the ultra-deepwater front, Herschel/Na Kika/Fourier was the first Floating Production System installed in water depth of 6,950 feet in 2003. The first Floating Production Storage and Offloading system in the Gulf of Mexico is scheduled for first production in 2011 at the Cascade and Chinook prospects in 8,800 feet of water. According to the Minerals Management Ser-vice (MMS) report on deepwater Gulf of Mexico, in February 1997, there were 17 producing deepwater projects, up from only 6 at the end of 1992. Since then, industry has been rapidly advancing into ultra-deepwater, and many of these anticipated fields have commenced production. At the end of 2008, there were 141 producing projects in the deepwater Gulf of Mexico, up from 130 at the end of 2007.2
In March of 2010, Shell started production at the Perdido Spar complex in the Western Gulf of Mexico, and overtook the Independence Hub by setting the record for production in the deepest water. Moored 170 miles offshore in 7,817 feet of water, with sub-sea wells in up to 9,627 feet of water, peak production should achieve 130 thousand barrels of oil equivalent per day.
2 Richardson et al., Deepwater Gulf of Mexico 2008: America’s Off-shore Energy Future, U.S. Department of the Interior, Minerals Management Service, 2008, OCS Report MMS 2008-013.

82 prudent deVelopMent: realizing the potential of north america’s abundant natural Gas and oil resources
Development of the deepwater frontier (water depth greater than 1,000 feet) is responsible for increasing overall OCS crude oil and natural gas pro-duction since 2000. In fact, the year 2000 marks a transition from predominantly shallow water oil production to deepwater production. In 2000, annual deepwater crude oil production amounted to 271 million barrels, while shallow water production was 252 million barrels. By 2007, annual crude oil production from the shallow water had dropped to 140 million barrels while in deepwater regions of the Gulf of Mexico production rose to 328 million bar-rels. Since 2005, the deepwater Gulf of Mexico has contributed about 70% of the total Gulf of Mexico OCS crude oil production. This trend is expected to continue as more discoveries and drilling activities occur in the deepwater and ultra-deepwater areas of the Gulf of Mexico.
Given this history, the deepwater area of the Gulf of Mexico represents an important part of U.S. oil supply, and it is viewed as one of the most important world oil and gas provinces. All this has been made possible by means of technological breakthroughs that have allowed oil and gas companies to operate out in these harsh and challenging environments. The advent of drill ships capable of drilling in water depth up to 10,000 feet and deeper reservoirs, along with the subsea completion technology and the Hub system have greatly contributed to the expansion of offshore oil and gas development and production. Subsea tieback technology coupled with innovative subsea technology also increase the ability of the industry to develop and produce more oil and gas in fields that would not otherwise be economical. Accounting for approximately 290 productive wells in deep water, subsea systems continue to be a key
Figure 1-20. Federal Outer Continental Shelf (OCS) Oil as a Percentage of Total U.S. Production, 1960–2009
0
0.4
0.8
1.2
1.6
OIL
PRO
DU
CTI
ON
(MIL
LIO
N B
ARR
ELS
PER
DAY
)
0
10
20
30
PERC
ENT
FEDERAL OCS FEDERAL OCS PERCENTAGE OF TOTAL U.S. PRODUCTION
1960 1965 1970 1975 1980 1985 1990 1995 2000 2005 2010YEAR
1961 – First subsea well completed 1988 – Deepest �xed platform installation – Bullwinkle
1996 – First SPAR completed – Neptune
2006 – Installation of Independence hub in Gulf of Mexico
2002 – Deepest pipeline constructed at 7,209 feet
2010 – Completion of construction of �rst �oating production storage and o�oading in Gulf of Mexico
12
6
1989 – First U.S. tension leg platform – Jolliet at 1,760 feet – 3D seismic processing begins – Subsalt drilling begins
2003 – Discoverer Deep Seas drillship hits �rst well deeper than 10,000 feet3
41997 – Longest tieback constructed – Mensa 5
7
89
1 2 3 4 5 6 7 8 9
Figure 1-20. Federal outer Continental shelf (oCs) oil as a percentage of total u.s. production, 1960–2009

Chapter 1 - resourCes and supply 83
component in the success of the industry in deepwa-ter regions of the Gulf of Mexico.
Additional development potential exists in areas that have largely been under exploration and develop-ment moratoria for most of the past two decades, in particular the Eastern Gulf of Mexico and the Atlantic and Pacific OCS. Estimates of the undiscovered tech-nically recoverable resources of crude oil in U.S. off-shore moratoria areas vary from 18.2 to 63.0 billion barrels. In contrast, the BOEMRE mean estimates of total U.S. lower-48 offshore undiscovered techni-cally recoverable oil are 59.3 billion barrels.3 Although these estimates include a wide range of assumptions, their sheer magnitude demonstrates that a significant resource base remains available for future offshore oil production.
Canada Offshore
In Canada, offshore hydrocarbon production comes exclusively from its Atlantic margin, with nat-
3 Minerals Management Service, “Assessment of Undiscovered Technically Recoverable Oil and Gas Resources of the Nation’s Outer Continental Shelf, 2006,” February 2006.
ural gas and oil being produced in Nova Scotia and Newfoundland offshore.
In offshore Newfoundland, production in the Jeanne d’Arc Basin of the Grand Banks started in 1997 with the Hibernia field followed by the Terra Nova and White Rose fields in 2002 and 2005, respec-tively. From an initial annual production of 1.3 mil-lion barrels in 1997, production reached 97.7 million barrels in 2009, with a peak production of 134.5 mil-lion barrels in 2007. In 2009, average daily produc-tion was 340 thousand barrels per day. Cumulative oil production reached 1,125 million barrels in April 2010 (Figure 1-21).
While Canadian offshore production and develop-ment plans are confined to the Newfoundland and Nova Scotia sectors of the Atlantic margin, explora-tion activities (seismic and drilling) are planned in both areas and their less explored domains (Lauren-tian, Sydney, Orphan, and Flemish Pass sub-basins) that are under the Canada-Nova Scotia Offshore Petroleum Board (CNSOPB) or Canada-Newfound-land and Labrador Offshore Petroleum Board (CNLOPB) rules.
Figure 1-21. Total Monthly Oil Production – O�shore Newfoundland and Labrador
0
2
4
6
8
10
12
14
1997 1999 2001 2003 2005 2007 2009 2011
MIL
LIO
N B
ARR
ELS
NORTH AMETHYSTWHITE ROSE
TERRA NOVAHIBERNIA
Source: Canada-Newfoundland and Labrador O�shore Petroleum Board.
Figure 1-21. total Monthly oil production – offshore newfoundland and labrador

84 prudent deVelopMent: realizing the potential of north america’s abundant natural Gas and oil resources
The Gulf of St. Lawrence has been recently evalu-ated to host an in-place best estimate (P50) of 41 Tcf of gas and 2,500 million barrels of oil, largely in Carboniferous reservoirs. A significant gas discovery (77 Bcf) was made in this basin in 1970. Except for restricted zones under the jurisdictions of CNSOPB or CNLOPB, most of the Gulf area is under a de facto moratorium. The non-regulated area is currently the subject of jurisdiction discussions between the federal and provincial governments. Areas under the juris-diction of the CNSOPB and CNLOPB are, however, open for exploration. Seismic acquisition is planned in the CNLOPB area in 2011.
The Georges Bank area (offshore Nova Scotia) is evaluated to host 3,500 million barrels of in-place oil resources. The area is currently under an explora-tion moratorium, which has been recently extended to 2015.
The Pacific margin of western Canada is under a de facto moratorium, though no official legislation has been put in place. There have been no discoveries in this area, and the best estimate (P50) indicates the presence of in-place resources of 43.4 Tcf of gas and 9,800 million barrels of oil.
Of all the areas under legislated or de facto mora-toria, the Gulf of St. Lawrence is the one most likely to be opened for exploration in the next 5 to 10 years.
Production Pathways
Potential production from the offshore areas can be influenced by a variety of factors including technology progress, access to offshore leases, the economic envi-ronment, infrastructure development, environmental risk management capabilities, and geology. Here we set out a reasonably unconstrained production poten-tial and contrast it with a more constrained view, thus defining the range for U.S. lower-48 offshore oil production.
The unconstrained case is characterized by a favorable economic environment with buoyant oil demand, increased access to offshore lands, and accelerated technological progress. Conversely, the constrained case assumes lower oil demand, limited access to offshore zones, and slower technological improvement.
In particular, alternate cases published in the Energy Information Administration’s Annual
Energy Outlook are based on scenarios and sensi-tivities with expanded offshore access, accelerated technology deployment and high oil price environ-ments. Production of oil in U.S. lower-48 offshore increases from 1.7 million barrels per day in 2010 to 2.3 million barrels per day in 2035, in the high oil price case, according to the final results of AEO2011 (Figure 1-22).
The bulk of the expected increase in U.S. offshore oil production is likely to come from new discover-ies in deepwater and ultra-deepwater regions of the Gulf of Mexico, such as the Lower Tertiary trend. The Lower Tertiary is recognized as a huge resource with the potential for long-life projects of up to 30 to 40 years and the opportunity to enhance recoveries through advancing technology.
The AEO2011 Low Oil Price case provides insight into the lower or more constrained development pathway. Production of oil decreases from 1.8 mil-lion barrels per day in 2010 to 1.4 million barrels of oil per day in 2035. That level could be even lower if more restrictive operational safety requirements and legislative policies were passed and imple-mented, following the 2010 Macondo oil spill in the deepwater Gulf of Mexico. This occurrence would affect the rate of development and production of deepwater and ultra-deepwater oil and gas prospects in general, and the lower tertiary trend in particu-lar. The overall effect would be to increase drill times along with exploration and development costs, and thus slow significantly expected production over the next 10 years and dampen long-term output from the U.S. offshore. Production could be 20% lower by 2035 if long-term moratoria were reinstated as a result of the Macondo oil spill in the deepwater Gulf of Mexico and no development takes place outside the central and western Gulf of Mexico.
Key Offshore Technologies
Over the past 100 years, the petroleum industry has demonstrated an ability to develop breakthrough technologies that made a significant impact on find-ing and producing oil and gas. Drilling rigs, wireline logging, logging while drilling, geophysical surveys, subsea systems, and enhanced oil recovery, to name a few, have fueled an incredible century of progress. They provide diverse examples of effective existing, emerging, and future technologies that will expand

Chapter 1 - resourCes and supply 85
the frontiers of exploration and production. Cer-tainly each of them continues to play a critical role in increasing production growth in North America.
But industry is now faced with continuing and even growing challenges in the offshore, trying to grow production in deep water, often with poor subsurface images, in remote areas with limited infrastructure, in deeper, often hostile, high pressure high temper-ature environments, and finally doing all of this in a basin that is becoming more mature. The Gulf of Mexico is one of the most important regions in the United States for energy resources and infrastructure, accounting for just under 30% of total U.S. oil pro-duction and 13% of total natural gas production. Figure 1-23 illustrates that over 70% of that off-shore oil production in the Gulf comes from deep water, accounting for almost a quarter of U.S. oil production – and the amount is rising.
Future, successful exploration and development in both maturing open and currently restricted OCS areas will be critical to maintain North Ameri-
can oil and gas production. Operations must be con-ducted with improved safety measures while con-trolling costs. Tackling these challenges will involve continued use of existing technologies. To improve success and increase production and recovery, espe-cially in the Gulf of Mexico Lower Tertiary, develop-ment of new technologies will be necessary to ensure challenges are overcome.
Topic Paper #1-3, “Offshore Oil and Gas Supply,” associated with this report, builds off the excel-lent commentary made in the two technology topic papers that accompanied the 2007 NPC study Hard Truths: Facing the Hard Truths about Energy. The first of these papers, “Exploration Technology,” identi-fied five technology areas in which future develop-ments have the potential to significantly impact exploration results over the next 25 years. The sec-ond, entitled “Deepwater,” identified four top pri-ority deepwater-specific technological challenges most important to future deepwater development. The following is a summary of the key technologies from the papers.
Figure 1-22. Projection U.S. Lower-48 O�shore Oil Production
0
1
2
2.5
2010 2015 2020 2025 2030 2035
MIL
LIO
N B
ARR
ELS
PER
DAY
YEAR
AEO2010 (REFERENCE CASE 2010)AEO2011 (REFERENCE CASE 2011) AEO2011 (REDUCED OCS ACCESS 2011)
AEO2011 (HIGH OCS 2011)
Note: OCS = Outer Continental Shelf.Sources: Energy Information Administration’s AEO2010 Reference Case and AEO2011 Reference Case.
Figure 1-22. projection u.s. lower-48 offshore oil production

86 prudent deVelopMent: realizing the potential of north america’s abundant natural Gas and oil resources
“Exploration Technology” Topic Paper4
y Core Technology Areas:
− Seismic
− Controlled Source Electromagnetics (CSEM)
− Interpretation Technology
− Earth Systems Modeling
− Subsurface Measurements.
y Auxiliary Technologies – Future developments or applications that have the potential to significantly impact exploration results by 2030:
− Drilling Technology
− Nanotechnology
− Computational Technology.
4 Cassiani et al., “Exploration Technology,” Topic Paper, National Petroleum Council Study, Hard Truths: Facing the Hard Truths about Energy, 2007.
“Deepwater Technology” Topic Paper5
y Top Priority Deepwater-Specific Challenges:
− Reservoir Characterization
− Extended System Architecture
− High-Pressure and High-Temperature (HPHT) Completions Systems
− Metocean Forecasting and Systems Analysis.
y Related topics discussed in other reports:
− Subsalt imaging
− Gas to Liquids
− Arctic.
y Other Important Deepwater Technologies Consid-ered:
− Infrastructure life extension
5 Conser et al., “Deepwater,” Topic Paper, National Petroleum Council Study, Hard Truths: Facing the Hard Truths about Energy, 2007.
Figure 1- 23. Annual Oil Production Trend from O�shore Shallow and Deepwater O�shore Outer Continental Shelf
0
100
200
300
400
500
1978 1980 1985 1990 1995 2000 2005 2010
VOLU
ME
(MIL
LIO
NS
OF
BARR
ELS)
YEAR
DEEPWATER GULF OF MEXICO OIL PRODUCTION
SHALLOW WATER GULF OF MEXICO PRODUCTION
Source: Bureau of Ocean Energy Management, Deepwater Gulf of Mexico 2009: Interim Report of 2008 Highlights, OCS Report MMS 2009-016.
Figure 1-23. annual oil production trend from offshore shallow and deepwater outer Continental shelf

Chapter 1 - resourCes and supply 87
− Virtual prototyping
− Unconventional options.
These papers also provided suggestions and options for accelerating development and use of technol-ogy and identified two issues critical to successful development of oil and gas resources in ever-harsher environments. These are: (1) future marine technol-ogy leadership and (2) valuing technology to enable access.
The “Offshore Oil and Gas Supply” topic paper accompanying this report (available on the NPC web-site) evaluates technologies that will enable growth of offshore production for the next 40 years, based on discussion among the Offshore Subgroup mem-bers, colleagues within our respective companies and organizations, as well as extensive literature search, including the 2007 NPC study Hard Truths Technology Topic Papers. To prioritize technologies, two surveys were submitted to professionals in the various key disciplines of geology, geophysics, petro-physics, reservoir engineering, drilling engineering, completion, and production engineering for feed-back. The first survey asked the participants to rate oil and gas production capacity growth challenges and enablers that are included in the 2010 NPC Petroleum Resource Template. The second survey was based on the 2007 NPC Hard Truths topic papers and asked participants for feedback on the previ-ously identified core technologies listed above and any additional ones that would significantly impact growth in production, concluding with a ranking of the technologies. Not surprisingly, the surveys showed that many of the priorities have not changed from the previous topic papers and the differences of note are due primarily to the focus on offshore deep water.
Key changes from the 2007 report include mov-ing Drilling and Computational Technology from the auxiliary level to the core level and the addition of Improved and Enhanced Oil Recovery, where a large target of recoverable remaining oil in place exists. Extended Architecture is central to any discussion on the growth of oil and gas production and is dis-cussed together with including Completions and Digi-tal Fields. High-Pressure High-Temperature (HPHT) Completions Systems certainly remains a key tech-nology category, but in this report will be tackled as HPHT environment in the various core technologies that it impacts. The only technology no longer on the
core list is CSEM. Although that tool can reduce the exploration risk in CSEM-suitable settings, it was not ranked at the level of the other core technologies and would now be included at the auxiliary level. Of final note, a brief update on the status of industry plans for containment is included under the Drilling Technol-ogy section of the “Offshore” topic paper. As such, the updated list of core technologies that will be critical to oil and gas capacity growth offshore are:
y Seismic – Utilization of man-made acoustic waves to image the subsurface geology has been a game changer, allowing industry to unlock the explora-tion potential of the deepwater Gulf of Mexico and optimize the development of discoveries. Tech-nical advances in imaging algorithms, processing flows and acquisition geometries are underway that could make improvements in imaging neces-sary to expand existing and emerging hydrocarbon bearing trends as well as identify new ones.
y Computational Technology – A key enabling technology. While not invented by the oil and gas industry, studies have concluded that this indus-try has propagated digital technologies, altered its management and organization, and changed the way people connect to the data far more than any other industry. The value delivered from the accom-panying technologies in this list would not be pos-sible without it.
y Interpretation Technology – Has played a sig-nificant role in the impact of 3D seismic on success rates. With the adaptation of tools used in other industries, such as medical imaging, interpreters are now able to visualize and interpret data much faster. They are not limited to thinking in 3D, but literally can visualize in 3D, or “climb into” the data set.
y Earth-Systems Modeling – Encompasses geology, hydrology, climatology, and other applied sciences involved in studying the earth as an integrated system. Earth systems modeling joins basin and petroleum system modeling together to quantita-tively model a sedimentary basin’s deposition, ero-sion, and heat flow history together with essential elements of the Petroleum System (source, overbur-den, reservoir, seal) and critical processes (trap for-mation, generation and migration, accumulation, preservation) during the evolution of a sedimen-tary basin.6
6 L. B. Magoon and W. G. Dow, The petroleum system—From source to trap, American Association of Petroleum Geologists Memoir 60, Tulsa, Oklahoma, 1994.

88 prudent deVelopMent: realizing the potential of north america’s abundant natural Gas and oil resources
y Drilling – Industry has come a long way from the days of dropping a heavy bit down the hole to chisel away the soft rock formations. In 1909, the two- cone rotary bit unlocked the full potential of the rotary drilling system, allowing for the efficient drilling of wells in much deeper, harder rock envi-ronments. Further advances followed with direc-tional and horizontal drilling, top drives, and rotary steerable assemblies. The trend for conventional oil and gas discovery has been to drill in environments that were previously inaccessible. Traditionally this means drilling deeper into hotter and higher-pressure zones and to do so in ever more extreme environ-ments such as ultra-deepwater. Historically the only way to access these zones is to get bigger rigs, stronger steel, and more durable tools and there is little reason to believe this trend will not continue. New rigs coming out are capable of drilling in up to 12,000 feet of water and 40,000 feet total depth.
y Subsurface Measurements – At the turn of the 20th century, oil industry pioneers began to search for ways to obtain information about what the drill bit was encountering. This led to devel-opment of core sampling and mud-analysis of the wellbore cuttings (mud logging) that came to the surface. Beginning in 1978, one of the most influential technologies for drilling and subsur-face measurement occurred when Teleco intro-duced the first commercial measurement while drilling (MWD) tool, enabling operators to know the location of their well while drilling. Within a decade, Schlumberger introduced the other criti-cal technology, logging while drilling, or LWD, which allowed geoscientists to get petrophysical measurements, similar to openhole wireline logs, immediately after the bit drilled the formation. This information can then be viewed essentially in real time on the rig and back onshore in the office, allowing for more timely decisions.
y Reservoir Characterization – Involves building a high-resolution geologic model of the reservoir that incorporates characteristics key to reservoir storage and production of hydrocarbons. It con-sists of a geometric description of the boundary surfaces, faults, bedding geometries, and a 3D dis-tribution of reservoir properties such as permeabil-ity and porosity. Robust reservoir characterization is critical to predicting and monitoring the produc-tion behavior in increasingly complex reservoirs with fewer more costly direct well penetrations.
y Extended System Architecture – In shallower water, options for developing the extremities of fields not reachable by directional drilling from an existing platform or where costs would not justify the installation of one or more platforms, drove the development of subsea well systems and their accompanying tiebacks. In deep water, this led to the development of Tension Leg Platforms (TLPs), semi-submersible floaters and spars that act as hubs to collect production from multiple subsea well systems for processing and transportation via pipeline to shore. Today the term extended system architecture applies to the combination of these facilities and includes flow assurance, well control, power distribution, and data communications to improve recovery and extend the reach of produc-tion hubs to remote resources.
y Improved and Enhanced Oil Recovery – Boosting the recovery factor of world’s fields just 1% has the potential to cover three years of worldwide produc-tion. This increased productivity of hydrocarbons is known as Enhanced Oil Recovery (EOR) and Improved Oil Recovery (IOR). Technology for these types of recovery processes is already in place at many fields around the world, with EOR primarily onshore. Techniques for IOR include: waterflood; subsea processing and pumping such as sea floor separation, gas lift, multiphase pumps, and electric submersible pumps; horizontal and multilateral drilling to expose more of the formation or multiple formations to the open hole; improved perforation and stimulation methods; advanced logging proce-dures; and optimal placement of wells.7
y Metocean Forecasting and Systems Analysis – Integrated models to predict both above and below surface “weather” and engineering system response. The ability to characterize and predict the behavior of the oceans is essential for safe conduct of explo-ration and production operations offshore. The ability to predict near term conditions for the seas and currents is necessary to plan and conduct safe drilling and production operations in the marine environment and to respond to any hydrocarbon spill incident.
Key Findings y Oil development and production in the U.S. lower-48 offshore is significant, and the expecta-tion is that a production growth trend will extend
7 S. A. Ali, “Mature Field Revitalization,” Technology Focus: Jour-nal of Petroleum Technology, January 2009.

Chapter 1 - resourCes and supply 89
to the year 2050. The Offshore Subgroup expects offshore oil production to increase to the year 2035 by an average annual growth rate range of 0.2% to 0.9%.
y According to the AEO2011, crude oil production in the U.S. lower-48 offshore is expected to rise up to 2.3 million barrels per day in 2035 in the high oil price case.
y Beginning around 2020 and extending to the year 2050, the bulk of oil production in the U.S. lower-48 offshore is expected to originate from the deep-water Gulf of Mexico, in the emerging Lower Ter-tiary trend and the extension of existing and new trends into areas that are currently poorly imaged. Also, we expect additional impacts on production from increased access to the Pacific, and the Atlan-tic offshore regions.
y Government policies favorable to accessing more U.S. lower-48 offshore lands are needed to allow for the occurrence of the oil and gas development and production growth rates mentioned above.
y A slowdown and a postponement of offshore oil and gas development and production are expected if more stringent operational safety requirements and environmental policies are implemented in the OCS following the Macondo oil spill in the deepwater Gulf of Mexico.
y Technological progress and innovation are the key factors that would enable development and produc-tion of oil and gas in new frontier regions located in deep water and in deeper reservoirs. Most notably, technologies adapted to the high-pressure high-temperature (HPHT) environment, delivery rates, and reduction of drilling costs are the key drivers for the huge oil and gas resources hosted in the Gulf of Mexico Lower Tertiary formations. These formations have potentially greater than 15 billion barrels of recoverable oil reserves, some of which is located in areas of at least 60 miles from the near-est infrastructure. The challenges of this environ-ment cross multiple disciplines and advances in technologies associated with seismic imaging, completion and casing design, subsea production equipment, subsea processing, and high integrity pressure protection systems, while underway, need to continue, if not accelerate. HPHT applications to 10 thousand pounds per square inch (ksi) and 250oF are common in today’s market and the envelope has pushed out to 15 ksi and 400oF, with some limited
gaps. However, now the envelope is being pushed even further to 20–30 ksi and >400oF in the shal-low water gas play of the Lower Tertiary trend.
y Seismic innovative technologies that allow for better imaging of the subsalt horizons in the Gulf of Mexico are pivotal to the expansion of hydro-carbon resources via additional newer discover-ies. These include imaging algorithms, acquisition geometries, and inclusion of more azimuths in pro-cessing and retention of high frequencies.
y An extrapolation of the top 500 supercomputer per-formance lists predicts Exascale computing capabil-ity with a 1,000-fold increase in processing capa-bility within 10 years. With some seismic vendors today approaching the level of computing capability seen with the national computers on the top 500 list, it will be exciting to see what challenges can be conquered with the Exascale computing level, such as near real-time seismic imaging.
y There is a need to reduce drilling costs so that many more exploration wells can be drilled, allowing com-panies to test more concepts and perhaps encour-age more improved and enhanced oil recovery programs. Dual gradient drilling is one such con-cept scheduled to be implemented in the deepwater Gulf of Mexico this year.
y Subsea technology and extended architecture sys-tems will boost production of offshore oil in remote and challenging environments of the deepwater and ultra-deepwater areas, which lack the basic infrastructure needed to produce and to transport the hydrocarbons to shore.
y The offshore field of the future, which we are not far from today, will have multiple satellite fields pro-duced via subsea completions and long tiebacks to hub facilities. The subsea manifolds will be equipped with remote power and communication ability, so remote surveillance and control functions are avail-able at the hub as well as the onshore production center. Smart equipment will be deployed on the seafloor and downhole that will accept commands from the offshore hub or onshore center to improve reservoir production efficiency. Sophisticated mod-els of the reservoir, well, and processing systems will be kept up to date and running online, so surveil-lance is a “manage by exception” process. Field opti-mization will be regularly reviewed and based on analysis so that asset managers can make decisions when opportunities are encountered, instead of pro-ducing to a plan that may be months to years old.

90 prudent deVelopMent: realizing the potential of north america’s abundant natural Gas and oil resources
y There have been significant advances in subsurface measurement over the last decade, but the demand for increased resolution and data will require improved real-time transmission methods. The need to improve downhole fluid characterization and reservoir parameter data for in situ properties, and to monitor wells down-hole for longer periods will be critical to predicting field performance in more challenging environments.
y Improved and enhanced oil recovery techniques could reach an additional 44 billion barrels of oil equivalent left in discovered fields at abandonment. This is based on data from more than 80 fields and 450 reservoirs developed in the Deepwater Gulf of Mexico Research Partnership to Secure Energy for America project 07121-1701, entitled “IOR of the Deepwater Gulf of Mexico.”
y In the U.S. lower-48 offshore, newer geologic plays and trends such as the Lower Tertiary and deeper reservoirs are expected to contribute to current and near future production of crude oil and natural gas.
y Canadian offshore production of oil is lower in com-parison to the U.S. lower-48, and is confined to the eastern shore in Newfoundland and Nova Scotia.
Removal of the imposed and the de facto moratoria will provide better opportunities for increasing off-shore oil development and production in offshore Canada.
Arctic
History and Context
For the purposes of this study, the Arctic is defined as those areas in Alaska, Canada, and Greenland sub-ject to ice and permafrost conditions, rather than sim-ply those areas north of the Arctic Circle. Greenland is included, even though it is a territory of the king-dom of Denmark, as any future oil production from Greenland would very likely be supplied to the U.S. and/or Canadian oil markets. The map in Figure 1-24 shows the areas in Alaska, Canada, and Greenland covered in this portion of the study, within the red dotted line.
The Arctic study area is estimated to contain over 7 billion barrels of discovered undeveloped and over 90 billion barrels of mean, risked, technically recov-erable undiscovered volumes of oil and NGLs. These
LABRADOR- NEWFOUNDLAND
U.S.CANADAGREENLANDSTUDY AREAARCTIC CIRCLEINTERNATIONAL BOUNDARY
BEAUFORT
CHUKCHI
NORTHALASKABERING
SHELF
PACIFIC MARGIN
SOUTH ALASKA
CENTRALALASKA
MACKENZIEDELTA/
CENTRALBEAUFORT
CANADA NORTHONSHORE BASINS
ARCTIC ISLANDS/ SVERDRUP BASIN
EAST CANADA
WEST GREENLAND
EASTGREENLANDRIFT BASINS
NORTH GREENLAND SHEARED MARGIN
Figure 1-24. Arctic Subgroup Study Area
ARCTIC CIRCLE
Sources: Bureau of Ocean Energy Management, Regulation and Enforcement; Canada-Newfoundland O�shore Petroleum Board; IHS Inc.; National Energy Board of Canada; and United States Geological Survey.
Figure 1-24. arctic subgroup study area

Chapter 1 - resourCes and supply 91
volumes are highlighted on the map in Figure 1-25, which indicates their location by basin, and are described in Finding 1 later in this section. Additional information can be found in Topic Paper #1-4, “Arctic Oil and Gas,” available on the NPC website.
Figure 1-26 shows how the crude oil resources described above are distributed among Alaska, Can-ada, and Greenland and highlights the amount of undiscovered oil resources that lie in areas currently under moratoria or otherwise unavailable for leas-ing. These are world-scale resources, which will need to be validated by exploration and development drill-ing activity in order to enable production from the 2025–2050 time frame.
The long history of onshore and offshore oil and gas leasing/licensing and exploration drilling in the Arctic region has resulted in discovery of significant oil and gas reserves, some of which have been devel-oped and produced, most notably the giant oil and gas field at Prudhoe Bay on the Alaska North Slope and the large oil and gas fields (onshore and offshore) in Cook Inlet, Alaska, as well as numerous stranded
discoveries (no development/production facilities or pipelines). Experts expect the region to contain sig-nificant yet-to-be-found volumes, based on numer-ous government agency estimates and supported by industry interest (leasing/licensing, historical 2D seismic and modern but limited 3D seismic, and renewed attempts to secure regulatory permission to drill particularly in the offshore). Most of these volumes are expected to be offshore, beneath the continental shelf.
Following is a brief summary of the development and production history for the most significant of the main Arctic areas under consideration.
North Alaska Onshore
Exploration of this region began in 1909 with dis-covery of active oil seeps in the Cape Simpson area of what is now the Northwest National Petroleum Reserve–Alaska (NPR-A). In 1945, the first explora-tion drilling resulted in non-commercial finds until the discovery of the giant Prudhoe Bay Field in 1968 (15 billion barrels oil and 27 Tcf gas recoverable).
Notes: Discovered undeveloped plus mean risked, technically recoverable, undiscovered volumes by basin. Prospective basins highlighted in green for Alaska, in yellow for Canada, and in blue for Greenland. BBO = billion barrels of oil; BBNGL = billion barrels of natural gas liquids.
ARCTIC CIRCLE
1.30 0.2
0.1
1.70
0.70
16.70.8
15.40.7
9.90.1 9.2
0.2
0.60
4.70
1.40.2
8.98.1
5.90.9
4.80.7
2.70
BBO + BBNGL
BBOBBNGLINTERNATIONAL BOUNDARYDISPUTED ZONE
Figure 1-25. Arctic Oil and Natural Gas Liquids Resources
Figure 1-25. arctic oil and natural Gas liquids resources

92 prudent deVelopMent: realizing the potential of north america’s abundant natural Gas and oil resources
Prudhoe Bay helped drive the construction of the Trans-Alaska Pipeline System (TAPS), completed in 1977, and ushered in a new era of exploration. Over 400 exploration wells have been drilled in this region, mostly in the North Slope Coastal Plain, and have resulted in the discovery of numerous fields, many of which are currently producing. The northern dis-coveries are primarily oil and gas, while the south-ern discoveries are largely non-associated gas with some possibility of oil. Natural gas is not exported due to the lack of a gas pipeline and most of the gas is re-injected back into producing reservoirs to enhance oil recovery. Prospective areas outside the North Slope Coastal Plain (NPR-A, North Slope Foothills, and the Arctic National Wildlife Refuge, 1002 Area [ANWR 1002]) are significantly underexplored.
North Alaska Offshore
Exploration drilling in the federal portion of the Beaufort Sea area began in earnest following the 1968 discovery of the Prudhoe Bay Field (onshore) and the completion of TAPS in 1977. The first offer-ing occurred in a joint federal/state lease sale held
in 1979. This and subsequent OCS lease sales, the most recent of which was held in 2007, have allowed access to waters beyond the three-mile limit. Explor-atory efforts since 1970 (~90,000 miles of 2D seis-mic and 30 exploration wells) have yielded four discoveries that have been deemed capable of pro-duction and have been termed significant discov-eries by BOEMRE and the Alaska Division of Oil & Gas. Three of these discoveries, Hammerhead (Sivul-liq), Sandpiper, and Liberty, are completely in OCS waters but have not yet been developed. The fourth discovery, Northstar, underlying both federal and state waters, has been developed and producing oil since 2001.
With respect to the Chukchi Sea, in the early 1980s, BOEMRE (formerly MMS) determined that this area had a large resource potential and that long-term oil pricing would support exploration and develop-ment. BOEMRE held the first lease sale (Sale 109) covering this prospective area in 1988, offering more than 25 million acres. Industry drilled five explora-tion wells from 1989 to 1991, and demonstrated a working petroleum system with strong affinities to
Figure 1-26. Split of Arctic Oil Potential (not Including Natural Gas Liquids)
Note: Discovered undeveloped plus undiscovered (mean risked, technically recoverable).
GREENLANDAVAILABLE 17%
CANADAAVAILABLE
20%
ALASKAAVAILABLE
37%
ALASKAMORATORIA
AREA 13%
ALASKA POTENTIALLY AVAILABLE FOR LEASE 4%
CANADAUNAVAILABLE 6%
GREENLANDUNAVAILABLE 2%
ALASKA'S TOTAL SHARE 55%
CANADA'S TOTAL SHARE 26%
GREENLAND'STOTAL SHARE
19%
Figure 1-26. split of arctic oil potential (not Including natural Gas liquids)

Chapter 1 - resourCes and supply 93
the North Slope and Beaufort Sea regions. Four of the five wells contained reservoirs with oil and gas “pay,” as defined by BOEMRE, and the fifth well-demonstrated oil and gas shows. These wells were drilled 60 miles or more off of the coast in water depths ranging from 137 to 152 feet. Although none of the prospects were deemed commercial at the time, existence of a working petroleum system was demonstrated.
Canadian North
In the Canadian North, oil and gas exploration dates back to the recognition of oil seeps in the 1700s and the 1920 discovery of the Norman Wells oil field (0.3 billion barrels oil recoverable). The late 1940s and 1950s saw increased exploration in the southern portion of the Northwest Territories. Exploration then moved northward above the Arc-tic Circle, first into the Mackenzie Delta in 1960, then the Arctic Islands and Sverdrup Basin in 1961 and the Canadian Beaufort Offshore in 1972. Many significant oil and gas fields (Parsons Lake, Taglu, Niglintgak, Drake Point, Adlartok, Tarsiut, Issung-nak, Amauligak, and Kopanoar accumulations) were found. These discoveries were the result of an exten-sive exploration effort that resulted in 213 wells drilled in the onshore Mackenzie Delta, 174 wells in the Arctic Islands/Sverdrup Basin, and 87 wells in the offshore Canadian Beaufort. Drilling activ-ity in these areas subsided in the late 1980s, but high global energy prices in 2004–2008 combined with the proven occurrence of oil and gas renewed industry’s interest in this region. Canadian Beau-fort licensing rounds in 2007–2010 drew significant industry interest. Six exploration licenses covering three million acres were issued to ExxonMobil/Impe-rial, BP, ConocoPhillips, and Chevron for working commitment of 1.89 billion Canadian dollars. Explo-ration activities commenced in 2008-2009 with the acquisition of 3D seismic data and exploratory drill-ing may commence as soon as 2014.
Canadian East
The Labrador-Newfoundland Shelf region offshore is one of two promising areas within the Canadian East. It contains the Saglek, Hopedale, Hawke, Orphan, Jeanne d’Arc, and Flemish Pass offshore basins. These basins reside along the Continen-tal margin in water depths ranging from less than 100 meters to greater than 3,000 meters. Explora-
tion in this offshore region began in 1966. Wildcat drilling started in 1971 and continued through 1984. Discoveries along the Newfoundland portion of this margin yielded significant oil and gas reserves in the Jeanne d’Arc Basin including the giant Hiber-nia (1979), Hebron/Ben Nevis (1981), Terra Nova (1983), and White Rose (1984) fields. Development of the Hibernia field, as well as the Terra Nova and White Rose fields, has resulted in the cumulative production of 1 billion barrels of oil as of 2009 and development of Hebron/Ben Nevis is planned. In 2004, a second wave of licensing and exploratory drilling began in this region in the Flemish Pass and Orphan Basin areas. Several wells have been drilled with an announced discovery in the Flemish Pass area. Another promising area, described below, is the Canadian portion of the Baffin Bay region, an area shared with Greenland.
Greenland
The West Greenland-East Canada Province includes the offshore region of eastern Canada and western Greenland from approximately latitude 63° north to 80° north. Oil seeps have been sampled and described from Nuussuaq Peninsula, Disco Island, and Fossilik outcrops on the west coast of Greenland and have been reported at Scott Inlet on the Canadian side. Thirteen exploration wells (three wells on the Cana-dian and ten on the Greenland side) have been drilled in this area and several have demonstrated the pres-ence of hydrocarbons. Licensing of numerous tracts has continued on the Greenland portion of the basin with the most recent licenses being awarded in 2010. Cairn Oil drilled three exploration wells on their offshore licenses in 2010 and announced that two wells had encountered thermal gas and that one well encountered oil. Cairn has returned to this region in 2011, and is currently drilling additional exploration wells on their licenses.
The East Greenland Rift Basin also looks very prom-ising, based on a recent USGS assessment. Greenland intends to hold the first licensing round for this off-shore region in 2012. Licenses in this region will fea-ture a 16-year term.
Technology
Hydrocarbon resources identified in the Arctic region are mainly conventional oil and gas for which exploration, appraisal, and production technologies

94 prudent deVelopMent: realizing the potential of north america’s abundant natural Gas and oil resources
are well understood and widely available for regions residing in shallow water (less than 100 meters) and those areas not impacted by significant icebergs (such as the continental shelves of the Alaska OCS and the Canadian Beaufort and Grand Banks region). Technology has not been a limiting factor in the development of the Alaska North Slope, (both onshore and in State waters), in Cook Inlet in southern Alaska (onshore and offshore), offshore on the Newfound-land-Labrador shelf, and for exploration activity in the Chukchi and Beaufort Seas and offshore Green-land. In the Arctic, however, as in other regions, the deployment of technology particularly needs to take into account the protection of sensitive ecosystems from an environmental standpoint.
Awareness of environmental imperatives has led to significant technological advances by the oil indus-try, in order to achieve safe resource extraction with minimal disturbance to the environment. To cite two examples among many: the oil and gas indus-try developed the Rolligon that allows heavy loads to be carried across the Arctic tundra with minimal ground pressure and disturbance; and horizontal- and extended-reach drilling technology that makes it possible to drill multiple wells from a single pad at less cost and with a smaller environmental footprint than the traditional multiple pad approach.
The certainty that technology and related practices to prevent and mitigate environmental risks associ-ated with the Arctic will continue to be enhanced led the Arctic Subgroup to conclude that technology is not likely to limit onshore or offshore exploration and development, except in regions where water depths exceed 100 meters or where significant iceberg management is necessary. Near-term advances in offshore pipeline trenching will be important across the Arctic, especially in deepwater conditions (over 100 meters of water depth) such as the Continental Slope region of the Canadian Beaufort, Labrador, or Greenland. Advances in iceberg management will also be important for Greenland and portions of the Cana-dian Atlantic offshore. The history of the region indi-cates that innovation will continue as new challenges are identified. There are many Arctic producing fields on land today, and safe development and production of offshore Arctic reserves has occurred since the late 1960s (Cook Inlet and Northstar Field, Alaska; Hiber-nia, Canada; and Sakhalin, Russia) demonstrating that resource extraction can occur in the midst of sen-sitive ecosystems.
Since the Arctic region is primarily defined by harsh ice conditions that affect drilling operations and envi-ronmental risk management, the Arctic Subgroup undertook an assessment of the severity and impact of ice conditions across the various Arctic basins stud-ied here. The study draws on the experience of over 450 existing wells offshore in the western Arctic, as seen in Figure 1-27.
Offshore basins where this activity has taken place experience all three dominant types of ice conditions (land-fast ice, pack ice, and icebergs). Table 1-5 sum-marizes the key characteristics of each basin. Ice conditions impact most aspects of exploration and development activities and technology, including seismic acquisition, drilling equipment, well design, and support fleet (including oil spill response capa-bilities). The study team used these parameters to develop a comparison across all Arctic basins, including those located north of Norway and Russia, of the technology and development challenges asso-ciated with ice-regime impacts. This comparison is summarized in Figure 1-27.
Figure 1-28 illustrates the wide range of technical and operational challenges that are present through-out the major global Arctic basins. This assessment shows that these challenges have been met at both the exploration and development phase.
Arctic offshore exploration is centered in North America and the industry has demonstrated its ability to function through the full range of Arctic operating conditions with more than 450 existing off-shore wells. Experience in the Arctic spans a period from the 1960s to the present day, and so it comes as no surprise – though for many in the general public it may – that industry has accomplished a wealth of successful operating experience in diverse Arctic off-shore conditions. The strength of experience gained in challenging operating environments such as in the Canadian Beaufort Sea and the Labrador Sea (Canada) should build confidence that industry has the tools, procedures, and know-how to operate safely throughout the offshore Arctic.
Arctic offshore production history reflects the same level of success as demonstrated through the drilling of over 450 exploration wells. While this screening assessment only cites major production centers such as the Grand Banks (Canada) and Sakhalin (Russia), there are other examples such as the Cook Inlet region (south Alaska) and the various near-shore production

Chapter 1 - resourCes and supply 95
12 3
4
5
6
7
1
2
3
4
5
6
7
CHUKCHI SEA – 5 WELLS
U.S. BEAUFORT SEA – 58 WELLS
CANADIAN BEAUFORT SEA – 89 WELLS
CANADIAN ARCTIC ISLANDS – 160 WELLS
LABRADOR – 29 WELLS
GRAND BANKS – 129 WELLS
SOUTHWEST GREENLAND – 6 WELLS
~450 ARCTIC OFFSHORE WELLS
Figure 1-27. Wells Drilled in the O�shore Arctic
5
58
89
16029
129
6
Figure 1-27. Wells drilled in the offshore arctic
Figure 1-28. Ice Regime Development Comparison
BARENTSSEA
GRANDBANKS
SWGREENLAND
KARASEA
CHUKCHISEA
SAKHALIN LAPTEVSEA
LABRADOR BEAUFORTSEA
NWGREENLAND
NEGREENLAND
INCREASING DEGREE OF DIFFICULTY
Notes: Signi�cant levels of oil and gas production are already being produced from Arctic basins such as the Grand Banks (Canada) and Sakhalin (Russia) in both pack ice and pack ice/iceberg operating environments. Signi�cant operating experience has been successfully gained in several of the more challenging Arctic basins (i.e., U.S. Chukchi and Beaufort, ~35 wells in open water to pack ice; Canadian Beaufort, ~90 o�shore wells in both open water and pack ice; and Labrador, ~30 o�shore wells in pack ice and pack ice/iceberg operating environments. A strong history of successful exploration and production operations across a wide range of Arctic operating conditions and challenges has demonstrated that industry can explore and develop oil and gas safely in the Arctic.
Figure 1-28. Ice regime development Comparison

96 prudent deVelopMent: realizing the potential of north america’s abundant natural Gas and oil resources
Tabl
e 1-
5. s
elec
ted
Char
acte
ristic
s of
offs
hore
arc
tic B
asin
s
U.S
. Chu
kchi
U.S
. Be
aufo
rtCa
nadi
an
Beau
fort
Labr
ador
Gra
nd
Bank
sSW
G
reen
land
NW
G
reen
land
NE
Gre
enla
nd
Sign
ifica
nt W
ave
Hei
ght,
A
nnua
l Max
(m)
63.
53.
511
.411
.77
7.9
5
Max
Wat
er D
epth
of
Leas
e A
reas
(m)
5010
01,
500
1,00
015
01,
100
1,00
050
0
Ope
n W
ater
Sea
son
Mid
-Jun
e–
early
nov
.M
id-J
uly–
ea
rly o
ctM
id-J
uly –
ea
rly o
ctJu
ly–d
ecu
sual
ly
year
rou
ndu
sual
ly
year
rou
ndla
te Ju
ly–
Mid
-oct
.ye
ar-r
ound
Ic
e pr
esen
ce
Nea
r-sh
ore
Land
-Fas
t Ice
–
Pres
ent?
yes
yes
yes
yes
no
yes
yes
yes
Pack
Ice
– Pr
esen
t?ye
sye
sye
sye
sye
s,
occ
asio
nal
yes,
o
ccas
iona
l ye
sye
s
Firs
t-Ye
ar L
evel
Ice
Thic
knes
s,
Ave
rage
Ann
ual M
ax (m
)1.
42
21.
51.
21.
21.
62
Firs
t-Ye
ar K
eel D
raft
Dep
ths,
A
vera
ge A
nnua
l Max
(m)
1030
258
56
825
Mul
ti-Y
ear L
evel
Ice
Thic
knes
s,
Ave
rage
Ann
ual M
ax (m
)4
66
51.
5n
a5
6
Mul
ti-Y
ear K
eel D
raft
Dep
ths,
A
vera
ge A
nnua
l Max
(m)
830
3010
1030
Iceb
ergs
, Tim
e of
Yea
r
rare
Ice
Isla
nds
+ Fr
agm
ents
Ju
ne–o
ct
rare
Ice
Isla
nds
+ Fr
agm
ents
Ju
ly–o
ct
rare
Ice
Isla
nds
+ Fr
agm
ents
Ju
ly–o
ct
Iceb
ergs
a
ll ye
arIc
eber
gs
apr
il–Ju
lyIc
eber
gs
all
year
Iceb
ergs
a
ll ye
arIc
eber
gs
all
year
Iceb
ergs
– F
requ
ency
Very
rar
eVe
ry r
are
Very
rar
eM
oder
ate
low
Mod
erat
eVe
ry h
igh
Mod
erat
e
Typi
cal M
ax G
ouge
Dep
th
Belo
w S
eabe
d (m
)0.
5–2.
5 0.
5–3
2–5
2–7
1-2
2–4
3–8
3–7
Max
Wat
er D
epth
at M
ax G
ouge
D
epth
Bel
ow S
eabe
d (m
)50
5050
250
150
250
300
200

Chapter 1 - resourCes and supply 97
facilities along the U.S. Beaufort Sea coastline (North-star). These projects have demonstrated the ability for industry to design production facilities in keep-ing with the regulatory and environmental challenges that existed in these areas, and thus allow the safe and efficient production of oil and gas reserves from the Arctic offshore.
Fifty years of oil and gas development history in the offshore Arctic marks a period of continuous improve-ment and development that has guided safe, success-ful Arctic operations in all the major Arctic offshore ice environments. Offshore Arctic operating capabil-ity is a North American success story that is poorly understood and appreciated, despite the fact that it has been ongoing for over half a century.
Potential Production Pathways
Given that no overall North American Arctic sup-ply outlooks could be found in the public domain (although there are a few basin-specific analyses for portions of Alaska and the Canadian Arctic), the Arc-tic Subgroup developed three consensus cases: Rea-sonably Constrained, Most Likely, and Reasonably Unconstrained (Table 1-6). The adjective “reason-ably” is used with care; it does not imply that all con-straints are either turned on or turned off at either end of the scale. These cases represent the Subgroup’s informed view of what may happen to Arctic develop-ment through 2050, given economic, regulatory, and environmental constraints that either are less or more favorable to such development.
The three cases each outline a different production scenario for major current or future developments. Large, remote severely stranded resources (e.g., Cana-dian Arctic Islands, NE Greenland Rift Basin, etc.) are not included.
The most likely production outlook for the Arctic indicates a 2035 production potential of 0.77 million barrels per day (282.5 million barrels per year). This includes a normal decline of current Alaska North Slope production to 0.28 million barrels per day, augmented by new discoveries on the North Slope, in the Chukchi and Beaufort Seas, and in Alaska state waters, totaling 0.3 million barrels per day. Arctic Canada would provide a further 0.2 million barrels per day, split between Grand Banks production and new discoveries in the Canadian Beaufort and Mack-enzie Delta areas.
The constrained case outlook assumes that new exploration activity would not occur because of a variety of restrictions on access and permitting, and the only remaining production would be from currently producing fields that will be in decline over this period. Total remaining production in 2035 would be just 0.33 million barrels per day (120 million barrels per year), split between the Alaska North Slope (if the TAPS pipeline is still in operation) and the Grand Banks area of Canada. Fur-ther declines post-2035 would ultimately lead to the closure of the TAPS oil pipeline as available supply falls below the assumed operational minimum vol-umes of about 200 thousand barrels per day. It is
Table 1-6. three potential arctic oil production pathways
Reasonably Constrained Case
Most Likely Case Reasonably Unconstrained Case
no Chukchi, Beaufort oCs, or Canadian Beaufort production
north alaska onshore, Chukchi and Beaufort oCs, and Canadian Beaufort production; 15% resource developed by 2050
north alaska onshore, Chukchi and Beaufort oCs, and Canadian Beaufort production; 25% resource developed by 2050
trans-alaska pipeline system (taps) offline 2030+/-
taps ~300 thousand barrels per day taps ~500 thousand barrels per day
Grand Banks oil current decline only hebron developed
Grand Banks oil slow decline few satellites developed
Grand Banks flat oil production
no east Canada “Baffin Bay” or West Greenland oil
no east Canada “Baffin Bay” or West Greenland oil
east Canada “Baffin Bay” and West Greenland oil; 10% resource developed by 2050

98 prudent deVelopMent: realizing the potential of north america’s abundant natural Gas and oil resources
estimated that this could occur around 2045, making any subsequent development reliant on new infra-structure.
In the upside case, with a higher level of resource development in the new offshore areas of the Arctic, particularly offshore the Alaska North Slope, total production by 2035 could be as high as 0.88 million barrels per day (322 million barrels per year). Half a million barrels per day of this could come from high potential developments in the Beaufort and Chukchi seas.
It should be noted that the Arctic Subgroup’s oil production forecast for Alaska may be conservative, as compared to a published analysis by Northern Eco-nomics that suggests the U.S. Beaufort and Chukchi OCS regions are capable of significant production, collectively exceeding 1.0 million barrels per day (~399 million barrels per year) in 2035 (Table 1-7 and Figures 1-29 and 1-30), if the undiscovered hydro-carbon resource assessment reported by BOEMRE is validated by future exploration and appraisal drilling.
Key Findings and Recommendations
This section summarizes the main findings and recommendations of the Arctic Subgroup and applies primarily to the U.S. Arctic.
Despite its remoteness and harsh operating condi-tions, safe development of the Arctic region is pos-sible and essential for meeting U.S. energy goals. Finding 1 describes the huge portion of America’s energy that resides in the Alaskan Arctic, but explo-ration needs to occur now in order to arrest the pro-duction decline that could threaten viability of the existing Trans-Alaska Pipeline for crude oil. Findings 2 and 4 note that the limiting factor in recovery of the Arctic’s vast energy resources is not necessar-ily technology, but rather regulatory uncertainty and risk of litigation from groups opposing drilling and development activity (especially in the United States). Finding 3 describes specific U.S. challenges associated with carrying out an effective and safe exploration and appraisal program in the Arctic, given the present 10-year lease terms, since only 70–105 days (offshore) and 70–150 days (onshore) are realis-tically available for such activities each calendar year. Other findings discuss the impact of the Jones Act, lack of infrastructure, and how the United States is falling behind other nations.
This study supports the idea that action by the U.S. federal government is warranted, if these critical resources are to be validated and safely developed in a prudent manner for America’s benefit. Or, to put it in more specific terms, the main consequence com-mon to the majority of the following findings and recommendations is that the huge resource base, as described by the U.S. Geological Survey, Bureau of Ocean Energy Management, Regulation and Enforce-ment, National Energy Board of Canada, Geological Survey of Canada, and the various State and Pro-vincial government resource agencies for the North American Arctic region, will not be available when needed in the 2025–2050 time frame or afterwards if the status quo is maintained.
Finding 1: The North American Arctic (United States, Canada, and Greenland) has a large (world scale) discovered undeveloped hydrocarbon resource base (6.4 billion barrels oil, 0.9 billion barrels natu-ral gas liquids, and 73 Tcf gas)8 and a very large undiscovered resource base (80.1 billion barrels oil, 11.1 billion barrels natural gas liquids, and 595 Tcf gas).9 Development lead times are very long (histori-cally, 10 to 20 years or longer from discovery to first production).10
Recommendation 1: To ensure the future energy security of the United States, near- and medium-term exploration drilling by industry should be promoted by the U.S. government to validate the resource esti-mates and identify the most promising regions.
Finding 2: Exploration and development technol-ogy, both onshore and offshore, is not expected to be a limiting factor in future development of conven-tional U.S. Arctic resources, within the time frame of this study. Areas for further innovation and tech-nological advances will be required in areas where water depths exceed 100 meters or regions that require iceberg management capability (Greenland).
8 Mean, discovered, technically recoverable volume estimate. These discovered volumes are remote to existing development and production infrastructure. References for all quoted vol-umes cited in Sections IV, V, VI, and VII of Topic Paper #1-4, “Arctic Oil and Gas.”
9 Mean, risked, technically recoverable, undiscovered, yet-to-find volumes. References for all quoted volumes cited in Sections IV, V, VI, and VII of the “Arctic” topic paper.
10 Thomas et al., “Alaska North Slope Oil and Gas: A Promis-ing Future or an Area in Decline? Addendum Report,” 267 p, U.S. DOE/NETL/Arctic Energy Office, April 2009. Tables 2.5 and 2.6.

Chapter 1 - resourCes and supply 99
Table 1-7. summary of alaska oCs development scenarios and oil and Gas production Forecasts
Beaufort Chukchi North Aleutian Total
Resource Size (Mean)
oil and condensates (billion barrels) 5.97 8.38 0.71 15.06
Gas (trillion cubic feet) 15.94 34.43 7.65 58.02
Exploration
exploration/delineation Wells 47 43 10 100
exploration rig seasons 31 27 8 66
Development
no. of offshore production platforms 7 4 2 13
offshore/onshore pipelines (miles) 235 680 300 1,215
Shore Bases/Facilities
Marine terminal yes yes yes
liquefied natural Gas (lnG) Facility no no yes
production Facility yes yes yes
support Base yes yes yes
Production
year 1st oil Flows 2019 2022 2021
year 1st Gas Flows 2029 2036 2022
no. of producing Fields 7 4 2 13
Total Cumulative Volume Produced (through 2057)
oil & Gas (billion barrels of oil equivalent) 6.34 6.16 1.29 13.69
oil & Condensates (billion barrels) 5.10 4.79 0.39 10.18
Gas (trillion cubic feet) 6.96 7.78 5.08 19.82
Daily Peak Production
oil & Condensates (barrels per day) 1,165,707 565,472 105,074
Gas (million cubic feet per day) 883 1,421 661
note: northern economics’ resource size estimates are from the 2006 Minerals Management service resource assessment. the numbers shown in the table are the mean undiscovered economically recoverable resource estimates, assuming resource commodity prices of $60 per barrel of oil and $9.07 per thousand cubic feet of natural gas.
source: northern economics in association with the Institute of social and economic research, university of alaska, economic analysis of Future offshore oil and Gas development: Beaufort sea, Chukchi sea, and north aleutian Basin, prepared for shell exploration and production, March 2009.

100 prudent deVelopMent: realizing the potential of north america’s abundant natural Gas and oil resources
Figure 1-29. U.S. Beaufort Sea Outer Continental Shelf Production Forecast
0
200
400
600
800
1,000
YEAR
BARR
ELS
OF
OIL
AN
D C
ON
DEN
SATE
PER
DAY
(TH
OU
SAN
DS)
0
200
400
600
800
1,000
MIL
LIO
N C
UBI
C FE
ET O
F G
AS
PER
DAY
OIL AND CONDENSATE GAS
Source: Northern Economics, Inc. estimates based in part on Minerals Management Service (MMS) scenarios in Beaufort Sea Planning Area Oil and Gas Lease Sales 186, 195, and 202: Final Environmental Impact Statement. OCS EIS/EA MMS 2003-01, February 2003.
2017 2022 2026 2030 2034 2038 2042 2046 2050 2054 2058
Figure 1-30. U.S. Chukchi Sea Outer Continental Shelf Production Forecast
0
200
400
600
2017 2022 2026 2030 2034 2038 2042 2046 2050 2054 2058YEAR
BARR
ELS
OF
OIL
AN
D C
ON
DEN
SATE
PER
DAY
(T
HO
USA
ND
S)
0
400
800
1,200
1,600
MIL
LIO
N C
UBI
C FE
ET O
F G
AS
PER
DAY
Source: Northern Economics, Inc. estimates based in part on Minerals Management Service (MMS) scenarios in Chukchi Sea Planning Area, Oil and Gas Lease Sale 193 and Seismic Surveying Activities in the Chukchi Sea: Final Environmental Impact Statement. Volume I: Executive Summary, Sections I through VI. OCS EIS/EA MMS 2007-026.
OIL
GAS
Figure 1-29. u.s. Beaufort sea outer Continental shelf production Forecast
Figure 1-30. u.s. Chukchi sea outer Continental shelf production Forecast

Chapter 1 - resourCes and supply 101
There are numerous Arctic producing fields on land and safe development and production of offshore Arctic reserves has occurred globally since the late 1960s, which collectively demonstrates that resource extraction can occur in the midst of sensitive eco-systems. Innovation will continue as new challenges are identified.
Recommendation 2: Industry has always risen to the challenge, and if allowed, they will continue to advance elements of Arctic exploration and develop-ment technology to reduce the operational footprint and safely produce oil and gas. We recommend a reasonable set of policies and regulations that allow industry to continue prudent exploration and devel-opment in the Arctic and to proceed with technology advances. Near-term advances in offshore pipeline trenching will be important across the Arctic espe-cially in prospective regions with deepwater condi-tions (>100 meters) such as the Continental Slope region of the Canadian Beaufort or Greenland. Advances in iceberg management will also be impor-tant for Greenland and portions of the Canadian Atlantic offshore.
Finding 3: The existing 10-year lease terms are not long enough to ensure sustained exploration and appraisal of material Arctic oil and gas resources in the U.S. Arctic basins. Infrequent lease sales, lengthy, multifaceted permitting procedures, a high incidence of litigation and a required sequential set of data-gathering and permitting activities coupled with short drilling windows (onshore winter and offshore summer) reduce the ability to identify, appraise, and develop economic volumes in this short time span.
Recommendation 3: Adopt a licensing system for Alaska that is similar to, but improves upon, Canada or Greenland’s system in recognition of the limited seasonal operating period, particularly for the U.S. federal offshore areas (70–105 days per year). Can-ada offers large tracts (versus 3-square mile blocks) with a work commitment bid that covers 9 years if a well is drilled within the first 5 years (still problem-atic and should be extended given the challenges of the Arctic and the new regulatory requirements), and is extended indefinitely if producible hydrocarbons are discovered on the tract. Greenland offers similar-sized tracts and exploration terms and is extending the initial license term to 16 years for its NE Green-land offshore round that will be held in 2012.
Finding 4: There is no clear, dependable, regulatory path for gaining approval of submitted exploration or development permit applications. This is due to a multitude of U.S. government agencies/regula-tory bodies that have overlapping authority, and each have their own independent permit review and approval schedule.
Recommendation 4: Streamline regulatory per-mitting processes and promote collaboration and coordination of the numerous federal agencies/ regulatory bodies, to avoid redundant analyses and jurisdictional overreach. A coordinated approach would provide predictable project scheduling and a more efficient use of human resources within the fed-eral government and industry.
Finding 5: The Merchant Marine Act of 1920 (the Jones Act, codified in 2006) was established to regu-late cabotage (the coastal shipping of cargo and pas-sengers) within the United States. The Act requires cabotage in U.S.-flagged, constructed, owned and operated vessels. The Jones Act rules on tankers and support vessels mandate largely unavailable and uncompetitively priced ships, unduly increasing the cost of operations in the U.S. Arctic. Few U.S.-flagged, ice-classed vessels are available for U.S. Arctic off-shore operations, so either exemptions are required to allow the use of foreign-flagged vessels that are able to meet U.S. Arctic shipping standards, or excessive delays and costs (three times the capital and operat-ing expense dollars to build and operate a U.S.-flagged fleet) will be incurred to comply with this statute.
Recommendation 5: Continue to provide exemp-tions to the Jones Act for the non-U.S.-flagged, ice-class vessels used in U.S. Arctic exploration and appraisal operations. This will ensure that ice-class vessels are available at competitive rates given the long lead times required for Arctic offshore operations.
Finding 6: Alaska Coastal communities only receive tax revenue from onshore facilities related to oil and gas development in the onshore and State waters areas of Alaska, which leads to local opposi-tion of OCS exploration and development in the U.S. Arctic.
Recommendation 6: The U.S. should consider a federal revenue sharing program for the Alaska state and local coastal governments of potentially impacted communities, perhaps initiating a program similar in

102 prudent deVelopMent: realizing the potential of north america’s abundant natural Gas and oil resources
mechanism to the Gulf of Mexico Energy Security Act in which 37.5% of the revenue from new Gulf of Mexico leases after 2007 is distributed to local coastal political subdivisions.11
Finding 7: Oil tanker transport from the Arctic to consumer markets is currently a viable export method. Year-round tankering of crude oil from the Arctic to market will likely be a viable cost-effective alternative to pipeline transport in the future. Tankering offers greater flexibility of evacuating crude oil from mul-tiple onshore or offshore development facilities than new pipelines. Lower transport costs increase the economic viability of projects, and therefore, increase the production potential.
Recommendation 7: Prepare for this transporta-tion option in the future. The United States needs to catch up with, and then expand, technological advances, which when combined with the possibility of more open seas later within the time frame of this study, will provide for America’s energy needs. In the long term, America may lose the TAPS due to dimin-ishing flow (2030 to 2045 time frame) unless immedi-ate efforts are made to find and develop more oilfields to stem the decline in oil production and maintain adequate flow in the pipeline. Failure to act will result in the loss or serious deferment of any oil potential until well beyond the 2050 horizon.
Onshore Oil
Development and Production: History and Context
U.S. Lower-48 Onshore
In 2010, the U.S. lower-48 onshore produced 3.1 million barrels of crude oil and condensate per day, or about 56% of total U.S. oil production. Between 1990 and 2005, production declined at about 4% per year. Starting about 2004, higher oil prices incen-tivized higher levels of investment activity and pro-duction subsequently flattened and then increased somewhat. In some regions, enhanced oil recovery technologies (also known as tertiary recovery or EOR), particularly steam-injection and gas-injection, have maintained oil production rates in mature fields
11 Bureau of Ocean Energy Management, Regulation and Enforcement, “Gulf of Mexico Eneregy Security Act,” http://www.boemre.gov/offshore/GOMESARevenueSharing.htm.
at levels higher than would have otherwise occurred. Figure 1-31 illustrates the total production trend and contribution of EOR projects.
The outlook for future oil production in the lower-48 onshore region is dependent upon both primary and EOR resource development. Expanded oil pro-duction from oil-bearing shale and low permeability formations, especially those not yet under develop-ment, is critical to mitigating the general decline in onshore production. The development and applica-tion of advanced EOR technologies to mature fields enables the extension of field economic life with mini-mal exploration risk, adding additional supply at the margin.
Although the onshore segment accounts for only 36% of 2010 U.S. oil production, it accounts for only 52% of the traditional U.S. oil resource base. The onshore lower-48 is estimated to hold only 14% of total U.S. undiscovered oil resources, with the remaining 86% located in Alaska, the U.S. offshore, and unconventional (tight oil) reservoirs. These esti-mates, summarized by region in Table 1-8, illustrate the exploration maturity of the conventional onshore relative to other segments of supply.
About one quarter of the onshore lower-48 resource base consists of undiscovered oil resources, indicat-ing that the onshore lower-48 resource base has been largely discovered and produced. Total U.S. oil pro-duction peaked in 1970 at 9.6 million barrels per day, which at that time came mostly from onshore lower-48 oil fields. Thus, future oil production in the lower-48 onshore region will depend heavily on the degree to which oil can be recovered from existing and aban-doned oil fields. Further recovery of oil from these fields will largely depend upon the economic viability of incremental development and enhanced oil recov-ery, which are driven by oil price, technology, and regulatory policy.
Table 1-8 estimates do not include potentially pro-ducible oil resources that exist below the oil-water-contact point where a formation holds mostly oil and a little water to a deeper layer holding mostly water and little oil. These deeper zones are called “oil-to-water transition zones” and “residual oil zones.” Residual oil zones (ROZ) have not had a long history of production testing at a commercial scale (nine are in ongoing field tests), but have physical proper-ties similar to oil-bearing zones that have been pro-duced through primary and secondary techniques.
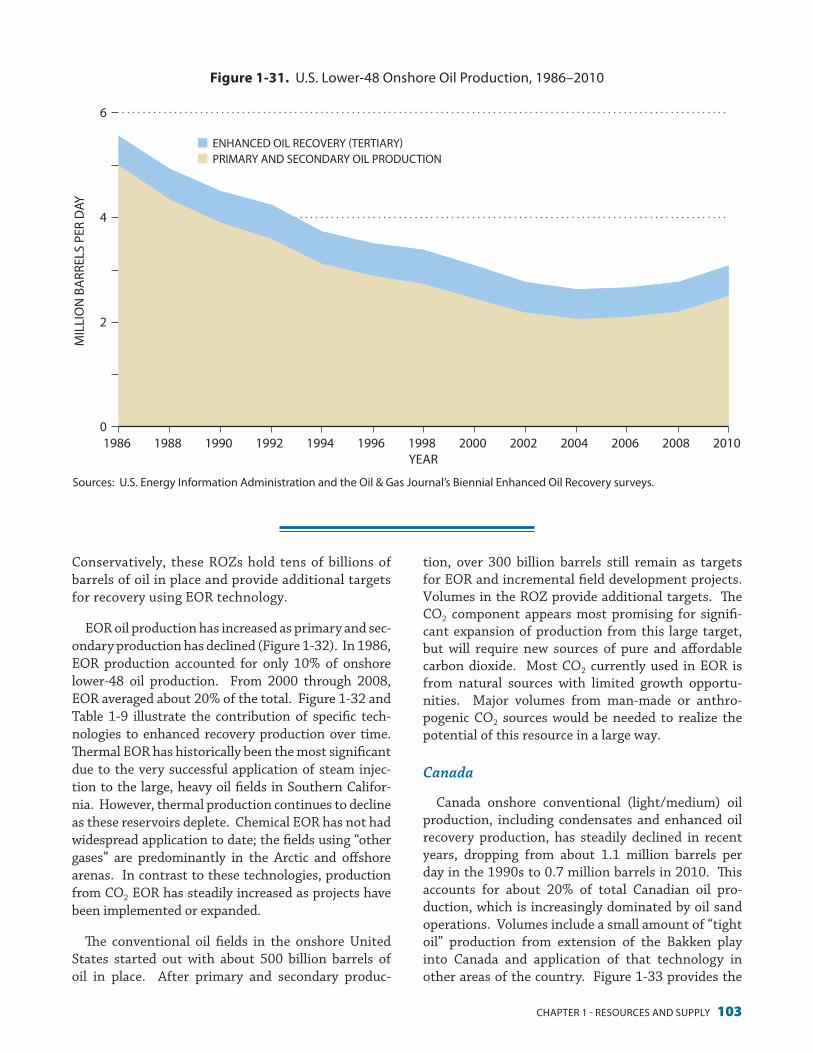
Chapter 1 - resourCes and supply 103
Conservatively, these ROZs hold tens of billions of barrels of oil in place and provide additional targets for recovery using EOR technology.
EOR oil production has increased as primary and sec-ondary production has declined (Figure 1-32). In 1986, EOR production accounted for only 10% of onshore lower-48 oil production. From 2000 through 2008, EOR averaged about 20% of the total. Figure 1-32 and Table 1-9 illustrate the contribution of specific tech-nologies to enhanced recovery production over time. Thermal EOR has historically been the most significant due to the very successful application of steam injec-tion to the large, heavy oil fields in Southern Califor-nia. However, thermal production continues to decline as these reservoirs deplete. Chemical EOR has not had widespread application to date; the fields using “other gases” are predominantly in the Arctic and offshore arenas. In contrast to these technologies, production from CO2 EOR has steadily increased as projects have been implemented or expanded.
The conventional oil fields in the onshore United States started out with about 500 billion barrels of oil in place. After primary and secondary produc-
tion, over 300 billion barrels still remain as targets for EOR and incremental field development projects. Volumes in the ROZ provide additional targets. The CO2 component appears most promising for signifi-cant expansion of production from this large target, but will require new sources of pure and affordable carbon dioxide. Most CO2 currently used in EOR is from natural sources with limited growth opportu-nities. Major volumes from man-made or anthro-pogenic CO2 sources would be needed to realize the potential of this resource in a large way.
Canada
Canada onshore conventional (light/medium) oil production, including condensates and enhanced oil recovery production, has steadily declined in recent years, dropping from about 1.1 million barrels per day in the 1990s to 0.7 million barrels in 2010. This accounts for about 20% of total Canadian oil pro-duction, which is increasingly dominated by oil sand operations. Volumes include a small amount of “tight oil” production from extension of the Bakken play into Canada and application of that technology in other areas of the country. Figure 1-33 provides the
Figure 1-31. U.S. Lower-48 Onshore Oil Production, 1986–2010
0
2
4
6
1986 1988 1990 1992 1994 1996 1998 2000 2002 2004 2006 2008 2010
MIL
LIO
N B
ARR
ELS
PER
DAY
YEAR
ENHANCED OIL RECOVERY (TERTIARY) PRIMARY AND SECONDARY OIL PRODUCTION
Sources: U.S. Energy Information Administration and the Oil & Gas Journal’s Biennial Enhanced Oil Recovery surveys.
Figure 1-31. u.s. lower-48 onshore oil production, 1986–2010

104 prudent deVelopMent: realizing the potential of north america’s abundant natural Gas and oil resources
recent historical trend and a projection indicating few changes are expected in the components of this sup-ply area.
Light/medium crude oil resources remain concen-trated in the traditional producing provinces in west-ern Canada with potential reserves estimated in the range of 7 to 8 billion barrels (Table 1-10).
Past Canadian EOR production has contributed only modestly to onshore conventional oil production. In 2010, EOR volumes totaled about 65,000 barrels per day, accounting for 9% of conventional onshore
production. EOR’s share, however, could grow if EOR production either remains constant or grows and if non-EOR conventional production continues to decline. Production from both carbon dioxide and chemical flooding has increased in recent years with the Weyburn CO2 and Pelican Lake polymer projects making significant contributions. Original oil in place for onshore conventional light/medium was about 80 billion barrels. Of this, some 50 to 60 billion barrels are expected to remain after primary and secondary production and provide a target for EOR development.
Table 1-8. u.s. technically recoverable oil resources as of January 1, 2009
(Billion Barrels)
Region Proved Reserves
Inferred Reserves
Undiscovered Resources Total Percent
Undiscovered
Onshore Conventional Oil
northeast 0.2 0.2 0.7 1.1 64%
Gulf Coast 1.5 3.1 6.5 11.0 59%
Mid-Continent 1.2 7.1 5.4 13.6 40%
southwest 4.8 23.4 2.6 30.7 8%
rocky Mountains 2.5 6.7 2.1 11.3 18%
West Coast 2.6 7.3 2.3 12.1 19%
Subtotal 12.7 47.6 19.5 79.9 24%
tight & shale oil na 2.5 31.6 34.1 93%
Onshore Lower-48 Subtotal 12.7 50.1 51.1 113.9 45%
alaska & offshore lower-48 7.8 12.4 84.7 105.0 81%
U.S. Total 20.6 62.5 135.8 218.9 62%
Conventional Onshore Lower-48 as a Percentage of Total U.S.
62% 76% 14% 36%
notes: na = not available; shale and tight oil proved reserves are included in the regional proved reserve volumes. Crude oil resources include lease condensates but do not include natural gas plant liquids or kerogen. undiscovered oil resources in areas where drilling is officially prohibited are not included. For example, this table does not include the arctic national Wildlife refuge undiscovered oil resources of 10.4 billion barrels. undiscovered resources in this table are “technically recoverable,” which is the estimated volume of oil that can be produced with current technology. “proved reserves” are those reported to the security and exchange Commission as financial assets. “Inferred reserves” are expected to be produced from existing fields over their lifetime, but which have not been reported as proved reserves.
source: u.s. energy Information administration, annual energy outlook 2011 projections.

Chapter 1 - resourCes and supply 105
Figure 1-32. Total U.S. Enhanced Oil Recovery Production, 1986–2010
0
200
400
600
800
1,000
1986 1990 1994 1998 2002 2006 2010
THO
USA
ND
BA
RREL
S PE
R D
AY
YEAR
OTHER GASES CARBON DIOXIDE
CHEMICAL/POLYMER THERMAL
Sources: Oil & Gas Journal’s Biennial Enhanced Oil Recovery surveys.
Figure 1-32. total u.s. enhanced oil recovery production, 1986–2010
Figure 1-33. 2005–2025 Canada Onshore Light/Medium Oil Production by Province, Plus Pentanes and Condensates
0
0.50
1.00
2005 2010 2015 2020 2025
MIL
LIO
N B
ARR
ELS
PER
DAY
YEAR
PENTANES AND CONDENSATES OTHER ONSHORE
SASKATCHEWAN ALBERTA
HISTORICAL PROJECTED
Source: Canadian Association of Petroleum Producers, Canadian Crude Oil Production Forecast 2011–2025, June 2011.
Figure 1-33. 2005–2025 Canada onshore light/Medium oil production by province, plus pentanes/Condensates

106 prudent deVelopMent: realizing the potential of north america’s abundant natural Gas and oil resources
Table 1-9. u.s. enhanced oil recovery production, 2000–2010 By technology Category (thousand Barrels per day)
EOR Technology Category 2000 2002 2004 2006 2008 2010
Thermal Injection EOR
steam 418 366 340 287 275 273
In situ Combustion 3 2 2 13 17 17
hot Water 3 3 4 2 2
Total Thermal EOR 421 371 345 304 294 292
Chemical Injection EOR
polymer/Chemicals 2 0 0 0 0 negligible*
other negligible negligible negligible 0 0 0
Total Chemical EOR 2 negligible negligible 0 0 negligible
Gas Injection EOR
hydrocarbon Miscible and Immiscible 125 95 97 96 81 81
Co2 Miscible 189 187 206 235 240 272
Co2 Immiscible negligible negligible negligible 3 9 9
nitrogen 15 15 15 15 20 9
Total Gas EOR 329 297 318 349 350 371
Total U.S. EOR Production 752 668 663 653 644 663
Total Onshore Lower-48 EOR Production† 626 574 566 557 563 582
Total Onshore Lower-48 Oil Production 3,078 2,758 2,628 2,660 2,769 3,087
Total Onshore Lower-48 Oil Production, excluding EOR 2,452 2,184 2,062 2,103 2,206 2,505
EOR Percentage of Total Onshore Lower-48 Oil Production‡
20% 21% 22% 21% 20% 19%
* a table entry of “negligible” indicates that the production volume was less than 0.5 thousand barrels per day.
† all hydrocarbon miscible and immiscible enhanced oil recovery (eor) production is located either in alaska or the offshore Gulf of Mexico and was subtracted from u.s. total to calculate onshore lower-48 eor oil production.
‡ Based on total onshore lower-48 eor production, which excludes hydrocarbon eor production.
sources: oil & Gas Journal’s Biennial enhanced oil recovery project surveys; and u.s. energy Information administration.

Chapter 1 - resourCes and supply 107
Production Pathways
To develop boundaries of a supply range for con-ventional onshore oil and enhanced oil recovery, rel-evant technologies and issues were grouped into cat-egories. For each of these, scenarios for limited and high potential cases were developed. A production profile for each pathway was developed qualitatively to get a directional view of that boundary over the next 25 years. For the United States, production catego-ries of primary plus secondary, CO2 EOR, and other EOR were considered separately, and then summed. For Canada, conventional light oil was considered as a total production stream made up of existing (virtually all primary + secondary) and new CO2 EOR. Adjust-ments were made to exclude tight oil production as this is addressed in the unconventional supply section.
The factors that were considered for the high poten-tial pathway are shown in Table 1-11. And the fac-tors driving the limited potential case are shown in Table 1-12.
Figure 1-34 illustrates the estimated supply fairway for onshore conventional oil for the U.S.
Table 1-10. Canada potential light/Medium Conventional oil resources, as of 2006
RegionLight/Medium
Crude Oil (Billion Barrels)
Percentage of Total
alberta 5.7 65%
British Columbia 0.5 6%
saskatchewan 1.1 13%
Subtotal – Onshore 7.3 84%
eastern offshore 1.4 16%
Total Canada 8.7 100%
source: natural resources Canada, “Canada’s energy outlook: the reference Case 2006,” ottawa, Canada, 2006, page 35. table us1.
Figure 1-34. Supply Fairway for North American Onshore Conventional/Enhanced Oil Recovery
0
1
2
3
4
5
2005 2010 2015 2020 2025 2030 2035
MIL
LIO
N B
ARR
ELS
PER
DAY
YEARNote: Reference Case based on Energy Information Administration and Canadian Association of Petroleum Producers data, reduced for estimated unconventional production.
REFERENCE CASE ACTUAL HIGH POTENTIAL PATH LIMITED POTENTIAL PATH
GAP DUE TO UNCONVENTIONAL ADJUSTMENT
Figure 1-34. supply Fairway for north american onshore Conventional/enhanced oil recovery

108 prudent deVelopMent: realizing the potential of north america’s abundant natural Gas and oil resources
Table 1-11. Factors Considered for the high potential Case
Technology or Issue Description
Technology (1)
y reservoir characterization, stimulation, and management
y sweep efficiency gains
y downhole monitoring and hori-zontal well diagnosis
y technology transfer enabled
y Impacts both primary/secondary and enhanced oil recovery
existing tools for reservoir characterization, simulation and overall management practices continue to be implemented, increasing project inventory in existing fields. there is continued improvement in sweep efficiency, translating to higher oil recovery and better use of injectants such as carbon dioxide, steam and chemicals. Gains in downhole monitoring are made, allowing data analysis that adds to recovery process improvement. Importantly, diagnosis of horizontal well performance improves, allowing those wells to produce to their ultimate potential.
public/private partnerships grow, enabling technologies to develop and be shared among operators and resource owners. Widespread movement to digital formats for public data continues, improving cycle time for project screening and development. Institutions at all levels encourage job market entrants to consider technical roles in the industry.
Technology (2)
advanced well operations
advanced well operations of horizontal drilling and fracturing continue their growth throughout the united states with appropriate regulatory intervention and minimal local opposition. Incremental technology improvements are developed which allow additional resource plays to be exploited prudently and economically.
Low Oil Saturation Zones low/residual oil zones are widely recognized by industry and government as potential targets for both hydrocarbon production and carbon storage. state and federal geological agencies undertake systematic assessments of low oil saturation zones that have been drilled but largely overlooked in the past. results from projects currently underway in the permian Basin become models for other areas.
Focused efforts (either public or private) to develop new alternative technologies to Co2 flooding in these zones progress. Mechanisms to share these throughout the industry are in place.
Carbon Dioxide
Includes greenhouse gas, capture costs, and legal framework
an aggressive carbon capture and sequestration (CCs) effort develops, in which worldwide and u.s. policies are implemented, which incent capture and storage of large Co2 volumes. Co2 eor is qualified as storage within a clear legal and regulatory framework. transportation issues are resolved and a pipeline infrastructure develops; Co2 price to oil producers is affordable. eor is seen as one piece of a near-term bridge to large-scale capture and storage throughout the united states.
Economics & Policy
y Impacts to profitability
y ability of smaller operators or smaller fields to implement eor/infill
oil prices remain strong relative to gas prices, driving operators to focus on oil opportunities. power, steam, and Co2 prices remain reasonable due to lower underlying natural gas prices.
tax policy to encourage higher risk/cost activities is implemented to maintain activity through price cycles. these include a revamp of the eor tax credit and allowances for marginal or low rate wells. regulators in alberta remain cognizant of royalty rate and adjust as needed to maintain activity. Flexible plugging regulations become widespread to avoid premature abandonment and loss of wellbore access for improved oil projects. solid economics drive operators to implement projects that require more engineering work.
the Interstate oil and Gas Compact Commission recommendations on Co2 transportation, storage, and other regulatory items are widely adopted, providing operators more certainty. Institutions that provide support and knowledge to all operators continue their growth, enabling application to a wide variety of fields and reservoirs throughout the united states.

Chapter 1 - resourCes and supply 109
lower-48 and Canada. The high potential case would suggest an annual growth rate of slightly greater than 1% over the next 25 years. The growth would be gradual, typical of a steady stream of production from a diverse resource base.
The limited potential case indicates a steady decline in the range of 4% annually over the next 25 years. Not dissimilar to the decline realized for much of the past 25 years, this suggests an environment of relatively low prices and significant costs relative to those prices.
Table 1-12. Factors Considered for the limited potential Case
Technology or Issue Description
Technology (1)
y reservoir Characterization, stimula-tion, and Management
y sweep efficiency Gains
y downhole monitoring and horizon-tal well diagnosis
y technology transfer enabled
y Impacts both primary/secondary and enhanced oil recovery
there is limited use of existing reservoir management applications combined with few new tools, meaning investment opportunities are slow to be developed. sweep efficiency continues at status quo, so unit costs go up, causing additional wells to be shut in. little progress in downhole monitoring means data analysis remains spotty; lack of understanding of flow characteristics in horizontal wells causes abandonment prior to full extraction of initially established reserves.
existing public data remains in paper or legacy formats, causing long cycle times and loss of projects. there is limited technology transfer activity; it takes longer for new techniques to permeate industry operations. limited new personnel enter the industry with fewer growth opportunities.
Technology (2)
advanced Well operations
regulations around hydraulic fracturing that are restrictive rather than progressive increase costs and delays, decreasing use. technology development slows with less activity and only the most prolific opportunities can afford the technology.
Low Oil Saturation Zones there is limited recognition or development of the potential of low oil saturation zones and information on them is spotty and tightly held. no alternatives to Co2 flooding are pursued and carbon storage in these reservoirs is not considered by policymakers.
Carbon Dioxide
Includes greenhouse gas, capture costs, and legal framework
Worldwide and u.s. policies are implemented which discourage oil (and coal) production and use of Co2 injectant; existing incentives are removed and regulations around operations (production, plant processing and pipeline) are increased significantly; fees and taxes are also increased substantially. Canadian CCs plans are shelved. this results in new investment drying up; existing operations move to a decline mode.
Economics & Policy
y Impacts to profitability
y ability of smaller operators or smaller fields to implement enhanced oil recovery/infill
oil prices are weak relative to gas prices, driving focus away from oil production.
existing tax incentives are phased out and no new incentives are added. additional or punitive taxes are enacted; higher risk and cost activities are avoided by operators. regulations requiring accelerated abandonment come into play so numerous fields are abandoned and future advanced recovery projects in these locations are limited.
operators and resource owners have little incentive to pursue projects involving higher amounts of engineering, instead funding a smaller number of opportunities that are drilling based.
110 prudent deVelopMent: realizing the potential of north america’s abundant natural Gas and oil resources
The midpoint within the range is close to cur-rent production, suggesting potential exists for this resource to continue as an important portion of North American oil supply.
Key Conventional Onshore Technologies
Oil field development and production are com-plex operations that involve application of hundreds of technologies across many disciplines. Several of these technologies are most likely to influence the supply picture through 2030, again due to their potential impact on production from known oil accu-mulations. They are contained within some broad processes required to manage oil development and producing operations:
y Design – Involves planning for locations, numbers, and types of wells needed to produce and manage the reservoir. It also involves sizing and design of surface facilities to handle produced or injected fluids, plus transportation and disposal of some products. Besides project specifications, produc-tion expectations are developed which support investment decisions. Within this area, reservoir characterization and performance simulation are critical to establishing the initial project feasibil-ity and subsequent management of the producing formations.
y Implementation – Involves the installation and field operation of wells and equipment, includ-ing drilling and well stimulation. Advanced well operations (especially those involving horizontal drilling and hydraulic fracturing) are considered important. Technologies that reduce environ-mental footprint and improve operational safety are also critical to the petroleum industry’s “right-to-operate” in sensitive locations.
y Operation and Monitoring – The life of a produc-ing oilfield lasts a minimum of several years and sometimes for a century, so efficient operating and maintenance practices are important to maximiz-ing recovery and economic benefit. Among myriad activities, data from operations must be collected and analyzed so that operational improvements and incremental investments can be made to prof-itably maximize production and reserves. Down-hole monitoring, especially in complex recovery processes or horizontal wells, is important to success. In addition, advanced control systems that
reduce the human interface will provide increased reliability and reduced costs.
y Recovery Process Improvement – Oilfield develop-ment relies on a given recovery process, be it pri-mary production, water flooding, or an enhanced process like carbon dioxide flooding. Technology leading to improved sweep efficiency is critical to maximizing production from existing operations and in developing some of the multi-hundred bil-lion barrel oil target remaining in existing fields or in other low oil saturation targets.
y Application to New Resources – Because of the natural decline of existing conventional oil produc-tion, it is critical to find new resource targets to maintain or grow production. Technologies target-ing low oil saturation zones can impact supply.
More detail of these areas of technology can be found in Topic Paper #1-5, “Onshore Conventional Oil Including EOR,” available on the NPC website.
Because of the interest in increased use of carbon dioxide in EOR operations, both to contribute to incremental hydrocarbon recovery and as a sink for storage of CO2, there follows a summary of the most important aspects of this opportunity.
Carbon dioxide EOR is an established technology used in the United States since the 1970s. A key requirement for a carbon dioxide project is a depend-able source of high purity and affordable CO2. For this reason, most development to date has occurred in west Texas and southeast New Mexico, where can-didate oil fields and naturally occurring CO2 source fields are close enough to provide CO2 at a reason-able cost. In other locations, a few projects have been implemented where a candidate oilfield was close to a relatively pure industrial source, where man-made (anthropogenic) carbon dioxide is captured for EOR use.
In the United States, most opportunities for using naturally occurring CO2 are already exploited, leaving growth potential primarily to be met from anthropo-genic CO2 sources. The most likely projects are those where a relatively pure CO2 source already exists, since capture and transport are cost effective. Sepa-ration of CO2 from natural gas is a good example of this. Certain industries, including cement, ammonia, lime, iron, and steel also produce relatively pure CO2

Chapter 1 - resourCes and supply 111
streams as a byproduct. Over time, CO2 from addi-tional gas processing and certain other sources is expected to be used in EOR applications.
The category of CO2 supply with the most volume potential is the most challenging. These are projects where carbon dioxide is captured from dilute streams, typically large point source flue gas emissions at power plants. Since this category will require a substantial amount of fiscal and regulatory support, use will ultimately depend on U.S. and Canadian pol-icy decisions. To be viable, the price of delivered CO2 would have to be at a level where investments in EOR projects offer adequate returns. As CO2 prices are negotiated between sellers and purchasers in various contractual arrangements, the price can vary widely based on location, contract vintage, etc. However, minimum prices discussed for CO2 into EOR are usu-ally less than $1 per Mcf ($10 to $15 per metric ton) and maximum prices are typically in the range of $2 to $3 per Mcf ($40 to $60 per metric ton). With expected costs of capture and transport from dilute sources well above this level, policies that provide financial support to reduce delivered CO2 pricing would be required for a viable supply to use in EOR applications.
Key Conventional Onshore Findings and Implications
Finding 1: Industry reacts quickly to viable eco-nomic returns on investment in conventional onshore and EOR opportunities, and production increases often follow. This ability to respond requires consistent, stable regulation. Longer-term investments requiring large capital infrastructure are especially sensitive to stable policy. Sustained, incremental improvements in technology, regula-tions, and EOR injectant supply would stem the historical decline and contribute large volumes over time as gains compound annually.
y In the mid-2000s, higher activity resulted in approximately 1.0 million barrels of oil per day of increased conventional oil production in the onshore U.S. It was triggered by strong prices, incremental technology advances, and regulatory certainty. This production resulted largely from projects targeting developed fields and known resources.
y This represents the activity of thousands of operators over several hundred thousand pro-
ducing wells, operating in areas with existing infrastructure. Activity increases or decreases with profitability measures and is enabled by a high level of regulatory predictability and certainty.
The timing of production impact varies depending upon the type of activity. Development drilling or well enhancement can add volumes within a few months; development of an EOR project may not add volumes until several years after project ini-tiation. In uncertain policy or price environments, short-term resource investments are favored over long-term EOR projects.
Recommendation 1: Some recommended areas for consideration are as follows:
y Direct Financial Support or Investment
− Implement tax credit program for low volume wells to improve ultimate recovery and retain fields and infrastructure for potential future EOR projects.
− Review/enhance the federal EOR tax credit to make it more relevant in the current price environment; consider simplification of calcula-tions.
y Support, Technology, or Institutional Programs
− Support of organizations that disseminate best practices or technology applications (e.g., Research Partnership to Secure Energy for America and the Petroleum Technology Transfer Council).
Finding 2: Production from enhanced oil recov-ery projects, specifically those relying on carbon dioxide (CO2) injection, is a critical source of long-term future production from lower-48 onshore con-ventional resources. State and federal policies will determine whether this supply stream declines, has healthy incremental growth or reaches new plateaus.
The production wedge from CO2 EOR is one of the largest variables in conventional oil production pro-jections, with estimates ranging from 0.3 to over 2.0 million barrels of oil per day by 2030.
y Because new field discoveries are now smaller and generally decline faster, EOR projects provide very stable, long-term sources of oil reserves.

112 prudent deVelopMent: realizing the potential of north america’s abundant natural Gas and oil resources
y The resource target for all EOR is estimated at sev-eral hundred billion barrels, though this number is very dependent on oil price, CO2 price and availabil-ity, and specific field and wellbore conditions.
y EOR projects often have high fixed and variable costs, making EOR production the “marginal bar-rel” in many markets, often just below prevailing oil price expectations.
y A reliable, affordable, and growing supply of carbon dioxide will be a key determinant of future EOR production.
y Skills needed to design and operate EOR projects are not always readily available and many operators do not have experience in EOR.
y For some fields, there is a limited window of opportunity to implement EOR projects due to aging infrastructure and rapidly declining pro-duction volumes over which to spread fixed costs. Delays in development could mean loss of poten-tial reserves, with ultimate impacts dependent on the regulatory environment, available technology and economics.
y There are a number of areas where additional regu-lations and policy actions would negatively affect EOR production. Following are some examples of areas where progressive regulations may influence future oil supply.
Recommendation 2: Some recommended areas for consideration are as follows:
y Proactive Regulation
− Ensure flexible well plugging rules exist to avoid premature abandonment of candidate oil fields.
− Provide regulatory certainty for well design/construction standards, re-abandonment of existing wells, CO2 capture/storage credits, generation and use of greenhouse gas offsets and CO2 pipeline permitting. Maintain class II well design where it is initially injected for EOR purposes.
− Develop a clear regulatory framework for con-verting an initial EOR project into a CCS project that can claim financial or emission allowance in-centives.
− Codify long-term liability rules for CO2 stored in reservoir after EOR.
y Current Practices Affirmed
− New regulations around the handling and use of carbon dioxide are limited. Example: new rules from the Environmental Protection Agency regarding CO2 as “hazardous.”
− The regulatory framework in states with existing CO2 operations are exported to new areas. Example: CO2 pipelines – no need to reinvent the wheel.
− Projects that incidentally store CO2 should not be harmed by new regulations targeting storage projects pursued for financial purposes.
y Direct Financial Support or Investment
− Support conversion of public oil and gas data from paper/film legacy systems to digital format to improve project development capability and efficiencies.
− Tax policy to incentivize new computer hardware/software, because EOR projects are complex and require a great deal of additional engineering and geologic characterization and often require an upgrade to a company’s information technology hardware to evaluate the subsurface potential.
− Rapid amortization for site characterization or other front end costs.
− Review/enhance the federal EOR tax credit to make it more relevant in the current price envi-ronment; consider simplification of calculations.
y Support, Technology, or Institutional Programs
− Support of research in the areas of reservoir characterization, reservoir modeling and sweep efficiency improvement. Consider public/private partnerships (e.g., Research Partnership to Secure Energy for America) to provide appropriate prioritization of topics.
Finding 3: A large increase in CO2 supply from dilute anthropogenic sources will be required over the next 10 to 15 years to extend EOR production levels. The complex factors affecting this supply include carbon capture and sequestration (CCS) deployment, involving substantial government fiscal and policy action.
y Estimates of oil supply resulting from projects using dilute CO2 sources range up to more than two million barrels of oil per day.

Chapter 1 - resourCes and supply 113
y The cost of CO2 from dilute sources is dominated by high capture costs; support will be required to build demonstration projects for supply and as test sites for technology evolution.
y Lack of significant progress in CCS projects appears to be a function of low economic returns available to those who would deploy the technology. Costs need to decrease substantially to create market interest, which may require step-changes in technology.
y EOR is compatible with CCS should it move for-ward; EOR projects are seen as a win-win for those advocating early adoption of CCS.
y Permanent carbon sequestration during EOR will be part of the justification for these projects; the legal framework to delineate post-closure liability must be put in place. Additional considerations include pore space ownership, new well design standards, and potential re-abandonment of exist-ing wells. These issues are already well discussed among various government agencies and industry groups. State support is important even if finan-cial incentives are small; it helps to provide greater regulatory certainty and remove barriers that arise in any new project development.
y Canada may be ahead of the United States in this area with a combination of policy and funding.
Recommendation 3: Some recommended areas for consideration are as follows:
y Proactive Regulation
− A program is implemented which incentivizes emission reductions while recognizing CO2 EOR as a CCS option.
− Framework and regulations are developed that allow operators to understand and manage post-closure liability from the outset of project conceptualization.
− States without clear processes regarding CO2 EOR use Interstate Oil and Gas Compact Commission guidance or another source to develop needed regulations; don’t reinvent the wheel.
− Comprehensive Environmental Response, Compensation, and Liability Act/Resource Conservation and Recovery Act exemptions for storage in qualified sites.
− Price premium for low-carbon power, akin to “renewable” pricing, or “credit” for CO2 storage via EOR. Ability to generate offsets for CO2 captured from sources outside regulatory jurisdiction.
y Current Practices Affirmed
− New rules do not hinder projects that are operating or in permitting phase.
− CO2 transportation regulations, currently under discussion for CCS are not onerous for EOR users.
− Maintain a flexible approach that allows both common-carrier and private CO2 pipeline models.
− Avoid considering CO2 a pollutant; reinforce with regulators that CO2 is not hazardous, and is not corrosive in the absence of free water and with proper metallurgy.
y Direct Financial Support or Investment
− Direct investment or funding of carbon capture and EOR+Storage projects for demonstration purposes.
Express backstop of long-term liabilities arising from storage may be necessary, including trust fund models.
Enhanced tax credits for CO2 EOR+Storage proj-ects with exemptions from liability under Alternative Minimum Tax provisions.
y Support, Technology, or Institutional Programs
− Increased funding for National Energy Tech-nology Laboratory Carbon Sequestration Part-nerships.
Finding 4: Substantial petroleum resources occur naturally or remain after primary and secondary recovery in low oil saturation zones. Increased under-standing of these zones is necessary for extensive development, whether by carbon dioxide flooding or another technology.
y A sizable portion of the 300+ billion barrels expected to remain unrecovered in existing oilfields are in zones of low oil saturation.
y There are additional low oil saturation zones (often referred to as residual oil zones or ROZ) that occur naturally. These are not well characterized, but are estimated to hold at least 80 billion barrels. These zones provide a new set of targets in addition to already produced or developed fields.

114 prudent deVelopMent: realizing the potential of north america’s abundant natural Gas and oil resources
y Carbon dioxide flooding is the only applicable pro-cess currently deployed on a commercial scale to recover these resources. As such, the new target zones offer additional storage potential should CCS advance.
y Technology development and demonstration in these zones will be focused in areas with existing infrastructure and CO2 supply options.
y At this point, no non-CO2 alternative EOR process has been developed capable of supporting substan-tial commercial ROZ development. Water floods that include chemical additives seem to have the greatest application and promise.
Recommendation 4: Some recommended areas for consideration are as follows:
y Proactive Regulation
− Ensure flexible well plugging rules exist to avoid premature abandonment of candidate oil fields.
y Direct Financial Support or Investment
Consider separate tax credit to incent ROZ devel-opment.
y Support, Technology, or Institutional Programs
− Support work to describe the ROZ resources at various levels, including state agencies, universities, U.S. Department of Energy, Research Partnership to Secure Energy for America, and the U.S. Geological Survey.
− Support open access research in alternative re-covery processes, focusing on chemical flooding. Need both basic and applied research.
Finding 5: Horizontal drilling and advanced hydraulic fracturing technologies are important to developing opportunities in the conventional oil area much as they are in unconventional oil and onshore gas development. Techniques to monitor and understand horizontal well performance will improve as these wells proliferate.
y These technologies offer new tools to profitably develop conventional oil and EOR reservoirs. They also allow new hydrocarbon targets to be devel-oped, that were previously thought unproducible or uneconomic.
y Horizontal wells accounted for more than 50% of wells drilled in the United States during 2010.
y Given the increasing reliance on horizontal wells for reserve development, it will be critical to understand fluid flow in a given well to optimize production and maximize reserves and recovery efficiencies.
y Horizontal drilling and hydraulic fracturing tech-nologies depend on materials that may be in short supply or are used extensively in other industries.
Recommendation 5: Some recommended areas for consideration are as follows:
y Current Practices Affirmed
− New regulation on hydraulic fracturing should endeavor to maintain current regulatory effec-tiveness to avoid loss of opportunities.
− Maintain ability to comingle multiple formations where conservation principles are not compro-mised.
y Support, Technology, or Institutional Programs
− Support research in the areas of downhole moni-toring of wells, especially horizontals and those used in EOR.
− Working group of industry and government to identify potential material shortages and actions to mitigate impact.
Unconventional Oil
Development and Production History and Context
In this study, unconventional oil includes Canadian oil sands, Canadian heavy oil, and U.S. and Canadian tight oil, all currently producing significant quantities of oil, and potential future unconventional resources in U.S. oil shale and U.S. oil sands, not yet currently contributing production. These resources are located in the onshore arenas of U.S. and Canada, but are dis-tinguished from the conventional oil discussed in the previous section by different hydrocarbon characteris-tics, geologic occurrences, and production techniques.
The extra heavy oils (also referred to as bitumen) are extremely viscous – sometimes nearly solid. They often contain high concentrations of sulfur and metals such as nickel and vanadium. These properties make them difficult to produce and process. Massive accu-mulations exist in the Canadian oil sands of Alberta and in smaller accumulations in the United States.

Chapter 1 - resourCes and supply 115
However, not all unconventional oils are heavy. A growing source of unconventional supply is tight oil – produced from low-permeability siltstones, sand-stones, and carbonates. The produced oil has similar properties (e.g., density, sulfur content) as conven-tional oil. Historically, the oil was locked in the for-mations and could not flow through the tight forma-tion rock. However, recent advances in horizontal drilling and well fracturing technologies now enable production of tight oil. Notable plays include the Bak-ken (spanning Saskatchewan, Manitoba, Montana, and North Dakota), the Eagle Ford play in Texas, the Cardium play in Alberta, and the Miocene Monterey play in California. For the largest tight oil play, the Bakken, the produced oil is sweet and light, and only the geology and oil extraction techniques are uncon-ventional.
Unconventional oil is also contained in U.S. oil shale deposits. The petroleum component of the oil shale (kerogen) is less mature, not yet fully transformed into oil or natural gas. Therefore, unlike conventional oil and gas operations, kerogen in oil shale cannot be pumped directly from the ground or refined with tra-ditional techniques. Rather, oil shale must be heated to high temperatures to transform the kerogen into an upgraded hydrocarbon.
In these categories, oil in place is estimated at more than 3.5 trillion barrels. However, the reserves, or the amount of oil that can be economically produced, make up approximately 5% of this total (Table 1-13). Even though the recoverable oil is a small part of total oil, it is still significant.
In terms of production, unconventional oil supply in North America has been growing – reaching 2 mil-lion barrels per day in 2009 or equivalent to about 10% of crude oil processed in U.S. refineries.
The following sections discuss each of the main components of current and future unconventional oil supply in North America.
Canadian Oil Sands
History and Context
Canada’s oil sands are one of the world’s largest hydrocarbon accumulations (see map, Figure 1-35). Located in the Province of Alberta, they are semi-liquid hydrocarbons with gravity of 10o API or less. In 2009, the Alberta Energy Resources Conserva-tion Board (ERCB) estimated the initial volume of oil in place of crude bitumen in Alberta’s oil sands as 1,804 billion barrels. The ERCB reported that 7% of the oil in place, 131 billion barrels, is contained in shallow deposits, generally less than 215 feet to the top of the oil sands zone. All of the shallow oil sands (amenable to surface mining) are located in the Athabasca oil sands area. Surface mining and bitumen extraction technologies are used to recover crude bitumen from these shallow deposits. The remaining 93% of the oil in place, 1,673 billion barrels, is contained in deeper deposits. In situ recovery techniques are used to recover crude bitumen from the deeper deposits. The ERCB estimated approximately 10% of the oil in place is recoverable with about 22% of the recover-able volume located in shallow deposits that will be
Table 1-13. size of north american unconventional oil resources (Billion Barrels)
Oil in Place Resources (Includes Reserves) Ultimate Potential
u.s. oil shale (Green river formation only) 1,500 0 800
Canadian oil sands 1,804 169.8 (reserves) 308
Canadian heavy oil 35 1 n/a
u.s. oil sands 63 0 n/a
tight oil n/a 5.5 to 10 (resources) n/a
Total Greater than 3,500 Greater than 177 Greater than 1,100

116 prudent deVelopMent: realizing the potential of north america’s abundant natural Gas and oil resources
developed using surface mining and 78% located in deeper deposits that will be developed using in situ recovery.
To year-end 2009, about 4% of the initial estab-lished reserves had been produced with about 65% produced using surface mining and 35% produced using in situ recovery.
The ERCB estimates the ultimate potential of crude bitumen recoverable by in situ recovery methods from Cretaceous sediments to be about 210 billion barrels and from Paleozoic carbonate sediments at about 37 billion barrels. Nearly 70 billion barrels is expected from within the surface-mineable bound-ary. The total ultimate potential of crude bitumen is, therefore, about 315 billion barrels, of which 7 billion barrels has been produced, leaving 308 billion barrels remaining.
As of 2009, oil sands production has reached 1.49 million barrels per day of crude bitumen, 826 thousand barrels per day from surface mining, and 664 thousand barrels per day from in situ proj-ects. In 2009, the oil sands industry represented approximately 50% of Canada’s total oil production.
Historical bitumen production over the last 15 years is illustrated in Figure 1-36.
To remove contaminants and improve the value of oil sands crude, a large portion of Alberta’s bitu-men production is upgraded to synthetic crude oil (SCO) and other products before shipment to mar-ket. After upgrading, supply of SCO (including other products) and non-upgraded crude bitumen totaled 1.34 million barrels per day in 2009 (766 thousand barrels per day of SCO and 570 thousand barrels per day of non-upgraded crude bitumen). The 2010 pro-duction was 1.47 million (660 thousand barrels per day of SCO and 810 barrels per day of non-upgraded crude bitumen).
Key Development and Production Technologies
The hydrocarbon component of the oil sands, crude bitumen, must be separated from sand, other mineral materials, and formation water before it is delivered to downstream upgraders or refineries. Shallow oil sands deposits, generally less than about 215 feet to the top of the oil sands zone, are usually exploited
Figure 1-35. Alberta’s Oil Sands Areas
UNITED STATES
ALBERTA
Source: IHS Cambridge Energy Research Associates, ©2009.
THE MINEABLE OIL SANDS REGION IS SLIGHTLY SMALLER THAN THE STATE OF RHODE ISLAND.
THE ENTIRE OIL SANDS REGION (PEACE RIVER, ATHABASCA, AND COLD LAKE) IS ROUGHLY THE SIZE OF THE STATE OF NEW YORK.
THE PROVINCE OF ALBERTA ISSIMILAR IN SIZE TO THE STATE OF TEXAS.
IN SITU
MAJOR OIL SANDS PROJECTS
MINEABLE REGION
MINING
PEACERIVER
FORTMCMURRAY
COLD LAKE
OILSANDSAREA
CANADA
Note: Comparisons to U.S. states are to the total areas of the states, including land and water.
Figure 1-35. alberta’s oil sands areas

Chapter 1 - resourCes and supply 117
using surface mining to recover ore-grade oil sands, then delivered to an extraction plant for separation of bitumen from the sand, other minerals, and water. Deep oil sands, greater than about 215 feet to the top of the oil sands zone, are exploited using in situ recov-ery techniques, whereby the bitumen is separated from the sand in situ and produced to the surface through wells.
Established oil sands mining and extraction tech-nologies are based on truck and shovel mining tech-niques. Trucks capable of hauling up to 400 tons of material are loaded by electric- and hydraulic-power shovels with bucket capacities up to 58 cubic yards. The trucks transport oil sands ore to preparation facilities where it is crushed and prepared for transport to an extraction plant (where bitumen is separated from the sand). The ore is mixed with water to create slurry that can be pumped to the extraction plant (this method is known as “hydrotransport”). At the extraction plant, bitumen is separated from the sand, water, and other minerals using a hot water extraction process.
Developing oil sands mining and production pro-cesses to improve recovery performance, reduce envi-
ronmental impact, and reduce costs include the fol-lowing:
y Mine-face crushing and slurry preparation to elimi-nate the use of heavy-hauler trucks
y Counter Current Drum Separator extraction pro-cess (Bitmin process), developed to replace hot water extraction and produce relatively dry tailings sand
y Mine-face extraction, a process that uses cyclones to separate bitumen from the sand at the mine face.
Established in situ bitumen recovery technologies have been developed to deal with the heavy, viscous nature of the bitumen, which means that it will not flow under normal reservoir temperature conditions. For recovery of bitumen from deep deposits, viscos-ity must be reduced in situ to increase the mobility of bitumen in the reservoir. This enables flow to well-bores that bring bitumen to the surface. Bitumen viscosity can be reduced in situ by injecting steam to increase reservoir temperature, injecting solvents, injecting air, or using electric heating. Steam-based thermal recovery is the dominant recovery technique
Figure 1-36. Canadian Bitumen Production, 1998–2009
0
20
40
60
80
0
400
800
1,200
1,600
1998 1999 2000 2001 2002 2003 2004 2005 2006 2007 2008 2009
IN SITU PRODUCTION SURFACE MINING PRODUCTION
PERCENTAGE MINED
THO
USA
ND
BA
RREL
S PE
R D
AY
PERC
ENTA
GE
OF
BITU
MEN
PRO
DU
CED
BY
MIN
ING
YEARSource: Alberta Energy Resources Conservation Board (ERCB).
Figure 1-36. Canadian Bitumen production, 1998–2009

118 prudent deVelopMent: realizing the potential of north america’s abundant natural Gas and oil resources
used at Athabasca, Cold Lake, and Peace River. The industry also conducts field tests of other in situ recovery methods including solvent-based recov-ery, co-injection of steam and solvents, co-injection of steam and non-condensing hydrocarbons, in situ combustion and electric heating. Compared to sur-face mining, in situ bitumen production does not produce tailings that require disposal, requires less water due to higher recycle rates, and has a smaller surface footprint.
Primary recovery or “cold production” occurs where bitumen can flow under normal reservoir conditions without additional stimulation. This approach has been used successfully in the Wabasca area of Atha-basca and in the Peace River Oil Sands Area. Second-ary recovery, where production is stimulated by water or polymer injection, has been used successfully in the Wabasca area.
Most in situ bitumen production has been enabled using steam-based thermal recovery techniques, such as cyclic steam stimulation or steam-assisted gravity drainage (SAGD). These techniques, developed since the 1980s and 1990s, are now well established, and play a significant role in overall expansion of oil sands production.
In addition to improvements to these existing tech-nologies, new in situ recovery processes are being developed to reduce energy requirements, reduce water use, lower costs, improve recovery factors, and reduce environmental impacts. These include:
y Hybrid steam-solvent processes
y Solvent only processes
y In situ combustion
y Electric heating.
Production Potential
Development potential of productive capacity to 2035 and beyond has been reviewed by examining industry’s historical success in growing production, known plans for new development and expansion of existing projects, and the expected contribution of new areas and new technologies. We have developed a most likely case, a constrained case, and a reasonably unconstrained case. As stated earlier, the Canadian oil sands industry is well established. Large-scale commercial production began more than 40 years ago. In 2009, production reached 1.34 million barrels per
day, and by 2015 productive capacity is projected to approach about two million barrels per day. Several new projects have recently come on stream, several are under construction, and many more are proposed. As of early 2011, industry had proposed projects rep-resenting about 7.7 million barrels per day of new bitumen productive capacity.
Based on our review of available resources, the sta-tus of the industry, and the challenges it faces, it is our view that the Canadian oil sands industry has the high potential to provide up to 6 million barrels per day of SCO and raw non-upgraded bitumen supply by 2035. This high case assumes a concerted effort by Canada and the United States to address challenges associated with unconventional oil development in general and oil sands in particular (e.g., energy and water intensity, tailings reduction and remediation, export capacity, and other constraints).
The most likely case we have examined would see oil sands output grow to around 4.5 million barrels per day by 2035. This assumes that:
y Supply continues to be driven by market demand
y The current Canada/U.S. free-trade relationship remains
y Oil prices remain sufficient to justify new project investments
y Sufficient pipeline transportation capacity is built to move products to market
y Public acceptance of oil sands development is main-tained by continual environmental performance improvements
y At this growth level, no undue restrictions are expected on capital availability, availability of engi-neering services, skilled labor supply, or material and equipment supply.
A constrained case would see oil sands growing only to about 3 million barrels per day by 2035. This case assumes governments implement stron-ger clean energy policies that create additional chal-lenges for oil sands developments. Strong policies to limit greenhouse gas (GHG) emissions encour-age expansion of alternative forms of energy, while regulatory oversight of oil sands tightens further, particularly to address the impacts of oil sands development on air and water quality and land use. The intersection of increasing costs and declining oil demand and oil prices (lower oil demand stems from

Chapter 1 - resourCes and supply 119
government clean energy policies) raises economic hurdles and deters significant oil sands develop-ments after 2020.
Canadian Heavy Oil
History and Context
Most Canadian conventional heavy oil comes from a region termed the “heavy oil belt.” The heavy oil belt straddles the border of Alberta and Saskatchewan, just south of the oil sands Cold Lake region. Generally, heavy oil projects north of township 53 in Alberta are classified as oil sands and projects south are classified as conventional heavy oil. In Saskatchewan, all heavy oil production (including production north of the Alberta cutoff) is categorized as conventional heavy oil. Because of the technological and geographic over-lap between bitumen produced from in situ oil sands and Canadian conventional heavy crude, Canadian conventional heavy oil is included within the uncon-ventional oil category of this study. Alberta defines heavy oil as all oil under 25.7 o API south of township 53, while Saskatchewan production data use a cutoff of under 20 o API for heavy oil.
In 2009, production of Canadian conventional heavy oil was 382 thousand barrels per day with pro-duction in decline (5% per year on average over the past 5 years). Combined production from Alberta and Saskatchewan peaked in 1997. Recent declines are attributed to the maturity of “easy” oil and the shift in industry focus towards oil sands (Figure 1-37).
Key Development and Production Technologies
Today, heavy oil uses similar production technolo-gies as in situ oil sands, such as:
y Cold heavy oil production with sand (CHOPS) – Recovery factors range from 3% to as high as 12%.
y Horizontal well technologies – Typically applied to areas of the heavy oil belt with lighter gravity crudes, similar recoveries to CHOPS.
y Secondary recovery – Water and polymer flooding are used in lower viscosity reservoirs.
y Thermal (cyclic steam stimulation and steam drive) – Oil recovery has reached 60%.
Figure 1-37. Canadian Heavy Oil Production, 1988–2009
0
100
200
300
1988 1991 1994 1997 2000 2003 2006 2009
ALBERTA HEAVY OIL
SASKATCHEWAN HEAVY OIL
YEAR
DA
ILY
FLO
W (T
HO
USA
ND
BA
RREL
S PE
R D
AY)
Note: Alberta production heavy oil includes all oil under 25.7 API, while Saskatchewan production data is all production under 20o API cuto� for heavy oil.Sources: Alberta Energy Resources Conservation Board (ERCB) and Saskatchewan Ministry of Energy and Resources.
Figure 1-37. Canadian heavy oil production, 1988–2009

120 prudent deVelopMent: realizing the potential of north america’s abundant natural Gas and oil resources
commonly known as “oil shales,” which refers to oil or kerogen rich shales that are either heated in situ and produced or if surface accessible mined and retorted.
The most notable tight oil plays in North America include the Bakken play in the Williston Basin, the Eagle Ford play in Texas, the Cardium play in Alberta, and the Miocene Monterey play of California’s San Joaquin Basin (see map, Figure 1-38). Starting in the mid-2000s, advances in well drilling and stimula-tion technologies combined with high oil prices have turned tight oil resources into one of the most actively explored and produced targets in North America.
In terms of oil resources the tight oil plays are signif-icant. Total estimated resources of the tight oil plays identified by this report range from 6 to 34 billion barrels, and are based on reports for both producing and prospective tight oil plays. It is likely that this estimate significantly underestimates the amount of recoverable oil when new tight oil techniques are applied to these deposits. The NPC Resource and Supply Data survey, analyzing a wide set of studies and private industry outlooks, provided the high side estimate of 34 billion barrels.
Among the producing tight oil plays, the Bakken play is currently considered the largest, with esti-mates of recoverable resources or resources ranging from 3.65 billion barrels of oil to 4.3 billion barrels. With respect to the prospective tight oil resources, it has been calculated that the Tuscaloosa Marine Shale play of central Louisiana and southern Missis-sippi may hold resources of 7.0 billion barrels.
According to the North Dakota Department of Mineral Resources–Oil and Gas Division, production from the Bakken Formation in North Dakota has increased from approximately 20 thousand barrels per day in 2007 to more than 220 thousand barrels per day in 2010. From the information available at the time of this study, the Bakken accounts for most of the current tight oil production, almost 350 thou-sand barrels per day including U.S. and Canadian production. However, recent development within the Niobrara and Eagle Ford plays suggest that their productivity may be comparable to that of the Bakken within a few years.
Key Development and Production Technologies
Horizontal drilling technology, combined with advances in well completion and hydraulic fracture stimulation methods, has opened up domestic tight
Similar to in situ oil sands, new methods have been developed and applied to improve recovery factors and extend the life of these resources. These technol-ogies include:
y Thermal steam-assisted gravity drainage (SAGD)
y Hybrid steam/solvent and solvent only processes
y In situ combustion
y Enhanced cold flow recovery.
Production Potential
By 2035, we estimate Canadian heavy oil produc-ing in a range of 135 thousand barrels per day (con-strained case) up to 350 thousand barrels per day (relatively unconstrained case).
The most likely, or expected, case is for 2035 pro-duction of 250 thousand barrels per day, assuming an ongoing 4% decline per year to 2035 for cold flow production. The amount of production using steam method increases from about 30 thousand barrels per day currently to 130 thousand barrels per day. Fur-ther steam injection projects are limited as few por-tions of the resource are thick enough to apply steam methods.
The high, or reasonably unconstrained, case is for 2035 production of 350 thousand barrels per day, with technological innovation enabling upside from the expected case. Between 2025 and 2035 success-ful and economic pilots of both combustion and heavy EOR) with gas reinjection could be demonstrated in the heavy oil belt. By 2035, these two innovations would add another 100 thousand barrels per day to production.
The low, or constrained, case is for 2035 production of 135 thousand barrels per day, assuming an ongo-ing 4% decline per year to 2035 for cold flow produc-tion. The amount of production from thermal meth-ods does not increase substantially, as new thermal projects are limited to the more economic oil sands deposits to the north.
Tight Oil
History and Context
The term “tight oil” refers to crude oil or conden-sate found in sedimentary rock formations character-ized by very low permeability. This resource should not be (but often is) confused with resources that are

Chapter 1 - resourCes and supply 121
GRE
EN P
OIN
T SH
ALE
, ME
MA
RCEL
LUS
SHA
LE, N
YH
EATH
/BA
KKEN
SH
ALE
S, M
T
MO
WRY
SH
ALE
, WY
MO
WRY
/ NIO
BRA
RA
SHA
LE, W
Y
GO
THIC
SH
ALE
, UT
MO
WRY
/NIO
BRA
RA S
HA
LE, W
Y
BARN
ETT/
WO
OD
FORD
SH
ALE
S, N
M
EAG
LE F
ORD
/MID
WAY
/W
ILCO
X FO
RMAT
ION
S, T
X
TUSC
ALO
OSA
SH
ALE
, MI
7,00
0 M
MBO
PRO
SPEC
TS
CARD
IUM
SH
ALE
S, A
B66
0 M
MBO
BAKK
EN S
HA
LE, C
AN
AD
A30
MM
BO
BAKK
EN S
HA
LE, N
D4,
000
MM
BO
EXSH
AW S
HA
LES,
MT
30 M
MBO W
ATTM
AN
SH
ALE
, WY
11 M
MBO
NIO
BRA
RA S
HA
LE, C
O24
0 M
MBO
ATO
KA-C
HER
OKE
E SH
ALE
S, C
O 1
46 M
MBO
PEN
N S
HA
LE, O
K
UTI
CA S
HA
LE, O
H
MA
NCO
S SH
ALE
, NM
75 M
MBO
BARN
ETT
SHA
LE, T
X70
MM
BO
EAG
LE F
ORD
SH
ALE
, TX
13 M
MBO
AN
TELO
PE S
HA
LE, C
A70
0 M
MBO
MO
NTE
REY
SHA
LE, C
A17
.5 M
MBO
PRO
DU
CIN
G
Not
es:
Estim
ated
reco
vera
ble
reso
urce
s.
MM
BO =
mill
ion
barr
els
of o
il
Figu
re 1
-38.
Pro
duci
ng a
nd P
rosp
ectiv
e Ti
ght O
il Pl
ays
in th
e U
nite
d St
ates
and
Can
ada
TIG
HT
OIL
PLA
Y ST
ATU
S
Figu
re 1
-38.
pro
duci
ng a
nd p
rosp
ectiv
e ti
ght o
il pl
ays
in th
e u
nite
d st
ates
and
Can
ada

122 prudent deVelopMent: realizing the potential of north america’s abundant natural Gas and oil resources
development of more known plays, could result in a 50% increase in the 2035 estimate, to 3 million bar-rels per day from this resource type.
In a constrained development case, production and development could be limited by restrictions on hydraulic fracturing by state and federal regulatory agencies; limited availability of water for hydraulic fracturing; or changes in the tax rules for oil explora-tion and production activities that reduce the finan-cial incentive to produce tight oil resources. These types of constraints could limit production from tight oil in 2035 to around 600 thousand barrels per day.
U.S. Oil Shale
History and Context
Oil shale consists of rock and a solid organic sedi-ment called kerogen. This naturally occurring source of hydrocarbon has not yet undergone the full trans-formation to oil and gas by heat and pressure over long periods of geologic time, creating a unique devel-opment and production challenge.
Oil shale represents one of the world’s largest unconventional hydrocarbon deposits with an esti-mated 8 trillion barrels of oil in place. Approximately 6 trillion barrels of oil in place is located in the United States, with the most concentrated deposits found in the Green River Formation in Colorado, Utah, and Wyoming. This formation contains about 1.5 trillion barrels of oil in place. About 80% of this resource lies under U.S. federal lands.
There is a limited history of oil shale production in the United States, dating back to the 1970s and early 1980s, following the Arab oil embargoes. When oil prices fell in the 1980s, oil shale production activi-ties were halted although research into development and production technologies continued. This includes efforts by the U.S. federal government, which awarded six research, development and demonstration (RD&D) leases in Colorado and Utah in 2006 and offered more leases in 2009. In addition, companies, like Shell, have undertaken oil shale development research proj-ects on private land.
Because of the long time cycle and high capital requirements of an oil shale project, broad and con-sistent government support would be required to develop a commercial oil shale industry. Support-ive government policy and regulatory certainty are
oil production in North America. The successful pro-duction of tight oil relies on a detailed understanding of potential pathways to unlock hydrocarbons from low permeability and low porosity formations that may contain natural fracture networks. Application of specific technologies and drilling strategies, espe-cially with respect to well completion and stimulation techniques, almost certainly differs from play to play, and often even within a play.
The Bakken play is an example of this. The exploita-tion approach for the Bakken evolved from early verti-cal wells perforated across the entire thickness of the formation to horizontal drilling of the upper shale, then to the horizontal drilling of the middle Bakken (which is not typically shale, but may be composed of silts, sands, or carbonates) utilizing single stage fracturing. The current trend of horizontal drilling involves multistage fracturing of the middle Bak-ken. The horizontal drilling approaches in the Bakken have also included a host of multilateral well types drilled in various orientations to optimize the influ-ence of natural fracture networks and natural stress and strain forces on productivity. The current trend in the Bakken is towards single well pad locations with various horizontals (up to 12) drilled from one location covering two 1,280-acre spacing units. This significantly reduces surface disturbance and can save capital associated with multiple rig mobilization and demobilization.
Production Potential
By 2035, production from tight oil plays across the United States and Canada could range between 600 thousand barrels per day up to as high as 3 mil-lion barrels per day, with a most likely estimate of around 2 million barrels per day.
The most likely estimate involves the application of knowledge gained during successful development of the Bakken towards other tight oil plays over this period. Bakken production is expected to be between 400 and 600 thousand barrels per day by 2035. If levels of Bakken production from Saskatchewan and Montana are each about half the North Dakota pro-duction, and similar productivity is realized from just three other large tight oil plays (for example the Eagle Ford, Niobrara, and Cardium) then more than 2 million barrels per day of production from tight oil formations in North America in 2035 is likely.
In the reasonably unconstrained case, continuing improvement in recovery technologies, as well as

Chapter 1 - resourCes and supply 123
If these barriers and challenges are not met, there is a plausible low, or constrained, case in which there could be zero oil shale production by 2035.
However, in the most likely case, we assume that three to five projects can emerge from the existing lease program and develop commercial production from the early 2020s, after conversion of RD&D leases to commercial leases around the middle of the current decade. This should lead to production rates of around 250 thousand barrels per day by 2035, with prospects for considerable growth in subsequent decades.
In the high, or relatively unconstrained case, more rapid technological progress and a supportive market and regulatory environment could allow the industry to develop larger projects earlier. Large projects in the 100–200 thousand barrels per day output range would take 3–5 years for development and 5–7 years to reach sustainable production. In this scenario, total production could reach as high as 1 million bar-rels per day by 2035.
U.S. Oil Sands
History and Context
U.S. oil sands resources show some important dif-ferences from the Canadian oil sands, discussed previ-ously. Factors such as more varied land ownership, more complex and challenging oil sand composition, and geographical dispersion add to the challenges faced by U.S. oil sands development.
Of the estimated 54–63 billion barrels of original bitumen in place, the resource in the Utah is the larg-est, at about 20 billion barrels, and the best under-stood. Covering nearly 1 million acres, or 150 square miles, 11 major deposits are designated as Special Tar Sand Areas (STSA) within the state of Utah.
An important difference between Canadian and U.S. oil sands (principally Utah) is that the U.S. sands are “oil-wet” rather than “water-wet.” Oil-wet U.S. sands lack the film of water layered between the sand grain and the bitumen in Canadian water-wet sands. The oil-wet nature of U.S. oil sands leaves the depos-its more highly consolidated (typically 3-4 times the compressive strength), making initial mining and ore conditioning operations more energy intensive than in Canada’s oil sands.
crucial for private industry to assess risks and to com-mit the billions of dollars of required investment. Commercial scale technologies with economically attractive recovery efficiency and acceptable environ-mental impacts will be required. Because the road to commercialization is measured in decades not years – a long time horizon will allow development to continue through “boom and bust” oil and gas price cycles.
Key Development and Production Technologies
Oil shale production technologies fall into two broad categories: in situ and ex situ. In an in situ develop-ment, the resource is converted to oil and gas without mining the oil shale ore. In ex situ development, the ore is mined and transported to a surface retort where it is heated and converted into oil and gas.
The rich accumulations in Colorado may be best developed by in situ technologies because of high mining costs associated with thick overburden cover-ing the resource. The shallow accumulations in Utah are generally not as thick as the Colorado deposits and may be developed using ex situ mining and surface retort technologies near the resource outcrop.
Several development approaches are underway, mainly focusing on in situ techniques. Some of this work is proceeding on federal RD&D leases. The main technologies are the following:
y Heating kerogen with electric heaters down the wellbore to achieve pyrolysis of the kerogen and conversion to oil and gas, which can then flow to the surface
y Fracturing and chemical conversion of kerogen
y Mining and surface retorting to recover hydrocar-bons.
Several decades of continuing sustained research will be necessary to prove, demonstrate and deploy effective technologies to achieve material production of oil and natural gas from oil shale deposits. Such a sustained effort will require long-term commit-ment from companies and a supportive fiscal, leasing, access, and research regime from the U.S. government.
Production Potential
Many technical, environmental, and regulatory challenges will need to be met before oil shales become a significant contributor to North American oil supply.

124 prudent deVelopMent: realizing the potential of north america’s abundant natural Gas and oil resources
Experts working on this study estimated most likely 2035 production of about 25 thousand bar-rels per day. This assumes that one of the current research and pilot projects achieves technology suc-cesses allowing it to step up to commercial-scale operations.
In the low, or constrained, case 2035 production is estimated at 10 thousand barrels per day, again assuming that one project can move to commercial scale, but the pace of development would be con-strained by environmental and financial barriers.
In the high, or reasonably unconstrained, case it is assumed that enhanced policy, access, and fis-cal support for resource development will encour-age additional private capital to enter this play, and that production could grow to 150 thousand barrels per day by 2035, continuing on a slow growth curve thereafter.
Overall North American Unconventional Oil Production Outlooks
Table 1-14 summarizes the potential production pathways for the sources of unconventional oil pro-duction analyzed in this section.
Most Likely Unconventional Oil Supply Projec-tion (7 million barrels per day by 2035). The pro-jection assumes steady growth from existing supply
At the time of this report, there is no commercial bitumen production from the U.S. oil sands. There are three small pilot scale operations in Utah, operating on surface mineable deposits.
Key Development and Production Technologies
It is expected that variations of technologies used in the Canadian oil sands region can be applied in the United States; however, they will need to be adapted to fit the oil-wet nature of U.S. resources and will require smaller scale operations, given the greater resource dispersion. Surface mining techniques would be used for early development, with in situ technologies, adapted to Utah conditions, deployed later. Oil-wet and highly consolidated oil sands deposits, like those in Utah, do not necessarily require radical technol-ogy changes, but innovation and adaptation based on known technologies from Alberta.
Production Potential
A U.S. Department of Energy Task Force on Stra-tegic Unconventional Fuels, reporting in 2007, envi-sioned the potential for U.S. oil sands production to grow from zero to 350 thousand barrels per day by 2035 (with a more aggressive scenario of 500 thou-sand barrels per day). This outlook appears optimis-tic given the status of resource development, invest-ment, and current policy and regulatory frameworks.
Table 1-14. production potential from north american unconventional oil* (Barrels per day)
2009 Actual 2035 Limited 2035 Likely 2035 High
u.s. oil shale 0 0 250,000 1,000,000
Canadian oil sands 1,350,000† 3,000,000 4,500,000 6,000,000
Canadian heavy oil 382,000 135,000 250,000 350,000
u.s. oil sands 0 10,000 25,000 150,000
tight oil 265,000 600,000 2,000,000 3,000,000
Total 2,000,000 3,700,000 7,000,000 10,000,000
* the total unconventional production is weighted for the two sources of supply that are not currently commercial (oil shale and u.s. oil sands). If one reaches its full potential, it is likely the other one would not. therefore, both projections are weighted 50% in the production capacity roll-up, all others are relatively independent of each other and have 100% weightings.
† the production of bitumen is 1.49 million barrels per day, but after upgrading part of the bitumen to synthetic crude oil, some volume is lost, and overall supply is lower.

Chapter 1 - resourCes and supply 125
years. If the goal is to increase domestic oil supply and increase energy security, unconventional resources will surely need to be tapped. These types of resources necessitate supportive government policy.
Finding 1: Conflicting information on environ-mental impacts of unconventional supply, includ-ing the relative GHG emission intensity of oil sands development or water quality impacts from tight oil production, could lead to misinformed or ineffec-tive policy. As unconventional supply has a larger environmental footprint, the environmental effects associated with production growth should be consid-ered and planned for.
Recommendation 1: Provide access to inde-pendent and accurate information to support the formation of policy. Establish a Federal Advisory Committee Act (FACA) team to provide an independent forum to research and clarify aspects of unconventional supply. This will identify areas of uncertainty and illuminate facts – ensuring that government initiatives are both informed and effec-tive. The FACA committee could also contribute to the development of early, long-range planning that considers the environmental effects associated with future unconventional supply growth.
Finding 2: For unconventional sources with no production, specifically U.S. oil shale and U.S. oil sands – several ingredients that have been critical to the successful development of the Canadian oil sands are currently not in place.
Limited Access – Corporations and individuals are constrained in the ability to assemble contigu-ous leases with large resources. Without certainty in resource size, there is less incentive for companies to risk capital.
Additional Fiscal Measures to Spur Growth – Cana-dian and Alberta government participation in oil sands included broad-based science and technology research, pre-commercialization investments, favor-able fiscal terms, loan guarantees, and direct finan-cial investment over decades. The U.S. government provides vital funding for basic research, but these ideas must move from the laboratory into the field – the next critical step in resource development; fund-ing is often an issue for entrepreneurial firms, which sometimes struggle to finance high-risk field pilots. Unconventional royalties are another opportunity to
sources and successful development of new, gradually implemented technologies. U.S. oil sands and U.S. oil shale require the largest innovations, and com-mercial methods for production must be deployed. Other supply sources require ongoing improvements to existing extraction methods. Unconventional oil production is projected to reach 7 million barrels per day by 2035.
Limited Unconventional Oil Supply Projection (3.7 million barrels per day by 2035). The low pro-jection assumes production growth is slowed by a number of factors. For sources of supply with no cur-rent production (U.S. oil sands and U.S. oil shale), bar-riers to development include limited access to acre-age, and minimal financial incentives and investment capital to pursue research and eventual commercial development. For sources of supply with current pro-duction, challenged economics (higher environmental costs and environmental limits) ultimately constrain growth.
High Unconventional Oil Supply Projection (10 million barrels per day by 2035). The projection assumes a set of circumstances that would accelerate production growth. Major innovations in unconven-tional extraction occur, solutions minimize environ-mental effects, and strong government support in the United States and Canada fosters development. New technology is developed and rapidly deployed. Physical constraints are the main limits to growth – requirements to build pipeline capacity, time to build infrastructure, reasonable time to learn and ramp up capacity, water constraints, labor constraints, manu-facturing equipment or drilling constraints. In this projection – a true “stretch case” for unconventional supply – production reaches 9 million barrels per day by 2035.
Key Findings and Recommendations
For each source of unconventional oil supply, the path to eventual production will be unique. In some cases, the advance of broadly applicable oil and gas technology could lead to surprisingly rapid produc-tion growth – potentially the case for tight oil. How-ever, development of tight oil technology is likely to be the exception, not the norm. Unconventional resources require new techniques to extract the oil. Learning from the Canadian oil sands example, the yardstick for measuring the successful development and deployment of new technologies is decades – not

126 prudent deVelopMent: realizing the potential of north america’s abundant natural Gas and oil resources
an economically viable, socially acceptable, and envi-ronmentally responsible manner. Fiscal measures could include loan guarantees, severance tax incen-tives, lower royalties, accelerated capital deprecia-tion, and job creation programs (including retraining and financial support). Other ideas include up-front investments to pursue technology deployment and creative oil and gas royalty and fiscal structures that consider the higher operating and capital costs of unconventional production.
incentivize development. Current U.S. royalties are 12.5% – the same level as lower risk, established con-ventional oil production.
Recommendation 2: Create an environment that fosters innovation and results in production growth; access to acreage with sizable oil resources and long-term stable fiscal regime with federal measures to support the industry. Ideally the fiscal environment stretches over multiple decades, in order to provide the certainty to develop unconventional resources in
The shale gas revolution could take production of natural gas liquids (NGLs) supplies to unprec-edented levels. If natural gas production rises to more than 100 billion cubic feet per day by 2035 as predicted, an NGL supply increase of 60% or greater above 2010 levels could occur. This sharp rise in anticipated NGL production has broad implications for demand, infrastructure, and import/export opportunities.
NGLs are ethane, propane, normal butane, iso-butene, and natural gasoline (pentanes+), pro-duced when wellhead natural gas is processed for delivery to market. NGLS, in gaseous form at the wellhead, are extracted by chilling the natu-ral gas to very low temperatures, a process that liquefies the gases. In some cases, NGL extrac-tion is required to produce a natural gas stream that meets required pipeline or industrial speci-fications. In other cases, when the price of NGLs is higher than that of natural gas, NGLs are extracted for economic reasons.
The difference between crude oil and natural gas prices is a key driver in NGL prices. As the oil to gas price ratio grows, the value of NGLs rela-tive to gas also increases. Rising NGL prices have been a factor in recently increased rig activity in oil and liquids-rich natural gas plays such as in the Permian, Williston, and Eagle Ford basins.
Each component of an NGL barrel has a unique supply/demand profile. Ninety percent of eth-ane comes from natural gas processing plants. Demand for ethane is from petrochemical plants, which transform ethane into ethylene, an essen-tial component of plastic. Ethane is uneconomic
and difficult to export so demand is constrained to North America.
Sixty percent of propane comes from natural gas processing plants. A third goes to petrochemi-cal demand and two-thirds goes to home heating demand. Weather, ethylene prices, and export economics drive the demand for propane.
The motor fuels market drives demand for the remaining NGLs: normal butane and isobu-tane and natural gasoline. Natural gas process-ing plants produce 45% of the n-butane and 60% of the isobutane. Ninety percent or more of the butanes are used in motor fuels. Natural gas pro-cessing plants also make most of the natural gas-oline. Petrochemical plants use a third of it and refineries use two-thirds for fuels.
Current NGL infrastructure may not be large enough or interconnected enough to handle potential production growth. The market will likely respond with new investment, allow-ing NGL markets and their customers to gain significant advantages in domestic and global markets. To date, there have been announce-ments for an additional 7.8 billion cubic feet per day of processing capacity in the United States, an increase of 12%. These projects, built close to shale development, are needed even though processing plants along the Gulf Coast have 30–50% open capacity. Several projects are also underway to expand fractionation capacity by 438 thousand barrels per day by 2014. Transpor-tation and storage capacity is also expected to increase. Two NGL pipelines have been proposed to take NGLs from the Bakken to market.
Natural Gas liquids

Chapter 1 - resourCes and supply 127
2. United States Gulf Coast (part of PADD III)
3. Midwest (northern part of PADD II)
4. Rocky Mountain (the same as PADD IV)
5. Western Canada including Washington State (Washington State is currently part of PADD V)
6. Eastern Canada
7. California (currently part of PADD V)
8. Alaska (currently part of PADD V)
Figure 1-39 shows the geographical extent of the PADDs (Petroleum Administration for Defense Dis-tricts) in the United States, often used to define regional petroleum logistics and market issues. PADDs have been used to define the oil pipeline regions covered in this study.
As of 2009, the United States had approximately 55,000 miles of crude oil trunk lines (typically 8–24 inches in diameter) connecting North Ameri-can supply and market regions. This number does not include tens of thousands of miles of gathering lines used to move crude oil from production fields to trunk lines, refined products lines to move products from refinery to market, and LPG/NGL lines used to move other commodities such as propane and ethane.
Since the last NPC study on oil pipelines, conducted in 1987–1989, the United States has seen signifi-cant shifts in supply and demand for crude oil. Total imports of foreign crude into the United States have nearly doubled from just over 4.7 million barrels per day in 1987 to roughly 9 million barrels per day in 2009. This is a continuation of the trend of domestic U.S. production falling over most of the period, while oil demand increased.
One of the most significant changes in the dynam-ics of U.S. crude oil transportation has occurred over the past decade as the United States trended away from its reliance on waterborne imports, towards imports from Western Canada. Since the 1987 NPC report, U.S. imports of Canadian crude oil have tripled to nearly 2.5 million barrels per day, with nearly 40% of that growth occurring since 2000.
The most direct impact of this shift is highlighted by changes in the Midwest and Rocky Mountain regions. In the Midwest, many pipeline networks were originally established to supply domestically
Finding 3: For unconventional supply with pro-duction, primarily Canadian oil sands, develop new technologies that lower the environmental footprint and offer higher, more sustainable, oil production lev-els. For instance, Canadian oil sands have about 5–15% higher GHG emission per barrel than the average crude oil consumed in the United States. Development of new technologies to lower GHG emission intensities would help to close this gap. In turn, these technolo-gies could be implemented domestically to improve the environmental footprint of new U.S. unconventional resources (oil shale and U.S. oil sands). Investments in low or possibly zero-carbon emitting energy such as low-energy extraction methods or small-scale nuclear generation to fuel extraction, or CCS – all hold poten-tial for reducing GHG emissions.
Recommendation 3: Continue to participate in international and bilateral activities – such as the Energy Partnership of the Americas’ Heavy Oil Working Group. Identify technology areas of mutual interest between the United States and Canada – areas that target more environmentally sustainable methods of production. New technologies could result in economic opportunities for U.S. firms, while increasing energy security. New technologies will most likely advance the development, and reduce the environmental impact, of U.S. oil shale and U.S. oil sands supply and may ultimately prove use-ful to other extractive industries.
Crude Oil Pipeline Infrastructure
Overview
Oil infrastructure is critical to the North Ameri-can energy supply chain that has evolved over the last century. For the purposes of this paper, oil infrastructure is limited to pipeline transportation infrastructure available for crude oil in North Amer-ica. While marine, rail, and trucking operations can be important infrastructure components, the vast majority of North American oil supply is moved via pipeline.
A detailed regional analysis of the crude oil pipeline system is included in Topic Paper #1-7, “Crude Oil Infrastructure,” which is available on the NPC web-site. The regions covered are as follows:
1. Mid-Continent (currently part of PADD II [Petro-leum Administration for Defense Districts])

128 prudent deVelopMent: realizing the potential of north america’s abundant natural Gas and oil resources
Like the PADD I region, the West Coast Region, consisting of PADD V excluding Alaska, remains a largely separate market from the rest of the United States and faces a unique set of issues. California has no intraregional or interregional pipelines. An interregional pipeline corridor operated when the 1987 NPC study was completed, but the system has since been converted to natural gas service, a result of declining production and dwindling throughput. Regional crude oil production has fallen to less than half of what it was in the 1980s and is now less than 1.3 million barrels per day. With little historical need for waterborne import infrastructure, and the age of some facilities approaching 50 years, the Cali-fornia Energy Commission has forecasted a need for significant expansion of waterborne import facilities and tankage by 2030 to accommodate imports.
In spite of shifts in market dynamics since the previous NPC study, the Mid-Continent region, spe-cifically Cushing, Oklahoma, remains the nexus of North American crude oil supply and movements. As of 2008, Cushing holds 5–10% of total U.S. crude oil
produced light crude oil from Texas and the U.S. Gulf Coast region to large refining hubs in PADD II. Northbound corridors from Cushing, Oklahoma and St. James, Louisiana, once formed the backbone of the crude oil pipeline infrastructure in the Mid-Continent, U.S. Gulf Coast, and Midwest regions. Now, they are increasingly secondary to the growing demand for southbound capacity.
A similar situation is occurring in the Rocky Moun-tain region, where a growing surplus of light Rocky mountain crude oil supply, coupled with increasing availability of Canadian supply and lower refinery demand, has overwhelmed takeaway pipeline capac-ity on the Rockies to Midwest Interregional Corridor.
Also, growth of crude oil supplies in the U.S. Mid-Continent, coupled with growth in Canadian produc-tion, is causing an imbalance in the traditional market dynamics around the Gulf Coast region. The expected surge in future offshore domestic production com-bined with Canadian imports and the capacity of cur-rent infrastructure will likely reduce the need for the Gulf Coast to increase foreign crude import capability.
Figure 1-39. U.S. Petroleum Administration for Defense Districts (PADDs)
PADD I: EAST COAST PADD III: GULF COASTPADD II: MIDWEST PADD IV: ROCKIES PADD V: WEST COAST, AK, HI
Source: Energy Information Administration, Oil Market Basics, Appendix A, “Map of Petroleum Administration for Defense Districts.”
Figure 1-39. u.s. petroleum administration for defense districts (padd)

Chapter 1 - resourCes and supply 129
tions in corridor capacity between supply regions and demand hubs and demonstrate how the com-modities markets determine infrastructure needs.
The last 25 years has been a period of punctuated market development. Regions that had produced a relatively stable supply of crude oil began to slow. In the latter half of 2010 and the beginning of 2011, West Texas Intermediate priced at Cushing, Okla-homa, was for the first prolonged period ever priced at a significant discount to Brent and other worldwide benchmark crudes. This shows how changes in bal-ance between markets can impact crude oil pricing. Where market inefficiencies occur, industry continues to act as an effective balancing mechanism by identi-fying an economic opportunity and developing infra-structure to rebalance the market.
Public policy should continue to support existing market mechanisms and encourage the market to respond to infrastructure needs emerging in the fore-seeable future. This is the case for newly constructed or expanded infrastructure, and also when under-used pipelines need to be reversed, idled, or undergo changes in type of service.
Energy Security
Energy security is protected when markets and the industry are encouraged and able to respond swiftly to economic drivers. There is no better example of this than today’s changing North American supply and demand landscape. Rapidly growing production from Northern Alberta’s vast energy reserves is met with ample pipeline export capacity to the United States, allowing crude oil to flow to major refining districts in the Midwest, Mid-Continent, and ultimately the Gulf Coast. The robust energy supply position for North America will support energy security for the United States, as long as the necessary pipeline cor-ridors are in place to continue to link production and markets.
While changes in supply patterns across North America will favor expansion of certain corridors, declining use may merit capacity in others. Market forces will continue to support U.S. energy secu-rity even where use determines some corridors may become unnecessary. Though changing supply pat-terns are shifting towards a predominantly North-South flow from Canada into the Midwest and Mid-Continent, some degree of import capacity from the
inventory and it remains the price settlement point for the benchmark West Texas Intermediate on the NYMEX. Several major pipeline corridors service the Cushing hub, including supply from the Western Canadian Sedimentary Basin, making the Cushing hub and surrounding region strategic importance to North American market dynamics.
In addition to evolving market dynamics, pressing issues for the network of crude oil pipelines across North America include the age of existing infra-structure, combined with encroachment from urban development leading to concerns about public safety. Together these issues will likely lead to an increas-ingly stringent regulatory environment, and addi-tional capital will be required to enhance the safety and securing of oil infrastructure.
The overarching trend in oil infrastructure is the requirement to respond to shifting market dynam-ics caused by changing sources of domestic supply and evolving transfer corridor capacity requirements. Emerging alternative crude oil sources in the West-ern Canadian Sedimentary Basin and North Dakota’s Bakken play are pushing Midwest and Mid-Continent pipelines to realign existing infrastructure to back out traditional imports from the Gulf Coast in favor of growing supply from the north.
Key Findings
As a whole, the petroleum pipeline industry and infrastructure network will face a number of common challenges over the next 50 years. Industry, policy-makers, and regulatory bodies must be mindful of these challenges to ensure a balance of diligence and efficiency that will best serve the interests of petro-leum producers and consumers.
Changing Market Dynamics and Public Policy
Since the 1987 NPC oil pipeline study, the petro-leum transportation industry has responded to the needs of a changing North American crude oil mar-ket landscape. Declining crude oil production in regions such as PADDs III and V has been offset by offshore imports, or U.S. imports from western Can-ada. Refinery rationalization and Canadian imports in recent years have led to increased reliance on PADD II refinery hubs in Chicago and Wood River. Such shifts have been met with expansions or reduc-
130 prudent deVelopMent: realizing the potential of north america’s abundant natural Gas and oil resources
If and when a decision is made to idle or abandon a pipeline, determinations about the remediation of the asset must be made. From an environmental and social perspective it may or may not be in the public’s interests to remove a pipeline and fully remediate a right of way. Such decisions will be dependent on the specific region or environment and the local munici-palities.
Aging Infrastructure
Much of the pipeline infrastructure in North Amer-ica was laid well before the last NPC oil pipeline study was conducted in 1987. In 2010, several existing systems are already 50 years old with no plans to be decommissioned based on asset age alone. On systems where asset integrity remains high, and market demand still necessitates infrastructure, there is no reason to retire assets so long as adequate mainte-nance and integrity programs can guarantee system safety.
Asset integrity cannot be directly predicted by age alone, but, as time passes, overall infrastructure and integrity issues could become more common with age. Among age-related challenges are:
y Internal and external pipeline coating issues
y External corrosion
y Third-party damage
y Weld seam failures
y Specific integrity issue around flash welded pipe.
These challenges are cause for concern not only because of public safety risk, but because of heavy reliance on pipeline infrastructure in the North American economy. The U.S. relies on a small number of key pipeline transportation corridors. Mitigation and integrity programs are in place, but these pro-grams may result in increased operating and mainte-nance costs. Downtime for planned maintenance will increase and be accompanied by an increased risk of apportionment on key pipelines.
Regulatory Challenges
Development of new or greenfield pipeline projects often faces procedural challenges because of a compli-cated regulatory environment in the United States. The lack of overarching federal oversight in the oil pipeline permitting process leaves potential projects subject to a patchwork of required state level environ-mental, regulatory, and commercial approvals.
U.S. Gulf Coast into those regions should remain available. Economics and pricing dynamics dictate that the throughput on those corridors will continue to act as a balancing mechanism for pricing hubs. This will ensure that imports from the Gulf Coast or the Strategic Petroleum Reserve will be available to the Mid-Continent and Midwest even if the majority of supply originates in the Western Canadian Sedimen-tary Basin or the Bakken play.
Existing Infrastructure Use
Changing market dynamics between regions impacts existing infrastructure use. For most of the past 50 years, pipeline infrastructure was oriented in a south-north alignment. However, increasing sup-ply from Canada coupled with falling supply from traditional production regions is causing a reversal to north-south orientation.
This shift, along with other changes in market dynamics resulting from shifting crude oil supplies, has resulted in a number of reversals, conversions, and idling of existing systems. For some pipelines, this means using existing infrastructure with com-modities for which they were not originally designed. While this is not a significant issue, it is important for the industry to be responsive to how a pipeline’s original design parameters combine with its current operation.
In other regions, supply and demand shifts have resulted in significantly underused lines. Situa-tions have emerged where one or two shippers will continue to rely on a pipeline, but capacity demand remains consistently below the pipeline’s economic threshold. In cases where demand on an existing pipeline falls below optimal flow rates, the question begs whether the asset ought to remain in service at a sub-optimal flow rate with potentially prohibitive operating economics, or whether the asset ought to be idled entirely.
In these instances the pipeline service provider is left in a challenging predicament. Economics around a particular asset may no longer be favorable to con-tinued operation, but the provider is left open to ship-per and regulatory scrutiny for the adverse impact the asset’s idling or abandonment may have on another business. Such cases need to be carefully examined in Canada and the United States and the benefit to one party must be weighed carefully against the harm to another.

Chapter 1 - resourCes and supply 131
environmental approvals should not be provided. In these cases, federal mandate is required to show that the project serves the public’s interests, albeit at a national rather than state level.
State permitting processes multiply the number of separate and unique approvals required for each individual project. This increases the costs and time required for the development of new projects and introduces significant commercial risk that one state
In some cases, the public benefit of a project is clear on the national level, but less so at the state level. For example, an oil pipeline connecting supply in one region to demand in another may easily travel through one or more states without any intermedi-ate receipts or deliveries. However, states between the origin and destination may see no immediate eco-nomic benefit to residents or businesses. At the state level it may be determined that with no immediate and primary benefit to local residents, regulatory and
Mexico has been, and continues to be, an impor-tant trading partner with the United States for energy. In particular, of most relevance to this study, there is long-standing trade in crude oil and natural gas to the benefit of both countries.
In 2010, Mexico exported 1.15 million barrels per day of crude oil to the United States. As such, the country was the second largest crude oil sup-plier to the United States, after Canada (and ahead of Saudi Arabia, Nigeria, and Venezuela). This underlines Mexico’s importance as a North Ameri-can crude oil producer and supplier. Mexico’s crude oil production in 2010 was 2.96 million barrels per day. This has declined in recent years (from its high-est level of 3.82 million barrels per day in 2004) as large fields, particularly the offshore Cantarell field in the Bay of Campeche, have begun to decline, and output from newer fields has not grown sufficiently to offset this decline. Even so, newer develop-ments, such as the nearby Ku-Maloob-Zaap fields, now produce more than Cantarell. Onshore devel-opments, such as the Chicontepec fields, have been considered as a future source of production growth potential, but have not yet become large contribu-tors to Mexico’s crude oil production.
Prospects for continuing availability to the United States of significant crude oil supplies from Mexico will depend on Mexico’s ability to reverse the recent decline in overall crude oil production, at a rate which also exceeds Mexico’s own internal market needs.
With regard to natural gas, Mexico is a net importer, mainly by pipeline from the United States, although, in recent years, Mexico has added capacity to import LNG from international mar-
kets, with terminals both on its east coast and west coast. In 2010, Mexico’s net natural gas imports from the United States were 0.83 billion cubic feet per day, representing almost 12.5% of Mexico’s gas demand. Mexico has significant, and growing, nat-ural gas production, which in 2010 totaled 5.3 bil-lion cubic feet per day. However, Mexico’s natural gas demand is growing at a faster rate than its pro-duction, leading to an increased need for imports, of which the United States supplies the most sig-nificant share. There is a well-established set of natural gas pipeline interconnections between the United States and Mexico, allowing this trade to continue and expand.
However, recent trends in Mexican oil and natu-ral gas production and consumption indicate that the relationship between the United States and Mexico will be quite different in the future. Sig-nificant recent declines in Mexican oil produc-tion alongside rising domestic demand will likely restrict Mexico’s ability to export oil to the United States in the medium and long term. Increasing internal Mexican demand for natural gas, mostly as a result of rising electricity demands, will raise Mexican demand for imported natural gas from the United States and for liquefied natural gas from other countries. These market dynamics will take place in a context where the Mexican govern-ment will be assessing its long-standing frame-work for hydrocarbons production that restricts private investment in the sector. However, even important energy sector liberalization in Mexico is unlikely to lead to quick change in Mexican oil and natural gas production trends, as the lag time between investment and production can be quite long.
Mexico Oil and Gas

132 prudent deVelopMent: realizing the potential of north america’s abundant natural Gas and oil resources
ral gas supply, and includes an overview of the con-text and production history, where applicable, the key technologies required for development, potential production pathways to 2035 and beyond, and an out-line of the key findings. The section concludes with an overview of the natural gas infrastructure system required to deliver this supply to market. Each of these topics is described in more detail in topic papers that are available on the NPC website.
Unlike oil, natural gas from the United States and Canada has supplied the vast majority of mar-ket needs in the region over the past 50 years. Both nations are large natural gas producers, but produc-tion and development activities have been almost exclusively directed towards serving the North American market. With one exception (Alaska LNG, operational since 1969), only recently have serious proposals been put forward regarding the potential to export North American gas into global markets. Indeed, this was preceded by several years in which facilities to import LNG were developed on a large scale, in anticipation of domestic supply falling short of meeting market growth in the United States and Canada.
Onshore natural gas, from both conventional and unconventional reservoirs, forms the vast majority of current and future supply potential. Supply pros-pects have been transformed in recent years as natu-ral gas companies have applied technology to develop gas supplies that could not previously be produced in economic quantities, particularly from shale gas basins. In addition, large actual and potential produc-ing natural gas supplies from offshore and the Arctic are discussed below.
Offshore
Development and Production History and Context
U.S. Lower-48 Offshore
The offshore has been an active and important contributor to North American natural gas and oil supply, as described in a previous section. Natural gas activity has been almost exclusively located in the central and western zones of the Gulf of Mexico, although significant resources and production poten-tial are known to exist in other offshore areas.
may approve a project while another firmly disap-proves it.
As infrastructure demands from continental regions such as the oil sands grow and aging infra-structure requires replacement, a streamlined federal level permitting process will be of greater value.
Public Perceptions
With continued urban growth, a growing percent-age of pipeline right-of-way is in close proximity to residential and commercial development. As this trend continues it will be crucial to ensure public awareness of the facilities and to manage public per-ceptions around leak detection.
Challenges in the oil transportation industry have highlighted vulnerabilities in leak detection technol-ogy and reminded home and business owners of the facilities in their area. As the average age of North America’s pipeline network rises, it is important to work with municipalities to ensure emergency response plans are up to date and to educate indi-viduals and businesses near pipeline facilities of the importance of “Call Before You Dig” programs and who to notify if they suspect a leak.
Security and Protection of Pipeline Assets
In 2009, there were approximately 55,000 miles of crude oil trunk lines (typically 8–24 inches in diam-eter) and tens of thousands of miles of additional feeder lines, gas lines, and natural gas liquids pipe-lines in the United States. The challenges around pipeline surveillance and the volume and volatility of the liquids transported through pipelines place them at a high risk for severe social and environmen-tal fallout should pipeline integrity be compromised accidentally or intentionally. Beyond the immediate physical consequences of a severe pipeline disruption, the economic ramifications of taking a major pipeline corridor offline even temporarily could be far reaching and result in crude oil shortages, refinery shutdowns, and market disruptions.
PROSPeCTS FOR NORTh AMeRICAN GAS DevelOPMeNT
OverviewEach major heading in this section describes one
segment of this portfolio of current and future natu-

Chapter 1 - resourCes and supply 133
As with oil, a shift in development focus from the shallow water Continental Shelf of the Gulf of Mexico to the deepwater frontier zones (with water depths greater than 1,000 feet) began in the mid-1990s, and accelerated after 2000. This trend is expected to con-tinue as more discoveries and drilling activities occur in the deepwater and ultra-deepwater areas of the Gulf of Mexico. Beginning around 2000, the Gulf of Mexico’s shallow water gas production has markedly declined while deepwater production has increased. Deepwater natural gas production rose from 382 Bcf, or 7.5%, of total Gulf of Mexico production in 1997 to around 1.4 Tcf in 2004, or 35%, of total Gulf of Mex-ico natural gas production.
Apart from the central and western zones of the Gulf of Mexico, other offshore areas in the U.S. lower-48 were subject to congressional moratoria from 1982 to 2008. After these moratoria expired,
Natural gas production from the federal offshore grew from about 0.06 Tcf in 1954 to a maximum of around 5.2 Tcf in 1997, accounting for just over 25% of total U.S. natural gas production at that time. Since then, federal offshore natural gas production has declined to around 2.4 Tcf in 2009, or 11% of total U.S. gas production. Figure 1-40 shows gas produc-tion as a percentage of total U.S. production from 1960 to 2009.
Currently, U.S. lower-48 offshore oil and gas pro-duction is restricted to the Gulf of Mexico and the Pacific OCS shelf regions. Much of the eastern Gulf of Mexico is expected to be restricted to drilling until 2022, and the Pacific and Atlantic OCS areas were restricted from leasing consideration up until 2008. For the purposes of this study, oil and gas develop-ment on the Alaska OCS is included in analysis of the Arctic region, rather than the U.S. offshore region.
Figure 1-40. O�shore Gas Production as a Percentage of Total U.S. Production, 1960–2009
0
10
20
30
0
2
4
6
1960 1965 1970 1975 1980 1985 1990 1995 2000 2005 2010
PERC
ENTA
GE
TRIL
LIO
N C
UBI
C FE
ET P
ER Y
EAR
YEAR
1980 – First �ve-year leasing program initiated1981 – OCS moratoria begins
12
1982 – Onset of area-wide leasing3
1995 – Passage of deepwater Royalty Relief Act42008 – Expiration of OCS leasing moratoria5
1 2 3 4 5
FEDERAL OUTER CONTINENTAL SHELF (OCS) FEDERAL OCS PERCENTAGE OF TOTAL U.S. PRODUCTION
Sources: Total U.S. production data obtained from the Energy Information Administration’s Monthly Energy Review and federal o�shore data obtained from the O�ce of Natural Resources Revenue; Bureau of Ocean Energy Management, O�shore Stats and Facts.
Figure 1-40. offshore Gas production as a percentage of total u.s. production, 1960–2009
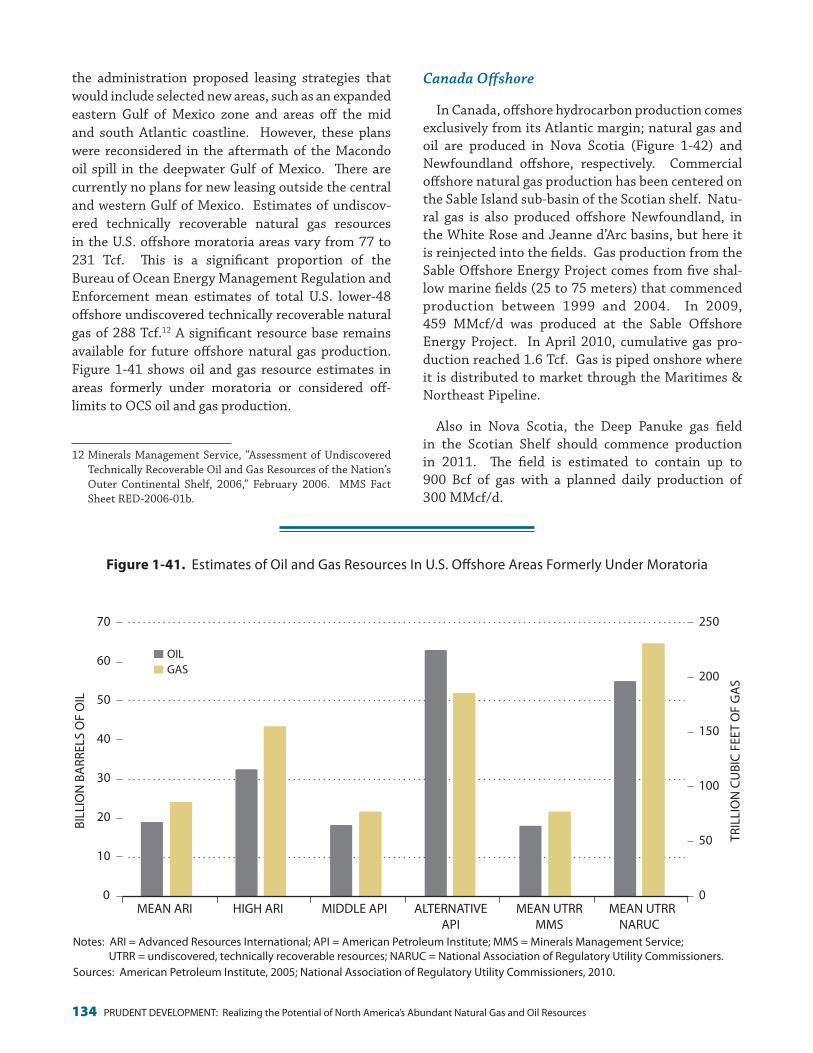
134 prudent deVelopMent: realizing the potential of north america’s abundant natural Gas and oil resources
Canada Offshore
In Canada, offshore hydrocarbon production comes exclusively from its Atlantic margin; natural gas and oil are produced in Nova Scotia (Figure 1-42) and Newfoundland offshore, respectively. Commercial offshore natural gas production has been centered on the Sable Island sub-basin of the Scotian shelf. Natu-ral gas is also produced offshore Newfoundland, in the White Rose and Jeanne d’Arc basins, but here it is reinjected into the fields. Gas production from the Sable Offshore Energy Project comes from five shal-low marine fields (25 to 75 meters) that commenced production between 1999 and 2004. In 2009, 459 MMcf/d was produced at the Sable Offshore Energy Project. In April 2010, cumulative gas pro-duction reached 1.6 Tcf. Gas is piped onshore where it is distributed to market through the Maritimes & Northeast Pipeline.
Also in Nova Scotia, the Deep Panuke gas field in the Scotian Shelf should commence production in 2011. The field is estimated to contain up to 900 Bcf of gas with a planned daily production of 300 MMcf/d.
the administration proposed leasing strategies that would include selected new areas, such as an expanded eastern Gulf of Mexico zone and areas off the mid and south Atlantic coastline. However, these plans were reconsidered in the aftermath of the Macondo oil spill in the deepwater Gulf of Mexico. There are currently no plans for new leasing outside the central and western Gulf of Mexico. Estimates of undiscov-ered technically recoverable natural gas resources in the U.S. offshore moratoria areas vary from 77 to 231 Tcf. This is a significant proportion of the Bureau of Ocean Energy Management Regulation and Enforcement mean estimates of total U.S. lower-48 offshore undiscovered technically recoverable natural gas of 288 Tcf.12 A significant resource base remains available for future offshore natural gas production. Figure 1-41 shows oil and gas resource estimates in areas formerly under moratoria or considered off- limits to OCS oil and gas production.
12 Minerals Management Service, “Assessment of Undiscovered Technically Recoverable Oil and Gas Resources of the Nation’s Outer Continental Shelf, 2006,” February 2006. MMS Fact Sheet RED-2006-01b.
Figure 1-41. Estimates of Oil and Gas Resources in U.S. O�shore Areas Formerly under Moratoria
0
50
100
150
200
250
0
10
20
30
40
50
60
70
MEAN ARI HIGH ARI MIDDLE API ALTERNATIVE API
MEAN UTRR MMS
MEAN UTRRNARUC
TRIL
LIO
N C
UBI
C FE
ET O
F G
AS
BILL
ION
BA
RREL
S O
F O
IL
GASOIL
Notes: ARI = Advanced Resources International; API = American Petroleum Institute; MMS = Minerals Management Service; UTRR = undiscovered, technically recoverable resources; NARUC = National Association of Regulatory Utility Commissioners. Sources: American Petroleum Institute, 2005; National Association of Regulatory Utility Commissioners, 2010.
Figure 1-41. estimates of oil and Gas resources In u.s. offshore areas Formerly under Moratoria

Chapter 1 - resourCes and supply 135
and a reasonably constrained production outlook, or limited potential case, have been examined. These reflect the enablers and challenges to offshore devel-opment identified by the NPC expert subgroup and by respondents to the data survey.
The high potential pathway is characterized by a favorable economic environment, with increased access to offshore lands, accelerated technological progress, and favorable government policies towards offshore development. Conversely, the limited poten-tial pathway assumes more limited access to offshore zones, slower technological improvement, and a more stringent policy and regulatory environment.
As with offshore oil supply outlooks, alternate cases published in the EIA’s Annual Energy Out-look have examined environments of expanded off-shore access, accelerated technology deployment, and high prices that would affect prospects for nat-ural gas (see Figures 1-43, 1-44, and 1-45). These characterize the high potential offshore natural gas production pathway. Production of natural gas in U.S. lower-48 offshore trends from a minimum of 2.4 Tcf in 2010, in the reference case, to a maximum of
As in the U.S. lower-48, other offshore areas in Canada are subject to moratoria and other similar restrictions on exploration and development activity. These are discussed in the oil offshore section above.
Key Development and Production Technologies
Offshore oil and natural gas resource develop-ment has been characterized by continuous technol-ogy development and innovation, appropriate for moving into greater water-depths, high-pressure, high-temperature subsurface environments, and complex geological settings. Because most of these technologies are developed and deployed for both oil and natural gas production, discussion of them is included in the offshore oil potential section of this chapter.
Production Potential Pathways
U.S. Lower-48 Offshore
For the U.S. lower-48 offshore, a reasonably uncon-strained production pathway, or high potential case,
Figure 1-42. Monthly O�shore Gas Production – Nova Scotia
0
4
8
12
16
20
2000 2001 2002 2003 2004 2005 2006 2007 2008 2009 2010 2011
BILL
ION
CU
BIC
FEET
PER
MO
NTH
SOUTH VENTURE ALMA NORTH TRIUMPH VENTURE THEBAUD
This �gure replaces the version found in 8/24 draft per Thierno Sow;could not recreate original art, source could not be found by author
Source: Canada-Nova Scotia O�shore Petroleum Board – Sable O�shore Energy Project.
Figure 1-42. Monthly offshore Gas production – nova scotia

136 prudent deVelopMent: realizing the potential of north america’s abundant natural Gas and oil resources
Figure 1-44. Projection of U.S. Lower-48 O�shore Gas Production – High Natural Gas Production Pathway
0
1
2
3
4
5
2010 2015 2020 2025 2030 2035
TRIL
LIO
N C
UBI
C FE
ET P
ER Y
EAR
YEAR
AEO2010 (REFERENCE CASE 2010)AEO2011 (REFERENCE CASE 2011) AEO2011 (HIGH OCS RESOURCE CASE 2011)
AEO2011 (HIGH PRICE CASE 2011)
Note: OCS = Outer Continental Shelf.Sources: Energy Information Administration’s AEO2010 Reference Case and AEO2011 Reference Case.
Figure 1-43. Projection of U.S. Lower-48 O�shore Gas Production – Impact of Reduced Access
0
1
2
3
4
5
2010 2015 2020 2025 2030 2035
TRIL
LIO
N C
UBI
C FE
ET P
ER Y
EAR
YEAR
AEO2010 (REFERENCE CASE 2010)AEO2011 (REFERENCE CASE 2011)
AEO2011 (REDUCED OCS ACCESS 2011)
Note: OCS = Outer Continental Shelf.Sources: Energy Information Administration’s AEO2010 Reference Case and AEO2011 Reference Case.
Figure 1-44. projection of u.s. lower-48 offshore Gas production – high natural Gas production pathway
Figure 1-43. projection of u.s. lower-48 offshore Gas production – Impact of reduced access

Chapter 1 - resourCes and supply 137
Gulf of Mexico providing the technical challenges are overcome.
With respect to the limited potential production outlook, the EIA’s low price case is an indicator of the impact of the multiple factors that could affect pro-duction. Natural gas production forecasts vary from 2.6 Tcf in 2010, in the low oil price Case, to 4.3 Tcf in 2035, in the AEO2010 reference case. Results of the AEO2011 show gas production ranging from 2.4 Tcf in 2010 to 2.1 Tcf in 2035, in the low oil price case. That trend translates into a growth rate range of neg-ative 1.1% per year in the Gulf of Mexico and nega-tive 0.6% per year in the Pacific region. The reference case of the AEO2011 shows natural gas production increase from 2.4 Tcf in 2010 to 3.1 Tcf in 2035. That trend represents an annual growth rate of 0.4% in the Gulf of Mexico and 3.5% in the Pacific region. Over-all, the range of annualized growth rate of natural gas production in the constrained case path is negative 1.1% to positive 0.4%.
As in the case of oil, if widespread long-term off-shore development moratoria are reinstated, leading to no development offshore outside of the central
3.8 Tcf in 2035 in the high price case, according to the AEO2011. That translates into an annual growth rate range of 0.4 to 0.7%.
Similar to oil, much of the expected increase in U.S. offshore natural gas production is likely to come from new discoveries in the Gulf of Mexico, such as the Lower Tertiary trend. The extent of the effects of the Lower Tertiary trend on expansion of offshore gas resources is exemplified by the McMoRan discovery of the Davy Jones field, located in 20 feet of water at a total reservoir depth of nearly 30,000 feet. Although shallower, conventional horizons of the Gulf of Mex-ico Shelf have been heavily produced, only a small percentage of wells have been drilled to more than 15,000 feet below the mud line. McMoRan’s Davy Jones prospect is believed to hold at least 1 Tcf of gas. This discovery demonstrates that hydrocarbon-saturated Lower Tertiary formations exist not only in remote, deepwater locations, but also closer to shore, where development requires less time and money, and infrastructure is in place. A number of other Lower Tertiary play prospects, scheduled to come online between 2010 and 2020, hold the promise of a significant increase in natural gas production in the
Figure 1-45. Projection of U.S. Lower-48 O�shore Gas Production – Low Natural Gas Production Pathway
0
1
2
3
4
5
2010 2015 2020 2025 2030 2035
TRIL
LIO
N C
UBI
C FE
ET P
ER Y
EAR
YEAR
AEO2010 (REFERENCE CASE 2010)AEO2011 (REFERENCE CASE 2011) AEO2011 (HIGH OCS COST CASE 2011)
AEO2011 (LOW PRICE CASE 2011)
Note: OCS = Outer Continental Shelf.Sources: Energy Information Administration’s AEO2010 Reference Case and AEO2011 Reference Case.
Figure 1-45. projection of u.s. lower-48 offshore Gas production – limited natural Gas production pathway
138 prudent deVelopMent: realizing the potential of north america’s abundant natural Gas and oil resources
ultra-deepwater environments that lack basic infrastructure needed to produce and to transport the hydrocarbons to shore.
y Canadian offshore production of natural gas is low in comparison to the U.S. lower-48, and is confined to the eastern shore in Newfoundland and Nova Scotia. Removal of the formal and de facto mora-toria will provide opportunities to increase natu-ral gas development and production in offshore Canada.
Arctic
History and Context
The section on Arctic oil, earlier in this chapter, describes the geographical scope of the Arctic as used for this study and includes a map of the region stud-ied. This section of the work looked at the regions of Alaska, Canada, and Greenland subject to ice condi-tions that impact hydrocarbon exploration and devel-opment activities.
As with oil, this Arctic region contains very substan-tial natural gas recoverable resources that can justifi-ably be termed as a world-scale natural gas resource region. The discovered undeveloped and technically recoverable undiscovered volumes from Alaska, Arc-tic Canada, and Greenland are currently estimated at about 670 Tcf, on a mean, risked basis. This estimate is roughly equal to the oil resource on an energy equiva-lent basis. Figure 1-46 shows how this resource is dis-tributed across the major basins of the region. And Figure 1-47 shows how this resource is proportionately split between Alaska, Arctic Canada, and Greenland, including those areas under drilling moratoria or oth-erwise unavailable for leasing.
The long history of onshore and offshore oil and gas leasing, licensing, and exploration drilling in the Arctic region has resulted in the discovery of significant oil and gas reserves. Some reserves have been developed and produced, most notably the giant oil and gas field at Prudhoe Bay on the Alaska North Slope and the large oil and gas fields (onshore and offshore in Cook Inlet, Alaska). There are also numerous stranded discoveries (no develop-ment/production facilities and/or pipelines) such as the Burger discovery in the U.S. Chukchi Sea. This region also is believed to contain significant undis-covered volumes, based on numerous government agency estimates and supported by industry interest
and western zones of the Gulf of Mexico, overall natural gas production could be 20% lower than this outlook.
Key Findings
Comprehensive review of North American offshore oil and gas facts and prospects has led us to the fol-lowing findings:
y Natural gas development and production in the U.S. lower-48 is significant, and may deliver posi-tive production growth to 2050. Annual growth rate of offshore natural gas production is expected to range from negative 1.1% to positive 0.7% through 2035.
y According to the AEO2011, natural gas production in the U.S. lower-48 offshore is expected to decline from 2.4 Tcf in 2010 to 2.1 Tcf in 2035 in the low price case. Overall, U.S. lower-48 offshore natural gas production is also expected to rise from 2.4 Tcf in 2010 to 3.8 Tcf in 2035 in the high oil price case.
y Beginning around 2020 and extending to 2050, we expect the bulk of natural gas production in the lower-48 offshore to originate from the deepwater Gulf of Mexico, the Gulf of Mexico Lower Tertiary formations, and the Pacific and the Atlantic off-shore regions.
y Government policies favorable to accessing addi-tional U.S. lower-48 offshore lands are needed to reach natural gas development and production growth rates stated above.
y We expect a slow down and a postponement of off-shore natural gas development and production if unduly constraining operation safety requirement and stringent environmental policies are imple-mented in the OCS following the Macondo oil spill in the deepwater Gulf of Mexico.
y Technological progress and innovation are the key factors that would enable development and production of natural gas in new frontier regions located in deep water and in deeper reservoirs.
y Seismic innovative technologies that allow clearer imaging of the subsalt horizons in the Gulf of Mexico are pivotal to the expansion of hydrocar-bon resources via additional newer discoveries.
y Subsea technology and an extended architecture system will boost production of offshore natu-ral gas in remote and challenging deepwater and

Chapter 1 - resourCes and supply 139
Figure 1-47. Split of Arctic Natural Gas Resource Potential
Note: Discovered undeveloped plus undiscovered (mean risked, technically recoverable) resources.
GREENLANDAVAILABLE 21%
CANADAAVAILABLE
28%
ALASKAAVAILABLE
38%
ALASKA MORATORIAAREA 5%
ALASKA POTENTIALLY AVAILABLE FOR LEASE 2%
CANADAUNAVAILABLE 5%
GREENLANDUNAVAILABLE 1%
ALASKA'S TOTAL SHARE 45%
CANADA'S TOTAL SHARE 33%
GREENLAND'STOTAL SHARE
22%
Figure 1-47. split of arctic natural Gas resource potential
Note: Discovered undeveloped plus mean risked, technically recoverable, undiscovered resources.
ARCTIC CIRCLE
TRILLION CUBIC FEET OF GAS INTERNATIONAL BOUNDARYDISPUTED ZONE
2
19.6
8.2
25
8.5
90.8
112.1
33.5
76.1
40
10.2 86.2
33.741.2
66
Figure 1-46. Arctic Gas Potential by Basin
Figure 1-46. arctic Gas potential by Basin

140 prudent deVelopMent: realizing the potential of north america’s abundant natural Gas and oil resources
in 2010 following the Macondo oil spill in the deep-water Gulf of Mexico. The combined BOEMRE and USGS total mean estimate of risked, undiscovered, technically recoverable natural gas resources for the Beaufort Sea is 33.5 Tcf gas. The Chukchi Sea is also significantly underexplored but is estimated to hold 76.8 Tcf of risked, undiscovered, technically recov-erable resources of natural gas. Previous offshore exploration wells have demonstrated the occurrence of natural gas, as described by BOEMRE, in both of these basins (Burger, Kuvlum, Hammerhead, Sand-piper, Seal, and Tern).
Central Alaska Onshore
This region contains several basins of possible interest (Yukon Flats and Nenana Basin) but lacks significant subsurface data. Various assessments suggest that this region could contain natural gas (5–11 Tcf).
South Alaska Onshore and Cook Inlet
The Cook Inlet Basin covers some 15,000 square miles; almost half are offshore. The Cook Inlet onshore and state waters area has more than 300 exploration wells and numerous mature fields, both onshore and offshore, that have produced oil and gas since the early 1900s. New exploration in this basin waned after the 1968 giant Prudhoe Bay Field discovery in north Alaska. The basin is generally con-sidered a mature province. The mean, risked, undis-covered, technically recoverable resources for the Cook Inlet area are 25 Tcf of natural gas. The other basins in this region (Aleutian Peninsular [onshore Bristol Bay and State Waters], Gulf of Alaska [onshore and State waters], and Copper River) are believed to have undiscovered reserve potential but lack a mod-ern resource assessment. Exploration wells have been drilled in these basins (Aleutian Peninsular, 36 wells; Copper River, 11 wells; and Gulf of Alaska onshore and state waters, 55 wells) but have not so far yielded a commercial discovery.
South Alaska Offshore
The Bering Shelf, North Aleutian Basin and Pacific Margin have been assessed as very prospective for natural gas resources. The Bering Shelf has 19.6 Tcf of technically recoverable natural gas resources includ-ing 8.6 Tcf on the Aleutian shelf, while the Pacific Margin has a further 8.2 Tcf. The Aleutian Shelf plan-ning area was considered for leasing within the 2007–
(leasing/licensing, historical 2D seismic and mod-ern but limited 3D seismic, and renewed attempts to secure regulatory permission to drill particularly in the offshore). Most of the significant yet-to-be-found volumes are believed to be contained in the offshore, beneath the continental shelf. Unlike oil, there has not been major natural gas production in the Arctic, except within the Cook Inlet region of Alaska, mainly as the large proved reserves under the Prudhoe Bay and Point Thomson fields on the Alaska North Slope and the fields on the Mackenzie Delta have been unable to access the market as a result of lack of pipeline infrastructure.
Following is a brief summary of the development and production history for the most significant of the main Arctic areas under consideration.
North Alaska Onshore
Exploration drilling in this region began in 1945 and discovered only non-commercial hydrocarbons until the discovery of the giant Prudhoe Bay field in 1968. This field contained recoverable reserves of 15 billion barrels of oil and 27 Tcf of natural gas. Oil has been produced from this field since 1977, but the produced associated natural gas has not been com-mercialized due to the lack of a gas pipeline, and the bulk of the produced gas has been and still is reinjected back into the producing reservoir to enhance ongoing oil recovery. Significant stranded gas (~8 Tcf) has also been discovered at Pt. Thomson Field along the coastal plain near the ANWR 1002 area. Many of the more than 400 exploration wells drilled on or around the North Slope coastal plain have shown non-associated gas, particularly in the southern part of the region. In addition, prospective areas outside of the North Slope Coastal Plain (NPR-A, North Slope Foothills and the ANWR 1002 area) are significantly underexplored. Further, it is expected that the NPR-A and North Slope Foothills region may have a higher endowment of gas than oil.
North Alaska Offshore
There are 186 active leases in the Beaufort Sea, most of which were issued following U.S. federal lease sales held in 2005 and 2007. In the Chukchi Sea, 487 leases were issued following a U.S. federal lease sale in 2008. However, these leases had not yet been drilled as of mid 2011, as a result of issues outside the control of lessees, up to and including the suspension of authorizations for Arctic drilling

Chapter 1 - resourCes and supply 141
ventional oil and gas potential resides in immediately offshore basins with little potential in the adjacent onshore areas. No quantitative assessments have been conducted for the south and southeastern offshore margin of Greenland. The offshore acreage in Greenland is administered by the Greenland Bureau of Minerals and Petroleum.
Technology
From the perspective of hydrocarbon exploration, development, and production, natural gas activities in the Arctic are subject to similar considerations as those for oil, described in the Arctic oil section of this chapter. Natural gas development in the Arctic faces the additional challenge of required long-distance pipelines to access markets in Canada and the United States. Natural gas is not currently exported off the North Slope, Mackenzie Delta/Canadian Beaufort, Arctic Islands/Sverdrup Basin, or Labrador Shelf because there is no gas pipeline infrastructure to transport the gas to markets. Alternatives such as tankering gas in the form of LNG or building a gas-to-liquids plant which could convert the natural gas to a higher density liquid product for transport through the TAPS system have reportedly been studied, but until recently have not been deemed economi-cally competitive. Recent activity has been directed toward developing the concept of a natural gas pipe-line to move natural gas to market, as witnessed by the Denali, TransCanada and Mackenzie Valley gas pipeline proposals of recent years. Until export capa-bilities are developed for the Alaska North Slope, the majority of the gas will continue to be reinjected into the producing reservoirs to enhance oil production, and used locally for energy and heating. Meanwhile, Mackenzie Delta and Canadian Beaufort gas remains unproduced.
Potential Production Pathways
Given that no overall North American Arctic sup-ply outlooks could be found in the public domain (although there are a few basin-specific analyses for portions of Alaska and the Canadian Arctic), the Arc-tic Subgroup developed three consensus cases: Lim-ited Potential (reasonably constrained), Most Likely, and High Potential (reasonably unconstrained). The adjective “reasonably” is used with care; it does not imply that all constraints are either present or removed. It represents the Subgroup’s informed view of what may happen to Arctic development through
2012 5-Year Leasing Program. However, OCS Sale 214, scheduled for 2011, was removed from the sale schedule by the Secretary of the Interior in the spring of 2010 and the area is now under a Presidential with-drawal from lease sales till June 2017.
Canadian North
The Canadian North region contains onshore basins in British Columbia, Yukon, Northwest Ter-ritories, and Mackenzie Delta region, as well as the offshore Canadian Beaufort Sea area, Arctic Islands/Sverdrup Basin area. The National Energy Board of Canada estimates the mean, risked, undiscovered, technically recoverable resources for the Canadian North Onshore basins as containing 1 Tcf gas. The NEB estimates the mean, risked, undiscovered, technically recoverable resources for the Mackenzie Delta/Canadian Beaufort Basin area as containing 52 Tcf gas. The NEB estimates mean, risked, undis-covered, technically recoverable resources for the Arctic Islands/Sverdrup Basin as containing 28 Tcf gas. In addition, the USGS has assessed the Canadian Beaufort Outer Continental Slope region (outboard of the Canadian Beaufort and Arctic Islands/Sver-drup Basin areas) and estimates mean, risked, undis-covered, technically recoverable resources of 15.1 Tcf.
Canadian East
The Canadian East region is divided into the Cana-dian Baffin Bay area (adjacent to the West Greenland) and the Labrador/Newfoundland Shelf. The southern limit of the study area excludes the Scotian Shelf and associated developments at Sable Island, where natu-ral gas has been produced over the last decade. The Canadian Baffin Bay area is estimated to have a mean, risked, undiscovered, technically recoverable natural gas resource of 33.7 Tcf, based on ascribing 45% of the USGS analysis of the West Greenland-East Canada “Baffin basin” to the Canadian portion of this region, while the Labrador-Newfoundland shelf is estimated to hold 57 Tcf of natural gas.
Greenland
The natural gas resources on the Continental mar-gin offshore Greenland are estimated as follows; West Greenland 41.2 Tcf, North Greenland 10.2 Tcf, and the East Greenland Rift Basins 86.2 Tcf, based on ascribing 55% of the USGS analysis of the West Green-land-East Canada “Baffin Basin” to the Greenland por-tion of this region. The USGS believes most of the con-

142 prudent deVelopMent: realizing the potential of north america’s abundant natural Gas and oil resources
It should be noted that the Arctic Subgroup’s gas production cases for Alaska may be conservative, as compared to a published analysis by Northern Eco-nomics suggesting that the U.S. Beaufort and Chuk-chi OCS regions are capable of significant natural gas production if the reported undiscovered hydro-carbon resource assessment by the BOEMRE is vali-dated by future exploration and appraisal drilling. The Northern Economics gas production forecast is contained in Table 1-7 and Figures 1-29 and 1-30 (pages 99-100).
Key Findings
The key findings and recommendations relative to Arctic development are included in the Arctic oil section earlier in this chapter. There are no further specific findings and recommendations relating only to Arctic natural gas.
Onshore GasProduction History and Context
The onshore natural gas component of North American supply includes both conventional and unconventional gas as developed and produced in onshore basins in the United States and Canada, with the exception of onshore Arctic basins.
Currently, onshore gas from Canada and the United States supplies over 95% of the natural gas con-sumed in both these nations. Overall U.S. produc-tion has increased significantly since 2005, with U.S.
2050, given economic, regulatory, and environmental constraints that are less, or more, favorable to such development.
The three cases each outline a different production scenario for major current or future developments. Large, remote severely stranded resources (e.g., Cana-dian Arctic Islands, NE Greenland Rift Basin) are not included. Table 1-15 summarizes the assumptions specific to natural gas in these three scenarios.
The most likely case is expected to lead to Arc-tic production of 2 Tcf/yr (5.5 Bcf/d), based on pipelines being developed in both Alaska and the Mackenzie Delta/Canadian Beaufort to take gas to market by around the middle of the 2020s. On the Alaska side, this would amount to 1.6 Tcf/yr, with a further 0.4 Tcf from the Mackenzie Delta and Cana-dian Beaufort Sea.
In the Limited Potential case, these sources of gas would remain stranded, assuming that the required infrastructure development would not occur with continuing economic and regulatory challenges act-ing as a disincentive to the project proponents.
In the High Potential case, it is assumed that a higher pace of resource development activity in Alaska, including new offshore areas and the Mack-enzie Delta/Canadian Beaufort, would justify expan-sions of the two pipeline systems by 2025, allowing increases in production to a total of 2.9 Tcf/yr (almost 8 Bcf/d), of which about 2.2 Tcf would be from Alaska and the remainder from the Canadian north.
Table 1-15. three potential arctic Gas production pathways
Limited Potential Case Most Likely Case HIgh Potential Case
no alaska gas pipeline alaska gas pipeline; 4.5 Bcf/d, 2025
alaska gas pipeline expansion; 5.9 Bcf/d, 2035
no Mackenzie gas pipeline Mackenzie gas pipeline; 1.2 Bcf/d, 2025
Mackenzie gas pipeline; expansion; 1.8 Bcf/d, 2035
no north alaska, Chukchi or Beaufort oCs, or Canadian Beaufort production
north alaska, Chukchi & Beaufort oCs, and Canadian Beaufort production; 15% resource developed by 2050
north alaska, Chukchi, and Beaufort oCs, and Canadian Beaufort production; 25% resource developed by 2050
no arctic Islands/sverdrup Basin, labrador, or Grand Banks gas
no arctic Islands/sverdrup Basin, labrador, or Grand Banks gas
labrador and Grand Banks gas; 10% resource developed by 2050

Chapter 1 - resourCes and supply 143
begun in Canada, most notably in the Montney (silt-stone) and the Horn River basin, but has not as yet arrested the decline in overall production there.
U.S. (Bcf/d dry) and Canadian (Marketable) Production Mix – Conventional and Unconventional Sources 2000–2010
Unconventional production has increased from approximately one-third of the total U.S. supply mix in 2000, to nearly two-thirds in 2010, or from 33 to 63% of the total (Figure 1-48). The increase in U.S. production since 2005 is almost entirely due to shale gas. Growth from this source alone exceeds total U.S. production growth over this period. Shale gas and coalbed methane represent a growing percentage, currently approximately 11%, of overall production in Canada. U.S. lower-48 and non-Arctic Canada onshore gas production in 2009 is estimated at 24.1 Tcf/yr.
The focus on unconventional resource plays – tight gas, coalbed methane, and shale gas – has also arrested a previous decline in average well productiv-ity, increased reserves per well drilled, and lifted the
dry natural gas production reaching an average of 57.8 Bcf/d in 2010. This dry production level repre-sents an increase of 16% from the recent historic low of 49.7 Bcf/d in 2005, and is the highest overall U.S. production rate since 1973.
Production of natural gas from shale as a category is largely responsible for the overall production increase in the United States, having grown the most in both absolute and percentage terms since 2000. In 2000, shale gas production was approximately 1.0 Bcf/d, or about 2% of the U.S. supply mix. Shale production had grown to approximately 11.6 Bcf/d by 2010, representing approximately 20% of the 57.8 Bcf/d of estimated dry U.S. production (Figure 1-48). Production from tight formations has also increased in both absolute and percent-age terms, increasing from 12.0 Bcf/d in 2000 to 19.9 Bcf/d in 2010, or from 23% to 34% of the total over the period. When adding U.S. coalbed meth-ane production, also considered “unconventional,” production from unconventional sources has more than doubled in the United States since 2000 – increasing by 19.2 Bcf/d, from 17.2 Bcf/d in 2000, to 36.4 Bcf/d in 2010. Shale gas production has also
Figure 1-48. U.S. and Canadian Production Mix, 2000–2010
0
20
40
60
80
2000 2002 2004 2006 2008 2010
BILL
ION
CU
BIC
FEET
PER
DAY
YEAR
U.S. CONVENTIONAL U.S. SHALE
U.S. TIGHT U.S. CBM CANADIAN CONVENTIONAL
AND TIGHT CANADIAN SHALE CANADIAN CBM
Note: CBM = coalbed methane.Sources: Energy Information Administration; National Energy Board of Canada; and Wood Mackenzie.
Figure 1-48. u.s. and Canadian production Mix, 2000–2010

144 prudent deVelopMent: realizing the potential of north america’s abundant natural Gas and oil resources
and reserve trends should be expected, as tight gas and shale gas production profiles exhibit substan-tially higher initial production rates and recoverable reserves than conventional wells. Although uncon-ventional wells are fewer in number, their prolific production and reserve additions have reversed a declining trend.
The first widespread deployment of new drill-ing and completion technologies focused on shale gas was concentrated in the Barnett Shale play, in northeast Texas. The play, in active development since the early 1990s, grew in importance from the mid-2000s. Breakthroughs in technology trans-formed the play into a prolific producing area start-ing in 2005. Peak month production in the Barnett shale play increased by at least 60%, or by more than 500 Mcf/d per well, in the 2005–2009 period, com-pared to 1990–2000.
While the Barnett Shale was an early success in shale gas development, other plays are still being dis-covered, with the Eagle Ford, Montney (siltstone), Horn River, and the Marcellus Shale still in early, but rapid development (Figure 1-50). Additional
reserve life index. Shale gas plays are dominating the unconventional spectrum, although both tight gas and coalbed methane continue to contribute to this trend of increased productivity.
As shown on an annual basis in Figure 1-49, total North American gas production reached a new high of 27.3 Tcf in 2009 following a period of approxi-mately flat production over the previous nine years, despite a 57% increase in the well count. The upturn in production since 2005 coincides with the rapid development of unconventional gas within North America, particularly shale gas. Figure 1-49 includes production and well counts from the Gulf of Mexico, as the offshore component was not identified sepa-rately within this particular 20-year data set. The Gulf of Mexico accounts for about 10% of produced volumes.
Production and reserves from newly drilled wells have increased since 2006, suggesting that not only do these newly drilled wells replace natural declines in rates and reserves in historical wells but they add considerably more incremental rate and reserves per well. Such a reversal of historical gas production
Figure 1-49. North American Gas Production and Operating Gas Wells
0
10
20
30
0
200
400
600
800
1,000
1989 1995 2000 2005 2010
TRIL
LIO
N C
UBI
C FE
ET
WEL
L CO
UN
T (T
HO
USA
ND
S)
YEAR
NORTH AMERICAN GAS WELLS
NORTH AMERICAN ANNUAL GAS PRODUCTION
Note: Gulf of Mexico gas production and well count is included in North American data. Sources: Wood Mackenzie; U.S. Energy Information Administration.
Figure 1-49. north american Gas production and operating Gas Wells

Chapter 1 - resourCes and supply 145
Key Technology – Commercialization of Shale as a Resource
Shale gas production can be traced back to the mid-1800s, but until recently was a rather insignifi-cant source of energy. Once considered only a mar-ginal producer, a source rock for hydrocarbons, or as an impermeable barrier or seal for conventional reservoirs, it is now a primary target for commercial drilling. These ultralow-permeability reservoirs are routinely exploited. This is made possible through a combination of technologies, directional drilling, seismic, lateral wellbores (horizontal wells), and hydraulic fracturing. Without these technologies, most shale reservoirs would not be commercial today. Hydraulic fracturing is the most critical advance for natural gas supply for North America.
Key Technology – Hydraulic Fracturing
First implemented for natural gas production in 1947 in the Hugoton gas field, fracturing increases the contacted surface area within a reservoir. Reservoir rock is fractured by pumping high-pressure water with a sand slurry that props the fractures open. Because
shale resource plays, including the Duvernay, Utica, Collingwood, and others, wait in the wings, providing a large future resource base for North American natu-ral gas supplies.
Key Development and Production Technologies
Development of natural gas has recently been dominated by the application of new technology, especially the development of cost-effective fracture stimulation in horizontal wellbores. Both horizontal drilling and fracture stimulation have been in use for decades. Fracture stimulation was first implemented in a gas field in 1947 in the Hugoton gas field and gas from shale has been produced for more than a cen-tury. Experimentation with horizontal drilling goes back as far as the 1920s, although the first commer-cial application didn’t take place until the mid-1980s in the Austin Chalk formation.
Following are some key milestones in develop-ment and application of technologies to unlock North America’s natural gas resources follow.
Figure 1-50. Production by Shale Play: Growing Beyond the Barnett
0
4
8
12
2000 2001 2002 2003 2004 2005 YEAR
2006 2007 2008 2009 2010
BILL
ION
CU
BIC
FEET
PER
DAY
BARNETT FAYETTEVILLE WOODFORD HAYNESVILLE MARCELLUS EAGLE FORD HORN RIVER MONTNEY AND DUVERNEY
Source: Wood Mackenzie.
Figure 1-50. production by shale play: Growing Beyond the Barnett

146 prudent deVelopMent: realizing the potential of north america’s abundant natural Gas and oil resources
It was not until the 1980s that notable commercial horizontal wells were drilled in North America in the Austin Chalk, Bakken, and Niobrara formations.17 As technology improved, horizontal drilling enabled previously, non-commercial formations to become economic.18 By the 1990s, more than 1,000 horizon-tal wells had been drilled throughout the world.19
After initial commercialization of the technique, efficiencies continued to improve, yielding longer lateral lengths per well and ultimately continuing to decrease surface disturbance. In 1987, the first hori-zontal wells in the Bakken Shale were of relatively modest lengths of approximately 1,000 feet. By the 1990s, as technology improved, lateral lengths of 3,000 to 4,000 feet were possible, and today wells are routinely drilled with lateral lengths of 10,000 feet.
Key Technology – Modern (3D) Seismic Technology
The increase in activity during the 1980s was also spurred by the advent of 3D seismic technology. The exploration success rate increased, resulting in pre-viously uneconomic plays becoming tenable. Today, seismic data is processed using computer algorithms that assist in identifying anomalies in the data. These anomalies may be identified as hydrocarbon depos-its. From 1990 through 2001, the overall costs of 3D seismic imaging decreased by a factor of five. Sur-veys conducted by The American Oil and Gas Reporter as well as the Petroleum Technology Transfer Council indicate that seismic technology has been highly ben-eficial to the industry.20
Modern seismic imaging techniques allow for improved recognition of formation types and char-acteristics. The use of modern seismic technol-ogy has allowed wells to be drilled while avoiding
17 Flores, C. P., “Technology and Economics Affecting Unconven-tional Reservoir Development,” Master’s Thesis, Texas A&M University, December 2008.
18 Joshi, S. D., “Cost/Benefits of Horizontal Wells,” SPE paper 83621 for SPE Western Regional/AAPG Pacific Section Joint Meeting, Long Beach, California, 2003.
19 Energy Information Administration, “Drilling Sideways – A Review of Horizontal Well Technology and Its Domestic Appli-cation,” Contract No. DOE/EIA-TR-0565, U.S. DOE, Washing-ton, DC, April 1993.
20 Ammer, James, “Tight Gas Technologies for the Rocky Moun-tains,” GasTIPS, Spring 2002, pages 18–23.
the first fracturing treatment included no propping agent to maintain conductivity within the induced fractures, it proved unsuccessful. By 1949, hydrau-lic fracturing was successfully implemented in the Woodbine sands in East Texas and became commer-cially viable.13 Since then, many improvements have been made to reliability and safety. By hydraulically fracturing a gas reservoir, the effective permeability, or capacity to flow, can be significantly increased. In fact, with no stimulation treatment, many currently producing reservoirs would be considered imperme-able. Successful stimulation treatments can increase permeability by five to six orders of magnitude.14 By 1955, more than 3,000 fracturing treatments were pumped each month. Throughout the 1960s and 1970s, fracturing became better understood and could be optimized for a particular formation.15 Oper-ational efficiency improvements resulted in cost sav-ings, making more plays economic. Today, coil tub-ing fracturing technology has resulted in shorter time requirements per fracture induced, and multiple zone fractures can be completed in a short time. According to the Independent Petroleum Association of Amer-ica, approximately 90% of new gas well production relies on hydraulic fracturing.
Key Technology – Horizontal Drilling
In horizontal well drilling, a well is drilled par-allel to the formation, exposing more reservoir rock than would be possible using a conventional vertical completion technique.16 By increasing the length of the horizontal portion of the well, multiple vertical well locations were replaced with a single horizontal well for a fraction of the cost, minimizing surface disturbance. As early as 1927, the concept of drilling horizontally through the producing formation was tested in North America; however, many of the technique’s early advances were made in Bashkiria, Russia.
13 Economides, M. J. and K. G. Nolte, Reservoir Stimulation, third edition. (West Sussex: Wiley, 2000), page 367.
14 Economides et al., Petroleum Production Systems (New Jersey: Prentice Hall, 1994), page 600.
15 Holditch, S. A., and N. R. Tschirhart, Optimal Stimulation Treatments in Tight Gas Sands, SPE Paper 96104 for SPE Annual Technical Conference and Exhibition, Dallas, Texas, 2005.
16 Sheikholeslami et al., “Drilling and Production Aspects of Horizontal Wells in the Austin Chalk,” SPE Journal of Petroleum Technology, July 1991, pages 773–779.
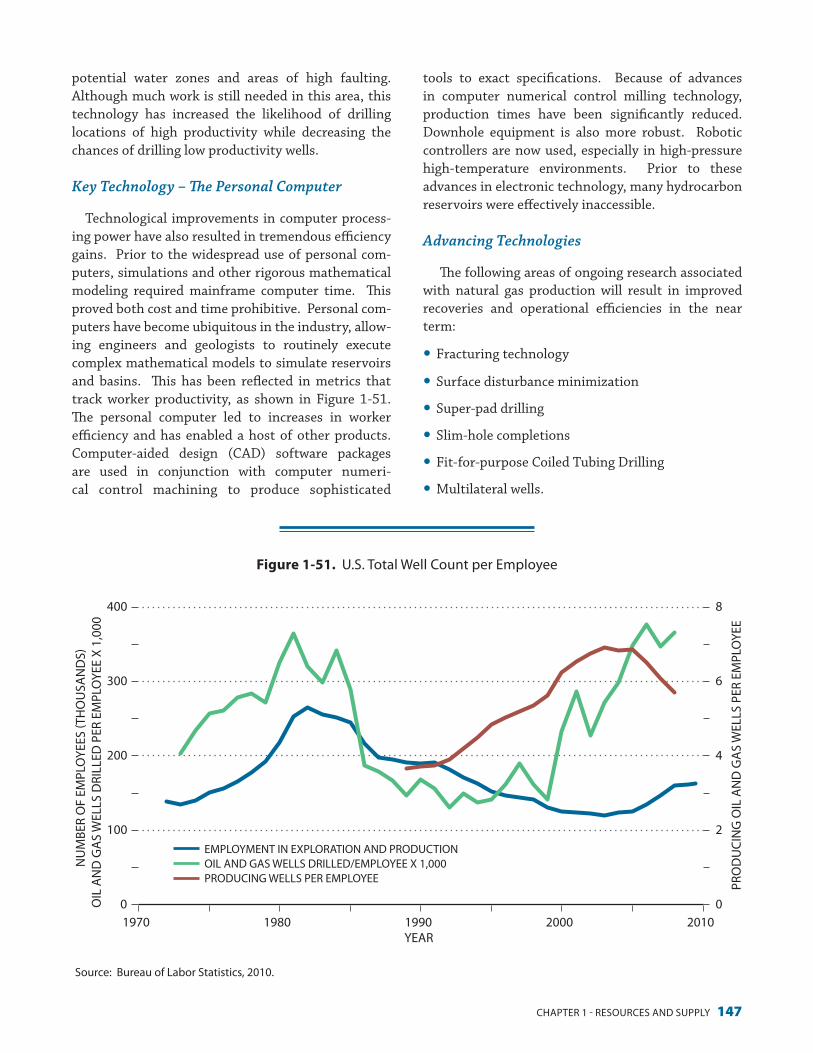
Chapter 1 - resourCes and supply 147
tools to exact specifications. Because of advances in computer numerical control milling technology, production times have been significantly reduced. Downhole equipment is also more robust. Robotic controllers are now used, especially in high-pressure high-temperature environments. Prior to these advances in electronic technology, many hydrocarbon reservoirs were effectively inaccessible.
Advancing Technologies
The following areas of ongoing research associated with natural gas production will result in improved recoveries and operational efficiencies in the near term:
y Fracturing technology
y Surface disturbance minimization
y Super-pad drilling
y Slim-hole completions
y Fit-for-purpose Coiled Tubing Drilling
y Multilateral wells.
potential water zones and areas of high faulting. Although much work is still needed in this area, this technology has increased the likelihood of drilling locations of high productivity while decreasing the chances of drilling low productivity wells.
Key Technology – The Personal Computer
Technological improvements in computer process-ing power have also resulted in tremendous efficiency gains. Prior to the widespread use of personal com-puters, simulations and other rigorous mathematical modeling required mainframe computer time. This proved both cost and time prohibitive. Personal com-puters have become ubiquitous in the industry, allow-ing engineers and geologists to routinely execute complex mathematical models to simulate reservoirs and basins. This has been reflected in metrics that track worker productivity, as shown in Figure 1-51. The personal computer led to increases in worker efficiency and has enabled a host of other products. Computer-aided design (CAD) software packages are used in conjunction with computer numeri-cal control machining to produce sophisticated
Figure 1-51. U.S. Total Well Count per Employee
0
2
4
6
8
0
100
200
300
400
1970 1980 1990 2000 2010
PRO
DU
CIN
G O
IL A
ND
GA
S W
ELLS
PER
EM
PLO
YEE
NU
MBE
R O
F EM
PLO
YEES
(TH
OU
SAN
DS)
OIL
AN
D G
AS
WEL
LS D
RILL
ED P
ER E
MPL
OYE
E X
1,00
0
YEAR
EMPLOYMENT IN EXPLORATION AND PRODUCTIONOIL AND GAS WELLS DRILLED/EMPLOYEE X 1,000 PRODUCING WELLS PER EMPLOYEE
Source: Bureau of Labor Statistics, 2010.
Figure 1-51. u.s. total Well Count per employee

148 prudent deVelopMent: realizing the potential of north america’s abundant natural Gas and oil resources
For the production pathways analyzed here, the NPC team used the resource data supporting the Massachusetts Institute of Technology energy initia-tives (MITei) report. The data provide a reasonable range of estimates in a format useful for scenario building. MITei uses the North American supply model developed by ICF, which provides for a high-medium-low look using “current” technology and the same for an “advanced” technology case, result-ing in six different model outputs for consideration.
It should be noted that “current” refers to technol-ogy applied in 2007 or earlier. Given recent break-throughs, today’s application of technology renders the “Advanced Technology” cases more relevant today. For the purposes of this study, it was decided to focus upon three onshore, non-Arctic resource size cases:
y Case One – MITei/ICF Mean Resource Base, Cur-rent (2007) Technology, Remaining Recoverable Resource 1,901 Tcf, Estimated Ultimate Recover-able Resource 2,996 Tcf. The consensus view of the NPC team is that this case is conservative and it is highly probable that it will be surpassed.
y Case Two – MITei/ICF Mean Resource Base, Advanced Technology, Remaining Recoverable Resource 2,890 Tcf, Estimated Ultimate Recover-able Resource 3,985 Tcf. The consensus view of the NPC team is that this case is also rather conservative and it is probable that it will be surpassed.
y Case Three – MITei/ICF High Resource Base, Advanced Technology, Remaining Recoverable Resource 3,561 Tcf, Estimated Ultimate Recover-able Resource 4,656 Tcf. The consensus view of the NPC team is that this case is reasonable today and could readily be surpassed.
Figure 1-52 illustrates the supply cost stack for these three cases. This figure shows gas resource volumes on the horizontal axis plotted against cost of supply ($/MMBtu) on the vertical axis. The scale is truncated at $30/MMBtu. Historical cumulative gas production rose above 1,000 Tcf in 2006. The estimated ultimate recoverable gas resources for the three cases are plotted in Figure 1-52.
The additional resources that might be recover-able at costs above $20/MMBtu appear to be rela-tively small, so comparisons among the cases can be made at this level. Ultimate recoverable resources, including cumulative production to date, range
Future Technology
Of natural gas production in the United States in 2008, approximately 40% of the wells required hydraulic fracturing stimulation to produce at economic rates.21 According to the Independent Petroleum Association of America, approximately 90% of new gas wells rely on hydraulic fracturing to produce.22 Without both hydraulic fracturing and hor-izontal drilling, future production growth in onshore natural gas cannot be achieved and any reservoir termed “unconventional” would be uneconomic. The EIA has modeled natural gas supply for a scenario with no additional tight gas production. In this sce-nario, natural gas production from onshore North America falls by 39%. From these estimates it can be seen that the future of natural gas supply in North America will rely upon future availability and contin-uous improvement in fracturing tight gas and shale gas formations.
Production Potential
Potential for future production of onshore gas has been transformed by development and application of the technologies described in the previous section. A number of studies have quantified the resource base and these assessments are included in Table 1-16.
The most important realization from these stud-ies is that in less than a decade, estimates of the North America resource base have grown by more than 150%. The most recent study sponsored by America’s Natural Gas Alliance includes a compre-hensive geological and engineering based model of 32 unconventional plays, including shale gas, tight gas sands, and coalbed methane formations. These unconventional plays alone were projected to have recoverable reserves over 2,600 Tcf. This recent study, in combination with the consistent trend of resource growth, provides a compelling argument that the resource base is large. With sufficient con-fidence in the underlying resource base, the focus can shift to questions regarding supply and rates of development.
21 Energy Information Administration, (2010a) Annual Energy Outlook 2010 With Projections to 2035, (2010b) Natural Gas U.S. Data. Retrieved from http://www.eia.doe.gov/oil_gas/natural_gas/info_glance/natural_gas.html.
22 Tiemann, Mary, Congressional Research Service, June 2, 2010. Safe Drinking Water Act (SDWA): Selected Regulatory and Legislative Issues, page 22.

Chapter 1 - resourCes and supply 149
Tabl
e 1-
16.
estim
ates
of r
emai
ning
res
ourc
e*
Org
aniz
atio
nD
ate
Uni
ted
Stat
esCa
nada
Tota
l N
orth
Am
erica
OFS
Non
-Ar
ctic
Nor
th
Amer
ica To
tal
OFS
Conv
en-
tiona
lTi
ght
Shal
eCB
MTo
tal
L48
AKTo
tal
Prov
ed
Rese
rves
All
U.S.
ON
S N
on-
Arct
ic
OFS
+
Arct
icTo
tal
usG
s/M
Ms/
eIa
1997
657
308
501,
015
223
1,23
820
0945
427
671
801
362
1,16
324
51,
408
npC
1999
881
230
5274
1,25
230
320
0369
119
035
5897
429
41,
268
184
1,45
239
739
71,
849
pGC
2001
742
9884
025
11,
091
2006
961
166
1,12
719
41,
321
211
1,53
220
0886
316
31,
642
194
1,83
623
82,
074
ICF
2009
693
174
631
651,
563
294
1,85
724
52,
102
InG
aa
2008
904
174
385
651,
528
302
1,83
020
42,
034
508
508
2,33
8n
eB20
0962
762
7Cs
uG
2010
1,02
01,
020
MIt
ei C
anad
a p1
0†Q
2 20
101,
185
4,03
5#
MIt
ei u
.s. p
10†
Q2
2010
2,85
0M
Itei
pm
ean†
Q2
2010
2,10
080
02,
900
MIt
ei u
.s. p
90†
Q2
2010
1,50
0
MIt
ei C
anad
a p9
0†Q
2 20
1046
01,
960
#
rstG
oG
C 3‡
Q3
2010
120
523
1,65
814
22,
443
1,11
83,
561
rstG
oG
C 2§
Q3
2010
120
523
1,19
814
21,
983
907
2,89
0rs
tG o
GC
1¶Q
3 20
1012
052
351
414
21,
299
602
1,90
1a
nG
aQ
1 20
1069
243
81,
759
702,
959
294
3,25
324
53,
498
1,02
64,
524
GtI
Cur
rent
2010
958
223
3249
1,32
148
41,
805
inc?
1,80
5G
tI a
dvan
ced
2010
1,00
233
753
771,
528
530
2,05
8in
c?2,
058
npC
hig
hQ
4 20
1037
544
055
01,
800
150
3,31
534
53,
660
inc.
3,66
01,
025
230
1,25
54,
915
3,96
5n
pC M
ediu
mQ
4 20
1026
029
035
01,
000
120
2,02
021
02,
230
inc.
2,23
069
517
587
03,
100
2,45
5n
pC l
owQ
4 20
1016
021
520
070
090
1,36
513
01,
495
inc.
1,49
537
013
050
01,
995
1,57
5
* n
o ad
just
men
ts h
ave
been
mad
e fo
r int
erim
pro
duct
ion
betw
een
year
s.
† M
Itei
’s fig
ures
as
publ
ishe
d.
‡ n
pC r
stG
ons
hore
Gas
sub
grou
p, s
ourc
ed fr
om d
etai
led
data
set f
rom
MIt
ei r
epor
t pre
pare
d by
ICF;
$20
/mcf
sup
ply
cost
cut
-off
assu
med
; hig
h “a
dvan
ced”
(200
7) te
ch C
ase.
§ n
pC r
stG
ons
hore
Gas
sub
grou
p, s
ourc
ed fr
om d
etai
led
data
set f
rom
MIt
ei r
epor
t pre
pare
d by
ICF;
$20
/mcf
sup
ply
cost
cut
-off
assu
med
; Mea
n “a
dvan
ced”
(200
7) te
ch C
ase.
¶ n
pC r
stG
ons
hore
Gas
sub
grou
p, s
ourc
ed fr
om d
etai
led
data
set f
rom
MIt
ei r
epor
t pre
pare
d by
ICF;
$20
/mcf
sup
ply
cost
cut
-off
assu
med
; Mea
n “C
urre
nt” (
2007
) tec
h Ca
se.
# su
m o
f u.s
. and
Can
ada;
but
not
real
ly a
val
id s
tatis
tical
func
tion.
not
es: o
Fs =
offs
hore
; CBM
= c
oalb
ed m
etha
ne; l
48 =
low
er-4
8; a
K =
ala
ska;
on
s =
onsh
ore;
usG
s =
uni
ted
stat
es G
eolo
gica
l sur
vey;
MM
s =
Min
eral
s M
anag
emen
t ser
vice
; eIa
= e
nerg
y In
form
atio
n
adm
inis
trat
ion;
npC
= n
atio
nal p
etro
leum
Cou
ncil;
pG
C =
pote
ntia
l Gas
Com
mitt
ee; I
nG
aa
= In
ters
tate
nat
ural
Gas
ass
ocia
tion
of a
mer
ica;
neB
= n
atio
nal e
nerg
y Bo
ard
of C
anad
a; C
suG
=
Cana
dian
soc
iety
for u
ncon
vent
iona
l Gas
; MIt
ei =
MIt
ene
rgy
Initi
ativ
e; r
stG
oG
C =
reso
urce
& s
uppl
y ta
sk G
roup
ons
hore
gas
cas
e; a
nG
a =
am
eric
a’s n
atur
al G
as a
llian
ce; G
tI =
Gas
tech
nolo
gy
Inst
itute
; inc
. = in
clud
ed.

150 prudent deVelopMent: realizing the potential of north america’s abundant natural Gas and oil resources
(Should market needs be greater over this time period, other supply sources, such as offshore gas, Arctic gas, or imported LNG would also be called upon to complete the supply mix.)
y Restricted Supply Scenarios – Here assumptions are analyzed to estimate the effects of various pos-sible restrictions or constraints (such as limitations on fracturing and resource access) on industry’s ability to supply onshore gas. Two of these sce-narios are illustrated in the following figures: from extreme limitations to supply (Figure 1-55) to mod-erate limitations to supply (Figure 1-56). Clearly, these assumptions would have a drastic effect on the ability to supply North America gas domesti-cally. The remaining resource would be reduced by over 70% compared to the unrestricted Flat Supply scenarios, and potential plateau supply would be eliminated entirely under the most extreme restric-tions, such as disallowing hydraulic fracturing. Plateau (flat) supply would be reduced from the approximate 80–90 years, to approximately 40–50 years by assuming 33% restrictions on unconven-tional supply.
from ~3,000 Tcf in Case One up to ~4,700 Tcf with advanced technology in Case Three.
With this understanding of the potential resource base, we analyzed implications for supply potential for the onshore non-Arctic segment of North Ameri-can gas under several scenarios.
y Flat Supply Scenario – at a constant 24 Tcf/yr, equal to current production rates, until beginning of decline, the variation in remaining resource esti-mates has a significant effect on the duration of pla-teau supply length. As illustrated in Figure 1-53, approximately five to nine decades at this produc-tion level are possible, followed by significant post-plateau supply.
y Supply Growth Scenario – An increased rate of supply scenario, whereby supply is assumed to increase approximately 50% from 24.1 Tcf/yr to 36.5 Tcf/yr. The increase takes place to achieve this higher supply plateau in approximately one decade. This plateau could be maintained for between two and four decades after 2020, based on the resource estimates used, as illustrated in Figure 1-54.
$0
$10
$20
$30
0 1,000 2,000 3,000 4,000 5,000 6,000ULTIMATE RECOVERABLE RESOURCE (TRILLIONS OF CUBIC FEET)
Figure 1-52. Onshore Natural Gas Recoverable Resource Cases versus Cost of Supply at the Wellhead
WAS Figure ES-2
2,996
WEL
LHEA
D S
UPP
LY C
OST
(DO
LLA
RS P
ER M
ILLI
ON
BTU
)
3,985 4,656
100 YEARS OFCONSUMPTION
AT CURRENT RATES
CUMULATIVEPRODUCTION
THROUGH 2010
Note: See page 107 for case de�nitions.Sources: Energy Information Administration and MIT Energy Initiative (MITei)/ICF International.
CASE ONECASE TWOCASE THREE
Figure 1-52. onshore natural Gas recoverable resource Cases versus Cost of supply at the Wellhead

Chapter 1 - resourCes and supply 151
Figure 1-54. Supply Growth Scenario
YEARS FLAT CONSUMPTION
2,100 TCFTERMINALDECLINEVOLUME
4,656 TCFULTIMATERESOURCE
1,500 TCFTERMINALDECLINEVOLUME
900 TCFTERMINALDECLINEVOLUME
3,985 TCFULTIMATERESOURCE
2,996 TCFULTIMATE
RESOURCE
20 0 31 33
1.4 TCF/YR GROWTH
0
10
20
30
40
1900 1920 1940 1960 1980 2000 2020 2040 2060 2080 2100 2120 2140 2160 2180 2200
TRIL
LIO
N C
UBI
C FE
ET (T
CF) P
ER Y
EAR
YEAR
HISTORY
Note: Supply Growth Scenario – 5% growth per year to 100 billion cubic feet per day.Sources: Canadian Association of Petroleum Producers; Cedigaz; Energy Information Administration; National Energy Board of Canada; and United States Geological Survey.
HISTORY CASE ONECASE TWOCASE THREE
Figure 1-54. supply Growth scenario
Figure 1-53. Flat Supply Scenario
0
10
20
30
40
1900 1920 1940 1960 1980 2000 2020 2040 2060 2080 2100 2120 2140 2160 2180 2200
TRIL
LIO
N C
UBI
C FE
ET (T
CF) P
ER Y
EAR
YEARSources: Canadian Association of Petroleum Producers; Cedigaz; Energy Information Administration; National Energy Board of Canada; and United States Geological Survey.
YEARS FLAT CONSUMPTION
1,400 TCFTERMINALDECLINEVOLUME
4,656 TCFULTIMATERESOURCE
1,000 TCFTERMINALDECLINEVOLUME
600 TCFTERMINALDECLINEVOLUME
3,985 TCFULTIMATERESOURCE
2,996 TCFULTIMATERESOURCE
54 0 78 90
HISTORY
HISTORY CASE ONECASE TWOCASE THREE
Figure 1-53. Flat supply scenario

152 prudent deVelopMent: realizing the potential of north america’s abundant natural Gas and oil resources
Figure 1-55. Extremely Restricted Supply Scenario – Extreme
YEARS FLAT CONSUMPTION
1,013
2,108
824
600
1,919 1,787
4 0
TCF ULTIMATE RESOURCE
0
10
20
30
40
1900 1920 1940 1960 1980 2000 2020 2040 2060 2080 2100 2120 2140 2160 2180 2200
TRIL
LIO
N C
UBI
C FE
ET (T
CF) P
ER Y
EAR
YEAR
HISTORY CASE ONECASE TWOCASE THREE
TCF TERMINALDECLINE VOLUME
Notes: Extremely restricted supply scenario – fracturing impact, no shale technology enabled. Year-end 2009 cumulative = 1,095 TCF. Cases Two and Three have immediate terminal decline.Sources: Canadian Association of Petroleum Producers; Cedigaz; Energy Information Administration; National Energy Board of Canada; and United States Geological Survey.
Figure 1-56. Moderately Restricted Supply Scenario
0
10
20
30
40
1900 1920 1940 1960 1980 2000 2020 2040 2060 2080 2100 2120 2140 2160 2180 2200
TRIL
LIO
N C
UBI
C FE
ET (T
CF) P
ER Y
EAR
YEAR
HISTORY
Notes: Moderately restricted supply scenario – fracturing impact, 67% tight/coalbed methane/shale technology enabled. Year-end 2009 cumulative = 1,095 TCF.Sources: Canadian Association of Petroleum Producers; Cedigaz; Energy Information Administration; National Energy Board of Canada; and United States Geological Survey.
YEARS FLAT CONSUMPTION
1,400
3,789
1,000 600
3,2832,587
0 37 49 54
HISTORY CASE ONECASE TWOCASE THREE
TCF ULTIMATE RESOURCE
TCF TERMINALDECLINE VOLUME
Figure 1-55. extremely restricted supply scenario
Figure 1-56. Moderately restricted supply scenario

Chapter 1 - resourCes and supply 153
draw on any particular resource type, the potential amount of natural gas that would be produced over the lifetime of the wells drilled between 2010 and 2050 was checked against public estimates of recov-erable resources by type.
The estimated production by resource type and pace of onshore natural gas drilling to maintain com-bined U.S. and Canadian production at current levels of roughly 66 Bcf/d for the Flat Supply Scenario is indicated in Figures 1-58 and 1-59.
Increasing output of shale gas rises to about 60% of the total and is able to offset declines in conven-tional and coalbed methane production to maintain production. As shale gas wells produce at higher rates than many of the conventional, coalbed meth-ane, and tight gas wells relied on previously, the absolute number of new onshore gas wells required to maintain current production remains less than 60% of the peak 2006 level.
To achieve significant increases in combined U.S. and Canadian production to roughly 100 Bcf/d by 2020, and maintain that level thereafter, would
Figure 1-57 provides a summary of Flat Supply, Supply Growth, and Extremely Restricted Scenarios using the mid-range estimate of recoverable resources (Case Two), and as such provides a guide to the poten-tial for reasonably unconstrained, most likely, and constrained production pathways.
To further test the reasonableness of these poten-tial production pathways, the study team ana-lyzed the magnitude of input requirements needed. Details of the methodology and results are described in Topic Paper #1-8, “Onshore Natural Gas,” available on the NPC website. Here we summarize the indica-tive requirements of rigs, industry personnel, tubular (steel) tonnage, proppant, and fracture stimulation water usage required to support both the Flat Supply and Supply Growth scenarios.
Based on expectations of relative economics of the major natural gas types, it was assumed that increases in drilling would primarily target shale gas, and to a lesser extent tight gas. Conventional gas and coalbed methane drilling were assumed to remain essentially flat at around current levels over the period to 2050. To avoid a disproportionate
Figure 1-57. Comparison of Three Supply Scenarios:Mean Resource Base, Advanced Technology, and 2007 Cost Index
0
10
20
30
40
1900 1920 1940 1960 1980 2000 2020 2040 2060 2080 2100 2120 2140 2160 2180 2200 YEAR
Note: Year-end 2009 cumulative = 1,095 TCF.Sources: Canadian Association of Petroleum Producers; Cedigaz; Energy Information Administration; National Energy Board of Canada; and United States Geological Survey.
HISTORY FLAT SUPPLY
SUPPLY GROWTH EXTREMELY RESTRICTED SUPPLY
TRIL
LIO
N C
UBI
C FE
ET (T
CF) P
ER Y
EAR
Figure 1-57. Comparison of three supply scenarios: Mean resource Base, advanced technology, and 2007 Cost Index

154 prudent deVelopMent: realizing the potential of north america’s abundant natural Gas and oil resources
Figure 1-58. Onshore North American Gas Production in Flat Supply Scenario
0
20
40
60
80
2005 2010 2015 2020 2025 2030 2035 2040 2045 2050
BILL
ION
CU
BIC
FEET
PER
DAY
YEAR
SHALE TIGHT COALBED METHANE CONVENTIONAL
Figure 1-59. Projected Wells Required in Flat Supply Scenario
0
20
40
60
2005 2010 2015 2020 2025 2030 2035 2040 2045 2050
WEL
LS (T
HO
USA
ND
S)
YEAR
SHALE TIGHT COALBED METHANE CONVENTIONAL
Figure 1-58. onshore north american Gas production in Flat supply scenario
Figure 1-59. projected required Wells required in Flat supply scenario

Chapter 1 - resourCes and supply 155
activity is generally consistent with historical levels. Employment would increase. High horsepower rigs (1,500 horsepower or more) are estimated at approxi-mately 25 to 33% of the total gas rig count.
Figure 1-63 illustrates the fracture stimulation activity-related input requirements for U.S. lower-48 and non-Arctic Canada onshore gas supply, including fracture stimulation stages, fracture proppant, and initial water (without differentiation between pri-mary and re-used water) required for fracture stimu-lation. The Flat Supply scenario is expected to require historically similar overall numbers of fracture stimu-lation stages and proppant compared to recent levels. The Supply Growth scenario would require approxi-mately 50% greater fracture stimulations overall by 2050 than recent history. Water (primary and re-use) for fracture stimulations would increase, depending upon scenario, by approximately 50–125% overall by 2050 compared to recent levels. Local increases in water use could be greater. Nonetheless, even in the Supply Growth scenario in 2050, estimated total annual water used for fracture stimulations at 2.5 billion barrels is still less than 0.2% of the U.S. daily consumption in 2000 (excluding hydroelectric
involve higher levels of drilling. As indicated in Figures 1-60 and 1-61, shale gas again is projected to account for about 60% of the production from 2020 onward. By 2050, the requirement for new onshore natural gas wells would be projected to reach over 80% of the 2006 peak.
While the absolute number of new onshore natural gas wells remains below previous peaks, the numbers may not be strictly comparable since shale gas wells tend to require greater amounts of labor, equipment, and materials to drill and complete than earlier gen-erations of onshore natural gas wells. To test the level of inputs required for drilling under the scenarios examined, the study team looked at such items as fracture stages, water use for fracturing, proppant, steel, and manpower. The following charts illustrate the requirements derived from the level of activity analyzed.
The first figure set (Figure 1-62) illustrates the activity-related input requirements for U.S. lower-48 and non-Arctic Canada onshore gas supply; namely rigs (total and high horsepower), direct employment, well capital, and steel for well tubulars. This level of
Figure 1-60. Onshore North American Gas Production in Supply Growth Scenario
0
40
80
120
2005 2010 2015 2020 2025 2030 2035 2040 2045 2050
BILL
ION
CU
BIC
FEET
PER
DAY
YEAR
SHALE TIGHT COALBED METHANE CONVENTIONAL
Figure 1-60. onshore north american Gas production in supply Growth scenario

156 prudent deVelopMent: realizing the potential of north america’s abundant natural Gas and oil resources
on critical inputs (particularly fracture stimulation, water disposal, and land access) on a national level will cause natural gas supply rate to decline.
Key Findings
y Recent technology advances have enabled develop-ment of large-scale tight gas and shale gas resources in North America.
y Estimates of remaining resources, particularly of shale gas, have increased significantly in recent years and in all resource studies.
− Horizontal drilling coupled with multi-stage fracture stimulation plays a key part in this increase, enabling greatly increased production of shale gas and tight gas.
y The remaining recoverable gas resource (as of Jan-uary 2010) is estimated to be between 1,900 and 3,600 Tcf.
− Further advances in technology and play delin-eation beyond the current level are expected to further increase this quantity.
utilization) of 213 billion gallons per day (1.85 tril-lion barrels per year).23 Advances by the industry to reuse stimulation water and use non-potable water will likely substantially reduce actual water use below this estimate.
Natural gas can continue to be a significant con-tributor to the continent’s energy supply and secu-rity. Ample natural gas is available in North America to supply current consumption levels for decades and to support significant growth into other sectors as well. New techniques, including cost-effective multiple-stage fracture stimulation in horizontal wellbores, have enabled vast resources never before considered economic at any reasonable price. Input resource requirements (e.g., rigs, people, fracture stimulation proppant, and water) are significant yet manageable, and achieving these levels of supply is within industry capabilities. Extreme restrictions
23 Susan S. Hutson et al., “Estimated Use of Water in the United States in 2000,” U.S. Geological Survey Circular 1268, 15 fig-ures, 14 tables. (2004, revised April 2004, May 2004, and Feb-ruary 2005).
Figure 1-61. Projected Wells Required in Supply Growth Scenario
SHALE TIGHT COALBED METHANE CONVENTIONAL
20
40
2005 2010 2015 2020 2025 2030 2035 2040 2045 2050
YEAR
0
60
WEL
LS (T
HO
USA
ND
S)
Figure 1-61. projected Wells required in supply Growth scenario

Chapter 1 - resourCes and supply 157
NAT
URA
L G
AS
RIG
S
0
1,00
0
2,00
0
3,00
0
2008
2010
2030
2050
AVERAGE RIG COUNT
YEA
RYE
AR
YEA
RYE
AR
SUPP
LY G
ROW
TH
FLAT
SU
PPLY
≥150
0 H
P RI
GS
WEL
L CA
PITA
L
0
100
200
2008
2010
2030
2050
CAPEX ($ BILLION)
SUPP
LY G
ROW
TH
FLAT
SU
PPLY
04812
2008
2010
2030
2050
STEEL USE (MILLON METRIC TONS)
SUPP
LY G
ROW
TH
FLAT
SU
PPLY
140
160
180
200
220
2008
2010
2030
2050
WORKFORCE NEED (THOUSANDS)
DIR
ECT
EMPL
OYM
ENT
SUPP
LY G
ROW
TH
FLAT
SU
PPLY
STEE
L TU
BULA
RS
Figu
re 1
-62.
Act
ivity
-Rel
ated
Dril
ling
Inpu
t Est
imat
es
Figu
re 1
-62.
act
ivity
-rel
ated
dril
ling
Inpu
t est
imat
es

158 prudent deVelopMent: realizing the potential of north america’s abundant natural Gas and oil resources
0
1,000
2,000
3,000
2008 2010 2030 2050
WAT
ER N
EED
(MIL
LIO
N B
ARR
ELS)
FRAC WATER (PRIMARY AND REUSE)
SUPPLY GROWTH
FLAT SUPPLY
0
100
200
2008 2010 2030 2050
PRO
PPA
NT
NEE
D (B
ILLI
ON
PO
UN
DS)
WELL FRAC PROPPANT
SUPPLY GROWTH
FLAT SUPPLY
0
200
400
600
2008 2010 2030 2050
FRA
C ST
AG
ES (T
HO
USA
ND
S)
WELL FRAC STAGES
SUPPLY GROWTH
FLAT SUPPLY
Figure 1-63. Indicative Estimates of Well Stimulation–Related Inputs
YEAR
YEAR
YEAR
Figure 1-63. Indicative estimates of Well stimulation–related Inputs

Chapter 1 - resourCes and supply 159
mated to be available at 50% greater supply levels than today, even accounting for a decade ramp up and decline volumes.
y Supply costs should remain moderate as long as development and production is not overly restricted or unduly burdened.
y Requirements to support this resource develop-ment are achievable based upon high level scoping:
− Directly employed personnel could increase 10–25% over 40 years.
− Legislative and regulatory constraints (particu-larly on fracture stimulation) on development activity could drastically reduce the available re-coverable resource.
y Between five and nine decades of flat supply at 2009 levels is estimated to exist, even accounting for substantial (600–1,400 Tcf) resource being pro-duced on a decline following the plateau.
y Onshore gas supplies can support increased use of this resource. Up to three decades of supply is esti-
Liquefied Natural Gas (LNG) is a small but grow-ing part of the global gas market. LNG consump-tion in 2009 was 23.5 Bcf/d or 8.2% of total world demand for natural gas, according to the BP Review of World Energy. LNG demand has grown 6–7% per year for the last two decades, far faster than the overall 2–4% growth in the total global natural gas market.
Liquefied natural gas is created by cooling natu-ral gas to -161oC. At that temperature, natural gas becomes a liquid and volume drops by a factor of approximately 600. That decrease in volume allows natural gas to be economically transported by spe-cialized ships to distant markets.
The United States began importing LNG in 1971 to a regasification terminal in Massachusetts but importation had a fitful start. By 1982, four other import terminals had opened and three of them had closed. Reliance on imports picked up in the 1980s when proved U.S. gas reserves declined as domestic demand continued to rise. The inopera-tive terminals reopened and eventually expanded. By 2003, a report on LNG by the Energy Infor-mation Administration (EIA) cited 11 different domestic regas projects and listed seven more in the Bahamas, Canada and Mexico that were designed to supply natural gas to U.S. markets. The projects enabled import growth to 2.11 Bcf/d in 2007, 3.3% of total U.S. consumption.
However, the difference between U.S. LNG pric-ing and global LNG pricing complicates import efforts. The price of LNG globally is linked to the primary alternative fuel, oil. In the United States, LNG is linked to the domestic price of gas. When oil prices are high and U.S. natural gas prices are
low, LNG providers prefer to ship supply to Asia or Europe.
The expected need for LNG imports continued to drive U.S. expansion activities. In 2007, the United States had 5 operating terminals and 24 projects approved for construction: 19 onshore and 5 offshore. In addition, 14 more projects had been formally proposed.
About that time, however, it became apparent that U.S. proved reserves of natural gas were rap-idly growing due to development of tight gas sands and coalbed methane reserves. Promising results from the Barnett play were just becoming public. By 2008, the assumption that the United States had to import large quantities of LNG to meet ris-ing demand was called into question. Expectations for LNG imports plummeted by the end of the decade and a number of projects were suspended or cancelled. Today, the 18.3 Bcf/d of terminal regas capacity is expected to operate at low load factors for the foreseeable future.
Three factors – abundant domestic supply, low prices and anticipated flat natural gas demand through 2035 – have turned the focus to exports. Apache and EOG are developing the Kitimat LNG project in British Columbia – once intended for imports – with plans to supply the planned 700 MMcf/d from the Horn River play. Cheniere is developing a liquefaction facility in Louisiana that could produce up to 2.6 Bcf/d from four trains. Free-port LNG and Macquarie Energy have announced plans to construct 1.4 Bcf/d of liquefaction from four trains at the existing 1.65 Bcf/d Freeport LNG terminal in Freeport, Texas. All three projects have applied for export permits.
liquefied Natural Gas Overview

160 prudent deVelopMent: realizing the potential of north america’s abundant natural Gas and oil resources
Natural gas transmission pipelines transport natural gas from production areas to market areas. Transmission pipelines receive gas from gathering or processing facilities and deliver it to end users, local distribution companies, or other transmission pipe-lines for further transportation to market. FERC is charged with approving construction and operation of interstate natural gas pipeline facilities. Currently, there are approximately 220,000 miles of interstate pipeline in service in the United States. In addition, the EIA estimates that there are over 76,000 miles of intrastate pipeline in operation. Construction and operation of intrastate pipelines is regulated by the states in which the pipelines are located.
In addition to FERC’s responsibility to review and authorize interstate natural gas and storage facilities in the United States, multiple other federal statutes affect the construction of interstate natural gas pipe-lines and storage facilities. These include the Clean Air Act, the Clean Water Act, the Endangered Species Act, the Coastal Zone Management Act, the Fish and Wildlife Coordination Act, the Historic Preservation Act, the Rivers and Harbors Act, the Mineral Leas-ing Act, the Federal Land Policy Management Act, and the Wild and Scenic Rivers Act. Additional state and local agencies provide approvals for gathering and processing facilities, and may present additional requirements for pipeline and storage projects.
Natural gas storage facilities help meet gas demand peaks when demand exceeds production and long-haul pipeline throughput levels. When cold weather or other market conditions create more demand for gas than domestic production or imports can satisfy, gas in storage makes up the difference. When sup-plies of natural gas exceed demand (e.g., between seasonal peak demand periods), storage allows gas producers to continue production without interrup-tions. This lowers the need to cut back on production or to shut in wells, which could damage their integ-rity. In North America, gas is typically injected dur-ing the summer (April to October) and withdrawn in the winter (November to March). Storage can also be used for seasonal system supply or for peak intra-day demands, in particular where high deliverability storage is needed to supply gas-fired power genera-tion activated for peak electric power loads.
FERC has jurisdiction over underground storage sites owned and operated by interstate pipelines, as well as independently operated storage sites that offer services in interstate commerce. EIA reports
− The rig count required is manageable and within historical levels, although a higher level of high horsepower rigs is anticipated.
− Well capital and steel needed for pipelines, tubing and casing is similarly manageable and comparable to recent historical levels.
− Proppant needed for fracture stimulation may double or treble versus 2010 estimates (flat to double versus 2008) over 40 years.
− Water (including primary and re-use) needed for fracture stimulation could increase 50–150% to approximately 2.5 billion barrels of water annually, less than 0.1% of U.S. water withdrawal in 2000 (less than 0.2% of U.S. water withdrawal in 2000 excluding hydroelectric use).
Natural Gas Infrastructure
History and Context
The U.S. natural gas infrastructure system com-prises a network of buried transmission, gathering and local distribution pipelines, natural gas process-ing, LNG, and storage facilities. Natural gas gather-ing and processing facilities are necessarily located close to sources of production. They gather gas from producing wells and remove water, volatile compo-nents and contaminants before the gas is fed into transmission pipelines, which transport natural gas from producing regions to consuming regions. Stor-age facilities are located in both production areas and near market areas, subject to geological limi-tations and market forces. North American natu-ral gas infrastructure has developed over the past 30 years to link regions of supply with regions of demand. Major production basins in the Gulf of Mexico, Appalachia, Western Canada, and the Rocky Mountains connect to population centers in the Northeast, Upper Midwest, West Coast, and South-east markets.
Natural gas gathering and processing infrastruc-ture collects natural gas from producers, processes it to meet the specifications of pipeline quality gas, and delivers it into the pipeline grid. There are cur-rently 38,000 miles of gas gathering infrastructure in the United States and approximately 85 Bcf/day of gas processing capacity. Gathering and processing facilities are generally subject to oversight by state regulators.

Chapter 1 - resourCes and supply 161
Existing infrastructure will come under pressure in some regions, particularly regions with higher sup-ply costs that are unable to maintain or grow pro-duction in competition with lower cost shale gas. Shifting gas supply will result in the closing of some processing facilities and may drive business clo-sures and consolidations in some regions. In other regions, new infrastructure will be required, includ-ing gathering pipelines and processing plants in pro-ducing regions, and possibly new pipelines to trans-port ethane and other natural gas liquids.
there are 401 active underground natural gas storage fields with a total working gas capacity of approximately 4.2 Tcf. Of that amount, 2.6 Tcf serves interstate commerce.
Infrastructure Development Issues
Gathering and Processing
The rapid growth of shale gas production and its transformative effect on North American gas supply is changing the gathering and processing industry.
Gas hydrate is a solid naturally occurring sub-stance consisting predominantly of methane gas and water that occurs throughout Arctic regions and beneath the outer continental shelves through-out the world. In hydrates, water molecules form an open, solid lattice that encloses methane. Many scientists believe gas hydrates are one of the larg-est storehouses for carbon on the planet. The U.S. Geological Survey first assessed technologically recoverable gas volumes in 2008 and estimated 85 Tcf of gas could be recovered from Alaska’s North Slope. A 2009 Minerals Management Service (MMS) assessment reported more than 21,000 Tcf of gas in place in hydrate form in the Gulf of Mexico with a mean, statistical estimate of more than 6,700 Tcf.
It’s still unclear whether gas can be commercially developed from hydrates, though field tests in Korea, India and China have been promising. Field production test experiments in the United States are still pending with the first planned for the Alaska North Slope. Looking forward through 2050, sce-narios suggest production from gas hydrates in the United States could range from 10 Bcf/yr to 10 Tcf/yr. There are several technological chal-lenges to producing gas hydrates. Hydrates are found only in deep waters or the arctic. The dis-association of the hydrates once removed from its temperature/pressure regime requires develop-ment of specialized equipment to recover and pre-serve the gas. Domestically, research into hydrates as a resource is primarily conducted by federal agencies and academia. Global R&D efforts sug-gest that gas hydrates found in sand reservoirs are
the best target for early production due to higher methane saturation levels and the suitability of sand to well development. After the MMS report on hydrates in the Gulf of Mexico, the gas hydrates Joint Industry Project conducted logging-while-drilling operations at seven wells at three sites with the intent of discovering sand reservoirs with gas hydrates. Six of the seven wells confirmed pre-dictions of sand with gas hydrates, most of them at high saturation levels.
Research on production technologies in the United States and Japan is focused on production via well bores. Researchers have ruled out surface dredging or shallow-subsea mining. The environ-mental harm is too great and the energy in such deposits is likely too small to be of value. Of the various well-based approaches proposed, reservoir depressurization and chemical exchange are the most promising. Depressurization breaks the gas hydrate into gas and water components. Both are driven to the well bore and produced to the sur-face. Chemical exchange – CO2 for CH4 – offers the potential to sequester CO2 while releasing the gas. The challenge is that CO2 immediately forms into a hydrate when it reaches water in the formation, creating the potential for only limited injection of CO2 and production of methane. To further evalu-ate the potential for exchange, DOE is collaborat-ing with Conoco Phillips to conduct a short field trial in Alaska this year. Gas hydrates have strong climate implications. The findings to date suggest gas hydrates can play a significant role in large, acute and global climate events such as those that occurred in the Earth’s ancient past.
Methane hydrates

162 prudent deVelopMent: realizing the potential of north america’s abundant natural Gas and oil resources
state pipeline to transport Marcellus shale basin gas are under construction, 449 miles are pending, and almost 1,000 miles of potential projects have been announced. An interesting characteristic of the Mar-cellus Basin area pipelines is that while the total capac-ity proposed will be large, the mileage will be seem-ingly small when compared to long haul pipelines in the west. This is due to the proximity of this supply to highly populated east coast markets.
Another important potential source of gas supply for the lower-48 states is the North Slope of Alaska, with approximately 35 Tcf of gas reserves. Beginning with the passage of the Alaska Natural Gas Transpor-tation Act in 1976, projects have been considered to transport Alaskan gas. In 2004, Congress passed the Alaska Natural Gas Pipeline Act with the objective to facilitate the timely development of an Alaskan natural gas transportation project to transport natu-ral gas from the North Slope of Alaska to the lower-48 states. The Act also confirmed the Commission’s authority to authorize a pipeline to transport Alaskan natural gas to the lower-48 states and designated the Commission to be the lead agency for processing the National Environmental Policy Act documentation.
The TransCanada Alaska Pipeline project is a joint venture of TransCanada Alaska Company LLC and ExxonMobil. This project is designed to transport up to 4.5 Bcf/d of Alaskan North Slope gas to the Alaska-Canada border, approximately 750 miles. The project has a Canadian affiliate proposing to construct facili-ties from the Alaska-Canada border to existing facili-ties in Alberta. From Alberta, the gas would be trans-ported through existing facilities to delivery points in the United States. However, based on the apparent economics of Alaskan gas versus shale gas, it seems unlikely that Alaskan gas will be delivered to the lower-48 states in the foreseeable future.
The United States used an average of 66.1 Bcf/d of natural gas in 2010. This is far lower than the inter-state capacity of 183 Bcf/d. Nearly half the capacity we have today has been built since 1972. Because pipeline systems must be sized and designed for peak capacity rather than average capacity, much of apparent overcapacity is reflected in these numbers. Although this redundancy creates a robust and reli-able transmission system, it is not evenly distributed across North America. Pockets of constraints and areas of overcapacity still exist because of local supply and demand factors.
Shale gas production will be an increasingly impor-tant source of new production. The growth in shale gas development also has increased the recognized reserves of NGLs in the United States. However, the growth in liquids from all gas shale plays is not uni-formly distributed across the country. The NGL-rich gas plays are the Barnett in Texas, the western por-tion of the Marcellus in Pennsylvania, the Woodford in Oklahoma, the Eagle Ford play in southern Texas, and the Niobrara play in Colorado, Nebraska, and Kansas. The Fayetteville in Arkansas, the Haynesville in Louisiana, and the Horn River in Western Canada are dry by comparison.
Shale gas basins in new regions, such as the Mar-cellus in the Northeast and mid-Atlantic, will require an entirely new set of NGL pipelines to connect to markets. The public in some areas of this region is not accustomed to, and may be actively opposed to, production and processing facilities. Effective public outreach and consultation will be necessary for suc-cessful development.
Transmission Pipelines
Since 2000, FERC has approved over 16,000 miles of interstate pipeline and nearly five million horse-power of compression. These projects can be catego-rized either as greenfield pipelines (new pipelines in new rights-of-way) or as enhancements (i.e., looping of an existing pipeline, addition of compression, or extensions or laterals of an existing system). About 14,000 miles of interstate pipeline and 4.6 million horsepower of compression have also been placed into service.
Recent development of shale gas basins in the southeast U.S. has spawned a boom in transmis-sion pipeline construction in that part of the coun-try. Shale gas supplies have been connected, via new pipelines, to the traditional long-line pipelines that transport natural gas from the Gulf of Mexico to the mid-Atlantic and northeast U.S. Over 2,400 miles of interstate pipeline has been approved to move south-east U.S. shale gas.
Looking to the future, pipeline construction will continue in the southeast U.S. to access shale gas deposits. However, a major build-out of interstate pipeline capacity in the mid-Atlantic and northeast U.S. will be needed to transport gas from the Mar-cellus basin to markets. In fact, 201 miles of inter-
Chapter 1 - resourCes and supply 163
umes of new gas supply to the existing pipeline grid. The requirement for new gas processing infrastruc-ture will be driven by the large volumes of new gas production that are expected to be connected over the forecast period, and by the expectation that relatively strong oil prices will encourage investment in the extraction of natural gas liquids.
The June 2011 INGAA Foundation study on North American natural gas infrastructure needs through 2035 projects a cumulative need for almost 414,000 miles of gathering pipelines, including indi-vidual well connections, for a cumulative investment requirement (in nominal dollars) of about $50 bil-lion. The same study projects a need for 32 Bcf/d of gas processing capacity additions through 2035 for a total investment of $22 billion (in nominal dol-lars). This may need to be supplemented by new NGL pipelines, in particular from the Marcellus region to markets in the Midwest or Gulf Coast.
New Transmission Pipeline Requirements
Future pipeline infrastructure expansion will be driven by a shift in production from mature basins to areas of unconventional (i.e., shale) natural gas production. Regions with unconventional production growth, such as the Marcellus basin in the Appala-chian region of the northeast U.S., will experience the greatest infrastructure investment.
A demand-side factor that will influence construc-tion of more transmission pipeline is the expected increase in gas-fired electric generation as coal-fired generation is affected by expected environmental and carbon regulation. Gas-fired generation, given the amount of domestic shale gas, is likely to be relatively cheaper than in previous years and has approximately half the emissions of coal-fired generation.
The INGAA Foundation 2011 study estimates that by 2035 the expanded market will require about 36,000 miles of transmission pipelines and a fur-ther 14,000 miles of shorter lateral pipelines needed to connect new gas-fired power generation capac-ity, gas storage, and processing plants. This would require cumulative investments of nearly $130 billion (in nominal dollars) by 2035.
New Storage Requirements
Very few states have suitable depleted reservoirs, aquifers, and salt formations available for storage
Storage
FERC has authorized almost 970 Bcf of new under-ground storage capacity – either as expansions of existing storage fields or as new storage sites – since 2000. Since 2002, 416 Bcf of new capacity has actu-ally gone into service. Similar to historical pipeline expansion, storage development has mainly occurred in the south central U.S. to first accommodate the expected increase in imported liquefied natural gas, and, more recently, to store the gas produced from shale basins. This trend in the location of storage facilities is expected to continue.
Storage field development is limited by the chal-lenges of finding sites with the appropriate combina-tion of geological features, pipeline proximity, and the ability to obtain land, rights, and permitting. Large portions of the United States, including much of the Northeast, do not have geological structures conducive to underground gas storage.
Strong growth in gas demand for power gen-eration has increased demand for flexible, high- deliverability storage that can be cycled several times annually. Most of the value that these facili-ties create comes from short-term price volatility rather than the summer/winter price spreads that have underpinned traditional storage development.
Future Natural Gas Infrastructure Requirements
Estimating levels of needed infrastructure growth requires consideration of future supply and demand for natural gas. Fluctuating levels of supply and demand within an integrated market produces price signals that elicit an infrastructure investment response. For example, if supply develops in a region without suf-ficient pipeline capacity, a price difference develops between the supply area and downstream demand centers. If this difference is high enough, it signals a need for new pipeline capacity to allow more gas to flow. When seasonal price spreads develop, a signal is sent to the market to store gas in lower priced peri-ods and extract it when prices are higher. In addition, price volatility signals value for more storage capacity to provide a physical tool for shorter term balancing.
New Gathering and Processing Requirements
The requirement for new gas gathering infrastruc-ture will be driven by the need to connect large vol-
164 prudent deVelopMent: realizing the potential of north america’s abundant natural Gas and oil resources
NORTh AMeRICAN OIl AND GAS PRODUCTION PROSPeCTS TO 2050
Preceding sections of this chapter describe the most significant current and potential sources of North American oil and natural gas production available over the next several decades. There are many plau-sible permutations of the mix and timing of develop-ment of these resources and their translation into productive capacity. Factors that enable or constrain supply capacity development, be they geologic, tech-nical, or the result of public policy choice, can play out in many different ways, so this report does not present a definitive vision of North American oil and gas production in either 2035 or 2050. The ranges of production pathways shown earlier in this report suppose either a reasonably smooth path of develop-ment, surmounting the barriers which may exist, or a more limited outlook, in which barriers significantly constrain production capacity. Such enablers and challenges will, of course, exist beyond 2035, out to 2050 and beyond. However, if North America finds itself on the constrained pathway as 2035 approaches, it would be unwise to assume that it is possible to change course and expect to recover productive capac-ity by 2050, given the long lead times and develop-ment challenges involved in activating resources which have not already been the focus of attention.
With this perspective, it is reasonable to assume continuity in the trends to 2035 under either devel-opment case. In a development-constrained world, some supply sources would have declined to zero or a low number as existing reservoirs continue their natural decline and are not replenished by new drill-ing activity. This would be the case with the Arctic, for example, relying on a single pipeline to enable crude oil production to occur and be transported to mar-ket. Without further exploration, the pipeline will be shut down when flows fall below operational mini-mum rates, which would probably occur at some time during the 2040s. Offshore oil and gas output would also have declined to low production rates by 2050 if development is confined to the Gulf of Mexico. Just as existing production would be subject to decline, new sources would likely not be developed in the con-strained world. New Arctic exploration would not be deemed viable, other offshore areas would prob-ably remain restricted to development, and onshore conventional and unconventional oil supplies would
development. Areas without much storage potential include Nevada, Idaho and Arizona, the Central Plains states, Missouri and almost the entire East Coast (except for portions of western New York, western Pennsylvania, and West Virginia). Any target storage formation must first be reasonably close to a major pipeline before storage development can be consid-ered.
Salt cavern storage is expected to dominate new storage development, essentially doubling over the forecast period. The 2011 INGAA Foundation study estimates approximately 590 Bcf of new storage capacity is required by 2035 to meet market growth for a cumulative investment of about $5 billion (in nominal dollars).
Key Findings y Growing shale gas supply will create a significant requirement for new gathering, processing, and pipeline infrastructure.
y New storage requirements for the growing natural gas market are relatively modest.
y Strong oil prices relative to gas prices are driving development to liquids-rich areas and creating a need for new processing infrastructure.
y New pipelines may be required to move natural gas liquids from producing areas to established markets.
y Development of shale supply from new basins will put pressure on existing infrastructure in high cost supply regions.
y Existing infrastructure should be used, when prac-tical, to reduce capital requirements and environ-mental impacts.
y Development of a pipeline from Alaska’s North Slope to the integrated North American market would require significant investment.
y The growing gas infrastructure grid can support significant switching from coal to gas in electric generation and underpin the use of natural gas as a transport fuel.
y The development of shale gas supply further increases the reliability of the natural gas infra-structure by increasing production from regions not prone to hurricanes, and by geographically diversifying natural gas supply.
y Governments should ensure that efficient siting and other regulatory processes are in place to underpin necessary infrastructure investment.

Chapter 1 - resourCes and supply 165
can support supplies for decades to come and by 2050, given sustained technology development, it is likely that currently assessed resources will be augmented by methane hydrates from the Arctic and the Gulf of Mexico. The size of this potential resource could reasonably be expected to supply the North American natural gas market into the next century, and provide opportunities for deployment of those technologies in other regions of the world where methane hydrate resources are identified. On the oil side, vast Canadian oil sands resources could enable continued growth in production through 2050, allowing Canada to remain one of the largest oil producing countries, with considerable benefits for the North American econ-omy and energy security. Oil shale from the Colorado and Utah kerogen deposits could become a very signif-icant supply of oil – again, if technology development and access is sustained in the interim period.
be faced with increasingly stringent challenges. Methane hydrates and oil shale development would also be seriously at risk from prolonged access and development constraints. In the case of natural gas, conventional resources that do not depend on hydrau-lic fracturing would be mostly played out well before 2050 leaving the North American gas market to be largely supplied by imports. The additional demand for global natural gas supplies would probably amplify the supply/demand stresses in the global market with potentially serious consequences for the economy and for energy security.
In contrast, if prudent development, in all its senses, is enabled over the long-term, through 2050 and beyond, a large contribution to North America’s oil and natural gas market requirements can be met from domestic production. The natural gas resource