CHAPTER J.R. Christy, Univ. of AL in Huntsville
18
Temperature Trends in the Lower Atmosphere - Understanding and Reconciling Differences What is our understanding of the contribution made by observational or methodological uncertainties to the previously reported vertical differences in temperature trends? Convening Lead Author: Carl A. Mears, Remote Sensing Systems Lead Authors: C.E. Forest, MIT; R.W. Spencer, Univ. of AL in Huntsville; R. S. Vose, NOAA; R.W. Reynolds, NOAA Contributing Authors: P.W. Thorne, U. K. Met. Office; J.R. Christy, Univ. of AL in Huntsville CHAPTER 4 71 KEY FNDNGS Surface It is likely that errors in the homogenized surface air temperature data do not contribute substantially to the large-scale differences between trends for different levels because these errors are very likely to be smaller than those for the upper air data. • Systematic local biases in surface trends may exist due to changes in station exposure or instrumenta- tion over land, and due to the small number of measurements over a number of regions of the Earth, including parts of the oceans, sea ice areas, and some land areas. Such biases have been documented at the local and regional scale, but no such effect (including any significant urban bias) has been identified in the zonal and global averages presented in this Report. On large spatial scales, sampling studies suggest that these local biases in trends are likely to mostly cancel through the use of many observations with differing instrumentation. • Since all known bias adjustments have not yet been applied to sea surface temperature data, it is likely that errors remain in these data, though it is generally agreed that these errors are likely to be small compared to errors in radiosonde and satellite measurements of the upper air, especially for the satel- lite era. Troposphere While all data sets indicate that the troposphere has warmed over both the radiosonde era and the satel- lite era, uncertainties in the tropospheric data make it difficult to determine whether the troposphere has warmed more than or less than the surface. Some tropospheric data sets indicate that the troposphere has warmed more than the surface, while others indicate the opposite. • It is very likely that errors remain in the adjusted radiosonde data sets in the troposphere since the methods used to produce them are only able to detect and remove the more obvious errors, and involve many subjective decisions. It is likely that a net spurious cooling corrupts the area-averaged adjusted radiosonde data in the tropical troposphere in at least one and probably both of the data sets, causing the data to indicate less warming than has actually occurred. • For tropospheric satellite data (T 2 and T 2LT ), the primary cause of trend discrepancies between dif- ferent versions of the data sets is differences in how the data from the different satellites are merged together. • A secondary contribution to the differences between these data sets is the difference between the diurnal adjustments that are used to account for drifting measurement times. These differences in the diurnal adjustment are more important for regional trends than for global trends, though regional trend differences are also partly influenced by differences in merging methods.
Transcript of CHAPTER J.R. Christy, Univ. of AL in Huntsville

Temperature Trends in the Lower Atmosphere - Understanding and Reconciling Differences
What is our understanding of the contribution made by observational or methodological uncertainties to the previously reported vertical differences in temperature trends?
Convening Lead Author: Carl A. Mears, Remote Sensing SystemsLead Authors: C.E. Forest, MIT; R.W. Spencer, Univ. of AL in Huntsville; R. S. Vose, NOAA; R.W. Reynolds, NOAAContributing Authors: P.W. Thorne, U. K. Met. Office; J.R. Christy, Univ. of AL in HuntsvilleC
HA
PTER
4
PB 71
KEy F�nd�nGS
Surface It is likely that errors in the homogenized surface air temperature data do not contribute substantially to the large-scale differences between trends for different levels because these errors are very likely to be smaller than those for the upper air data.• Systematic local biases in surface trends may exist due to changes in station exposure or instrumenta-
tion over land, and due to the small number of measurements over a number of regions of the Earth, including parts of the oceans, sea ice areas, and some land areas. Such biases have been documented at the local and regional scale, but no such effect (including any significant urban bias) has been identified in the zonal and global averages presented in this Report. On large spatial scales, sampling studies suggest that these local biases in trends are likely to mostly cancel through the use of many observations with differing instrumentation.
• Since all known bias adjustments have not yet been applied to sea surface temperature data, it is likely that errors remain in these data, though it is generally agreed that these errors are likely to be small compared to errors in radiosonde and satellite measurements of the upper air, especially for the satel-lite era.
TroposphereWhile all data sets indicate that the troposphere has warmed over both the radiosonde era and the satel-lite era, uncertainties in the tropospheric data make it difficult to determine whether the troposphere has warmed more than or less than the surface. Some tropospheric data sets indicate that the troposphere has warmed more than the surface, while others indicate the opposite. • It is very likely that errors remain in the adjusted radiosonde data sets in the troposphere since the
methods used to produce them are only able to detect and remove the more obvious errors, and involve many subjective decisions. It is likely that a net spurious cooling corrupts the area-averaged adjusted radiosonde data in the tropical troposphere in at least one and probably both of the data sets, causing the data to indicate less warming than has actually occurred.
• For tropospheric satellite data (T2 and T2LT), the primary cause of trend discrepancies between dif-ferent versions of the data sets is differences in how the data from the different satellites are merged together.
• A secondary contribution to the differences between these data sets is the difference between the diurnal adjustments that are used to account for drifting measurement times. These differences in the diurnal adjustment are more important for regional trends than for global trends, though regional trend differences are also partly influenced by differences in merging methods.

The U.S. Climate Change Science Program Chapter 4
72 7372 73
CHAPTER �: Recommendations
All of the surface and atmospheric temperature datasets used in this report have undergone extensive testing and analysis in an effort to make them useful tools for investigating Earth’s climate during the recent past. In order to further increase our confidence in their use as climate diagnostics, they require ongoing assessment to further quantify uncertainty and to identify and remove any possible systematic biases that remain after the appropriate homogenization methods have been applied.
• The diurnal cycles in both atmospheric and surface temperature need to be accurately determined and vali-dated to reduce uncertainties in the satellite data due to the diurnal adjustment. Possible approaches include examining more model or reanalysis data to check the diurnal adjustments currently in use, concerted in situ measurement campaigns at a number of representative locations, or operating satellite-borne sounders in a non Sun-synchronous orbit. Information about the surface skin temperature diurnal cycle may be obtained by studying data from existing satellites, or the upcoming Global Precipitation Mission.
• The relative merits of different merging methods for satellite data for all relevant layers need to be diagnosed in detail. Possible approaches include comparison with other temperature data sources (radiosondes or IR satellites) over limited time periods where the discrepancies between the satellite results are the greatest, comparison with other ancillary data sources such as winds and integrated water vapor, and comparison of trends on regional spatial scales, particularly in regions where trends are large or well characterized by radiosonde data.
• The methods used to remove radiosonde inhomogeneities and their effects on trends need to be rigorously studied. The detailed intercomparisons of the methods used by different groups to construct satellite-based climate records have been beneficial to our understanding of these products, and similar parallel efforts to create climate records from radiosonde data would be likely to provide similar benefits.
• Possible errors in trends in spatially averaged surface temperature need to be assessed further. On land these errors may arise from local errors due to changes in instrumentation or local environment that do not completely cancel when spatial averaging is performed. Over the ocean, these errors may arise from the small number of samples available in many regions, and long-term changes in measurement methods. For historical data, these assessments may benefit from the recovery of additional metadata to better character-ize possible non-climatic signals and from efforts to assess the self-consistency of historical data.
• Tools and methods need to be developed to help reduce structural uncertainty by providing methods to objectively differentiate between different datasets and construction methods. To the extent possible, such tools should be based on generally accepted physical principles, such as consistency of the temperature changes at adjacent levels in the atmosphere, include physically-based comparisons with external ancillary data, and take account of the consistency of intermediate data generated while producing the datasets.
• Each tropospheric satellite data set has strengths and weaknesses that are coming into better focus. Improvements have occurred in several data sets even during the drafting of this Report, each moving it closer to the others, suggesting that further convergence in the not-too-distant future is a strong possibility.
• Comparisons between radiosonde data and satellite data for T2 are very likely to be cor-rupted by the excessive cooling in the radiosonde data from the stratosphere which are used to help construct the radiosonde-derived T2 data. Trend discrepancies between radiosonde and satellite data sets are reduced by considering a multi-channel retrieval that estimates and removes the stratospheric influence (T*G).
StratosphereDespite their large discrepancies, all data sets indicate that the stratosphere has cooled con-siderably over both the radiosonde era and the satellite era.• The largest discrepancies between data sets are in the stratosphere, particularly between the
radiosonde and satellite-based data sets. It is very likely that the satellite-sonde discrepancy arises primarily from uncorrected errors in the radiosonde data.
• There are also substantial discrepancies between the satellite data sets in the stratosphere, indicating that there remain unresolved issues with these data sets as well.

72 73
Temperature Trends in the Lower Atmosphere - Understanding and Reconciling Differences
72 73
1. BACKGRoUnd
In the previous Chapter, we have discussed a number of estimates of vertically resolved global temperature trends. Different sources of data (e.g., surface measurements, vertical pro-files from radiosondes, and data from satellite borne sounding radiometers), as well as differ-ent analysis methods applied to the same data, can yield long term (multi-decadal) temperature trends that differ by as much as several tenths of a ºC per decade. This is of comparable mag-nitude to the actual climate change signal being searched for. In this chapter we discuss these discrepancies in light of the observing system capabilities and limitations described in Chap-ter 2. We note the degree to which estimates of uncertainty can account for the differences in reported values for the temperature trends in given layers, and differences in the trends of adjacent layers. Most of the time our focus will be on the period from 1979-2004 during which atmospheric temperatures were observed using multiple observing systems.
We begin our discussion in the stratosphere, and move to successively lower layers until we reach the Earth’s surface. We proceed in this order because the largest discrepancies in trends between data sources occur in upper atmospheric layers, especially the stratosphere. As mentioned in Box 2.1 (in Chapter 2), when satellite-equivalent measures are made from vertically resolved radiosonde data to facilitate comparisons between the two systems, large stratospheric errors can significantly influ-ence measures centered much lower in the atmosphere.
2. UnCERTA�nTy �n STRAToSPHER�C TEMPERATURE TREndS
Long-term observations of the stratosphere have been made by two observing systems: radiosondes and satellite-borne sounders. On both the global and the zonally averaged scale, there is considerably less variation between data sets derived from the same type of observing system for this layer than between those from different observing systems. This can be seen in the leftmost panel of Fig. 3.5, which shows the zonally averaged trends over the satellite
era (1979-2004) for two radiosonde-based data sets, and two satellite-based data sets. The ra-diosonde data (T4-HadAT2 and T4-RATPAC) show more cooling than data sets based on satellite data (T4-UAH and T4-RSS), and also do not show the reduced cooling in the tropics relative to the mid-latitudes that is seen in the satellite data.
2.1 Radiosonde Uncertainty in the StratosphereRadiosonde data are plagued by numerous spu-rious discontinuities in measured temperature that must be detected and removed in order to construct a homogenized long-term record of atmospheric temperature, a task that is particu-larly difficult in the absence of reliable metadata describing changes in instrumentation or ob-serving practice. A number of physical sources of such discontinuities have larger effects in the stratosphere. The lower atmospheric pressure in the stratosphere leads to reduced thermal contact between the air and the temperature sensor in the radiosonde package. This in turn leads to increased errors due to daytime solar heating and lags between the real atmospheric temperature and the sensor response as the in-strument rises through atmospheric layers with rapidly varying temperatures. Such systematic errors are not im-portant for trend studies provided that they do not change over the time period be-ing studied. In practice, as noted in Chapter 2, ra-diosonde design, observing prac-tices, and proce-dures used to at-tempt to correct for radiation and lag errors have all changed over time.
Pa s t a t t empt s to make adjust-ments to radio-sonde data using detailed physical models of the in-

The U.S. Climate Change Science Program Chapter 4
7� 757� 75
struments (Luers and Eskridge, 1998) improved data homogeneity in the stratosphere, but not in the troposphere (Durre et al., 2002). Since it is important to use the same methods for all radiosonde levels for consistency, scientists have tended to instead use empirical methods to deduce the presence and magnitude of any sus-pected discontinuity. Both of the homogenized radiosonde data sets used in this report make these estimates using retrospective statistical analyses of the radiosonde data without input from other measurements. The investigators who constructed these data sets have attempted to identify and to adjust for the effects of sus-pected change points, either by examination of station time series in isolation (RATPAC), or by comparison with nearby stations (HadAT2). Both approaches can most successfully identify changes that are large and step-like. While based in statistics, both these methods also include significant subjective components. As a result, different investigators with nominally the same sets of radiosonde data can calculate different trend estimates because of differences in adjustment procedures (Free et al., 2002). The lack of sensitivity to small or gradual changes may bias the resulting homogenized products if such changes are numerous and predominantly of one sign or the other1. The relative frequency of large step-like changes and smaller changes that may be statistically indistinguishable from natural variability remains an open question. Since the adjustments needed to remove the resulting discontinuities tend to be larger for the stratosphere than for lower levels (Parker et al., 1997; Christy et al.,2003; Lanzante et al., 2003), the uncertainty associated with the homogenization procedures is very likely to be larger in the stratosphere than at lower levels, as has been shown for the HadAT2 radiosonde data set (Thorne et al., 2005a). The best esti-mate of the size of this source of uncertainty is obtained by comparing the statistics (e.g., the trends) from the two adjusted radiosonde data sets that are currently available. However, the HadAT2 group analysis is partly based upon the RATPAC data set, so we may be under-estimat-ing the uncertainty. Only through increasing
1 It is speculated that gradual changes could result from the same changes in instrumentation or practices that cause the step like changes, provided that these changes are implemented gradually (Lanzante et al., 2003).
the number of independently produced data sets under different working assumptions can we truly constrain the uncertainty (Thorne et al., 2005b).
Differences in trends between daytime and nighttime observations in the uncorrected radiosonde data used in constructing the RATPAC and HadAT2 radiosonde data sets, suggest that the biases caused by solar heat-ing2 have been reduced over time, leading to a spurious cooling trend in the raw daytime data (Sherwood et al., 2005). Many of the changes in observing practice will affect both day and night time observations; e.g., a change in prac-tice may yield a spurious 0.5ºC daytime cooling and 0.4ºC night time cooling, so day-night dif-ferences cannot be used in isolation to correct the observations. Whether the RATPAC and HadAT2 methods have successfully removed day-night and other effects, or if sufficiently targeted are capable of doing so, is a matter for ongoing research. Randel and Wu (2005) have shown for a subset of tropical stations in the RATPAC data set, there is strong evidence for step-like residual cooling biases following homogenization, which will cause a spurious cooling in the tropical area-averaged RATPAC time series considered here. They find that the effect is not limited to daytime launches, as would be expected from discussions above, and that it is likely to affect at least the upper-tropo-sphere as well as the stratosphere. Finally, the balloons that carry the instruments aloft have improved over time, so they are less likely to burst at high altitudes or in extreme cold. This could also lead to a warm sampling bias within the stratosphere in early radiosondes which has gradually ameliorated with time, introducing a spurious stratospheric cooling signal (Parker and Cox, 1995). Taken together these results imply that any residual systematic errors in the homogenized radiosonde products will likely lead to a spurious cooling bias.
2 For some types of radiosondes, radiation adjust-ments based on information provided by the manu-facturer are made as part of routine processing of radiosonde data by the observing station. The findings cited here refer to data that has already had these cor-rections performed. The reduction in daytime biases is likely to be due to a combination of improvements in instrument design, and improvements in the radiation adjustment procedure.
Different investigators with nominally the same sets of radiosonde data can calculate different trend estimates because of differences in adjustment procedures.

7� 75
Temperature Trends in the Lower Atmosphere - Understanding and Reconciling Differences
7� 75
Since the radiosonde stations selected for inclu-sion in the adjusted data sets do not cover the entire globe3, there can be a bias introduced in to the global mean trend depending on the loca-tions of the chosen stations. On a global scale, this bias has been estimated to be less than 0.02 to 0.03ºC/decade for T4 by sub-sampling global-ly complete satellite or reanalysis data sets at the station locations4, and thus it is not an important cause of the differences between the data sets on large spatial scales (Hurrell et al., 2000; Free and Seidel, 2005). Though they have not been explicitly calculated, sampling errors are likely to be more important for the zonal radiosonde trends plotted in Figure 3.5, and may account for some of the zone-to-zone variability seen in the radiosonde data in that figure that is not duplicated in the smoother satellite data. The sampling effects also permeate in the vertical - above 100hPa there is a significant reduction in the number of valid measurements whereas below this level the number of measurements is relatively stable. Because the trends vary with height, this can lead to errors, particularly when calculating satellite-equivalent measures.
2.2 Satellite Uncertainty in the StratosphereThe two satellite-based stratospheric data sets (T4-UAH and T4-RSS) have received considerably less attention than their tropospheric coun-terparts (see section 4.3 below), though they differ in estimated trend by roughly the same absolute amount (~0.1ºC/decade) as the cor-responding tropospheric data sets produced by the same institutions. However the importance of the differences is perceived to be much less because the trend is much larger (a cooling over 1979-2004 of approximately 0.8ºC). A detailed comparison of the methods used to construct the two data sets has not yet been performed. Despite the lack of such a study, it is very likely that in the stratosphere, like the troposphere (discussed in section 4.3), structural uncertainty is the most important source of uncertainty.
3 In the Southern Hemisphere, not even all latitude bands are represented
4 This estimate is valid for the RATPAC data set and a previous version of the HadAT2 data set. The estimated bias increases to about 0.05°C for a tropical average. In the cited work the tropics were defined to be 30°S to 30°N – we would expect the sampled error to be a few hundredths of a degree per decade larger for the 20°S to 20°N definition of the tropics used in this report.
Two important types of structural uncertainty are likely to dominate: those associated with the method of correcting for drifts in diurnal sampling time, and those associated with the method of correcting calibration drifts associ-ated with the temperature of the hot calibration target. Section 3 discusses how these uncer-tainty sources are treated in the troposphere.
Despite unresolved problems in the satellite data sets, the similarity of the satellite measure-ment and homogenization methods suggest that the satellite measurements of the stratosphere are no more uncertain than those of the mid-troposphere, where satellites and radiosondes are in much closer agreement. This assessment, coupled with the evidence presented above that residual artificial cooling is likely to exist in the stratospheric radiosonde data, particularly in the tropics, implies that the discrepancy between radiosonde and satellite estimates of stratospheric trends (see Table 3.3) during the satellite era is very likely to be mostly due to uncorrected biases in the radiosonde measure-ments.
3. UnCERTA�nTy �n TRoPoSPHER�C TREndS
In contrast to the stratosphere, differences in reported tropospheric trends from the same type of measurement are as large or larger than differences in trends reported from different data sources. This can be seen in Figure 3.5 and Tables 3.3 and 3.4. Also note that the radiosonde data for the two tropospheric layers show the
The discrepancy between radiosonde
and satellite estimates of
stratospheric trends during the satellite era is very likely to
be mostly due to uncorrected biases in the radiosonde
measurements.

The U.S. Climate Change Science Program Chapter 4
76 7776 77
same general north-south pattern (i.e., more temperature increase in the mid-latitudes than at the poles or in the tropics) as the satellite data, in contrast to the stratospheric results.
3.1 Radiosonde Uncertainty in the TroposphereThe main sources of error in tropospheric radio-sonde trends are similar to those encountered in the stratosphere. The challenge is to assess to what extent these types of errors, which in the stratosphere likely result in artificial cool-ing even in homogenized data sets, extend down into the troposphere. Another important issue is that when performing calculations to directly compare radiosonde data with satel-lite trends for the T2 layer, the contribution of errors in the stratospheric trends to the results for this layer become important, since 10% to 15% of the weight for this layer comes from the stratosphere.
3.1.1 remoVing non-climaTic influ-ences.
There are several pieces of evidence that sug-gest that any residual bias in tropospheric ra-diosonde data will be towards a cooling. First, the more obvious step-like inhomogeneities that have been found tend to predominantly intro-duce spurious cooling into the raw time series, especially in the tropics. This suggests that any undetected change points may also favor spu-rious cooling (Lanzante et al., 2003). Second, solar-heating-induced errors, while largest in the stratosphere have been found to bias day-time measurements to higher temperatures at all levels, particularly in the tropics. Periodic radiosonde intercomparisons (most recently at Mauritius in Feb. 2005) undertaken under the auspices of the World Meteorological Organiza-tion (WMO) imply that the magnitude of these errors has been reduced over time, and that radiosondes from independent manufacturers have become increasingly similar (and presum-ably more accurate) over time5 (da Silveira et al., 2003; Nash et al., 2005). If these effects have on average been uncorrected by the statistical procedures used to construct the homogenized radiosonde data sets discussed in this report, they would have introduced an artificial cooling
5 These intercomparisons provide a source of data about the differences between different type of sondes that has not yet been used to homogenize sonde data.
signal into the radiosonde records. Of course on an individual station basis the picture is likely to be much more ambiguous and many stations records, even following homogenization efforts, are likely to retain large residual warm or cold biases. But on average, the evidence outlined above suggests that if there is a preferred sign it is likely to be towards a residual cooling. It is important to stress that to date the quantitative evidence to support such an argument, at least away from a small number of tropical stations (Randel and Wu, 2006), is at best ambiguous.
3.1.2 sampling uncerTainTy
The fact that most radiosonde data are primar-ily collected over Northern Hemispheric land areas naturally leads to uncertainties about whether or not averages constructed from ra-diosonde data can faithfully represent global trends. However, Wallis (1998), Hurrell et al. (2000), and Thorne et al. (2005a) show that sta-tions can be representative of much larger scale averages above the boundary layer, particularly within the deep tropics. Spatial and temporal sampling errors for the radiosonde data sets have been assessed by sub-sampling trends in reanalyses or satellite data at the locations of radiosonde stations used in the production of global data sets, and comparing the results to the full global average of the reanalysis or satel-lite data (Hurrell et al., 2000; Free and Seidel, 2004). Typically, errors of a few hundredths of a ºC per decade have been estimated for global averages, too small to fully account for the differences between radiosonde and satellite trends, though it has been suggested that the existing sampling could lead to a warm bias in the radiosonde record (Agudelo and Curry, 2004). As is the case for the stratosphere, sam-pling errors may be part of the cause for the zone-to-zone variability seen in the radiosonde data. Residual differences between the global means of the two radiosonde data sets are as-sessed to be approximately equally caused by sampling error, choice of raw data, and choice of adjustments made6.
6 This comparison was made using a previous version of the UK data set (HadRT), which uses a different set of stations than the current version. This difference is very unlikely to substantially alter these conclu-sions.
Any residual bias in tropospheric radiosonde data is likely to be towards a cooling.

76 77
Temperature Trends in the Lower Atmosphere - Understanding and Reconciling Differences
76 77
3.1.3 The influence of uncerTainTy in sTraTospheric measuremenTs
To compare data that represent identical lay-ers in the atmosphere, “satellite-equivalent” radiosonde data products have been constructed using a weighted average of radiosonde tem-peratures at a range of levels (see Box 2.1, Chap-ter 2). The T2 radiosonde data sets have been constructed to match the weighting function for Microwave Sounding Unit (MSU) channel 2. Since 10% to 15% of the weight for this channel comes from the stratosphere (see Figure 2.1), it is important to keep in mind the suspected relatively large errors in the stratospheric mea-surements made by radiosondes. It is possible that stratospheric errors could cause the trends in the radiosonde-derived T2 to be as much as 0.05ºC/decade too cool, particularly in the trop-ics, where the suspected stratospheric errors are the largest (Randel and Wu, 2005) and therefore have a large impact on area-weighted averages. This error source may be partly eliminated by considering the multi-channel tropospheric retrievals discussed in section 5 below.
3.2. Satellite Uncertainty in the TroposphereSatellite-derived temperature trends in the middle and upper troposphere have received considerable attention. In particular, the causes of the differences between T2-UAH and T2-RSS have been examined in detail; less work has been done concerning T2-UMd because this data set is newer. There are two potentially impor-tant contributions to the residual uncertainty in satellite estimates of global trends for the satellite-based data sets: (1) corrections for drifts in diurnal sampling, and (2) different methods of merging data from the series of different satellites.
3.2.1 diurnal sampling correcTions During the lifetime of each satellite, the orbital parameters tend to drift slowly with time. This includes both a slow change of the local equator crossing time (LECT), and a decay of orbital height over time due to drag by the upper at-mosphere. The LECT is the time at which the satellite passes over the equator in a northward direction. Changes in LECT indicate corre-sponding changes in local observation time for the entire orbit. Because the temperature changes with the time of day (e.g., the cycle of
daytime heating and nighttime cooling), slow changes in observation time can cause a spuri-ous long-term trend. These diurnal sampling effects must be estimated and removed in order to produce a climate-quality data record.The three research groups that are actively analyzing data from microwave satellite sounders first average together the ascending and descending orbits, which has the effect of removing most of the first harmonic of the diurnal cycle. For the purposes of this report, “diurnal correction” means the removal of the second and higher harmonics. Each group uses a different method to perform the diurnal correction. The UAH group calculates mean differences by subtracting the temperature measurements on one side of the satellite track from the other (Christy et al., 2000). This produces an esti-mate of how much, on average, the temperature changes due to the difference in local observa-tion times from one side of the satellite swath to another, typically about 40 minutes. This method has the advantage of not relying on data from other sources to determine the diurnal cycle, but it has been shown to be sensitive to satellite attitude errors (Mears and Wentz, 2005), and is too noisy to produce a diurnal adjustment useable on small spatial scales. The RSS group uses hourly output from a climate model in a microwave radiative trans-fer algorithm to estimate the diurnal cycle in brightness temperature at each grid point in the satellite data set (Mears et al., 2003). This method has the advantage that a diurnal adjustment can be made at the data resolution. However, it is likely that the climate model-based adjustment contains errors, both because models are often unable to accurately represent the diurnal cycle7 (Dai and Trenberth, 2004),
7 Dai and Trenberth found that the CCSM2 climate model (whose atmospheric component is similar to the CCM3 model used by the RSS group) often un-derestimated the surface diurnal cycle over the oceans relative to the observational data set they used, with the model indicating that the diurnal amplitude is in the range of 0.0 to 0.4ºC, while their observations, derived from ship data, indicate a range of 0.4 to 1.0ºC. However, the model range is more consistent with satellite observations of diurnal skin tempera-ture (Gentemann, et al). It is possible that spurious diurnal signals due to solar heating of the measure-ment apparatus have not been completely removed from the ship data. Dai and Trenberth found that the
Satellite-derived temperature trends in the
middle and upper troposphere
have received considerable
attention.

The U.S. Climate Change Science Program Chapter 4
78 7978 79
and because the parameterization of the ocean surface temperature used as a lower boundary for the atmospheric component of the climate model used does not include diurnal variability. The model has been shown to represent the first harmonic of the diurnal cycle for MSU channel 2 with less than 10% error, but less is known about the accuracy of the second and higher harmonics that are more important for adjusting for the diurnal sampling errors (Mears et al., 2003). Both groups use their diurnal cycle techniques to adjust the satellite data before merging the data from the different satellites. In contrast, the Maryland group averaged the ascending and descending satellite data to remove only the first harmonic in the diurnal cycle before merging, and used a fitting procedure to ac-count for both the first and second harmonic diurnal components when performing the trend analysis after merging the data from different satellites (Vinnikov and Grody, 2003; Vinnikov et al., 2006). Since they only accounted for the first harmonic diurnal component during the merging of satellite data, errors in the diurnal cycle can cause errors in the data analysis fol-lowing the merging procedure. Although the removal of the diurnal cycle before merging may also introduce some error into UAH and RSS merging procedures if the assumed diurnal cycle is inaccurate, the removal of the diurnal harmonics before merging seems to be a more logical approach as the diurnal harmonics will tend to cause errors unless removed. On a global scale, the total impact of the diur-nal correction applied by the RSS and UAH groups to the microwave sounding data for the RSS data is to increase the decadal trend by about 0.03ºC/decade for T2 (Christy et al., 2003; Mears et al., 2003). The impact of the Maryland group’s adjustment is almost negligible. For the RSS T2 data, when a diurnal correction is ap-plied that is 50% or 150% as large as the best estimate, these adjustments significantly wors-en the magnitude of the intersatellite differ-ences. Changes of this magnitude in the diurnal cycle lead to temperature trends that differ by 0.015ºC; so we estimate that the uncertainty in trends due to uncertainty in the diurnal correc-
model accurately represents the diurnal pressure tide, suggesting that upper air temperatures are reliable.
tion is about 0.015ºC/decade for T2. The UAH group estimates that the diurnal correction for T2 is known to 0.01ºC/decade (Christy et al., 2000). These estimates of residual uncertainty are relatively small, and are considerably less than the structural uncertainties associated with the satellite merging methodology described in the next section. Despite the global agree-ment for the diurnal adjustment for the RSS and UAH results, significant differences in the adjustments exist as a function of location (Mears and Wentz, 2005), which may explain some of the difference on smaller spatial scales between these two data sets that can be seen in Fig. 3.5 and Fig. 4.3.
3.2.2 saTelliTe merging meThodology It is very likely that the most important source of uncertainty in microwave sounding tempera-ture trends is due to inter-satellite calibration offsets, and calibration drifts that are correlated with the temperature of the calibration target (Christy et al., 2000; Mears et al., 2003). When results from supposedly identical co-orbiting satellites are compared, intersatellite offsets are immediately apparent. These offsets, typically a few tenths of a ºC, must be identified and removed or they will produce errors in long-term trends of several tenths of a ºC per decade. When constant offsets are used to remove the inter-satellite differences, the UAH group found that significant differences still remain that are strongly correlated with the temperature of the calibration target8 (Christy et al., 2000). This effect has since been confirmed by the RSS group (Mears et al., 2003). Both the UAH and RSS groups now remove the calibration target temperature effect using a model that includes a constant offset for each satellite, and an ad-ditional empirical “target factor” multiplied by the calibration target temperature. Despite the similarity in methods, the RSS and UAH groups obtain significantly different values for the global temperature trends (see Table 3.3). In particular, the difference between the trends for T2 has received considerable at-tention. A close examination of the procedures suggests that about 50% of the discrepancy in trends is accounted for by a difference be-
8 The calibration target can change temperature by tens of ºC over the course of the life of the satellite due to orbit- and season-dependent solar heating.
It is very likely that the most important source of uncertainty in microwave sounding temperature trends is due to inter-satellite calibration offsets and calibration drifts.

78 79
Temperature Trends in the Lower Atmosphere - Understanding and Reconciling Differences
78 79
tween the target factor for the NOAA-09 instrument de-duced by the two groups. This difference mainly arises from the subsets of data used by the two groups when determining the satellite merging param-eters (i.e., offsets and target factors). The UAH group em-phasizes pairs of satellites that have long periods of overlap, and thus uses data from six pairs of satellites, while RSS uses all available (12) overlap-ping pairs of satellites. Most of the remainder of the differ-ence is due to a smaller differ-ence in the calibration target temperature proportionality constant for NOAA-11, and to small differences in the diurnal correction. Both these differences primarily affect the measurements made by NOAA-11 and NOAA-14, due to their large drifts in local measurement time, which in addition to their direct effect on the diurnal correction, also lead to large changes in the temperature of the calibration target. In Fig. 4.1a, we plot the difference (T2-RSS - T2-
UAH) between the RSS and UAH time series. There is an obvious step that occurs in 1986, near the end of the NOAA-09 observation pe-riod, and a gradual slope that occurs during the observation periods of NOAA-11 and NOAA-14. Note that the trend difference between these two data sets is statistically significant at the 1% level, even though the error ranges quoted in Table 3.3 overlap, due to the presence of nearly identical short term fluctuations in the two data sets (see Appendix A for more details). The Maryland group data set (T2-UMd), in its most recent version (Grody et al., 2004; Vinnikov et al., 2006), implemented a more detailed, physically based error model to describe the errors that correlated with a non-linear combination of the observed brightness temperature measurements and the warm target
temperature used for calibration9. They use a substantially different merging procedure to deduce values of the parameters that describe the intersatellite differences. First, they use
9 The Maryland group accounted for uncertainties in the radiometers non-linearity parameter as well as errors in the warm target radiation temperature (due to uncertainties in its emissivity and physical temperature) and errors in the cold space radiation temperature (due to uncertain antenna side lobe con-tributions for example). However, while all of these error sources are accounted for, they are assumed to be constant during the lifetime of a given instrument and thus do not take into account the possibility of contributions to the side lobe response from the Earth or warm parts of the satellites whose temperature var-ies with time. These error sources lead, when globally averaged and linearized, to an expression where the target temperature is the most important factor. Thus while the exact physical cause of the observed effect is not known precisely, it is possible to accurately model and remove it on a global scale from the data using either method
Figure �.1 (a) Time series of the difference between global averages of satellite-derived T2 datasets. Both the RSS and UMd datasets show a step-like feature relative to the UAH dataset during the lifetime of NOAA-09. The difference between the RSS and the UAH datasets shows a slow drift during the NOAA-11 and NOAA-14 lifetimes. Both these satellites drifted more than 4 hours in observations time. (b) Time series difference between global averages of satellite derived T2LT datasets. A slow drift is apparent during the lifetime of NOAA-11, but the analysis during the NOAA-14 lifetime is complicated because the T2LT-RSS dataset does not include data from the AMSU instruments on NOAA-15 and NOAA-16, while the T2LT-UAH dataset does. All time series have been smoothed using a Gaussian filter with width = 7 months.
The U.S. Climate Change Science Program Chapter 4
80 8180 81
measurements only from the nadir view, in contrast to the central 5 views used by the other groups. Second, as noted above, only the first harmonic diurnal component is accounted for during the satellite merging, possibly causing errors in the retrieved parameters. Third, they only use the spatial variation seen by the differ-
ent MSU instruments to derive the calibration adjustments and perform long-time-scale tem-poral averaging of the measured temperatures to reduce the noise in the overlapping satellite measurements. This averaging procedure may attenuate the time dependent signal that the UAH empirical error model was introduced to explain. The large step in the T2-UMd - T2-
UAH difference time series that occurs in 1986 (see Fig. 4.1a) suggests that uncertainty in the parameters for the NOAA-09 satellite are also important for this data set10. The cause of the large fluctuations in the difference during the 2000-2004 time period is not known, but may be related to the absence of Advanced MSU (AMSU) data in the T2-UMd data set. Due to its relatively recent appearance, considerably less is known about the reasons for the differences between the Maryland data set and the RSS and UAH data sets, thus the comments about these differences should be viewed as more specula-tive than the statements about the RSS-UAH differences. These differences are an excellent example of structural uncertainty, where identical input data and three seemingly reasonable method-ologies lead to trends that differ significantly more than the amount expected given their reported internal uncertainties. Since method-ological differences yield data products show-ing differences in trends in T2 of about 0.1ºC per decade, it is clear that the most important source of uncertainty for satellite data are structural uncertainties and that these need to be included in any overall assessment of uncertainties in the estimates of tropospheric temperature trends and lapse rates.
3.2.3 differences in spaTial paTTern
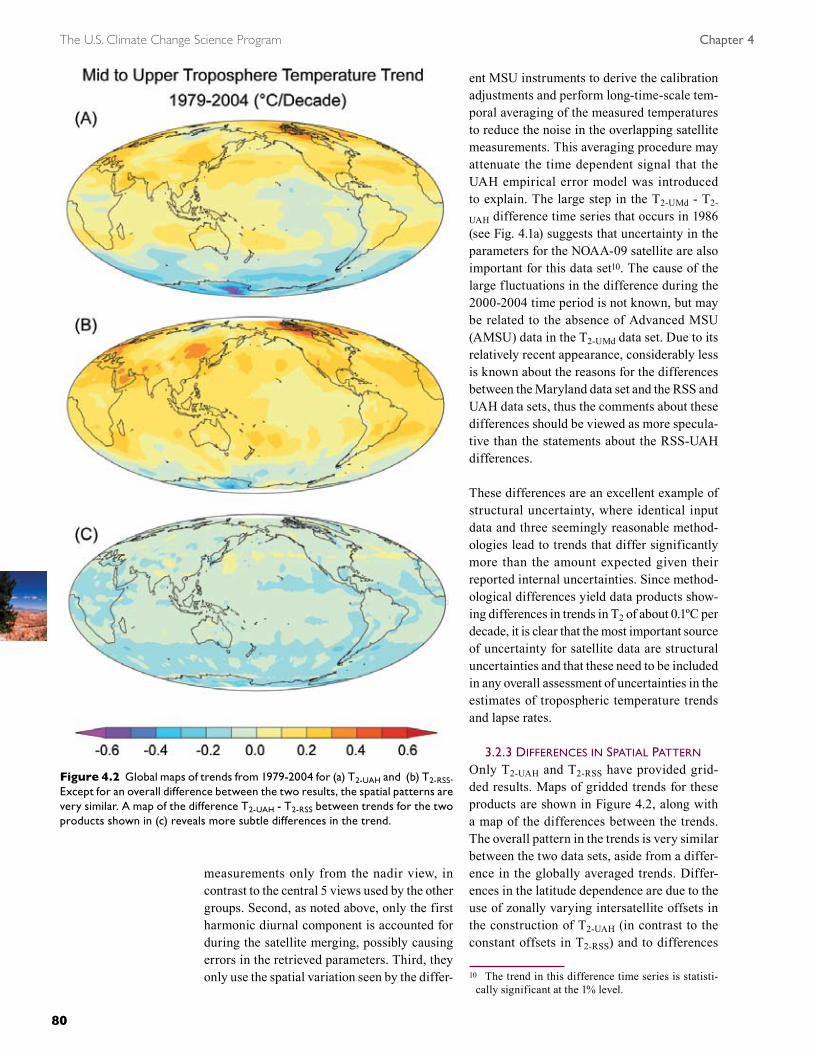
Only T2-UAH and T2-RSS have provided grid-ded results. Maps of gridded trends for these products are shown in Figure 4.2, along with a map of the differences between the trends. The overall pattern in the trends is very similar between the two data sets, aside from a differ-ence in the globally averaged trends. Differ-ences in the latitude dependence are due to the use of zonally varying intersatellite offsets in the construction of T2-UAH (in contrast to the constant offsets in T2-RSS) and to differences
10 The trend in this difference time series is statisti-cally significant at the 1% level.
Figure �.2 Global maps of trends from 1979-2004 for (a) T2-UAH and (b) T2-RSS. Except for an overall difference between the two results, the spatial patterns are very similar. A map of the difference T2-UAH - T2-RSS between trends for the two products shown in (c) reveals more subtle differences in the trend.

80 81
Temperature Trends in the Lower Atmosphere - Understanding and Reconciling Differences
80 81
in the applied diurnal adjustment as a function of latitude. Other differences may be caused by the spatial smoothing applied to the T2-UAH
during the construction of the data set, and to differences in spatial averaging performed on the diurnal adjustment before it was applied. This last difference will be discussed in more detail in section 4.2 below because the effects are more obvious for the T2LT layer.
�. UnCERTA�nTy �n LoWER TRoPoSPHER�C TREndS
�.1 Radiosonde Uncertainty in the Lower Troposphere Uncertainties in lower tropospheric trends measured by radiosondes are very similar to those discussed above for the middle-upper troposphere. The most important difference is that when comparing to the T2LT satellite product, the contribution of the stratospheric radiosonde trends, which is suspected to be erroneous to some extent, is substantially less than for the T2 data records. This decreases the likelihood that T2LT data products constructed from radiosonde data are biased toward excess cooling. However, it is possible that undetected negative trend bias remains in all tropospheric levels (see Section 3.1 above for more details), so radiosonde trends may still be contaminated by spurious cooling.
�.2 Satellite Uncertainty in the Lower Troposphere Currently, there are two lower tropospheric satellite data records, T2LT-UAH and T2LT-RSS. As mentioned in the Preface, both data sets are relatively recent, thus little is known about the specific reasons for their differences. Because of the noise amplification effects of the dif-ferencing procedure11 used to construct the data record (Spencer and Christy, 1992), the merging parameters tend to be more sensitive
11 The T2LT data sets are constructed by subtracting 3 times the average temperature measured by the out-ermost 4 (near-limb) views from 4 times the average temperature measured by the 4 adjacent views, which are closer to nadir. This has the effect of removing most of the stratospheric signal, and moving the ef-fective weighting function lower in the troposphere (Spencer and Christy, 1992). Assuming that the errors is each measurement are uncorrelated, this have the effect of amplifying these errors by a factor of about 5 relative to T2 (Mears and Wentz, 2005). Even if some of the error is correlated between views, this argument still applies to the uncorrelated portion of the error.
to the methods used to deduce them. A num-ber of different methods were explored in the creation of T2LT-RSS, leading to an estimate of the structural uncertainty of 0.08ºC/decade for global trends. When combined with internal uncertainty, the estimated total global trend uncertainty for this data set is 0.09ºC/decade (Mears and Wentz, 2005). Note that the dif-ference between the global trends for T2LT-RSS (0.19ºC/decade) and T2LT-UAH (0.12ºC/decade) shown in Table 3.3 is less than this estimated uncertainty. The estimated global trends in the radiosonde data sets are also within the T2LT-
RSS error range. In Figure 4.1b we plot the dif-ference (T2LT-RSS - T2LT-UAH) between the RSS and UAH time series. This time series shows more variability than the corresponding T2 dif-ference time series, making it more difficult to speculate about the underlying causes of the differences between them. The step-like feature during the 1985-1987 period is less obvious, and while there appears to be a slow drift during the NOAA-11 lifetime, a corresponding drift during the NOAA-14 lifetime is less obvious, perhaps because the RSS data do not yet include data from the more recent AMSU satellites. We speculate that the drift during NOAA-11 is in part due to differences in the diurnal cor-rection applied. The UAH diurnal correction is based on a parameterization of the diurnal cycle that is constrained by measurements made during a time period with 3 co-orbiting satellites (Spencer et al., 2006), while RSS uses a model-based diurnal correction analogous to that used for T2. In Figure 4.3, we show global maps of the gridded trends for T2LT-UAH and T2LT-RSS, along with a map of the trend differences. The spatial variability in the trend differences between the two data sets is much larger than the variability for T2, though both data sets show similar pat-terns in general, with the greatest temperature increase occurring in the Northern Hemisphere, particularly over Eastern Asia, Europe, and Northern Canada. The two data sets are in relatively good agreement north of 45°N lati-tude. In the tropics and subtropics, the largest differences occur over land, particularly over arid regions. We speculate that this may be in part due to differences in how the diurnal adjustment is
The two satellite data sets are in relatively good
agreement north of 45°N latitude.
In the tropics and subtropics, the
largest differences occur over land, particularly over
arid regions.

The U.S. Climate Change Science Program Chapter 4
82 8382 83
done by the two groups. The UAH group applies an averaged diurnal adjustment for each zonal band, based on different adjustments used for land and ocean. The RSS group uses a grid-point resolution diurnal correction. The UAH method may lead to errors for latitudes where
the diurnal cycle varies strongly with longitude. More arid regions (e.g., subtropical Africa), which typically have much larger surface diur-nal cycles, may be under-adjusted when the zon-ally averaged correction is applied, leading to long-term trends that are too low. Problems over Africa in the UAH data set were first identified by (Hurrell and Trenberth, 1998). Correspond-ingly, more humid regions and oceans may be over-adjusted, in some cases making up for the overall difference between the two data sets, perhaps accounting for the good agreement in regions such as Southeast Asia, Southern India, and Northern South America. Further analysis is required using a range of alternative diurnal correction estimation techniques for definitive conclusions to be reached. Other differences, such the north-south streaking seen in the RSS data, may be caused by differences in spatial smoothing, and by the inclusion of AMSU data in T2LT-UAH, but not in T2LT-RSS.
The decay of orbital height over each satellite’s lifetime can cause substantial errors in satellite-derived T2LT because changes in height lead to changes in the Earth incidence angles for the near-limb observations used to construct the data record Wentz and Schabel (1998)12. Both the RSS and UAH groups now correct for this error by calculating the expected change in observed temperature as a function of incidence angle, and then using this estimate to remove the effect of orbital decay13. The straight-for-ward method used to make these corrections, combined with its insensitivity to assumptions about the vertical structure of the atmosphere, leads to the conclusion that errors due to orbital decay have been accurately removed from both data sets and are not an important cause of any differences between them.
�.3 Comparison Between Satellite and Well-characterized Radiosonde Stations
Point-by-point comparisons between radio-sonde and satellite data eliminate many sources
12 Note that the adjustment for orbital decay is only important for the T2LT data sets. The T2 data sets only use nadir and near-nadir observations. Since changes in orbital height only lead to small changes in incidence angle for these views, the T2 data sets are insensitive to the effects of orbital decay.
13 The UAH group began to use this adjustment in ver-sion D of their product, which is described in Christy et al., (2000).
Figure �.3 Global maps of trends from 1979-2004 for (a) T2LT-UAH and (b) T2LT-
RSS. Except for an overall difference between the two results, the spatial patterns are similar. A map of the difference T2LT-UAH - T2LT-RSS between trends for the two products shown in (c) shows that the largest differences are over tropical and subtropical land areas. Data from land areas with elevation higher than 2000 meters are excluded from the T2LT-RSS dataset and shown in white.

82 83
Temperature Trends in the Lower Atmosphere - Understanding and Reconciling Differences
82 83
of sampling error normally present in radio-sonde data. Also, since uniform global cover-age is less important when using radiosondes to validate satellite data locally, stations can be chosen to minimize the contribution due to undocumented changes in radiosonde instru-mentation or observing practice. For instance, if one restricts comparisons of the satellite and radiosonde data to 29 Northern Hemisphere radiosonde stations that have consistently used a single type of instrumentation (the Viz sonde) since 1979, the average difference between these radiosonde trends and T2LT-UAH trends since 1979-2004 is only 0.03ºC/decade (Christy et al., 2003). Similarly, when this set of radio-sondes is extended to include a set of Southern Hemisphere stations where instrument changes were well documented, agreement between T2LT-UAH and radiosonde trends is almost as good (Christy and Norris, 2004). This suggests that, for the T2LT layer, where the stratospheric problems with radiosonde data are minimized, some level of corroboration can be attained from these two diverse measurement systems.
5. MULT�-CHAnnEL RETR�EV-ALS oF TRoPoSPHER�C TEMPERATURE
As mentioned above, the single channel satellite measurements commonly identified as tropo-spheric temperature (T2) are impossible to in-terpret as solely tropospheric temperatures be-cause 10% to 15% (seasonally and latitudinally varying) of the signal measured by MSU chan-nel 2 arises from the stratosphere. In principle, it is possible to reduce the stratospheric contri-bution to Channel 2 by subtracting out a portion of the stratospheric Channel 4 (Fu et al., 2004), though the exact values of the weights used in this procedure are controversial (see Chapter 2 for more details). Despite this controversy, there is little doubt that the resulting trends are more representative of the troposphere than the T2 data sets. The reduction in stratospheric signal also reduces the difference between trends in the satellite data and the radiosonde data (see Table 3.3), because the error-prone stratospheric levels in the stratosphere have reduced (but still non-zero) weight.
The existence of a stratosphere-corrected tro-pospheric retrieval allows tests for consistency of temperature trends among the different data sets constructed by a research group for differ-ent atmospheric layers. One test, when applied to an earlier version (v5.1) of the UAH global average trends, did not prove inconsistency on the global scale, because the difference between the T2LT-UAH trend and the retrieval-calculated T2LT trend was well within the published mar-gin of error. However, a clearer inconsistency was found for the tropics (Fu and Johanson, 2005). In this case, the difference between the retrieval-calculated trend and T2LT-UAH trend was larger than its estimated error range, an indication of uncharacterized error in at least one of the UAH products, or more generally that T2LT-UAH, T2-UAH and T4-UAH were not strictly self-consistent as a set. This inconsistency no longer exists (within error estimates) after the introduction of version 5.2 of the T2LT-UAH data set in mid 2005. The RSS versions of the T2 ,T4 and T* data sets were found to be consistent for both global and tropical averages (Fu and Johanson, 2005). The trends in the RSS ver-sion of the T2LT data set (produced after Fu and Johanson was submitted) is also consistent with the other RSS based data sets.
6. UnCERTA�nTy �n SURFACE TREndS
6.1 Sea Surface Temperature Uncertainty Temperature analyses over the ocean are pro-duced from sea surface temperatures (SST) instead of marine air temperatures. This is because marine air temperatures are biased from daytime ship deck heating (Folland and Parker, 1995; Rayner et al., 2003) and because satellite observations are available for SST beginning in November 1981 to augment in situ data (Reynolds and Smith, 1994). Spatially complete analyses of SSTs can be produced by combining satellite and in situ data (from ships and buoys) (Reynolds et al., 2002; Rayner et al., 2003), from in situ data alone (Smith and Reynolds, 2004), or from satellite data alone (Kilpatrick et al., 2001).
6.1.1 saTelliTe ssT uncerTainTies
Climate comparison analyses based on infrared satellite data alone are not useful because of
An inconsistency was found for the tropics in one of
the satellite-derived tropospheric
data sets.

The U.S. Climate Change Science Program Chapter 4
8� 858� 85
possible large time-dependent biases. These biases have typically occurred near the end of a satellite’s life time when the instrument no longer works properly, or during periods when assumptions made about the atmospheric profile in the satellite algorithm are no longer valid, e.g., during periods immediately follow-ing volcanic eruptions, when a large amount of dust from the eruption is present in the strato-sphere (Reynolds, 1993; Reynolds et al., 2004). These problems may be partially mitigated in the future by use of the microwave SST sensors that became available starting with the launch of the Tropical Rainfall Measuring Mission (TRMM) in 1987 (Wentz et al., 2000), but these microwave SST data have not been available long enough to derive meaningful trends, and are difficult to calibrate absolutely due to vari-ous instrument related problems (Wentz et al., 2001; Gentemann et al., 2004). Thus, analyses now use multiple satellite instruments blended with or anchored to in situ data that reduce the overall analysis errors (e.g., Reynolds et al., 2002, Rayner et al., 2003).
6.1.2 In SItu ssT uncerTainTies As discussed in Chapter 2, the primary sources of uncertainty in in situ SST measurements are non-climatic signals caused by changes in the mix of instrumentation over time and sampling errors. Over time the measurements have typically evolved from insulated bucket measurements to engine intake, through hull, and buoy mounted sensors - these changes are not necessarily accurately recorded in the metadata. Both non-climatic signals and sam-pling errors are thought to be largest in sparsely sampled regions, such as the southern oceans, where a single erroneous or unrepresentative measurement could bias the average for an entire measurement cell for the month in ques-tion. Both types of errors have been calculated for the Extended Reconstruction SST (ERSST) data set and included in the quoted error range (see figure 4.4). 6.2 Land Surface Air Temperature UncertaintyThe three surface temperature analyses exhibit similar warming rates since 1958. As the sur-face data sets have many stations in common, they are not totally independent. However, the MSU series take identical input, and radiosonde
data sets have common data also, so this issue is not unique to the surface records. The fact that the range in trends is much smaller for the surface data sets than for these other data sets implies that the structural uncertainty arising from data set construction choices is much smaller at the surface, in agreement with the arguments made in Thorne et al. (2005b). Also, a number of studies e.g., (Peterson et al., 1999; Vose et al., 2004) suggest that long-term, large-scale trends are not particularly sensitive to variations in choice of station networks. But because most land networks were not designed for climate monitoring, the data contain biases that data set creators address with different de-tailed methods of analysis. The primary sources of uncertainty from a land-surface perspective are (a) the construction methods used in the analyses and (b) local environmental changes around individual observing stations (e.g., ur-banization) that may not have been addressed by the homogeneity assessments. Because the stations are not fully representative of varying-within-area land surface, coastal, and topographical effects, global data sets are produced by analyzing deviations of tempera-ture from station averages (anomalies) as these deviations vary more slowly with a change in lo-cation than the temperatures themselves (Jones et al., 1997). Random errors in inhomogeneity detection and adjustments may result in biased trend analyses on a grid box level. However, on the relatively large space scales of greatest importance to this Report, such problems are unlikely to be significant in current data sets in the period since 1958 except where data gaps are still serious, e.g., in parts of central Africa, central South America, and over parts of Ant-arctica. Note that for the contiguous United States, the period 1958-2004 uses the greatest number of stations per grid box anywhere on the Earth’s land surface, generally upwards of 20 stations per grid box. For regions with either poor coverage or data gaps, trends in surface air temperature should be regarded with consider-able caution, but do not have serious effects on the largest of scales as most of the spatial variability is well sampled.
A variety of studies have documented that ur-banization has a warming effect on the local mi-croclimate; however, no study has demonstrated
For surface air temperature data sets, the structural uncertainty arising from data set construction choices is much smaller than for SST or upper air data sets.

8� 85
Temperature Trends in the Lower Atmosphere - Understanding and Reconciling Differences
8� 85
that urban warming imparts a significant bias to multi-decadal trends over large areas. In fact, the effect appears at most to be roughly an order of magnitude smaller than long-term trends (e.g., Jones et al., 1990). Several recent global (e.g., Easterling et al., 1997; Peterson et al., 1999) and national analyses (e.g., Li et al., 2004; Peterson et al., 2003) also indicate that ur-ban and rural station networks had comparable trends since roughly the mid-20th century. In addition, minimum temperature trends since 1950 were similar on both windy and calm nights, the latter being more susceptible to urban warming (Parker, 2004). To insure that potential urbanization effects do not impact analyses, the NASA group adjusts the data from all urban stations so that their long-term trends are consistent with those from neighbouring ru-ral stations (Hansen et al., 2001). It is generally accepted that local biases in trends mostly can-cel through the use of many stations or ocean observations. Because such a cancellation has not been rigorously proved, partly due to the lack of adequate metadata, it is conceivable that systematic changes in many station exposures of a similar kind may exist over the land during the last few decades. If such changes exist, they may lead to small amounts of spurious cooling or warming, even when the data are averaged over large land regions.
6.3 Combined Land-ocean Analyses UncertaintyGlobal combined surface temperature products are computed by combining ocean and land gridded data sets. The latest version of the UK surface data set, HadCRUT2v, (Jones and Moberg, 2003) has been optimally averaged with uncertainties for the globe and hemi-spheres. The NOAA surface temperature data set produced by Smith and Reynolds (2005), uses Global Historical Climatology Network (GHCN), merged with the in situ ERSST analy-sis of Smith and Reynolds (2004). The analyses are done separately over the ocean and the land following the ERSST methods. Error estimates include the bias, random and sampling errors. As an example of uncertainties in a combined land-ocean analysis, near-global time series (60ºS to 60ºN) are shown in Figure 4.4 for SST, land-surface air temperature, and the combined SST and land-surface air temperature (Smith and Reynolds, 2005). (The combined product is the GHCN-ERSST product used in Chapter
3). The SST has the tightest (95%) uncertainty limits (upper panel). The land-surface air temperature (middle panel) has a larger trend over the period since 1958, but its uncertainty limits are also larger than for SST. Land surface air temperature uncertainty is larger than the uncertainty for SST because of higher vari-ability of surface air temperature over land (see Chapter 1), persistently un-sampled regions, including central Africa and interior South America, and because the calculations include an increasing urbanization bias-error estimate. Merged temperature anomalies and their uncer-
Figure �.�. SST, Land Surface Air Temperature, and the Combined Temperature Data Record anomaly averaged annually and between 60ºS and 60ºN (purple), with its estimated 95% confidence intervals (dashed). Data are from the TS-NOAA dataset (Smith and Reynolds, 2005). Anomalies are relative to the 1982-2001 period for SST, and 1982-1991 for land.

The U.S. Climate Change Science Program Chapter 4
86 8786 87
tainty (lower panel) closely resemble the SST result, since oceans cover most of the surface area. Similar uncertainty was found by (Folland et al., 2001) using different methods.
7. �nTERLAyER CoMPAR�SonS
7.1 Troposphere/StratosphereAll data sources agree that on a global scale, the stratosphere has cooled substantially while the troposphere has warmed over both the 1958-2004 and the 1979-2004 time periods (note that this is not true for all 25-year time periods within the longer 1958-2004 time period). We suspect that the stratospheric cooling trends estimated from radiosondes are larger in mag-nitude than the actual trend. Despite the uncer-tainty in the exact magnitude of stratospheric cooling, we have very high confidence that the lower stratosphere has cooled by several tenths of a ºC per decade over the past five decades.
7.2 Lower Troposphere/Mid-Upper Troposphere The difference in trend between the lower troposphere and mid-upper troposphere is not well characterized by the existing data. On a global scale, all data sets suggest that T2LT is warming relative to T2, but it is important to note that the T2 data records have significant stratospheric contributions that reduce their warming trends. Radiosonde measurements suggest that the T(850-300) layer (which does not include the stratosphere) is warming at about the same rate as T2LT, while satellite data sug-gest that T*G is warming more rapidly than T2LT. The magnitude of these inter-data set dif-ferences are typically less than their individual estimates of uncertainty, substantially reducing confidence in our ability to deduce the sign of the lower troposphere-mid-upper troposphere trend difference.
7.3 Surface/Lower TroposphereOn a global scale, one satellite data set (T2LT-
RSS) suggests that the troposphere has warmed more than the surface, while both radiosonde data sets and one of the satellite data sets (T2LT-
UAH) indicate the opposite. The magnitude of these differences is less than the uncertainty estimates for any one data record, thus no dis-crepancy is indicated. The situation is similar in the tropics. Both global and tropical averages of
the radiosonde data contain many stations with less reliable data and metadata, which may be part of the cause for the surface-tropospheric differences. In contrast, in North America and Europe the warming in the surface and lower troposphere appears to be very similar in all data sets. This may be due to a combination of the presence of more reliable radiosonde sta-tions in these areas and the stronger correlation between the surface and the lower troposphere over land. It is also illuminating to investigate the spatial patterns in the difference in trends between these data sets. In Figure 5.5, panels E and F (in Chapter 5), we plot maps of the trend differences between the TS-NOAA data set and the two satellite derived T2LT data sets. This figure shows that the trends differences are much larger over arid tropical and subtropical land regions for the T2LT-UAH data set than for the T2LT-RSS data set. As discussed in more de-tail in Section 4.2, this is likely to be due to the method the UAH team uses to adjust for diurnal drifts, which is likely to under correct regions with large diurnal variability.
7.� Surface/Mid TroposphereIt is also interesting to consider the trend differ-ences between the surface and mid troposphere since more satellite data sets are available for T2 than for T2LT. Here, mostly due to the large structural uncertainty in the trends in T2, the various data sets are unable to agree on the sign of the trend difference over the 1979-2004 period. On a global scale, the two radiosonde data sets and two of the satellite data sets (RSS and UAH) suggest that T2 has warmed less than the surface, but the other satellite data set (UMd) suggests that the opposite is true. Simi-lar results are found for tropical averages. It is important to remember that T2 is contaminated by stratospheric cooling. T*G, which is adjusted to remove these effects, shows smaller differ-ences between the surface and tropospheric trends, with two satellite data sets (RSS and UMd) indicating more warming than at the surface.
8. RESoLUT�on oF UnCERTA�nTy
In almost all of the tropospheric and strato-spheric data records considered, our uncer-tainty is dominated by structural uncertainty
All data sources agree that on a global scale, the stratosphere has cooled substantially while the troposphere has warmed over both the 1958-2004 and the 1979-2004 time periods.

86 87
Temperature Trends in the Lower Atmosphere - Understanding and Reconciling Differences
86 87
arising through data set construction choices (Thorne et al., 2005b). Differences arising as a result of different, seemingly plausible cor-rection models applied by different groups to create a climate-quality data record are signifi-cantly larger than the uncertainties internal to each method, in the raw data measurements, or in the sampling uncertainties. These struc-tural uncertainties are difficult to assess in an absolute sense. The best estimates we can cur-rently make come from examining the spread of results obtained by different groups analyz-ing the same type of data. This “all data sets are equal” approach has been employed in our present analysis. As outlined in Chapter 2, this estimate of uncertainty can either be too small or too large, depending on the situation. Given this caveat, it is always better to have multiple (preferably at least three) data records that purport to measure the same aspects of climate with the same data, so we can get some idea of the structural uncertainty.
In reality, all data sets are not equally plausible realizations of the true climate system evolu-tion. The climate system has evolved in a single way, and some data sets will be closer to this truth than others. Given that the importance of structural uncertainty, particularly for trends aloft, has only recently been recognized, it is perhaps not surprising that we are unable to quantify this at present. We could make value-based judgments to imply increased confidence in certain data sets, but these would not be un-ambiguous, may eventually be proven wrong, and are not a tenable approach in the longer term from a scientific perspective. Therefore tools need to be developed to objectively dis-criminate between data sets. These may include (1) measures of the internal consistency of the construction methods, (2) assessment of the physical plausibility of the merged products, including consistency of vertically resolved trends, and (3) comparisons with vicarious data – for example, changes in temperature need to be compared with changes in water vapor, winds, clouds, and various measures of ra-diation to assess consistency with the expected physical relationships between these variables. Taken together such a suite of indicators can be used to provide an objectively based way of highlighting residual problems in the data sets and gaining a closer estimate of the truth. Such
an audit of current data sets should be seen as very high priority and preferably undertaken independently of the data set builders in a similar manner to the model intercomparisons performed at Lawrence Livermore National Laboratory. In addition to an agreed set of objective analysis tools, such an effort requires full and open access to all of the data sets in-cluding a full audit trail. Some specific suggestions for resolving some of the issues brought forward in this chapter are mentioned here, but these are not exhaustive and further investigation is required.
8.1 Radiosondes A significant contribution to the long-term in-homogeneity of the radiosonde record appears to be related to changes in radiative heating of the temperature sensor for various radiosonde models, and changes in the adjustments made to attempt to correct for these changes. Recent work suggests that such problems may account for much of the apparent tropical cooling shown in unadjusted data. Other recent work suggests that step-like changes in bias may still remain, even in adjusted data sets. Suitable tests on ra-diosonde products may therefore include: stabil-ity of day-night differences, spatial consistency, internal consistency (perhaps including wind data that to date have not been incorporated), and consistency with MSU-derived and other independent estimates.
8.2 SatellitesThe most important contributions to satellite uncertainty are merging methodology and the diurnal adjustment. The satellite data are simple enough that considerable understanding can result from examination of intermediate results in the merging process, including intersatel-lite differences that remain after the merging adjustments are complete. Consistent reporting of such results can help differentiate between methods. It appears that the differences in merg-ing methodology often result in sharp step-like features in difference time series between data sets. Other data sets, such as spatially averaged adjusted radiosonde data, might be expected to show more slowly changing errors, since their errors are due to the overlap of many different, potentially step-like errors that occur at dif-ferent times. So comparisons of satellite data
We could make value-based
judgments to imply increased confidence
in certain data sets, but these would not be unambiguous, and
are not a tenable approach in the
longer term from a scientific perspective.

The U.S. Climate Change Science Program Chapter 4
88 PB
with radiosonde data over short time periods may help differentiate between satellite data sets. The diurnal adjustment can be improved by a more rigorous validation of model-derived diurnal cycles, or by further characterization of the diurnal cycle using the TRMM satellite or concerted radiosonde observing programs designed to characterize the diurnal cycle at a number of representative locations.
8.3 SurfaceThe uncertainty in the historical near-surface temperature data is dominated by sampling uncertainty, systematic changes in the local en-vironment of surface observing stations, and by difficult-to-characterize biases due to changes in SST measurement methods. The relative maturity of the surface data sets suggests that to a large degree, these problems have been ad-dressed to the extent possible for the historical data, due to the absence of the required meta-data (for the bias-induced uncertainties) or the existence of any observations at all. However, it is likely that much of the relatively recent SST data can be adjusted for measurement type as some of the needed metadata is available or can be estimated.
The best estimates we can currently make come from examining the spread of results obtained by different groups analyzing the same type of data.