CHAPTER IV RESULT AND DISCUSSION 4.11. · CHAPTER IV RESULT AND DISCUSSION 4.11. ... at different...
48
30 CHAPTER IV RESULT AND DISCUSSION 4.11. Introduction The aim of this study is to find out the way to achieve the viability of using crumb rubber as the additive material in the hot asphalt concrete modified with a certain comparison is expected to improve the quality of the asphalt and to know the properties of asphalt added with crumb rubber. In the comparison between the two types (without and with crumb rubber) of properties of the hot mix split mastic asphalt toward the Marshall properties (stability, flow, MQ, VITM, VFWA, and air void to get maximum asphalt contact, ISTM, and UCS at different test temperature 30 ITS at different test temperature of 30˚C, 40˚C,and 60 and permeability test. The methodology used for this study has been discussed in chapter 3. The results of each procedure in determining the properties are presented in this chapter and will be further analyzed and discussed in depth. 4.12. Materials and Properties The main materials used for this study were: asphalt AC 60/70 coarse aggregate (crushed stones), fine aggregate, and CR. All main properties of the materials used were measured for further analysis consideration. Several tests were conducted in order to measure their properties according to the specifications referred. The reference used are AASHTO and Bina Marga standard. 4.12.1. Asphalt The properties test of asphalt AC 60/70 produced by PT. PERTAMINA was used. Table presents the results of properties test asphalt AC 60/70, Table 4.1 shows some properties of the bitumen 60/70. This test was conducted according to (Bina Marga, 2010) presents the results of properties test for each type of asphalt 60/70.
Transcript of CHAPTER IV RESULT AND DISCUSSION 4.11. · CHAPTER IV RESULT AND DISCUSSION 4.11. ... at different...

30
CHAPTER IV
RESULT AND DISCUSSION
4.11. Introduction
The aim of this study is to find out the way to achieve the viability of using crumb
rubber as the additive material in the hot asphalt concrete modified with a certain
comparison is expected to improve the quality of the asphalt and to know the properties
of asphalt added with crumb rubber.
In the comparison between the two types (without and with crumb rubber) of
properties of the hot mix split mastic asphalt toward the Marshall properties (stability,
flow, MQ, VITM, VFWA, and air void to get maximum asphalt contact, ISTM, and UCS
at different test temperature 30 ITS at different test temperature of 30˚C, 40˚C,and 60
and permeability test.
The methodology used for this study has been discussed in chapter 3. The results
of each procedure in determining the properties are presented in this chapter and will be
further analyzed and discussed in depth.
4.12. Materials and Properties
The main materials used for this study were: asphalt AC 60/70 coarse aggregate
(crushed stones), fine aggregate, and CR.
All main properties of the materials used were measured for further analysis
consideration. Several tests were conducted in order to measure their properties according
to the specifications referred. The reference used are AASHTO and Bina Marga standard.
4.12.1. Asphalt
The properties test of asphalt AC 60/70 produced by PT. PERTAMINA was used.
Table presents the results of properties test asphalt AC 60/70, Table 4.1 shows some
properties of the bitumen 60/70. This test was conducted according to (Bina Marga,
2010) presents the results of properties test for each type of asphalt 60/70.

31
Table 4.1. Result of properties test of asphalt AC 60/70
No Characteristics Result Specification
(Bina Marga |)
1 Specific gravity of asphalt 1.045 Min .1
2 Penetration (mm) 63.5 60-79
3 Ductility (cm) 164 Min. 100
4 Flash point and fire point © 320 -326 Min. 200
5 Softening point ( c ) 48.35 48 - 58
6 Asphalt solubility in TCE (tri chlore
enthelyn )/CCL
99.59 MIN .99
4.12.2. Aggregate
The aggregate used as the materials for the split mastic asphalt mix. Based on the
properties test of coarse aggregate and fine aggregate result as table
A. Properties of Aggregates
At the preliminary stage, aggregate were sieved according to Indonesian standards
and separated according to the size of sieves on the selected aggregate gradation. The
total weight of aggregates needed was 1200 grams. The aggregate gradation specification
for AC and the selected gradation used in this study are shown in Table 2.2 and Figure
4.1
32
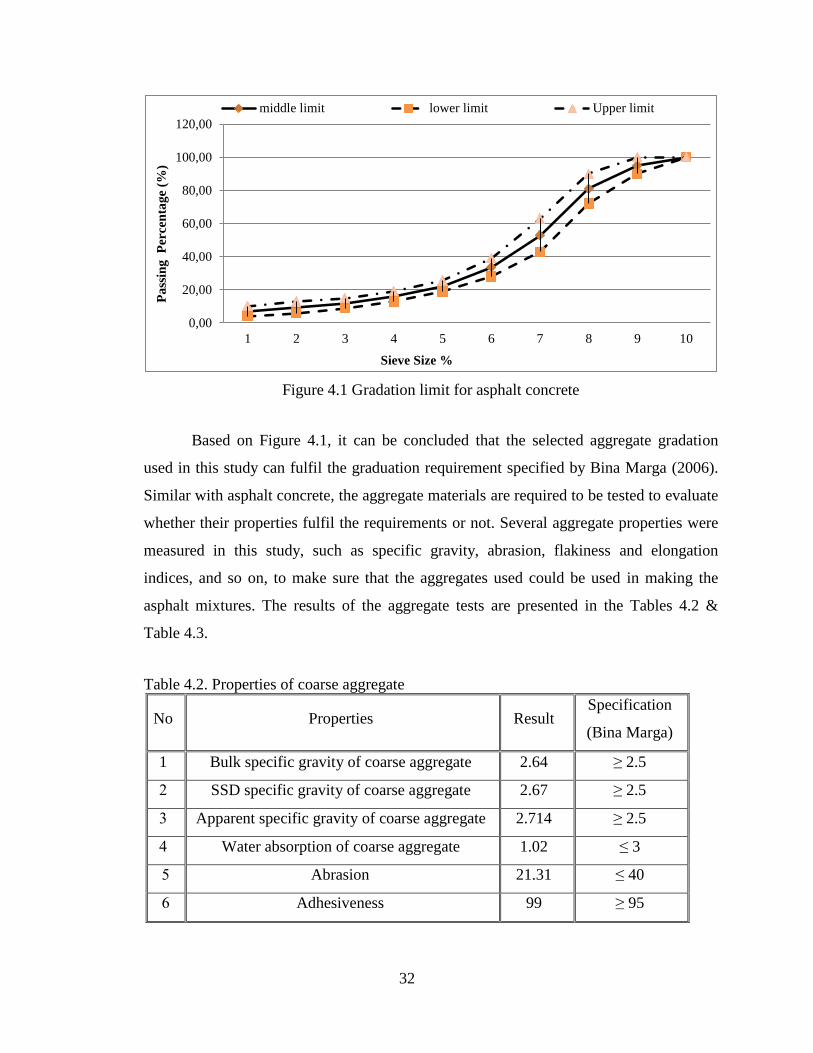
Figure 4.1 Gradation limit for asphalt concrete
Based on Figure 4.1, it can be concluded that the selected aggregate gradation
used in this study can fulfil the graduation requirement specified by Bina Marga (2006).
Similar with asphalt concrete, the aggregate materials are required to be tested to evaluate
whether their properties fulfil the requirements or not. Several aggregate properties were
measured in this study, such as specific gravity, abrasion, flakiness and elongation
indices, and so on, to make sure that the aggregates used could be used in making the
asphalt mixtures. The results of the aggregate tests are presented in the Tables 4.2 &
Table 4.3.
Table 4.2. Properties of coarse aggregate
No Properties Result Specification
(Bina Marga)
1 Bulk specific gravity of coarse aggregate 2.64 ≥ 2.5
2 SSD specific gravity of coarse aggregate 2.67 ≥ 2.5
3 Apparent specific gravity of coarse aggregate 2.714 ≥ 2.5
4 Water absorption of coarse aggregate 1.02 ≤ 3
5 Abrasion 21.31 ≤ 40
6 Adhesiveness 99 ≥ 95
0,00
20,00
40,00
60,00
80,00
100,00
120,00
1 2 3 4 5 6 7 8 9 10
Pa
ssin
g
Per
cen
tag
e (%
)
Sieve Size %
middle limit lower limit Upper limit

33
Table 4.3. Properties of fine aggregate
No Properties Result Fine
aggregate
Specification
(Bina Marga)
7 Bulk specific gravity of fine aggregate 2.52 ≥ 2.5
2 SSD specific gravity of fine aggregate 2.59 ≥ 2.5
3 Apparent specific gravity of fine
aggregate 2.723 ≥ 2.5
4 Water absorption of fine aggregate 2.94 ≤ 3
4.13. Marshall Test of 60/70 Bitumen Mixture
Two types of Marshall Test are the materials for the asphalt concrete without
crumb rubber, and asphalt concrete modified with crumb rubber. Marshall Test for the
60/70 (asphalt without crumb rubber) within the range 2.5%, 5.0%, 7.5% and 10% are
used. The OBC in asphalt concrete without CR has been determined in this study based
on the maximum stability according to the MS. Table 4.4 shows some properties of the
60/70 (asphalt without crumb rubber).
Table 4.4. Properties of asphalt concrete without crumb rubber (60/70)
No
Bitumen
Content
(%)
Stabilities
Kg
Flow
(mm) VFWA
Air
void MQ Density VMA
1 5.0 1035.33 2.80 61.44 6.91 369.85 2.29 17.92
2 5.5 1336.90 3.22 66.89 6.14 415.72 2.29 18.26
3 6.0 1412.80 3.40 70.31 5.59 415.02 2.29 18.79
4 6.5 1328.01 3.17 75.92 4.65 418.29 2.30 19.00
5 7.0 1166.02 2.67 80.60 3.73 441.71 2.30 19.22

34
This relationship between the stability and the asphalt content is shown in Figure 4.2
Figure 4.2. Correlation stability and AC without CR toward asphalt content
Through the review of the stability test results in Table 4.4 and Figure 4.2 the
following observations were obtained that the highest stability value of asphalt concrete
without crumb rubber is asphalt content 6.0% by 1412.80 kg and the smallest stability is
asphalt content 5.0% by 1035.33 and 7.0% by 1166.02 kg. Thus it can be concluded that
the higher percent and smaller percent of the asphalt content decreases stability. Thus
addition of asphalt content will give the higher penetration or softer. As a result, the
mixture becomes more flaccid so as to contribute to the decrease in the value of stability.
y = -310,8x2 + 3780,1x - 10081
R² = 0,9763
400
600
800
1000
1200
1400
1600
4,5 5,0 5,5 6,0 6,5 7,0 7,5 8,0
Sta
bil
ita
s (k
g)
Asphalt Content (%) SMA

35
This relationship between the flows and the asphalt content is shown in Figure 4.3
Figure 4.3. Correlation flows and AC without CR toward asphalt content
Through the review of the flow test results in Table 4.4 and Figure 4.3 the
following observations were obtained that flow value of asphalt concrete without crumb
rubber is 6% by 3.40 mm and smallest with asphalt content 5.0% by 2.8 mm, 5.5% by
3.22 mm, 6.5% by 3.17 mm, and 7% by 2.67 mm. Thus it can be concluded that the
higher the asphalt content the more the flow will be. With the addition of the asphalt
content will affect the mixes become more flexible and the resistance to deformation
decreases resulting in a high flow value. But this value is considered very low compared
to global standards as well as specifications Indonesian.
y = 0,0567x + 2,7567
R² = 0,0445
0,00
1,00
2,00
3,00
4,00
5,00
4,50 5,00 5,50 6,00 6,50 7,00 7,50 8,00
Flo
w (
mm
)
Asphalt Content % min 3
Series2

36
This relationship between the Marshall quotients and asphalt content is shown in Figure
4.4.
Figure 4.4. Correlation MQ and AC without CR toward asphalt content
Through the review of the marshal quotient test result in Table 4.4 and Figure 4.4
were obtained the following observations that the marshal quotient value of asphalt
concrete without crumb rubber is highest with asphalt content 6.0% by 423.06 kg/mm
and is smallest with asphalt content 5% by 369.85 kg/mm. Thus it can be concluded that
the higher the asphalt content decreases marshal quotient.
Marshall Quotient also known as rigidity ratio, which is the ratio of stability to
flow value of the mixture and the Marshall Quotient values of AC. So the increase in the
flow value will decrease the Marshall Quotient value.
y = 10,535x + 341,48
R² = 0,1331
150
200
250
300
350
400
450
500
550
600
4,5 5,0 5,5 6,0 6,5 7,0 7,5
Ma
rsh
all
Qu
oti
ent
(kg
/mm
)
Asphalt Content (%) MQ

37
This relationship between the air void and the asphalt content is shown in Figure 4.5
Figure 4.5. Correlation air void and AC without CR toward asphalt content
Through the review of the air void test results in Table 4.4 and Figure 4.5 the
following observations were obtained that the air void value of asphalt concrete without
crumb rubber is highest with asphalt content 5.0% by 6.91 and smallest with asphalt
content 7.0% by 3.73. Thus it can be concluded that the higher the asphalt content
decreases air void.
Excessive air voids in the mixture would result in cracking due to insufficient
bitumen binders to coat on the aggregates, while too low air void may induce more
plastic flow (rutting) and bitumen bleeding.
y = -1,5694x + 14,822
R² = 0,9915
0,00
1,00
2,00
3,00
4,00
5,00
6,00
7,00
8,00
4,5 5,0 5,5 6,0 6,5 7,0 7,5
air
vo
ld (
%)
Asphalt Content (%)
VMA

38
This relationship between the VFWA and the asphalt content is shown in Figure 4.6
Figure 4.6. Correlation VFWA and AC without CR toward asphalt content
Through the review of the VFWA test results in Table 4.4 and Figure 4.6 were
obtained the following observations that the VFWA value of asphalt concrete without
crumb rubber is highest with asphalt content 7.0% by 80.60% and is smaller with asphalt
content 5.0% by 61.44%. Thus it can be concluded that the higher the asphalt content
increases void filled with asphalt. This is due to the addition of asphalt content, and then
the value of void filled with asphalt increases.
y = 9,4683x + 14,22
R² = 0,9959
40,00
45,00
50,00
55,00
60,00
65,00
70,00
75,00
80,00
85,00
90,00
4,5 5,0 5,5 6,0 6,5 7,0 7,5
VF
WA
(%
)
Asphalt Content (%)
VFWA
Series5
Linear
(VFWA)

39
This relationship between the VMA and the asphalt content is shown in Figure 4.7
Figure 4.7. Correlation VMA and AC without CR toward asphalt content
Through the review of the VMA test results in Table 4.4. and Figure 4.7. the
following observations were obtained that the VMA value of asphalt concrete without
crumb rubber is highest with asphalt content 7.0% by 19.22% and is smaller with asphalt
content 5.0% by 17.92%. Thus it can be concluded that the higher the asphalt content
increases Void in total mix. With the addition of asphalt content will decrease the volume
of intergranular void space between the aggregate particles of a compacted paving
mixture. It included the air voids and the volume of bitumen not absorbed into the
aggregate.
Thus it concluded When VMA is too low, there is not enough room is the mixture
to add sufficient bitumen binder to coat adequately over the individual aggregate
particles. Also mixes with a low VMA are more sensitive to small changes in bitumen
binder content. Excessive VMA will cause unacceptably low mixture stability.
y = 0,6691x + 14,623
R² = 0,9678
12,00
14,00
16,00
18,00
20,00
22,00
24,00
4,5 5,0 5,5 6,0 6,5 7,0 7,5 8,0
VM
A (
%)
Asphalt Content (%)
VMA

40
Figure 4.8. Correlation Marshall Properties toward % bitumen
Through the review of the Marshall Properties test results in Table 4.4. the following
observations were obtained that the OBC in the asphalt concrete without crumb rubber is
6.4% bitumen, that is shows in figure 4.8
4.14. The Influence of CR Additive on The Properties of AC.
Marshall Test was done for the asphalt concrete with crumb rubber within the
range given 2.5%, 5.0%, 7.5%, and 10%. The OBC has been determined in the study
based on the maximum stability according to the MS.
0
10
20
30
40
50
60
70
4,5 5 5,5 6 6,5 7 7,5 8
Asphalt Content (%)
Stabilitas
Flow
M/Q
VMA
OBC =6.4%

41
4.14.1. Properties of Asphalt Concrete With 2.5% Crumb Rubber.
Table 4.5. shows some properties of asphalt concrete modified with crumb rubber 2.5%.
Table 4.5: Properties of asphalt concrete with 2.5% crumb rubber (60/70)
Asphalt
Content
(%)
Stabilities
Kg
Flow
mm
VFWA
Air
voids
MQ
Density VMA
5.0 896.78 3.00 59.96 7.37 299.28 2.28 18.33
5.5 1056.50 3.53 67.97 5.77 300.22 2.30 17.94
6.0 1181.26 3.80 71.41 5.32 311.34 2.30 18.57
6.5 1172.59 3.47 74.99 4.79 339.50 2.29 19.12
7.0 1029.50 2.80 82.82 3.23 367.41 2.31 18.81
This relationship between the stability and the asphalt content with CR 2.5% is shown in
Figure 4.9.
Figure 4.9. Correlation stability and AC with 2.5% CR toward asphalt content
Through the review of the stability test results in Table 4.5 and Figure 4.9 the
following observations were obtained that the stability value of asphalt concrete with
crumb rubber is highest with asphalt content 6.5% by 1181.26 kg and is smallest with
asphalt content 5.0% by 896.78 with add the 2.5% crumb rubber effect at the cohesion
and the bonding stability of modified bitumen decrease. So the stability value of asphalt
y = -211,16x2 + 2610,2x - 6886,6
R² = 0,9794
400
500
600
700
800
900
1000
1100
1200
1300
4,5 5,0 5,5 6,0 6,5 7,0 7,5
Sta
bil
ita
s (k
g)
Asphalt Content (%)
2.5% CRmin 800Series2
42
concrete modified without crumb rubber is higher than asphalt concert with crumb
rubber, but the stability increases along with the increase of CR content up to a certain
extent (optimum) and decreases after it passes the optimum limit. This happens because
the asphalt as the binding material between the aggregate can become a lubricant after the
optimum limit as the binding.
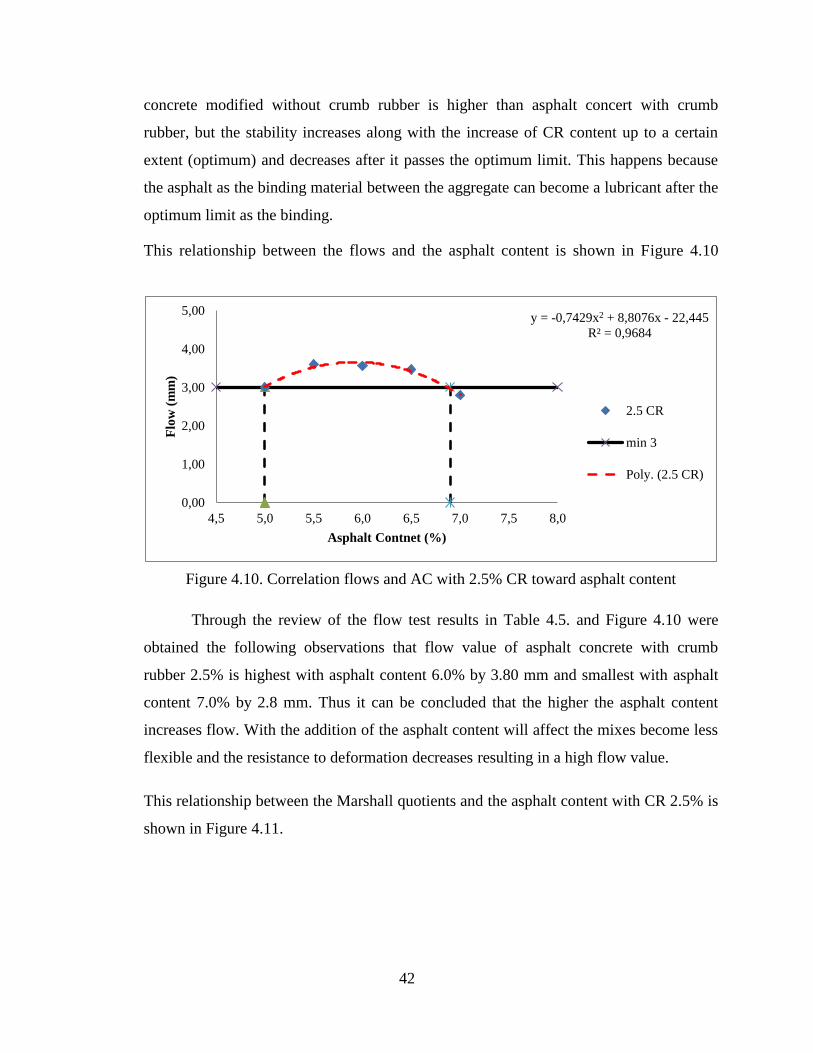
This relationship between the flows and the asphalt content is shown in Figure 4.10
Figure 4.10. Correlation flows and AC with 2.5% CR toward asphalt content
Through the review of the flow test results in Table 4.5. and Figure 4.10 were
obtained the following observations that flow value of asphalt concrete with crumb
rubber 2.5% is highest with asphalt content 6.0% by 3.80 mm and smallest with asphalt
content 7.0% by 2.8 mm. Thus it can be concluded that the higher the asphalt content
increases flow. With the addition of the asphalt content will affect the mixes become less
flexible and the resistance to deformation decreases resulting in a high flow value.
This relationship between the Marshall quotients and the asphalt content with CR 2.5% is
shown in Figure 4.11.
y = -0,7429x2 + 8,8076x - 22,445
R² = 0,9684
0,00
1,00
2,00
3,00
4,00
5,00
4,5 5,0 5,5 6,0 6,5 7,0 7,5 8,0
Flo
w (
mm
)
Asphalt Contnet (%)
2.5 CR
min 3
Poly. (2.5 CR)

43
Figure 4.11. Correlation MQ and AC with 2.5% CR toward asphalt content
Through the review of the Marshall quotient test results in Table 4.5. and Figure 4.11. the
following observations were obtained that Marshall quotient value of asphalt concrete
with crumb rubber 2.5% is highest with the 7.0% by 367.41 mm and smallest with
asphalt content 5.0% by 299.28 mm. Thus it can be concluded that the 2.5% CR with %
bitumen increases Marshall Quotient.
This Figure 4.12 relationship between the air void and the asphalt content with CR 2.5%
is shown in
Figure 4.12. Correlation air void and AC with 2.5% CR toward asphalt content
y = 9,3117x2 - 75,348x + 438,96
R² = 0,9142
100
150
200
250
300
350
400
4,5 5,0 5,5 6,0 6,5 7,0 7,5
MQ
(%
)
Asphalt Content (%)
2.5% CR
Series4
Poly. (2.5% CR)
y = -1,8494x + 16,392
R² = 0,9472
1,00
2,00
3,00
4,00
5,00
6,00
7,00
8,00
4,5 5,0 5,5 6,0 6,5 7,0 7,5 8,0
air
vo
id (
%)
Asphalt Content (%)
2.5% CR
Series2
Linear (2.5% CR)

44
Through the review of the air void test results in Table 4.5. and Figure 4.12. the
following observations were obtained that air void value of asphalt concrete with crumb
rubber 2.5% is highest with the 5.0% by 7.37% and smallest with asphalt content 7.0%
by 3.23%, 6.5% by 4.79%, 6.0% by 5.32%, and 5.5% by 5.77%. Thus it can be
concluded that the 2.5% CR with % bitumen decreases air void.
This relationship between the VMA and the asphalt content with CR 2.5% is shown in
Figure 4.13
Figure 4.13. Correlation VFWA and AC with 2.5% CR toward asphalt content
Through the review of the VITM test results in Table 4.4 and Figure 4.13 the
following observations were obtained that VITM value of asphalt concrete with crumb
rubber 2.5% CR is highest with the 7.0% by 82.82% and smallest with asphalt content
5.0% by 59.96 %, 5.5% by 67.97%, 6.0% by 71.41%, and 6.5% by 74.99%. Thus it can
be concluded that the 2.5% CR with % bitumen increases VITM.
y = 10,546x + 8,1535
R² = 0,9728
50,00
55,00
60,00
65,00
70,00
75,00
80,00
85,00
90,00
4,5 5,0 5,5 6,0 6,5 7,0 7,5 8,0
VF
WA
(%
)
Asphalt Content (%)
2.5% CR
min 65
Series3
Linear (2.5% CR)

45
This relationship between the VMA and the asphalt content is shown in Figure (4.14)
Figure 4.14. Correlation VMA and AC with 2.5% CR toward asphalt content
Through the review of the VMA results in Table 4.5 and Figure 4.14 the
following observations were obtained that VMA value of asphalt concrete with crumb
rubber 2.5% CR is highest with the 6.5% by 19.12% and smallest with asphalt content
5.5% by 17.94%, 6.5% by 4.79%, 6.0% by 5.32%, and 5.5% by 5.77%. Thus it can be
concluded that the 2.5% CR with % bitumen decreases air void.
Figure 4.15. Correlation Marshall Properties toward 2.5% CR
y = 0,43x + 15,973
R² = 0,5665
10,00
12,00
14,00
16,00
18,00
20,00
22,00
24,00
4,5 5,0 5,5 6,0 6,5 7,0 7,5
VM
A (
%)
Asphalt Content (%)
2.5% CR
Series4
Linear (2.5% CR)
0
10
20
30
40
50
60
70
5 5,5 6 6,5 7 7,5
Asphalt Concrete with CR 2.5%
Stabilita
s
Flow
M/Q
VMA
KAO =6.475%

46
Table 4.5 shows some properties of asphalt concrete modified with crumb rubber 2.5%.
Through the review of the Marshall Properties test results in Table 4.4 were
obtained the following observations that the OBC when added crumb rubber 2.5% is
6.475% bitumen, that is shown in Figure 4.15
4.14.2. Properties of Asphalt Concrete With 5.0% Crumb Rubber.
Table 4.6. Properties of asphalt concrete with 5.0% crumb rubber (60/70)
Asphalt
content
(%)
Stabilities
Kg
Flow
mm
VFWA
Air void
MQ
Density
VMA
5.0 784.31 4.00 54.60 8.96 195.81 2.24 19.72
5.5 883.42 4.13 59.63 8.04 214.10 2.24 19.91
6.0 962.00 3.97 65.84 6.82 242.08 2.26 19.85
6.5 921.08 3.60 70.68 5.98 256.75 2.26 20.13
7.0 846.48 2.80 73.37 5.53 304.59 2.26 20.73
This relationship between the stability and the asphalt content with CR 5.0% is shown in
Figure 4.16
Figure 4.16. Correlation stability and AC with 5.0% CR toward asphalt content
y = -218,51x2 + 2603,2x - 6777,3
R² = 0,9855
400
500
600
700
800
900
1000
1100
4,5 5,0 5,5 6,0 6,5 7,0 7,5
Sta
bil
ita
s (k
g)
Asphalt Content (%)
5.0 % CR
Series2
min 800
Series3
Poly. (5.0 % CR)

47
Through the review of the stability test results in Table 4.5 and Figure 4.16 were
obtained the following observations that the stability value of asphalt concrete with
crumb rubber 5.0% is highest with asphalt content 6.0% by 982.68 kg and is smallest
with asphalt content 7.0% by 732.02 with add the 2.5% crumb rubber effect at the
cohesion and the bonding stability of modified bitumen decrease. So the stability value of
asphalt concrete modified without crumb rubber is higher than asphalt concert with
crumb rubber, and the stability value of asphalt concrete modified with crumb rubber
2.5% is higher than asphalt concert with crumb rubber 5.0% but the stability increases
along with the decrease of CR content up to a certain extent (optimum) and decreases
after it passes the optimum limit. This happens because the asphalt as the binding
material between the aggregate can become a lubricant after the optimum limit as the
binding.
This relationship between the flows and the asphalt content is shown in Figure 4.17.
Figure 4.17. Correlation flows and AC with 5.0% CR toward asphalt content
Through the review of the flow test results in Table 4.6. and Figure 4.17. the
following observations were obtained that flow value of asphalt concrete with crumb
rubber 5.0% is highest with asphalt content 5.5% by 4.13 mm and smallest with asphalt
content 7.0% by 2.8 mm. Thus it can be concluded that the higher the asphalt content
y = -0,6571x2 + 7,3457x - 16,462
R² = 0,9855
0,00
1,00
2,00
3,00
4,00
5,00
6,00
4,5 5,0 5,5 6,0 6,5 7,0 7,5 8,0
Flo
w (
mm
)
Asphalt Content (%)
5.0% CR
Series2
min 3
Series3
Poly. (5.0% CR)

48
increases flow. With the addition of the asphalt content will affect the mixes become less
flexible and the resistance to deformation decreases resulting in a high flow value.
This relationship between the marshal quotients and the asphalt content with CR 5.0% is
shown in Figure 4.18
Figure 4.18. Correlation MQ and AC with 5.0% CR toward asphalt content
Through the review of the Marshall quotient test results in Table 4.6 and Figure
4.18 were obtained the following observations that Marshall Quotient value of asphalt
concrete with crumb rubber 5.0% is highest with the 6.5% by 256.75 mm and smallest
with asphalt content 5.0% by 195.81 mm. Thus it can be concluded that the 5.0% CR
with % bitumen increases Marshall Quotient.
This relationship between the air void and the asphalt content with CR 5.0 % is shown in
figure 4.19
y = 33,134x + 43,573
R² = 0,8911
100
150
200
250
300
350
4,5 5,0 5,5 6,0 6,5 7,0 7,5
MQ
(%
)
Asphalt Content (%)
5.0% CR
Series3
Series4
Series5
Linear (5.0% CR)

49
Figure 4.19. Correlation Air Void and AC with 5.0% CR toward asphalt content
Through the review of the air void test results in Table 4.6 and Figure 4.19 were
obtained the following observations that air void value of asphalt concrete with crumb
rubber 5.0% is highest with the 5.0% by 8.96% and smallest with asphalt content 7.0%
by 5.53%. Thus it can be concluded that the 5.0% CR with % bitumen decreases air void.
This relationship between the VFWA and the asphalt content is shown in Figure 4.20
F
i
g
u
r
e
4
.
2
0
: Correlation VFWA and AC with 5.0% CR toward asphalt content
Through the review of the VFWA results in Table 4.6 and Figure 4.20 were
obtained the following observations that VFWA value of asphalt concrete with crumb
y = -1,7809x + 17,751
R² = 0,9785
2,00
3,00
4,00
5,00
6,00
7,00
8,00
9,00
10,00
4,5 5,0 5,5 6,0 6,5 7,0 7,5
Air
Vo
id (
%)
Asphalt Content (%)
5.0 % CR
Series4
Series5
Linear (5.0 % CR)
y = 9,7158x + 6,5298
R² = 0,9843
40,00
45,00
50,00
55,00
60,00
65,00
70,00
75,00
80,00
4,5 5 5,5 6 6,5 7 7,5
VF
WA
(%
)
Asphalt Contente (%)
Series3
5.0 % CR
min 65

50
rubber 5.0% is highest with the 7.0% by 73.37% and smallest with asphalt content 5.0%
by 54.60%. Thus it can be concluded that the 5.0% CR with % bitumen increases VFWA.
This relationship between the VMA and the asphalt content with CR 5.0% is shown in
figure 4.21
Figure 4.21. Correlation VMA and AC with 5.0% CR toward asphalt content
Through the review of the VMA results in Table 4.5 and Figure 4.21 were
obtained the following observations that VMA value of asphalt concrete with crumb
rubber 5.0% is highest with the 7.0% by 20.73% and smallest with asphalt content 5.0%
by 19.72%. Thus it can be concluded that the 5.0% CR with % bitumen increases void
mine aggregate.
y = 0,4473x + 17,383
R² = 0,7911
12,00
14,00
16,00
18,00
20,00
22,00
24,00
4,50 5,00 5,50 6,00 6,50 7,00 7,50
VM
A (
%)
Asphalt Content (%)
Series4
5.0% CR

51
Figure 4.22. Correlation Marshall Properties toward 5.0% CR
Through the review of the Marshall Properties test results in Table 4.6 were
obtained the following observations that the optimum bitumen content when added
crumb rubber 5.0% is 6.45% bitumen, that is shows in Figure 4.22
4.14.3. Properties of Asphalt Concrete With 5.0% Crumb Rubber.
Table shows some properties of asphalt concrete modified with crumb rubber 5.0%.
Table 4.7. Properties of asphalt concrete with 7.5% crumb rubber (60/70)
Asphalt
Content
(%)
Stabilities
Kg
Flow
mm VFWA
Air
void MQ Density VMA
5.0 747.51 4.37 58.44 7.78 171.20 2.27 18.68
5.5 884.20 4.80 64.05 6.79 184.20 2.28 18.82
6.0 940.33 5.17 70.79 5.46 182.11 2.29 18.68
6.5 924.28 4.61 79.92 3.64 200.31 2.32 18.14
7.0 809.21 3.73 93.10 1.18 216.92 2.36 17.08
0
10
20
30
40
50
60
70
5,0 5,5 6,0 6,5 7,0 7,5
Asphalt Content with CR 5.0%
Stabilitas
Flow
VIM
MQ
VMA
VFWA
Min
Max
KAO
KAO =6,45%

52
This relationship between the stability and the asphalt content with CR 7.5% is shown in
Figure 4.23.
Figure 4.23. Correlation stability and AC with 7.5% CR toward asphalt content
Through the review of the stability test results in Table 4.7 and Figure 4.23 the
following observations were obtained that the stability value of asphalt concrete with
crumb rubber 7.5% is highest with asphalt content 6.0% by 940.33 kg and is smallest
with asphalt content 5.0% by 747.51 with add the 7.5% crumb rubber effect at the
cohesion and the bonding stability of modified bitumen decrease. So the stability value of
asphalt concrete modified without crumb rubber is higher than asphalt concert with
crumb rubber, and the stability value of asphalt concrete modified with crumb rubber
5.0% is higher than asphalt concert with crumb rubber 7.5% but the stability increases
along with the decrease of CR content up to a certain extent (optimum) and decreases
after it passes the optimum limit. This happens because the asphalt as the binding
material between the aggregate can become a lubricant after the optimum limit as the
binding.
y = -171,04x2 + 2082,7x - 5424,2
R² = 0,9888
600
650
700
750
800
850
900
950
1000
4,5 5,0 5,5 6,0 6,5 7,0 7,5
Sta
bil
ita
s (k
g)
Asphalt Content (%)
7.5% CR
min SMA
min 800
Series3
Poly. (7.5% CR)

53
This relationship between the flows and the asphalt content is shown in Figure 4.24.
Figure 4.24. Correlation flows and AC with 7.5% CR toward asphalt content
Through the review of the flow test results in Table 4.7 and Figure 4.24 the
following observations were obtained that flow value of asphalt concrete with crumb
rubber 7.5% is highest with asphalt content 6.0% by 5.17 mm and smallest with asphalt
content 7.0% by 3.73 mm. Thus it can be concluded that the higher the asphalt content
increases flow. With the addition of the asphalt content will affect the mixes become less
flexible and the resistance to deformation decreases resulting in a high flow value.
This relationship between the marshal quotients and the asphalt content with CR 7.5% is
shown in Figure 4.25.
y = -1,0133x2 + 11,869x - 29,693
R² = 0,968
1,00
2,00
3,00
4,00
5,00
6,00
7,00
4,50 5,00 5,50 6,00 6,50 7,00 7,50
Flo
w (
mm
)
Asphalt Content (%)
min 3
7.5 % CR SMA
Series2
y = 20,604x + 60,157
R² = 0,8986
50
100
150
200
250
300
350
400
4,50 5,00 5,50 6,00 6,50 7,00 7,50
MQ
(%
)
asphalt content (%)
Series4
7.5 % CR SMA
Series3
54
Figure 4.25. Correlation MQ and AC with 7.5% CR toward asphalt content
Through the review of the MQ test results in Table 4.7 and Figure 4.25 the
following observations were obtained that MQ value of asphalt concrete with crumb
rubber 7.5% is highest with the 7.0% by 216.92 mm and smallest with asphalt content
5.0% by 171.20 mm. Thus it can be concluded that the 7.5% CR with % bitumen
increases MQ.
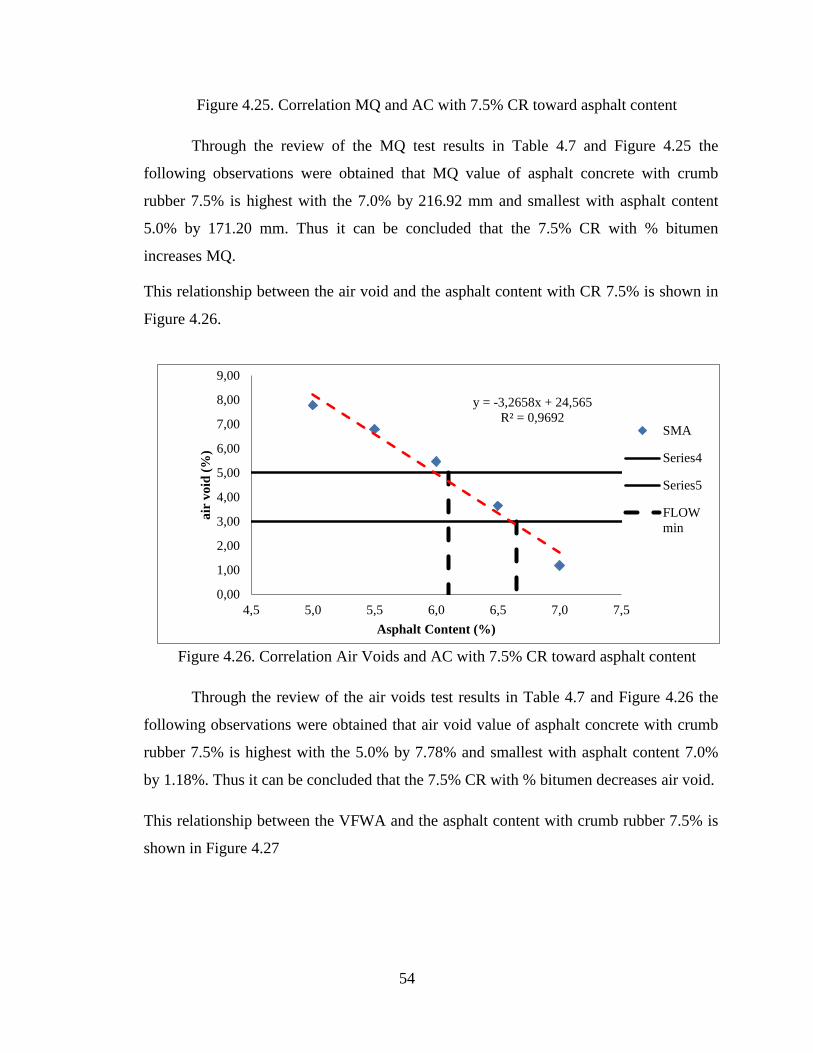
This relationship between the air void and the asphalt content with CR 7.5% is shown in
Figure 4.26.
Figure 4.26. Correlation Air Voids and AC with 7.5% CR toward asphalt content
Through the review of the air voids test results in Table 4.7 and Figure 4.26 the
following observations were obtained that air void value of asphalt concrete with crumb
rubber 7.5% is highest with the 5.0% by 7.78% and smallest with asphalt content 7.0%
by 1.18%. Thus it can be concluded that the 7.5% CR with % bitumen decreases air void.
This relationship between the VFWA and the asphalt content with crumb rubber 7.5% is
shown in Figure 4.27
y = -3,2658x + 24,565
R² = 0,9692
0,00
1,00
2,00
3,00
4,00
5,00
6,00
7,00
8,00
9,00
4,5 5,0 5,5 6,0 6,5 7,0 7,5
air
vo
id (
%)
Asphalt Content (%)
SMA
Series4
Series5
FLOW
min

55
Figure 4.27. Correlation VFWA and AC with 7.5% CR toward asphalt content
Through the review of the VMA results in Table 4.7 and Figure 4.28 the
following observations were obtained that VMA value of asphalt concrete with crumb
rubber 7.5% is highest with the 5.5% by 18.82% and smallest with asphalt content 7.0%
by 17.08%. Thus it can be concluded that the 7.5% CR with % bitumen increases VMA..
This relationship between the VMA and the asphalt content with CR 7.5% is shown in
Figure 4.28.
Figure 4.28. Correlation VMA and AC with 7.5% CR toward asphalt content
y = 17,037x - 28,964
R² = 0,9696
50,00
55,00
60,00
65,00
70,00
75,00
80,00
85,00
90,00
95,00
100,00
4,5 5,0 5,5 6,0 6,5 7,0 7,5
VF
WA
(%
)
Asphalt Contente (%)
7.5% CR SMA
min 65
Series2
Series3
Series5
Linear (7.5% CR SMA)
y = -0,7756x + 22,933
R² = 0,727
10,00
12,00
14,00
16,00
18,00
20,00
22,00
24,00
4,50 5,00 5,50 6,00 6,50 7,00 7,50
VM
A (
%)
Asphalt Content (%)
Series4
7.5% CR SMA

56
Through the review of the VMA results in Table 4.7 and Figure 4.28 the
following observations were obtained that VMA value of asphalt concrete with crumb
rubber 7.5% is highest with the 5.5% by 20.73% and smallest with asphalt content
17.08% by 19.72%. Thus it can be concluded that the 7.5% CR with % bitumen increases
VMA.
Figure 4.29. Correlation Marshall Properties toward 7.5% CR
Through the review of the Marshall Properties test results in Table 4.7 the
following observations were obtained that the OBC when added crumb rubber 7.5% is
6.375% bitumen, that is shows in Figure 4.29
4.14.4. Properties of Asphalt Concrete With 10% Crumb Rubber.
Table 4.8. Properties of asphalt concrete with 10 % crumb rubber (60/70)
Asphalt
Content
(%)
Stabilities
Kg
Flow
mm
VFWA
VIM
MQ
Density
VMA
5.0 731.87 5.03 46.82 11.84 146.51 2.17 22.26
5.5 769.38 5.03 49.94 11.46 154.23 2.16 22.89
6.0 774.43 5.35 56.41 9.77 145.44 2.19 22.39
6.5 718.15 5.13 57.26 10.10 139.83 2.16 23.62
7.0 649.58 6.13 56.94 11.02 107.05 2.13 25.34
0
10
20
30
40
50
60
70
5,0 5,5 6,0 6,5 7,0 7,5
Asphalt Concret With 7.5% CR
Stabilitas
Flow
M/Q
VMA
VFWA
RonggaUdara
OBC=6.375%

57
This relationship between the stability and the AC with CR 10% is shown in Figure 4.30
Figure 4.30. Correlation stability and AC with 10% CR toward asphalt content
Through the review of the stability test results in Table 4.8 and Figure 4.30 the
following observations were obtained that the stability value of asphalt concrete with
crumb rubber 10% is highest with asphalt content 6.0% by 774.43 kg and is smallest with
asphalt content 5.0% by 649.58 with by adding the 10% crumb rubber effect at the
cohesion and the bonding stability of modified bitumen decrease. So the stability value
of asphalt concrete modified without crumb rubber is higher than asphalt concert with
crumb rubber, and the stability value of asphalt concrete modified with crumb rubber 7.5
% is higher than asphalt concert with crumb rubber 10 % but the stability increases along
with the decrease of CR content up to a certain extent (optimum) and decreases after it
passes the optimum limit. This happens because the asphalt as the binding material
between the aggregate can become a lubricant after the optimum limit as the binding.
y = -154,27x2 + 1878,1x - 4969,4
R² = 0,9895
500
550
600
650
700
750
800
850
900
950
1000
4,50 5,00 5,50 6,00 6,50 7,00 7,50 8,00
Sta
bil
ita
s (k
g)
Asphalt Content (%)
min 800
stability
min SMA

58
This relationship between the flows and the asphalt content is shown in Figure 4.31
Figure 4.31. Correlation Flows and AC with 10% CR toward asphalt content
Through the review of the flow test results in Table 4.8 and Figure 4.31 the
following observations were obtained that flow value of asphalt concrete with crumb
rubber 10 % is highest with asphalt content 7.0 % by 6.13 mm and smallest with asphalt
content 5.0% by 5.03 mm. Thus it can be concluded that the higher the asphalt content
increases flow. With the addition of the asphalt content will affect the mixes become less
flexible and the resistance to deformation decreases resulting in a high flow value.
This relationship between the marshal quotients and the asphalt content with CR 10% is
shown in Figure 4.32.
y = -0,8362x2 + 9,8276x - 23,509
R² = 0,9744
0,00
1,00
2,00
3,00
4,00
5,00
6,00
7,00
8,00
4,5 5,0 5,5 6,0 6,5 7,0 7,5 8,0
Flo
w (
mm
)
asphalt content(%)
flow
min 3
Series2
Poly. (flow)

59
Figure 4.32. Correlation MQ and AC with 10% CR toward asphalt content
Through the review of the MQ test results in Table 4.8. and Figure 4.32. were
obtained the following observations that Marshall Quotient value of asphalt concrete with
crumb rubber 10 % is highest with the5.5 % by 154.23 mm and smallest with asphalt
content 7.0% by 107.05 mm. Thus it can be concluded that the 10% CR with % bitumen
decreases Marshall Quotient.
This relationship between the air voids and the asphalt content with CR 10% is shown in
Figure 4.33.
Figure 4.33. Correlation Air Voids and AC with 10% CR toward asphalt content
y = 11,2x + 68,763
R² = 0,8285
50
100
150
200
250
300
350
400
4,50 5,00 5,50 6,00 6,50 7,00 7,50 8,00
MQ
(%
)
Asphalt Content (%)
Series4
MQ
Series2
Series3
y = -0,5997x + 14,436
R² = 0,2891
0,001,002,003,004,005,006,007,008,009,00
10,0011,0012,0013,00
4,5 5,0 5,5 6,0 6,5 7,0 7,5 8,0
air
vo
id (%
)
Asphalt Content (%)
VIM
Series4
Series5
Linear (VIM)

60
Through the review of the air void test results in Table 4.8 and Figure 4.33 the
following observations were obtained that air void value of asphalt concrete with crumb
rubber 10% is highest with the 5.0% by 7.78% and smallest with asphalt content 7.0% by
1.18%. Thus it can be concluded that the 10 % CR with % bitumen decreases air void.
This relationship between the VFWA and the asphalt content with crumb rubber 10 % is
shown in Figure 4.34.
Figure 4.34. correlation VFWA and AC with 10% CR toward asphalt content
Through the review of the VFWA results in Table 4.8. and Figure 4.34. the
following observations were obtained that VFWA value of asphalt concrete with crumb
rubber 10% is highest with the 7.0% by 56.94% and smallest with asphalt content 5.0%
by 46.82%. Thus it can be concluded that the 10% CR with % bitumen increases VFWA.
This relationship between the VMA and the asphalt content with CR 10% is shown in
figure 4.35.
y = 5,5117x + 20,403
R² = 0,8276
40,00
45,00
50,00
55,00
60,00
65,00
70,00
75,00
80,00
85,00
90,00
95,00
100,00
4,5 5,0 5,5 6,0 6,5 7,0 7,5 8,0
VF
WA
(%
)
Asphalt Content (%)
VFWA
min 65
Series2
Series3
Linear (VFWA)

61
Figure 4.35. Correlation VMA and AC with 10% CR toward asphalt content
Through the review of the VMA results in Table 4.8. and Figure 4.35. the following
observations were obtained that VMA value of asphalt concrete with crumb rubber 10%
is highest with the 7.0% by 25.34% and smallest with asphalt content 5.0% by 22.26%.
Thus it can be concluded that the 10% CR with % bitumen increases void mine
aggregate.
4.15. Comparison of Marshall Test
Table.4.9. Comparison of Stability of AC modified with and without crumb rubber
Asphalt
Content
Stability
0% CR
Stability
2.5% CR
Stability
5.0% CR
Stability
7.5% CR
Stability
10 % CR
5.00 1035.33 896.78 784.31 747.51 731.87
5.50 1336.90 1056.50 883.42 884.20 769.38
6.00 1412.80 1181.26 962.00 901.33 774.43
6.50 1328.01 1172.59 921.08 900.28 718.15
7.00 1166.02 1029.50 846.48 809.21 649.58
y = 1,3761x + 15,043
R² = 0,7485
5,00
10,00
15,00
20,00
25,00
30,00
35,00
4,5 5,0 5,5 6,0 6,5 7,0 7,5 8,0
VM
A (
%)
Asphalt Content (%)
VMA
Series4
Linear (VMA)
62
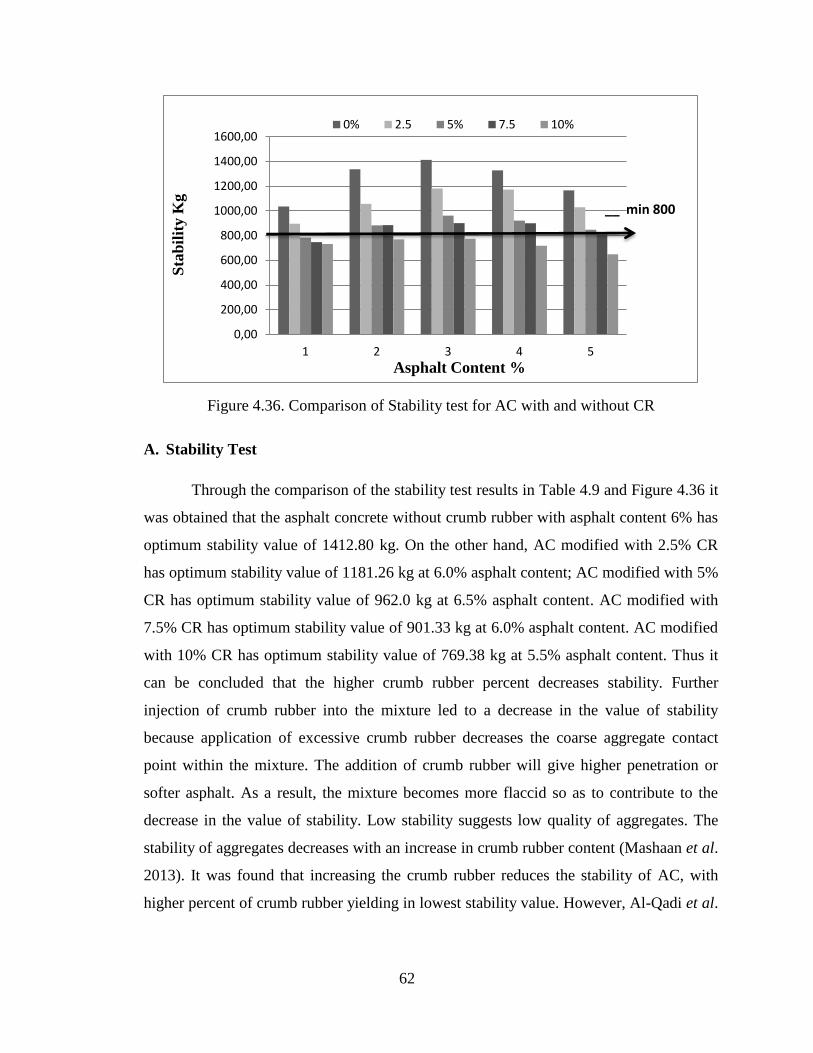
Figure 4.36. Comparison of Stability test for AC with and without CR
A. Stability Test
Through the comparison of the stability test results in Table 4.9 and Figure 4.36 it
was obtained that the asphalt concrete without crumb rubber with asphalt content 6% has
optimum stability value of 1412.80 kg. On the other hand, AC modified with 2.5% CR
has optimum stability value of 1181.26 kg at 6.0% asphalt content; AC modified with 5%
CR has optimum stability value of 962.0 kg at 6.5% asphalt content. AC modified with
7.5% CR has optimum stability value of 901.33 kg at 6.0% asphalt content. AC modified
with 10% CR has optimum stability value of 769.38 kg at 5.5% asphalt content. Thus it
can be concluded that the higher crumb rubber percent decreases stability. Further
injection of crumb rubber into the mixture led to a decrease in the value of stability
because application of excessive crumb rubber decreases the coarse aggregate contact
point within the mixture. The addition of crumb rubber will give higher penetration or
softer asphalt. As a result, the mixture becomes more flaccid so as to contribute to the
decrease in the value of stability. Low stability suggests low quality of aggregates. The
stability of aggregates decreases with an increase in crumb rubber content (Mashaan et al.
2013). It was found that increasing the crumb rubber reduces the stability of AC, with
higher percent of crumb rubber yielding in lowest stability value. However, Al-Qadi et al.
0,00
200,00
400,00
600,00
800,00
1000,00
1200,00
1400,00
1600,00
1 2 3 4 5
Sta
bil
ity K
g
Asphalt Content %
0% 2.5 5% 7.5 10%
__ min 800

63
(2009) reported that crumb rubber has more effect on performance of asphalt mixture by
increasing the Marshal Stability and Flow.
Table.4.10. Comparison of Flow of AC modified with and without crumb rubber
Asphalt
Content
Flow
0%CR
Flow
2.5%CR
Flow5.0%
CR
Flow 7.5%
CR
Flow 10%
CR
5.00 2.80 3.00 4.00 4.37 5.03
5.50 3.22 3.53 4.13 4.80 5.03
6.00 3.40 3.80 3.97 5.17 5.35
6.50 3.17 3.47 3.60 4.61 5.13
7.00 2.67 2.80 2.80 3.73 6.13
Figure 4.37. Comparison of flow test for AC with 0, 2.5, 5.0, 7.5 and 10% CR
B. Flow
Through the comparison of the Flows test results in Table 4.10 Figure 4.37 it was
found that flow test value of asphalt concrete increased as the crumb rubber content
increased from 0% to 7%. Higher flow values may be related to the increase of air voids
(more compaction required) by using more CRM in the mixture, which leads to a more
flexible mixture.
0,00
1,00
2,00
3,00
4,00
5,00
6,00
7,00
1 2 3 4 5
flo
w %
Asphalt content %
flow 0%CR flow 2.5%CR flow5.0%CR flow 7.5% CR flow 10% CR
Mix 4
Min 2

64
Thus it can be concluded that the higher the crumb rubber content increased flow
but higher asphalt content decreases flow. With the addition of the asphalt content the
mixes become more flexible and the resistance to deformation decreases resulting in a
high flow value. Mashaan et al. (2013) similarly reported that the addition of crumb
rubber modifier to asphalt concrete increases the flow of the mixture until optimum
crumb rubber content is reached.
C. Void Filled With Asphalt (VFWA)
The analysis of the VFWA test results in Figure 4.38 showed that modified with
0%, 2.5%, 5.0%, 7.5% and 10% CR have maximum VFWA values of 80.60, 82.82,
73.37, 93.10, and 56.94, respectively. Thus it can be concluded that increase in percent of
crumb rubber content increases the VFWA. The reason is that voids provide spaces for
the movement of the asphalt cement or asphalt rubber binder within the compacted mix.
Mix design of asphalt and rubberized AC asphalt paving mixes is a trade-off between
high binder content to enhance long term durability and performance, and sufficient in-
place void space to avoid rutting, instability, flushing and bleeding, as it is clearly shown
in Table 4.11 the VFWA.
Table 4.11. Comparison of VFWA of AC modified with and without crumb rubber
Asphalt
Content
VFWA
0%CR
VFWA
2.5%CR
VFWA
5.0%CR
VFWA
7.5% CR
VFWA
10% CR
5.00 61.44 59.96 54.60 58.44 46.82
5.50 66.89 67.97 59.63 64.05 49.94
6.00 70.31 71.41 65.84 70.79 56.41
6.50 75.92 74.99 70.68 79.92 57.26
7.00 80.60 82.82 73.37 93.10 56.94

65
Figure 4.38. Comparison of VFWE test for AC with and without CR
D. Voids In Mix (VIM) Test
Through the comparison of the Voids In Mix test results in Table 4.12. Figure
4.39. it was found that the Voids in Mix value of asphalt concrete without crumb rubbers
is 6.91. at asphalt content of 5%, while AC modified with 2.5%, 5.0%, 7.5%, and 10%
CR have maximum Voids In Mix value of 7.37, 8.96, 7.78 and 11.84, respectively
asphalt content 5%. Thus it can be concluded that higher crumb rubber and asphalt
content increase Voids in Mix. This is supported by Ibrahim et al. (2014) which found
that crumb rubber particle size can affect the optimum binder content for open graded
friction course. The durability of HMA is a function of the VIM or porosity. In general,
the higher the porosity, the less permeable will be the mixture and vice versa. Too much
voids in the mix (high porosity) will provide passageways through the mix for the
entrance of damaging air and water. Too low porosity could lead to flushing where the
excess bitumen squeezes out of the mix to the surface. However, Al-Qadi et al., (2009)
5,00
15,00
25,00
35,00
45,00
55,00
65,00
75,00
85,00
95,00
1 2 3 4 5
VF
MA
(%
)
VFWA 0%CR VFWA 2.5%CR VFWA5.0%CR VFWA 7.5% CR VFWA 10% CR

66
Table.4.12. Comparison of VIM of AC modified with and without crumb rubber
Asphalt
Content
VIM
0%CR
VIM
2.5%CR
VIM
5.0%CR
VIM
7.5% CR
VIM 10%
CR
5.00 6.91 7.37 8.96 7.78 11.84
5.50 6.14 5.77 8.04 6.79 11.46
6.00 5.59 5.32 6.82 5.46 9.77
6.50 4.65 4.79 5.98 3.64 10.10
7.00 3.73 3.23 5.53 1.18 11.02
This relationship between VIM of the asphalt concrete AC and asphalt concrete modified
with crumb rubber is shown in figure 4.39.
Figure 4.39. Comparison of VIM test for AC with and without CR
4.16. Indirect Tensile Strength Test (ITS)
The strength test was used to determine tensile strength and strain of the mixture
specimens. Specimens were monotonically loaded to failure along the vertical diametric
axis at the constant rate of 3 in/min (76.2 mm/min)
The indirect tensile strength test is one type of tensile strength test used for
stabilized materials. This test involves loading a cylindrical specimen with a compressive
y = -0,1963x2 + 0,7868x + 7,8518 y = 0,0032x2 - 1,8874x + 16,504
y = 0,3726x2 - 6,2519x + 30,978 y = -0,9785x2 + 8,4759x - 10,171 y = 1,321x2 - 16,452x + 61,334
0,00
2,00
4,00
6,00
8,00
10,00
12,00
14,00
4,50 5,00 5,50 6,00 6,50 7,00 7,50
VIM 0%CR
VIM 2.5%CR
VIM5.0%CR
VIM 7.5%
CR
VIM 10% CR
VIM
%
asphalt content

67
load along two opposite generators. This results in a relatively uniform tensile stress
acting perpendicular to and along the demurral plan of the applied load this result in
splitting failure generally occurring along the diametric plans three samples for each type
of asphalt concrete without and with CR were tested at temperatures 30˚C, 40˚C and
60˚C.
Figure 4.40. and Table 4.13. shows the summarized result of indirect tensile strength test
each type of asphalt concrete without and with crumb rubber in OBC.
Calculate the tensile strength of the compacted bituminous mixture:
(4.1)
Where:
ITS: is Indirect tensile strength, psi
F: is Total applied vertical load at failure, lb
F = 2708.14 KN
h: is Height of specimen, in = 63.37mm
d: is Diameter of specimen, = 100 mm
= 272 MP/mm²
ITS = 272 MP/mm²
Table 4.13. Comparison of indirect tensile strength test at OBC
AC type OBC ITS @30 C
(MPa)
ITS @ 40C
(MPa)
ITS @ 60C
(MPa)
without CR 6.4 242.23 117.81 42.40
with CR 2.5% 6.475 144.45 76.03 17.31
with CR 5.0% 6.45 129.10 52.84 10.95
with CR 7.5% 6.375 100.21 43.55 9.89
This relationship between the ITS and the different temperatures is shown in Figure 4.39.

68
Figure 4.40. Results of ITS each and asphalt concrete modified without and with CR
Through review of the results of ITS test in Table 4.9 and Figure 4.40. the observations
were obtained as the following
1. At Temperature 30
The ITS value of asphalt concrete without crumb rubber is higher than asphalt
concrete modified without crumb rubber by 242.23MPa and asphalt concrete with 2.5%
CR is higher than asphalt concrete with 5.0% by 144.45MPa, and asphalt concrete with
5.0% CR is higher than asphalt concrete with 7.5% CR by 129.10MPa. The least ITS
value at a temperature 30˚C was obtained for AC modified with 7.5% CR by 100.21MPa.
Thus it can be concluded that asphalt concrete with crumb rubber is more sensitive to
temperature changes by using ITS test compared with asphalt concrete without crumb
rubber.
2. At Temperature 40
The ITS value of asphalt concrete without crumb rubber is higher than asphalt
concrete modified without crumb rubber by 117.81MPa and asphalt concrete with 2.5%
CR is higher than asphalt concrete with 5.0% by 76.03MPa, and asphalt concrete with
5.0% CR is higher than asphalt concrete with 7.5% CR by 52.84MPa. The least ITS value
at a temperature 30˚C was obtained for AC modified with 7.5% CR by 43.55MPa. Thus it
can be concluded that asphalt concrete with crumb rubber is more sensitive to
y = -6.248x + 404.9
y = -4.051x + 254.8
y = -3.674x + 223.5
y = -2.820x + 173.4
0,00
50,00
100,00
150,00
200,00
250,00
300,00
30 35 40 45 50 55 60
Linear(ITS0%CR)
Linear(ITS2.5%CR)Linear(ITS5.0%CR)Linear(ITS7.5%CR)
ITS
(M
Pa)
Crumb Rubber %

69
temperature changes by using ITS test compared with asphalt concrete without crumb
rubber.
3. At Temperature 60
The ITS value of asphalt concrete without crumb rubber is higher than asphalt
concrete modified without crumb rubber by 42.4 MPa and asphalt concrete with 2.5% CR
is higher than asphalt concrete with 5.0% by 17.31 MPa, and asphalt concrete with 5.0%
CR is higher than asphalt concrete with 7.5% CR by 10.95 MPa. The least ITS value at a
temperature 30˚C was obtained for AC modified with 7.5% CR by 9.89 MPa. Thus it can
be concluded that asphalt concrete with crumb rubber is more sensitive to temperature
changes by using ITS test compared with asphalt concrete without crumb rubber.
Through the above observation for asphalt concrete mixtures that is stronger than
the asphalt mixture with crumb rubber, and asphalt concrete modified with 2.5% crumb
rubber is stronger than the asphalt concrete modified with 5.0% and 7.5% crumb rubber.
There are a lot of filler composition of the asphalt so it can fill cavities in the asphalt mix
aggregate and asphalt than surrounds thicker than using asphalt without crumb rubber.
The asphalt concrete modified with crumb rubber is more sensitive to temperature
changes by using ITS test compared with asphalt concrete without crumb rubber.
4.17. Unconfined Compressive Strength Test (UCS)
This test used to determine the resistance to permanent deformation of bitumen
mixture at 30˚C and loads. It is conducted by applying a static load to a specimen using
OBC and then measuring the maximum load. This test used to determine the permanent
deformation of asphalt concrete without crumb rubber and asphalt concrete with three
type crumb rubber is done using UTM (Universal Testing Machine) to obtained strong
push by the unit KN, and then a strong press is made to the calculation unit KPa. The
unconfined compression test is by far the most popular method of shear testing because it
is one of the fastest and cheapest methods of measuring shear strength. The results of the
unconfined compressive strength test are given in Table 4.14. and Figure 4.41.

70
Table.4.14. Comparison of Unconfined compressive strength test at OBC at 30
Crumb Rubber Load KPa @ 30˚C OBC
0 5220.707633 6.4
2.5 4097.285707 6.475
5 3234.877943 6.45
7.5 2619.054288 6.375
This relationship between the UCS and the CR is shown in Figure 4.41.
Figure 4.41 Results of UCS each and AC modified without and with CR at 30˚ C
Calculate the tensile strength of the compacted bituminous mixture:
(4.2)
Where:
F : is compressive strength, lbs/in² (KN/m2)
P : is maximum load, lbf (KN) = 37.72KN
37.72×1000 = 37720N
A : is cross sectional area, in² (m2) = 7883.98
= 480.3N/mm²
Y = -346,69X + 5093,1 R² = 0,9831
1000
1500
2000
2500
3000
3500
4000
4500
5000
5500
0 1 2 3 4 5 6 7 8
UCS
LINEAR (UCS)
UC
S K
Pa
Crumb Rubber %

71
The UCS value of asphalt concrete 60/70 without crumb rubber is higher by
5220.71 KPa than asphalt concrete modified with crumb rubber at temperature 30˚C. This
is due to the addition of the asphalt concrete mixture with crumb rubber decrease
adhesion of asphalt to aggregate more resistant to destruction of which would affect the
decrease in UCS value. However, asphalt concrete modified without crumb rubber is
higher than asphalt concrete modified with crumb rubber at temperature 30 . The
asphalt with crumb rubber is less sensitive to temperature changes by using test compared
asphalt without crumb rubber. Through the study of the relationship between the value of
UCS and temperature change, it is found that unmodified asphalt concrete is more
sensitive to heat than crumb rubber modified AC.
4.18. Indirect Tensile Strength Modulus (ITSM)
ITSM test was performed both on samples of thin normal and modified AC using
UMMATTA. Tests were conducted at a temperature of 40ºC and the results can be seen
in Table 4.15. and Figure 4.42. (see also Appendix D).
Table 4.15. Comparison of Indirect Tensile Strength Modulus test at 40OC
CR% OBC ITSM (MPa) at 400C Average (MPa)
0% 6.4 633 705 669 669
2.50% 6.475 613 586 599.5 599.5
5.00% 6.45 363 349 356 356
7.50% 6.375 194 234 214 214
Three samples were tested for each unmodified and modified mixture. To obtain a
stiffness modulus for a mixture, each sample was tested in three different conditions and
the average value was adopted. Stiffness modulus of the mixtures is shown in Table 4.42
and Figure 4.42.
This relationship between the ITSM and the CR is shown in Figure 4.42.

72
Figure 4.42. results of ITSM each and AC modified without and with CR
4.19. Permeability Test (M)
Permeability testing is important because one of the primary assumptions is
structural pavement design for conventional pavement is flexible (asphalt concrete) and
the pavement must be impermeable. The basis for this design approach is to minimize
moisture infiltration and thus maintain adequate support from the underlying unbound
materials. Table 4.16. shows the result of permeability test at OBC and Figure 4.43. and
Figure 4.44. shows the summarized results for the each type of asphalt concrete at OBC.
The calculations of coefficient permeability are by the following equation:
Where diameter (D) = 2.54*4 = 10.16 cm
Height (L) = 6.127 cm
Area (A) =
=
= 79.756 cm² (4.3)
Pressure water (P)= 10Kg/cm²
Volume of water leakage (V) = 1000 ml
Time leakage 1000ml = 194 sec @(10Kg/cm²).
.
Coefficient permeability (k) =
=
= 3.96E-07 cm/sec
y = -6434x + 700,9
R² = 0,962
0
100
200
300
400
500
600
700
800
0% 3% 5% 8% 10%
ITSM (MPa) at 40C
ITSM (MPa) at
40C
Linear (ITSM
(MPa) at 40C)
Log. (ITSM
(MPa) at 40C)
ACR
ITS
M (
MP
a)

73
Table 4.16. Comparison of Permeability Test at OBC.
Crumb
Rubbe
r %
Asphalt
Conten
t
Height
(L)
(cm)
Area (A)
(cm2)
Pressure Water 10000
dyne/cm
Pressure Water
20000 dyne/cm
Time (T)
sec
Permeabilit
y (K)
cm/sec
Time
(T) sec
Permeabilit
y (K)
cm/sec
0
6.4 6.127 79.756 194 3.96E-07 60.2 6.38E-08
6.4 6.131 79.756 207 3.71E-07 73 5.27E-08
6.4 6.129 79.756 201 3.82E-07 75 5.12E-08
Average 3.83E-07 5.59E-08
2.5
6.475 6.383 79.756 202 3.96E-07 61 6.56E-08
6.475 6.41 79.756 106 7.58E-07 35 1.15E-07
6.475 6.3965 79.756 135 5.94E-07 60.2 6.66E-08
Average 5.83E-07 8.23E-08
5
6.45 6.408 79.756 160 5.02E-07 31 1.3E-07
6.45 6.544 79.756 113 7.26E-07 58 7.07E-08
6.45 6.476 79.756 143 5.68E-07 46 8.83E-08
Average 5.99E-07 9.62E-08
7.5
6.375 6.621 79.756 81 1.02E-06 30 1.38E-07
6.375 6.56 79.756 97 8.48E-07 32 1.29E-07
6.375 6.5905 79.756 92 8.98E-07 35 1.18E-07
Average 9.24E-07 1.28E-07
This relationship between the Permeability of the asphalt concrete AC and asphalt
concrete modified with crumb rubber is shown in figure 4.43. And figure 4.44.

74
Figure 4.43. The results of permeability test at 10000 dyen/cm
Figure 4.44. The results of permeability test at 20000 dyen/cm²
Through the review of the permeability test results in Table 4.16 and Figure 4.41
and 4.42. The following observations were obtained that the coefficient of permeability
(K) value of AC with crumb rubber 7.5% is higher than asphalt concrete without crumb
rubber (original) and with crumb rubber 2.5% and 5.0% by 9.24E-07 dyen/cm2 at water
pressure 10000 dyen/cm2 and by 9.2.57E-06 dyen/cm
2 at water pressure 20000 dyne/cm
2
0
2E-07
4E-07
6E-07
8E-07
1E-06
1,2E-06
0% 2.50% 5.)% 7.50%
10000 pressure dyne/cm²
0
0,0000002
0,0000004
0,0000006
0,0000008
0,000001
1
0% 2.50% 5.00% 7.50%
20000 pressure dyne/cm²
dco
effi
cien
t of
per
mea
bil
ity
(K)
cm/s
ec

75
The results of permeability test shows that asphalt concrete without crumb rubber
is lower than AC with crumb rubber since the mixture has the lowest coefficient of
permeability the higher quality. It was happened because when water leaks into the soil
layer (base course), causing deformities cracks and holes observed.
The relationship between the coefficient of permeability and water pressure
become an inverse relationship, because the increase of water pressure leads to a decrease
in Permeability coefficient.
4.20. Summary
This study covered all the processes from primarily stages of design up to the
analysis of the data obtained.
1. The stability value of asphalt concrete 60/70 pen mixture without CRM is higher
than asphalt concrete with 2.5%, 5.0%, 7.5% CRM by 11.64%, 5.04% and 5%,
respectively. The cohesion and the bonding ability of modified bitumen increase,
when increasing the proportion of rubber.
2. The flow value of asphalt concrete without CRM is lower than asphalt concrete with
2.5%,5.0%, and 7.5%. Since the penetration value of CR modified asphaltis higher
than asphalt concrete without CRM. The flow value of AC with CRM is higher as
comparison with AC without CRM. Therefore, the presence of CRM in the mixture
increases its flow value. The addition of more CRM contents increased the flow to an
optimum level and with further addition of CRM in the mix. Higher flow values may
be related to the increase of air voids by using more CRM in the mixture, which
leads to a more flexible mixture.
3. Density of the Compacted Mix (CDM).
The result obtained indicated that binder content influences the compaction
characteristics of the AC mixtures, thus having a significant effect on the mix
density, for any specific binder content, for any binder content, the density decreased
as the crumb rubber is increased in the AC mixtures. The increase in CRM content
implies an increase of the bitumen absorbed by the CRM causing more voids space
with the aggregate particles therefore a reduction in mix density. The reason for the

76
varying densities of the mixtures is because of the viscosity effect on the
compatibility of the mixtures.
The increase in viscosity could be a result of the amount of asphalt in the
bitumen which improves the viscous flow of the modified bitumen sample during the
interaction process. The higher viscosity of the resulting binder provided better
resistance during compaction of the mixture, thus resulting in lower density of the
modified mix. This is in concurrence with previous finding, which revealed that for
ideal paving mixture a good correlation between binder viscosity and the compaction
effort is required (Altamzwi, 2011).
4. Voids in the Mix (VIM).
The durability of bituminous pavement is a function of the voids of the mix
(VIM) or porosity. In general, the lower the porosity, the less permeable the mixture
will be and vice versa. Too much voids in the mix (high porosity) will provide
passageways through the mix for the entrance of damaging air and water. Too low
porosity could lead to flushing where the excess bitumen squeezes out of the mix to
the surface .The effect of the CRM content for different binder contents on the
porosity of the virgin mixture and AC mixture for any binder content used, the
increase in CRM content in the mixture is followed by an increase in the VIM, which
is due to the contact point between the aggregates which is lower when the CRM is
content increased. The high amount of crumb rubber particle absorbs the binder
which is required to encapsulate the aggregate and subsequently fill the voids
between aggregates.
High porosity in the bituminous mixture means that there are many voids
providing passageways for the entry of damaging air and water through the mix. On
the other hand, with low porosity, water flush occurs whereby bitumen is squeezed.
However, the results from concerning on the influence of bitumen show that
any increase in the bitumen content of the mix leads to a decrease in the VIM value,
which occurs due to the excessive bitumen filling up the air pocket between
aggregates. It is therefore very important to produce a mix low enough in void to be

77
impermeable and hence durable, but with sufficient voids to prevent bitumen
deformation.
5. The optimum bitumen content at asphalt 60/70 pen is 6.4%. While the OBCfor
asphalt with 2.5%, 5.0%,and 7.5%crumb rubber are 6.383%, 6.45% and 6.375%,
respectively. There is no difference in the optimum bitumen content between the four
types of asphalt concrete without and with CR, because it has been the same
gradation of aggregates for the production of mixtures.
6. The ITS value of asphalt concrete without CR is higher than asphalt concrete with
2.5%, 5.0%, and 7.5% CR with different temperatures. Through the study of the
relationship between the value of ITS test and temperature changes, it was found that
normal asphalt concrete without CR lower sensitive to heat than asphalt concrete
with CR.
There is a lot of filler composition of the asphalt concrete so it can fill cavities in
the asphalt concrete mix aggregate and asphalt that surrounds thicker than using
asphalt without CR. the asphalt concrete with CR is less sensitive to temperature
changes by using ITS test compared with asphalt concrete without CR.
7. The coefficient of permeability value of asphalt concrete without CR is lower than
asphalt concrete with 2.5% CR and AC with 2.5% CR is higher than AC with 5.0%
CR and AC with 5.0% CR is higher than AC with 7.5% CR at water pressure 10000
dyne/cm2 and water pressure 20000 dyne/cm
2, and this confirmed to the result of the
test density and the percentage of VITM, where find that the mixtures are practically
imperious.
From this limited assessment, it was concluded that asphalt concrete with 2.5%, 5.0%,
and 7.5% crumb rubber is not suitable to beused at hot and arid regionusing dry process.