Chapter -III EMERGENCE OF PRIMARY EDUCATION IN...
62
102 Chapter -III EMERGENCE OF PRIMARY EDUCATION IN INDIA AND KARNATAKA: AN OVERVIEW 3.1 Introduction The Education was imparted through religious institutions in the earlier times. The teachers were generally learned priests, pandits or maulvis and other similar functionaries. The location of the school used to be in and around the place of worship. The prime objective of education was to inculcates knowledge of good life through religion and textbooks with religious ideas. Life skills and vocations were also introduced in some cases. Land grants, gifts, in kind and cash and charities were provided by kings, rulers, noble men and wealthy families to the religious institutions for the promotion of education. Education depended upon such gifts rather than on any political or secular means. Education being religious in character. It was limited to the privileged sections while the masters did not had no ways to reach upto. The education policy during the medieval period used to be according to the whims and families of the ruling class. It was individual rather than mass education. The religious lenders and the institutions had gained upper hand in. The net work of pathashalas and maktabs was already there all over India by the time the British rule was established in which the East India Company was not at all interested in that type of education of India. British education created different hierarchies. Education was made secular with a view of open to all arrangement, but in reality it catered only to a limited section of the social groups. It was mainly meant for the elite. Large sections of the Indian population did not have
Transcript of Chapter -III EMERGENCE OF PRIMARY EDUCATION IN...

102
Chapter -III
EMERGENCE OF PRIMARY EDUCATION IN INDIA AND
KARNATAKA: AN OVERVIEW
3.1 Introduction
The Education was imparted through religious institutions in the
earlier times. The teachers were generally learned priests, pandits or
maulvis and other similar functionaries. The location of the school used
to be in and around the place of worship. The prime objective of
education was to inculcates knowledge of good life through religion
and textbooks with religious ideas. Life skills and vocations were also
introduced in some cases. Land grants, gifts, in kind and cash and
charities were provided by kings, rulers, noble men and wealthy
families to the religious institutions for the promotion of education.
Education depended upon such gifts rather than on any political or
secular means. Education being religious in character. It was limited to
the privileged sections while the masters did not had no ways to reach
upto. The education policy during the medieval period used to be
according to the whims and families of the ruling class. It was
individual rather than mass education. The religious lenders and the
institutions had gained upper hand in.
The net work of pathashalas and maktabs was already there all
over India by the time the British rule was established in which the East
India Company was not at all interested in that type of education of
India. British education created different hierarchies. Education was
made secular with a view of open to all arrangement, but in reality it
catered only to a limited section of the social groups. It was mainly
meant for the elite. Large sections of the Indian population did not have

103
access to education, like what was the practice in ancient and medieval
times.
The modern system of education popularly and characteristically
known as the British education and now in broader sense the western
education may be said to have begun in 1818. The Charter Act of 1818
directed the East India Company to spend a sum of not less than one
lakh rupees a year for the purpose of establishing it. But this amount
was not utilized even for the next ten years. Thus mass education was
neglected by the British rule in India. Under the Urban Charter of
British Administration, educational provision was made for towns and
cities. That means, the villages were neglected totally. The neglect of
rural education implied a total neglect of mass education. As the
standard of living among the people had never seen any improvement
in Indian society for generations and countries, more particularly
during British rule, education could not become priority for the poor
masses. The poverty of people created difficulties in spreading mass
education.
3.2 Woods Committee Recommendations
Since the Charter Act of 1813, several educational experiments
had been tried and various policies for action had also been proposed,
but such policies however, involved controversial issues, which needed
careful consideration. So, a need was felt for the complete survey of the
whole field of education in India. A committee under the chairmanship
of Sir Charles Wood was constituted to undertake a detailed survey of
education and to suggest a detailed policy provisions of education for
reconstruction for the future. Accordingly Charles Wood’s committee
conducted the survey and submitted a comprehensive report which

104
was popularly known as Woods Dispatch of 1854, which holds a unique
position in the history of Indian education as a document of immense
importance.
The following were the objectives of educational policy
provisions proposed by the Woods Committee:.
1) Moral and mutual progress of the natives of India through
the general diffusion of useful knowledge; and
2) To produce a higher degree of intellectual capacities among
youth to hold the offices of trust and to have responsibility
in the company services.
The Dispatch also had laid down certain recommendations after
review of the important issues covering education in India as follows:
1) Creation of a department of education in each of the
provinces to be placed under an important officer to be
called the Director of public instruction. The said office
when created was expected to submit to the government
about the progress of education every year;
2) Establishment of universities in presidency towns of
Calcutta, Bombay and Madras;
3) To set up a network of graded institution spread over
throughout the country at the one of this gradation came to
the Universities and affiliated colleges. Below these came
the high schools. At the bottom came the indigenous
primary schools. The Dispatch realizes the harm caused to
mass education by the downward filtration theory. The
Dispatch wanted that useful and practical knowledge
suites to every situation of life may be best conveyed to the
105
large mass of the people. For this purpose it suggested for
the increase in number of schools including indigenous
primary schools. Promising students were to be given
scholarships. The adoption of modern Indian languages as
medium of instruction was proposed; and
4) Adoption of policy of giving financial assistance in the
form of grant-in-aid to the institutions managed by private
bodies.
Due attention was also paid by the Government for the expansion
of establishing state primary schools. Primary education progressed
with long strides. There were two types of primary institutions - Lower
Primary and Upper Primary. Baring a few exceptions indigenous
schools were not encouraged. As a result these schools were either
disappeared or merged into the state schools. In the field of primary
education the desired results could not be achieved due to scarcity of
funds, indifferent attitude of the personnel and crooked policy of the
government.
The woods Dispatch imposed on the Government of India the
duty of creating a properly articulated system of education, from
primary level to the university level.
The most notable feature of the Dispatch was emphasis on
primary education. Therefore it is implicit of the more extreme forms of
the “Filtration Theory”. In order to carry out its policy, the Dispatch
prescribed the following measures:
i. The constitution in each presidency and lieutenant governorship
of a separate department for the administration of education,
with an adequate system of inspection;

106
ii. The institution of universities in the presidency towns;
iii. The establishment of institutions for training the teachers for all
classes of schools;
iv. The maintenance of the existing government colleges and high
schools; and the increase of their number when necessary,
increased attention to vernacular schools, both for secondary and
for primary education; and
v. The introduction of a system of grant-in-aid.
The Dispatch laid great stress on the importance of encouraging
the study of vernaculars as the only possible media for mass education,
and recommended the institution of a comprehensive system of
scholarships to connect all grades of the educational system. The
committee further expressed sympathy for the cause of the female
education and Muslim education. It advocated the opening of schools
and colleges for technical instruction and it insisted on a policy of
perfect religious neutrality. It should be added here that the Dispatch
looked forward to a time when any general system of education
provided by government might be gradually discontinued, with the
advance of the system of grant-in-aid, and when the management,
especially of higher institutions, might be handed over to local bodies
under the control of, or aided by the state.
The Woods dispatch gave more emphasis on primary education.
It is to start vernacular schools and mass education and also started
female education for Muslim community. The committee had also
recommended that the medium of instruction should be in vernacular
languages in order to facilitate effective learning among children as the
imposition of other unknown language would have had negative
impact in learning processes.

107
3.3 India Education Commission (1882)
In comparison to increase of population, the development of
education during the Dispatch’s period was rather at a slow pace.
Hence, education needed a more Liberal and Vital policy. To look into
all these problems the famous Indian Education Commission was
appointed in the year 1882, under the Chairmanship of Sir William
Hunter.
After considering the different aspects of education in general
and primary education in particular the Commission submitted its
voluminous report with various important suggestions for the future
progress of education in India.
The Commission had conceptualized education as the instruction
of the masses through the Vernacular in such subjects as will fit them
for their position in life and be not necessarily regarded as a portion of
instruction leading up to University.
The commission had recommended the following way:
1) Extension of primary education in backward districts especially
in the areas inhabited mainly by aboriginal races;
2) Entrusting the district and municipal board with the work of
management of primary education. These boards were entrusted
with supervision of primary education as a result of the Local Self
Government Act;
3) Formation of school district taking the area of any municipal or
rural unit of local self government and establishment of schools
placed render their jurisdiction in each district;
4) District and municipal boards were directed to assign specific’
funds to primary education; and

108
5) The accounts of rural and urban primary institutions be
maintained separated so that the funds of rural institution might
not be misappropriated by urban primary schools.
The commission gave positive direction that the local fund should be
utilized exclusively for development of primary education in India.
Regarding the school administration, the Commission suggested
that the upper and lower primary examinations should not be made
compulsory and care should be taken not to interfere with freedom of
the managers of aided schools in the choice of text books. The
Commission also emphasized the promotion of physical development
of the pupils by the encouragement of native games, special care for the
discipline, manners and character of the children. Besides, the
Commission suggested for the establishment of normal schools for the
training of teachers.
By the recommendation of the Hunter commission, district
boards and local boards were entrusted for the expansion of primary
education. The rights and duties of these local boards were codified
with respect to grant-in-aid to local boards. Provincial government
framed the regulations. This system adversely affected the indigenous
institution as there was maximum control of the government upon
education. Thus, by the end of the nineteenth century the indigenous
system of education all most went out of existence and the entire fabric
of the system was shattered to pieces. But the roots of the modern type
of primary education went deeper and deeper into the soil of the
country. The local boards increased their expenditure on primary
education. But in consideration of the population of the country and the
magnitude of illiteracy the funds were quite inadequate for the

109
acceleration of pace of primary education. Though there was vertical
progress owing to good teaching and defective supervision, but
horizontally it proceeded at a snail speed.
3.4 Indian University Commission (1902)
Lord Curzon evinced keen interest for the development of
education in British India. He convened an educational conference at
Shimla to discuss the problems ranging from primary education to
university education.
In respect of organizational administration of the elementary
schools, curriculum, appointment of teacher, management, finance etc.
a beginning was made for bigger changes to follow in course of time. It
was stated in the resolution passed on March 11-1-1904 that “the short
comings of the present systems in point of quality are well known. Four
out of five villages are without a school. Three boys out of four grow up
without education and only one girl out of forty attends any kind of
school.
The government of India fully accepted the proposition that the
active expansion of primary education is one of the most important
duties of the state. In the conference it was pointed out that, primary
education had been paid insufficient attention and inadequate share of
the public funds and in view of the rising tide of population, the
expansion was insufficient, the central government confirmed the
policy of utility and efficiency for the future educational development
and emphasis on the improvement of existing schools as far as possible.
Yet results were in no way impressive and spectacular. Even then it was
a period of activity in the field of elementary education. The political

110
agitation during this period influenced the education in general and
primary education in particular.
3.5 Gokhale’s Bill (1910-12)
Indian leaders began to point out the need of education in India
since 1880. Indian National Congress which was established in 1885 also
gave strength to the views of Indian leaders for education in India.
Gopal Krishna Gokhale was the member of the Imperial Legislative
Council and as a member he moved the resolutions in the Council on
March 19, 1910. The Council recommended that beginning should be
made in the direction of making elementary education free and
compulsory throughout the country.
The Council introduced the first draft of law for compulsory
education for age-group 6-10. He pleaded that universal, free and
compulsory education was essential for the development of the country
and Government should provide adequate funds for this purpose.
Gokhale withdrew the resolution on the basis of assurance from the
Government to consider the matter seriously. Department of education
was organized under the Central Government but no steps were taken
to make primary education free and compulsory. Gokhale introduced a
Bill on 16th March, 1911 to provide for gradual introduction of the
“principle of compulsion” into the elementary education system of the
country. Efforts of Gokhale failed but he could focus the attention of the
public on education and on compulsory education in particular.
Gokhale moved the following resolutions:
1. Compulsory education should be introduced in the area of
those local bodies where a certain percentage of children are
attending schools.

111
2. Local bodies should obtain the consent of the Government
before introducing compulsion.
3. Local bodies will have right to introduce compulsion in whole
of the specific areas.
4. Local bodies can levy the cess to meet the cost of education.
5. Guardians of boys between 6-10 should be required to send
their wards to recognized primary schools. In case of non
compliance they should be punished.
6. In due course of time, primary education should be made
compulsory for girls also.
7. Those guardians whose monthly income is less than Rs. 10
should not be asked to pay fees.
Though the bill was not passed in the council but the
developments in the council in this context could help in focusing the
public attention on the need of compulsory elementary education in
India. As a result of this, resolution was passed in 1913 in which some
important points were stressed such as: standards of institutions,
provision of practical curricula for primary and middle schools and
provision of better facilities for research in Universities.
3.6 Hortog Committee Report (1929)
In 1929 the Hortog committee submitted its report. The
committee devoted for more attention to mass education than
secondary and university education. The committee was not satisfied
with the scanty growth of literacy in the country and highlighted the
problem of “Wastage” and “Stagnation” at the primary level. The
committee’s conclusion was that out of every hundred pupils (boys-
girls) who were in class 1st in 1922-23, only 18 were reading in class

112
four in 1925-26. Thus resulted in a relapse into illiteracy. So it suggested
the following important measures for improvement of primary
education in the country.
1) Adoption of the policy of consolidation in place of
multiplication of schools;
2) Fixation of the duration of primary course to four years;
3) Improvement in the quality, training, status, pay, service
condition of teachers;
4) Relating the curricula and methods of teaching to the
conditions of villages in which children live and read;
5) Adjustment of school hours and holidays to seasonal and
local requirements; and
6) Increasing the number of government inspection staff.
3.7 Wardha Conference (1937)
Mahatma Gandhi published his radical proposals about
education in “Harijan” as a series of articles in 1937. These, in turn, led
to the First Congress of National Education at Wardha in October 1937
(Steele and Taylor, 1995). Gandhi’s basic idea was for education to
become self-supporting through craft, agriculture, and other productive
work, thereby by-passing potentially the need for government funding
support. The scheme called “Basic Education” was outlined at Wardha
Conference as follows:
• There should be free and compulsory education for seven years
for all children on a national scale;
• The medium of instruction should be the mother tongue;

113
• The education should centre on manual and productive work and
all other abilities: to be taught should be related to the central
handicraft; and
• The education should be self-financing through the production of
some necessary material item like khadi, which could pay the cost
of the teacher and the material;
The conference appointed a committee of educationists headed
by Dr.Zakir Hussain to work out the details of the curriculum. The
report of this committee received in 1938 was placed before Indian
National Congress the same year and was readily accepted. The first
“Basic School” was established at Sevagram near Wardha in 1938 under
Gandhji’s personal supervision.
Wardha conference recommended to provided free and
compulsory education. Mother tongue should be medium of
instruction. Child centred education, craft centered education subjects
should be taught through correlation education for self sufficiency.
3.8 Sargeant Report (1944)
After the Second World War, the British Government appointed a
committee in 1944, under the Chairmanship of Sir. John Sargeant, the
then educational adviser to the Government of India. The committee
prepared a scheme of post-war educational reconstruction and
development. The report was submitted to the central advisory board of
education which later approved and published. The report suggested
for the provision of pre-primary and nursery education, provision of
free and compulsory primary education for the age group. 6 to 11,
facilities for three years degree course and two-year post-graduate

114
course scope for technical, vocational, professional and industrial
education expansion of adult education, provision of library, facilities
for teachers training, eradication of unemployment, educational
provision for physically and mentally retarded children etc. With the
coming of independence the post war reconstruction schemes proved
non-compliant as a new vista was opened for a much larger expansion
of education in accordance with the objectives of the free India.
3.9 Education in Independent India
With the dawn of independence, the most important questions
engaging the attention of the government was the question of providing
minimum of education for all children. Educational experiments were
enhanced with a view to developing the kind of education suited to the
needs of free nation. Gandhiji’s scheme of universal free education was
a constructive programme for mass generation. The acceptance of
democratic way of life and the consequent growing faith in education
led the way for the implementation of compulsory education. The most
spectacular change in the country after 1950 at the primary stage was
the implementation of basic education which was accepted as the
national system of education.
The structural pattern of primary schools adopted before
independence what is called the British pattern continued more or less
same even after independence. The new pattern of 10 years of schooling
covers lower primary stage from 6-11 years of age and the higher
primary stage covers the duration of 3 years from 11 to 14 years of age.
Education at the primary stage is important with the objectives such as
to adopt mother tongue as medium of instruction, to make pupil learn
four fundamental numerical operations to develop among pupils the

115
power of enquiry in science and appreciate science and technology, to
develop patriotism among pupils, to cultivate the habits of the personal
cleanliness, health for full living, to develop aesthetic sense, and to
develop co-operative spirit among pupils.
Universal free and compulsory education for the age group 6 to
11 according to revived target was sought to be introduced by the end
of the 3rd five year plan. The central government gave adequate
financial assistance to state government and union territory. Though
different steps were taken to accelerate the progress of compulsory
education the target could not be achieved by the end of third plan. The
following factors were responsible for the problem in providing
facilities for the entire age group 6-11:
a) Difficulties to bringing girls to schools insufficient numbers;
b) Extreme backwardness of certain areas and certain sections of
population in the matter of education; and
c) Wastage due to parents taking away children from schools to
assist their work.
The principal impediments of primary education are due to the
factors such as paucity of physical needs, social problems, political
problems, administrative problem, economic and financial problems,
population explosion, educational factors, wastage and stagnation and
other related issues. In order to eradicate such impediments, the
constitutional provision making free and compulsory for the children
between the age group 6-14 age was adopted.
3.10 Primary Education after Independence
There is considerable process made after independence as far as
primary education is concerned. The country which was under

116
subjugation of foreign rule for generation and centuries was dabbling
for setting its own methods and approaches to serve the growing needs
of education of the masses. The preceding pattern of education
established by the British rule could not be completely given up rather
it became a standard pattern as it was more secular and was found to be
the model educational pattern of the mind to serve a highly diverse
socio-cultural system what Indian society has been for centuries. In
order to serve every community on the same platform, the government
of India had to continue with the British pattern of education and in
order to improvise, standardize and make it more accessible to every
section of society. The independent Indian society and its government
have been experimenting the policies and programmes of the kind
evolved within their own contexts.
3.10.1 Constitutional Provision
The Constitution, which came into force on January 26, 1950, has
built-in provisions related to education. These provisions, implicitly or
explicitly, refer to the basic values enshrined in the Constitution.
Educational provisions may be described in terms of emphasis on
various values, such as, those which emphasize-(i) democratic and
socialistic values; (ii) equality and justice, and (iii) secularism, fraternity
and national unity.
The Constitution directs the government to strive to promote the
welfare of the people by securing and protecting, as effectively as it
may, a social order in which justice - social, economic and political, shall
inform all the institutions of social life (Article 38). The government
policies shall also be directed to ensure equal rights for all the citizens in
respect of livelihood, distribution of ownership and control of material

117
resources and wealth for common good, equal pay for equal work for
both the sexes, protection of women and children from unsuitable and
forced labour and protection of children against the moral and material
exploitation (Article 39). The government would provide for self-
government through Panchayati Raj (Article 40) and right to work, to
education, and to public assistance in cases of unserved need (Article
41). The State is obliged to secure just and human conditions of work,
and provide for maternity relief (Article 42), work and living wages for
all workers ensuring a decent standard of life and full employment by
promoting cottage industries in rural areas (Article 43), and uniform
civil code for the citizens throughout the territory of India (Article 44),
(Basu, D.D. 2009)
One of the most important constitutional provisions regarding
education is incorporated in Article 45 of the Constitution, which states
that the state shall endeavour to provide, within a period of ten years
from the commencement of this Constitution, for free and compulsory
education for all children until they complete the age of fourteen years
(Basu, Ibid.). This provision was made in the Constitution in view of the
importance of universal elementary education for the proper
development success of democracy. This provision has important
implication for education.
After the dawn of independence, India was facing problems in
almost all spheres and education was one among them. To address the
problems of education, Government of India had setup various
committees to make feasible recommendations. The prominent among
them are Calcutta university education commission, university
education commission, the secondary education commission, Kothari
education commission 1964-66, new educational policy of 1986, revised

118
new educational policy 1992, District Primary Education Programmes
1994, Programme of action 2000, Sarva Shiksha Abhiyan 2000 etc.
3.10.2 Kothari Education Commission (1964-66)
It is the Kothari Education Commission which has dealt
exhaustively about primary education. The Commission has stated that
the strategies for the fulfillment of the constitutional directives are as
follows:
• Each state and district should prepare a plan for the
development of primary education, which suits the local
conditions and problems. The objectives should fulfill the
constitutional directive as early as possible;
• Each state and district should be assisted to go ahead at faster
pace, and the progress should not be held for want of financial
allocations; and
• While the constitutional directive will be fulfilled in some
places, such as urban areas.
The Commission has suggested the following measures:
1. Expanding school facilities for the children between 6-11 and
11- 14 years by providing part-time instruction;
2. Appointing Village Sisters to promote literacy among women;
and
3. All the educational institutions would provide elementary
courses of instruction outside their school hours.
Further, the commission has made a coordinated and
comprehensive survey of all the branches of education and has made
119
very significant suggestions. In respect of primary education it has
made a suggestion that the span of primary education be divided as
Lower Primary Stage: for the age group 6-10; and Higher Primary stage:
for the age group 10-13.
Thus, the commission propagated the concept of universalization
of elementary education. For the purpose of implementation of
universalization of elementary education programme the following
aspects needs to be emphasized: Universal Provision: The provision of a
school within easy distance from the home of every child; Universal
Enrolment: The enrolment of every child of the prescribed age into class
1 of a school through propaganda and even penal action, if necessary;
and Universal Retention: The retention of every child enrolled in the
school till he reaches the prescribed age or completes the prescribed
course.
These are the 3 stages which were of Universalisation of primary
education. They are not mutually exclusive. Generally over-lap and run
into one another. Moreover they presume that the simultaneous
implementation of a programme of qualitative improvement of
education, because universal enrolment or retention depends very
largely on the attracting and holding power of the primary schools.
3.10.3 National Policy on Education (1968)
The resolution issued by Government of India on the report of the
Education Commission urged for a new system of education as
government of India was convinced that a radical reconstruction of
education on the broad lines as recommended by the Kothari Education
Commission is essential for economic and cultural development of the

120
country, for national integration and for realizing the ideal of socialistic
pattern of society.
The National Policy on Education investigated in 1968 envisaged
a radical transformation of the education system as suggested below:
• To relate it more closely to the lives of the people, provide
expanded educational opportunities;
• Initiate a sustained intensive effort to raise the quality of
education at all stages; and
• Emphasis on the development of science and technology and
cultivate moral and social values and a closer relation between
education and the life of the people.
Since the adoption of 1968 policy, there was a considerable
expansion in educational facilities all over the country at all levels. The
most notable development has been the acceptance of a common
structure of education throughout the country and the introduction of
the 10+2+3 system by most states. In the school curricula, in addition to
laying down a common scheme of studies for boys and girls, science
and mathematics were incorporated as compulsory subjects and work
experience was assigned a place of importance.
3.10.4 Draft National Policy on Education (1979)
Draft National Policy on Education 1979 explains that education
at all levels needs to be recast so as to make the education process
functional in relation to the felt needs and potentialities of the people.
The policy also stresses that the present system of education must be
reorganized in the light of contemporary Indian realities and
121
requirements. Education should promote national unity, pride in our
cultural heritage, and faith in the country’s future.
3.10.5 National Policy on Education (1986)
The National Policy on Education 1986 was approved by the
parliament in May 1986. During 1986 and 1991 there was a review
based on nationwide debate on the New Policy on Education, which
culminated in the revised National Policy on Education and the
programme of action brought into effect in 1992. The new education
policy of 1986 has emphasized about elementary education in the
following way:
The new thrust in elementary education will emphasize three
aspects: (i) universal access and enrolment; (ii) universal retention of
children upto 14 years of age; and (iii) a substantial improvement in the
quality of education to enable all children to achieve essential levels of
learning.
The new policy on education has been the warm, welcoming and
encouraging child centered approach which is one in which all
concerned share solicitude for the needs of the child and is the best
motivation for the child to attend school and learn. A child-centered
and activity-based process of learning have been adopted at the
primary stage. First generation learners should be allowed to set their
own pace and be given supplementary remedial instruction. As the
child grows, the component of cognitive learning will be increased and
skills organized through practice. The policy of non-detention at the
primary stage has been retained. Making evaluation in considered as
disaggregate as feasible. Corporal punishment has been firmly totally

122
excluded from the educational system and school timings as well as
vacation adjusted to the convenience of children.
Provisions have been made for creation of essential facilities in
primary schools, including at least two reasonably large rooms that are
usable in all weather, and the necessary toys, blackboards, maps, charts,
and other learning material for teaching-learning process. At least two
teachers, one of whom a woman have been at work in every school. A
phased drive, symbolically called Operation Blackboard been
undertaken with since inception of the scheme to improve Primary
Schools all over the country. Government, local bodies, voluntary
agencies and individuals have been fully involved. Construction of
school buildings has been the first charge on NREP and RLEGP funds.
The programme of action of the revised national policy on
education of 1992 is the outcome of much hard labour of some of the
topmost educationists, administrators, theorists and planners. It is a
very valuable source of information also. The action of programme of
elementary education of 1992 included the following in it.
• Non-formal education to be an accepted alternative channel.
• NCERT revised the school syllabi and brought out revised text
books for classes I to XII.
• Guidelines given for micro planning.
• Total literacy campaign advocated.
• MLL for each stage laid down.
• Education for all encouraged.
• MLL along with access and retention. Scope for operation
blackboard has been enlarged. 50% teachers to be women. Free
123
and compulsory education to all children upto 14 years of age by
A.D. 2000.
• 35,000 new primary schools required.
• School mapping is needed.
• School system to cater about 18 crore children. 45 lakh teachers
required.
• An additional 11 lakh classrooms required.
• Different programme of Non formal education (NFE) spelled out.
• Micro planning for UEE may be carried out at the Block, Taluk
and District levels.
• Operation blackboard discussed.
• National curricular framework brought out.
• Load of school bag and academic burden to be decreased.
3.10.6 District Primary Education Programme (DPEP)
The District Primary Education Programme guidelines were
formulated in April 1993. Since then there have been major
developments in the evolution of DPEP. In December 1993 the Cabinet
accorded its approval for the scheme in principle. In January 1994, the
full Planning Commission approved DPEP as a centrally sponsored
scheme. District projects were prepared in 42 districts spread over the
seven states of Assam, Haryana, Madhya Pradesh, Karnataka,
Maharashtra, Tamil Nadu and Kerala. The Planning process in these
districts has been intensive and participative. The process has conflates
theory and practice and extensively drawn up organizations like
NCERT, NIEPA and IIMS. The DPEP planning processes have provided
a valuable opportunity for NCERT/NIEPA to field test many of the
pedagogical and management concepts that were developed over the

124
years. The studies conducted as part of the planning process have been
of a path breaking nature. Learning levels of over sixty thousand
students were tested as part of a baseline study with a rigorous
sampling and pedagogic design, with a view to identify area- specific
interventions in each of these districts. The Finance Committee of the
Government of India met in May 1994 and has approved details of the
DPEP proposals and its financial parameters. The DPEP was primarily
launched in November 8, 1994.
The loftiness of the objectives, the nature and intensity of the
planning process, the integration of professional inputs, participative
planning and management, and the emphasis on capacity building have
together rendered DPEP an exciting idea not only in the country but all
over the world. DPEP has broken new paths in international co-
operation, in that it belongs to the new path of the developmental co-
operation which emphasizes sustainability, equity, local ownership and
execution and is supportive of national polices in the education sector.
The DPEP is a homegrown idea in keeping with CABE guidelines and
its distinctiveness lies in diversity of sources of funding. It is a national
programme intending to achieve UEE in a contextual manner with
emphasis on participation and capacity building. Furthermore, many
functions performed by funding agencies in the past like supervision
and appraisal missions, have been vested with DPEP at the national
level. In fact DPEP seems likely to emerge as an intermediary financial,
technical and resource organization with education development in the
country. The DPEP is not an enclave project, it is a major and
multifaceted programme seeking to overhaul the primary education
system in the country.

125
The National Policy of Education, 1986 and the Programme of
Action as updated in 1992 (POA) reaffirm the national commitment to
Universalisation of Elementary Education (UEE). As indicated in NPE
the free and compulsory education of satisfactory quality should be
provided to all children upto 14 years of age before we enter the 21st
century. The NPE also specifies that UEE has three aspects, they are
Universal access and enrolment; Universal retension of children upto 14
years of age; and a substantial improvement in quality of education to
enable all children to achieve essential levels of learning.
Right from independence, India has preserved with the goal of
UEE. Even though substantial progress has been achieved the goal still
remains elusive. The additional participation in elementary education
has to come from social strata and regions which are more difficult to
reach. Therefore, the path that lies ahead in the march to UEE is more
arduous the journey ahead is a marathon calling for a higher intensity
of effort and more systematic planning and implementation.
3.11 Primary Education in Karnataka
It is universally recognized that education contributes to
economic growth and social transformation. Investment in education is
considered as the most valuable of all investments that yields high
returns to both the individuals and the society. The positive
externalities associated with education make education partly a public
good and therefore, it needs to be supplied by the State as markets may
not be able to provide it for the desired social optimum. The human
development paradigm also recognizes the role of education in
expansion of choices to lead a decent life. Therefore, Right to Education
(RTE) is recognized as one of the Fundamental human Rights and the

126
drive towards universal Primary Education is to ensure it. Karnataka
state is a fast growing economy and this growth is largely based on the
Knowledge base of the Society. The growth is phenomenal in the
secondary and tertiary sectors, where need for middle level skills are
most significant. The state has embarked on significant reforms in the
education sector with increased public investment to ensure access,
equity and quality in education. Efforts have been made under the
national policies on elementary education to develop the required
infrastructure, deployment of teachers, training, retaining, reorientation
of programmes and to enhance the enrolment at primary schools as
well as to hold the children in school for their learning through the
school education upto 8th standard etc. In this section, an attempt is
made to provide the details relating to these programmes which help
develop a profile of school education in Karnataka.
The Karnataka State is recomposed in 33 educational districts.
The thirty administrative districts of the state are grouped into four
Educational Divisions with headquarters at Bangalore, Belgaum,
Gulbarga and Mysore. Besides two divisions – Belgaum and Gulbarga
divisions are having Additional Commissionerates for effective
administration.
Table – 3.1 Administrative and educational divisions in Karnataka, 2012
Division District
Bangalore Bangalore, Bangalore (R), Ramanagar, Chitradurga, Kolar, Chikkaballapur, Shimoga, Tumkur and Davanagere. [09]
Belgaum Belgaum, Bijapur, Bangalkot, Dharwad, Gadag, Haveri, and Uttara Kannada [07]
Gulbarga Bellary, Bidar, Gulbarga, Raichur and Koppal, Yadgir [06]
Mysore Chikmagalur, Dakshina Kannada, Udipi, Hassan, Kodagu, Mandya, Mysore and Chamarajanagar [08]
Source: Sarva Shikshana Abhiyan, Annual Report 2011-12.

127
Details in table 3.1 reveal how thirty administrative districts are
brought under poor divisions for the purpose of both the revenue and
educational administrative purposes. For educational administrative
purpose there is commission rate established separately with an IAS
officers being put change of the commissionerate as commissioner.
Since the primary and secondary education are considered general
service there is IAS officer to 100 habter a division about whom there is
secretary at the state level. The commissioner is assisted by a hierarchy
of officers who are both specialists in education and the general
administrative services. The divisional district, taluk and block level
specialists as well as administrative officers are placed to render their
services to achieve the objectives of universal education as well as to
ensure the Right to Education to everyone as the need of the day.
In the following table 3.2 the details about the basic educational
units like blocks, villages/wards, village panchayats etc., are given for
the purpose of understandings of the spread and establishment of
school education in Karnataka in 2012. Whatever achievements made
to the area of activity in Karnataka in all due to the policies and
programmes of the state under the direction of the government of India
as well as efforts of its own followed over the years.

128
Table – 3.2 Basic administrative and educational units in Karnataka, 2012
Sl. No.
District No.of
Educational Blocks
No.of BRC/URC
CRC No.of Villages/
Wards No.of
Habitation No.of
Panchayaths
1 2 3 4 5 6 7 8 1 Bagalkot 6 6 126 623 1340 191 2 Bangalore (R) 4 4 90 1298 1298 98 3 Bangalore (U) 9 9 163 693 990 210 4 Belgaum 14 14 296 1495 1942 553 5 Bellary 8 8 128 543 1034 189 6 Bidar 5 5 130 717 960 176 7 Bijapur 7 7 178 823 1614 199 8 Chamarajnagar 5 5 71 464 1031 131 9 Chikkaballapura 6 6 152 1358 1799 189 10 Chikkamangalore 8 8 127 861 4514 232 11 Chitradurga 6 6 152 1358 1799 189 12 Dakshina Kannada 7 7 114 379 1734 214 13 Davangere 7 7 131 2117 1288 230 14 Dharwad 7 7 84 407 542 135 15 Gadag 6 6 84 4232 564 106

129
16 Gulbarga 8 8 168 1360 1889 385 17 Hassan 8 8 208 393 3470 288 18 Haveri 7 7 110 1747 988 209 19 Kodagu 3 3 42 1149 721 105 20 Kolar 6 6 145 1392 2783 168 21 Koppal 4 4 84 1324 789 137 22 Mandya 8 8 152 1395 2351 246 23 Mysore 9 9 176 5284 2032 235 24 Raichur 5 5 128 636 1434 164 25 Ramanagar 4 4 106 2137 2305 138 26 Shimoga 7 7 168 5284 8581 260 27 Tumkur 10 10 281 5237 4417 321 28 Udupi 5 5 79 255 2406 145 29 Uttara Kannada 11 11 182 1149 6186 219 30 Yadagiri 3 3 79 676 1134 129 Total 203 203 4134 43830 30884 6156
Source: Serva Shikshana Abhiyan, Annual Report 2011-12 Govt. of Karnataka, Bangalore, 2012

130
From the above table 3.2 we may observe that in Karnataka there
are on an average, about 6.5 educational blocks, each covering a taluka
administrative area. The Belgaum district has highest number of 14
blocks while Kodagu and Yadagiri have 3 blocks each. Proportionately
the number of CRCs are also established i.e. Belgaum has the highest
with 296, while Kodagu and Yadgiri have less number, 42 and 79,
respectively. The number of Panchayats in highest in Belgaum,
Gulbarga and Tumkur respectively. Inclusive of villages and wards
and the habitation serve the purpose of understanding the pattern in
spread of schools throughout Karnataka and in each district. The
number of habitation (village and cities) 30884 gives picture of total
number of communities of all sorts in Karnataka while villages and
wards. Considered for educational administration purpose imply about
33 percent more when compared to number of habitation. This
provides the spread pattern details of schools in Karnataka. Karnataka
like any other state has a mix of schools founded by different
authorities, agencies, trusts etc. As such in the state there are schools
started by almost all categories of such entities who have been playing
vital role in successfully establishing schools and sustaining them. The
following table 3.3 provide such schools in number owned by each
category, enrolment of students as well as the number of teachers in
place to carry out the most vital role of teaching children who would be
tomorrows citizens.

131
Table – 3.3 Statement of schools established by different authorities enrolment of students and availability
of teachers in Karnataka, 2012
Sl. No.
Details Education
Department Social welfare +
local body Aided Un-aided
Central + others
State total
1 Lower primary schools 22,599 168 228 2,951 5 25,951 2 Higher primary schools 22,601 560 2,339 8,009 95 33,604 3 Total primary schools 45,200 728 2,567 10,960 100 59,555 4 High schools 4,437 490 30335 5,521 79 13,862 5 Total schools 49,637 1,218 5,902 16,481 179 73,417 Enrolment (in Lakhs) 6 Class 1st to 7th 42.60 0.66 6.87 24.40 0.37 74.90 7 Class 8th to 10th 10.23 0.59 801 6.69 0.19 26.07 8 Total (class 1 to 10 52.83 1.25 14.97 31.36 0.56 100.97 Teachers 9 Elementary schools sanction 2,02,779 4,846 20,746 90,685 1,832 3,20,888 10 Elementary schools position 1,84,505 3,948 16,693 90,328 1,682 2,97,156 11 Secondary schools sanction 43,762 4,169 32,800 57,828 1,712 1,40,270 12 Secondary schools position 36,905 3,322 28,352 65,670 1,582 1,26,731
Source: Sarva Shikshna Abhiyan, Annual Report 2011-12, Dept. of Education, Govt. of Karnataka, Bangalore 2013.

132
The details in the above table 3.3 reveal that there are 73,417
schools all put together from the lower and higher primary and high
schools in the state. And from so many schools about one crore (100.9
lakhs) children enrolled with having 4,23,887 teachers short of about
37000 teachers strength sanctioned looking into the need and
availability of resources mainly financial. This only should affect the
quality of teaching and learning as the existing teachers should bear the
brunt of over workload to miss the quality in the service they provide.
Students cannot be given due attention by the short supplied teachers
strength in terms of their academic and co-academic activities.
The school is an important and integral part of learning. If school
can provide what children expect for their need, there is no reason as to
why the child should stay away from school. With school providing the
basic facilities of quality, the enrolment would increase and the literary
in course of time will reach up to 100 percent. The deails in the
following table 3.4 provide the details about the extent of basic facilities
in schools in Karnataka and also the access levels and literacy rate and
drop out pictured in Karnataka.

133
Table –3.4 Statement of basic facilities in schools, access indicators out of school children and literacy rate in Karnataka, 2012
Sl. No Facility Elementary
Schools High
Schools
Infrastructure Indicators (%)
1 Common toilets 97.91 88.87
2 Girls’ Toilets 98.91 93.01
3 Electricity 95.49 82.69
4 Play Ground 54.34 75.01
5 Ramps 78.27 38.18
6 Library 98.66 94.05
7 Compound Wall 69.21 62.02
8 Drinking Water 99.55 97.86
Composite Index 86.53 78.96
Access Indicators (%)
Sl. No. Indicator Primary Upper Primary
9 Access Ratio 100.00 100.00
10 Gross Enrolment Ratios (GER) 107.46 105.16
11 Net Enrolment Rations (NER) 99.21 96.95
12 Drop-out Rates of Children 1.19 4.35
Out of School Children
13 Out-of School Children (7 to 14 years)
Total 68301
Never Enrolled 45462
Drop-out 22839
Literacy Rates 2011 Census
14 Literacy Rate
Total 75.60
Male 82.80
Female 68.10 Source: Dept. of Education, Govt. of Karnataka 2012; and India Census, 2011.
134
The details in above table 3.4 reveal the extent of basic facilities
available in schools in Karnataka. Though the infrastructure indicators
in terms of the success achieved as shown by percentages, the reality
need to be checked in the ground as still there are thousands of schools
which suffer basic facilities. But the quality and completeness of these
facilities would always be in question. Similarly the access levels to the
children in communities. It is against to find from the details in table
3.4 that there were 68301 children out of school in Karnataka in 2011
despite the efforts of so much followed by the state agencies. Also the
illiteracy rate to the time of 25 percent in general and about 13 and 38
percent in case of men and women respectively, in the state is
disheartening as we have 100 percent state Kerala by the side and also
so much of advancement the state has achieved for itself.
3.11.1 A Brief Profile of Schools in Karnataka
School is the fundamental and a foundational unit of an
educational system. Number of schools is indicative of the size of a
system. There are 73417 schools in the State of which 25951 are lower
primary, 33604 are higher primary and 13862 are high schools. The ratio
between lower and higher primary schools is 1: 1.29; like-wise, the ratio
between higher primary and high schools is 2.42:1. It is desirable were
to know as to want in the nature of school in terms of their management
status, instruction medium, location, gender composition, etc. In this
section an attempt is made to provide the details which depict these
aspects of school in Karnataka. The schools may be classified for the
present purpose as follows:
• Management — Wise
• Standards of Instruction Covered (LPS / HPS / High Schools)
• Region (Rural / Urban)

135
• As per Medium of Instruction
• Sex - Wise (Girls only / Boys only / Co-Education).
Based on above classification, the schools in Karnataka are found
as the details in the following table 3.5 reveal.
Table – 3.5 Statement showing number of schools by their management in Karnataka, 2012
Sl. No. Details Education
dept
Social welfare + Local body
Aided Un-aided
Central +
others
State total
1 Lower primary school
22,599 (87.08)
168 (0.68)
228 (0.88)
2,951 (11.37)
5 (0.02)
25,951 (100)
2 Higher primary schools
22,601 (67.26)
560 (1.67)
2,339 (6.96)
8,009 (23.83)
95 (0.28)
33,614 (100)
3 Total primary schools
45,200 (75.90)
728 (1.22)
2,567 (4.31)
10,960 (18.40)
100 (0.17)
59,555 (100)
4 High schools
4,437 (32.01)
490 (3.53)
3,335 (24.06)
5,521 (39.83)
79 (0.57)
13,862 (100)
5 Total schools
49,637 (67.61)
1,218 (1.66)
5,902 (8.04)
16,481 (22.45)
179 (0.24)
73,417 (100)
Source: Sarva Shiksha Abhiyan, Annual Report 2011-12, Education Dept. Govt. of Karnataka, 2012. Note: Figures in paranthesis are percentages. The details in the above table 3.5 reveal that the government of
Karnataka through its department of education has got the highest
(67.61%). Share of schools established across the state followed by the
privately owned schools which account for 30.49 percent constituting
almost one-third of the total number of schools in the state. The public
private partnership in school education in Karnataka is quite exemplary
and perhaps model in the country. Where state fails, the individuals
through registered associations, trusts or societies have established

136
schools to render this most valuable service to the people across
communities in the state.
As we have noticed there are schools in the State which run by 17
types of Managements. Some of the prominent types are: Department of
Education; Department of Social Welfare; Local Self — Government
Institutions; Private Aided; Private Un-Aided and Others [Jawahar
Navodaya, Central, Sainik, NRI, Madarasas, Arabic, etc; are included
here].
It is needless to mention here that the schools run by the
Department of Education, Department of Social Welfare and by the
Local Self Government Institutions are classified as Government
Schools.
Karnataka is quite diverse a state in all sense in which we can
find it as. In this background of understanding we need to know how
these schools are spread out in term of their vocational arrangement
across the divisional areas in the state. There is a feeling that the south
Karnataka covered under the rule of erstwhile Maharaja of Mysore in
better developed which is due to advancement in education which
should reveal the fact that it has major share in schools located in these
regional and sub-regional areas under Bangalore and Mysore divisions
as the details in the following table 3.6 reveal.

137
Table – 3.6 Statement showing the distribution of schools over the divisions in Karnataka, 2012
Sl. No.
School category
Lower primary schools
Upper primary schools
Secondary schools
Total (elementary +secondary)
No. % No. % No. % No. % 1 2 3 4 5 6 7 8 9 10
Bangalore division 1 Education
dept. 9,185 91.68 6,617 58.65 1,184 22.75 16,986 64.08
2 SW+LB 48 0.48 146 1.29 153 2.94 347 1.31 3 Aided 66 0.66 798 7.07 1,227 23.57 2,091 7.89 4 Un-Aided 717 7.15 3,680 32.62 2,611 20.16 1,008 26.44 5 Other and
Central 2 0.02 42 0.37 30 0.58 74 0.28
6 Sub-total 10,018 100 11,283 100 5,205 100 26,506 100 7 % to the
total schools in state
38.60 33.58 37.55 36.10
Belgaum division 8 Education
dept. 4,734 82.10 6,413 76.15 1,046 33.09 12,193 70.28
9 SW+LB 38 0.33 126 1.50 120 3.80 284 1.64 10 Aided 72 1.25 446 5.30 1,097 34.70 1,615 9.31 11 Un-Aided 921 15.97 1,414 16.79 878 27.78 3,213 18.52 12 Other and
Central 1 0.02 23 0.27 20 0.63 44 0.25
13 Sub-total 5,766 100 8,422 100 3,161 100 71,349 100 14 % to the
total schools in state
22.22 22.80 23.63
Gulbarga 15 Education
dept. 3,437 77.99 4,398 68.88 1,020 42.41 8,855 67.10
16 SW+LB 24 0.54 118 1.85 98 4.07 240 1.82 17 Aided 37 0.84 433 6.78 338 14.05 808 6.12 18 Un-Aided 907 20.58 1,425 22.32 938 39.00 3,270 24.78 19 Other and
Central 2 0.05 11 0.17 11 0.46 24 0.18
20 Sub-total 4,407 100 6,385 100 2,405 100 13,197 100 21 % to the
total schools in state
16.98 19.00 17.35 17.98

138
Mysore division 22 Education
dept. 5,243 91.02 5,173 68.84 1,187 38.40 11,603 70.90
23 SW+LB 58 1.01 170 2.26 119 3.85 347 2.12 24 Aided 053 0.92 662 8.81 673 21.77 1,388 8.48 25 Un-Aided 406 7.05 1,490 19.83 1,094 35.39 2,990 18.27 26 Other and
Central 0 0.00 19 0.25 18 0.58 37 0.23
27 Sub-total 5,760 100 7,514 100 3,091 100 16,365 100 28 % to the
total schools in state
22.20 22.36 22.30 22.29
Total 25,951 100 33,604 100 13,862 100 73,417 100 Source: Sarva Shiksha Abhiyan, Annual Report 2011-12, Education Dept. Govt. of Karnataka, 2012. The details in the table 3.5 and 3.6 show that More than 4 out of
every 5 elementary schools in the State are either run by the
Government or supported by the Government. Nearly 9 out of 10 lower
primary schools are managed by the Government. It is only at the high
schools level that private participation is considerable. Still it is
observed that nearly 3 out of 5 high schools are either managed or
supported by the Government. Further it is highlighted in the details in
table 3.6 that Schools of the DOE are relatively in higher proportion in
Bangalore & Mysore divisions at the LPS stage. This proportion is quite
high in Belgaum division at HPS stage. Highest proportion of DOE high
schools are in Gulbarga division. Proportion of private Unaided schools
are 26.44, 24.78, 18.27 and 18.52 percent respectively in Bangalore,
Gulbarga, Mysore and Belgaum divisions. Lowest proportions of aided
schools are in Gulbarga division low proportion of private institutive in
primary education in Belgaum and Gulbarga division is due to lack of
economic growth unlike in Bangalore and Mysore divisions. Economic
growth sponsors educational exhibit and also establish this universal
truth. The distribution of the schools over a given area is an important
139
thing to be noted as it has its own implication to the enrolment and
sustained attendance by the children. There is a problem as far as
school education in rural area is concerned. In the town and cities there
may not be any problem as the schools are prepared to be opened in
them either by the government or by private management. Villages are
last prepared as the returns from establishing a school are not positively
viewed. This has its influence on decision made about location of
school. In this background we need to know in rural and urban
contexts and also who have started which school where. The details
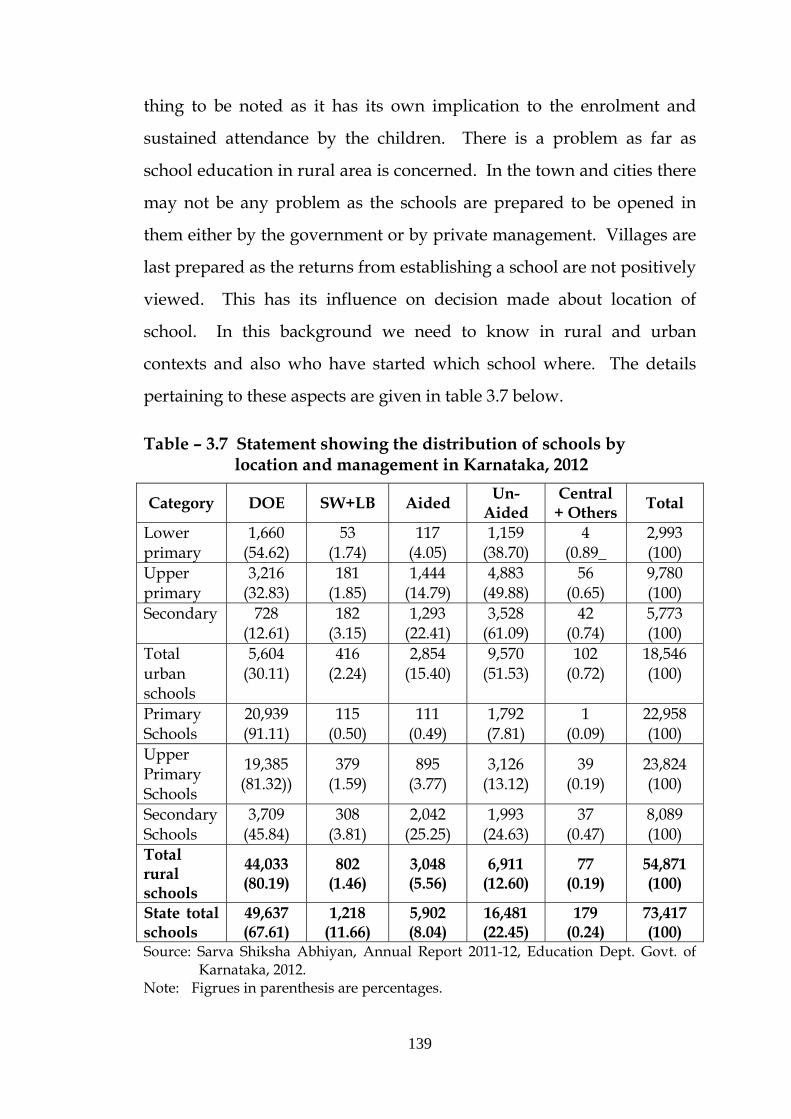
pertaining to these aspects are given in table 3.7 below.
Table – 3.7 Statement showing the distribution of schools by location and management in Karnataka, 2012
Category DOE SW+LB Aided Un-Aided
Central + Others Total
Lower primary
1,660 (54.62)
53 (1.74)
117 (4.05)
1,159 (38.70)
4 (0.89_
2,993 (100)
Upper primary
3,216 (32.83)
181 (1.85)
1,444 (14.79)
4,883 (49.88)
56 (0.65)
9,780 (100)
Secondary 728 (12.61)
182 (3.15)
1,293 (22.41)
3,528 (61.09)
42 (0.74)
5,773 (100)
Total urban schools
5,604 (30.11)
416 (2.24)
2,854 (15.40)
9,570 (51.53)
102 (0.72)
18,546 (100)
Primary Schools
20,939 (91.11)
115 (0.50)
111 (0.49)
1,792 (7.81)
1 (0.09)
22,958 (100)
Upper Primary Schools
19,385 (81.32))
379 (1.59)
895 (3.77)
3,126 (13.12)
39 (0.19)
23,824 (100)
Secondary Schools
3,709 (45.84)
308 (3.81)
2,042 (25.25)
1,993 (24.63)
37 (0.47)
8,089 (100)
Total rural schools
44,033 (80.19)
802 (1.46)
3,048 (5.56)
6,911 (12.60)
77 (0.19)
54,871 (100)
State total schools
49,637 (67.61)
1,218 (11.66)
5,902 (8.04)
16,481 (22.45)
179 (0.24)
73,417 (100)
Source: Sarva Shiksha Abhiyan, Annual Report 2011-12, Education Dept. Govt. of Karnataka, 2012. Note: Figrues in parenthesis are percentages.

140
The details in the table 3.7 above show that the proportions of
schools in rural and urban areas out of the total number of schools of all
managements in the State are 74.74 and 25.26 percent, respectively.
There is a marginal gain of 0.31 percent schools from rural to urban
areas during the year 2011, 2012. We have already seen in comparison
the availability of facilities for lower primary, higher primary and
secondary education which reveals that their proportion in rural areas
is 88.47, 70.90 and 58.35 percent respectively. This indicates that there is
a greater need for secondary schools in rural areas.
The details in table 3.7 further reveal that there are 18546 schools
in urban areas of which 12773 and 5773 are elementary and high schools
respectively. About 38 percent of elementary schools in urban areas
belong to the Department of Education while the proportion of aided
schools is 12.22 percent. Nearly 48 percent of schools are constituted by
un-aided and other category schools. In case of high schools,
proportions of schools in urban areas that belong to Department of
Education, Aided and Un-Aided and other categories are 12.61, 22.41
and 61.09 respectively. It is noted that while a high proportion of
elementary schools are located in urban areas by the department of
education, a high proportion of high schools in urban areas are located
by private un-aided managements.
Further it is observed from table 3.7 that while the figure of total
schools in urban areas was 8185 during 2010-11, the corresponding
figure for 2011-12 is 8546. The increase in urban areas between the years
2010-11 and 2011-12 is 361 schools, which works out to be 2 percent. It is
noted that the increase of 230 schools, is accounted by 1.83 percent at
the elementary level and 2.32 percent (131), at the secondary school
level.

141
The table 3.7 depicts that there are 54871 schools located in rural
areas, of which 46782 are elementary schools and 8089 are high schools.
Over 86 percent of total number of elementary schools in rural areas
belongs to the Department of Education, while private aided and
private un-aided schools constitute 2.15 and 10.51 percent respectively.
In case of high schools 45.84 percent of such schools are located in rural
areas belong to the Department of Education while the proportions for
aided and unaided managements are 25.25 and 24.63, respectively. It is
to be noted that a great majority of schools in rural areas, especially the
elementary schools, are managed by the Department of Education.
Further the table 3.7 reveal that the proportion of rural schools
run by the Department of Education in the State is 87.26 (All level
schools) percent, it goes up to 92.19 percent in case of rural lower
primary schools. The participation of private players both in regard to
aided and unaided managements is quite low in rural areas. It is
marginally visible only in case of high schools which are normally
located in big villages. It is clear that commercial designs overweigh
concerns of rural educational development among private players.
3.11.2 Medium of Instruction
There has all the while been emphasis on the language used for
instruction in the class room. The translation of basic information and
knowledge need to be done in the language known and spoken by the
pupils at home as well as in the community and neighbourhood. So
that they can easily understand and grasp it. In order to do this, time
and again there has been emphasis on this by the state as well as the
intelligentia. Karnataka being Kannada state obviously there is more

142
likelihood of opting for Kannada instruction than other language as
details in table 3.8.
Table – 3.8 Statement showing distribution of schools by medium of instructions in Karnataka, 2011 Category Kannada English Urdu Tamil Telugu Marathi Hindi Total Lower
primary
23,120
(88.63)
247
(0.95)
2,292
(8.79)
35
(0.13)
33
(0.13)
347
(1.33)
11
(0.04)
26,085
(100)
Upper
primary
27,546
(76.53)
5,135
(14.27)
2,411
(6.70)
109
(0.30)
52
(0.14)
701
(1.95)
42
(0.12)
35,996
(100)
Secondary 10,151
(65.39)
4,492
(28.94)
530
(3.41)
8
(0.05)
14
(0.09)
283
(1.82)
45
(0.29)
15,523
(100)
Total 60,817
(78.37)
9,874
(12.72)
5,233
(6.74)
152
(0.20)
99
(0.13)
1,331
(0.72)
98
(0.13)
77,604
(100)
Source: Sarva Shikshana Abhiyan, Govt. of Karnataka, Bangalore, 2012. Note: (1) Medium wise schools are more than the total number of schools because one school may be having multiple medium of instruction to different sections of children admitted. This is more pronounced in the border area schools in the state. (2) Figures in parenthesis are percentages.
From the details in the table 3.8 above we may learn that majority
of students are pursuing their studies in schools which have adopted
Kannada, English, Urdu, Marathi, Telugu, and Tamil as Medium of
Instruction. Information about number of schools by the Medium of
Instruction adopted by them is given in the table showing that the all
schools by Medium will not tally with total Schools in the State at LPS,
HPS and HS, as one school will get counted under different Medium.
For instance, A school with Kannada and Marathi medium sections will
get counted under two columns, one for Kannada and the other for
Marathi. English Medium schools (sections) are increasing. The figure
was 4467 in 2007-08 which increased to 9874 in 2011-12.Tamil and
Telugu sections schools in border areas like Kolar, Bangalore,
Chickkaballapur, Bellary are decreasing. Perhaps, they have shifted to

143
English medium. This is true of Hindi medium sections schools also in
different parts of the state.
The details show that about 78 percent of schools are of Kannada
medium, about 12.72 schools are of English medium while hardly 0.13
percent of schools are Hindi and Telugu medium institutions catering
to the lingual needs of children mostly in border areas of the state.
An attempt is made here to view the schools in Karnataka from
gender dimension i.e. as to how many schools are for boys and girls
exclusively and the schools in which both boys and girls are admitted
i.e., co-education schools. The details available indicate majority of the
schools (71,136) are co-education schools, while only 735 schools were
exclusively for boys. The rest (1,546) were for only girls. But in
practice, in the government owned higher primary schools for boys in
rural areas, where there is no other school in existence, the girls are also
taken in leading to some kind of confusion in the numbers given. This
kind of contingency approach is need of the day and found most
functional and utilization.
From the figures given above, the percentages are worked out
which show that 96.89 percent of schools in the State practice co-
education. Single sex schools are hardly 3.11 percent in proportion of
which 2.17 percent are girl’s only schools. This practice of co-education
is popular in both rural and urban areas.
3.11.3 Enrolments in Schools in Karnataka
Total Enrolments, Gross Enrolment Ratios, Net Enrolment Ratios,
Number and proportion of children who leave the school mid-way,
Repetition Rate, and Enrolments by sex, Social category, School grades,
144
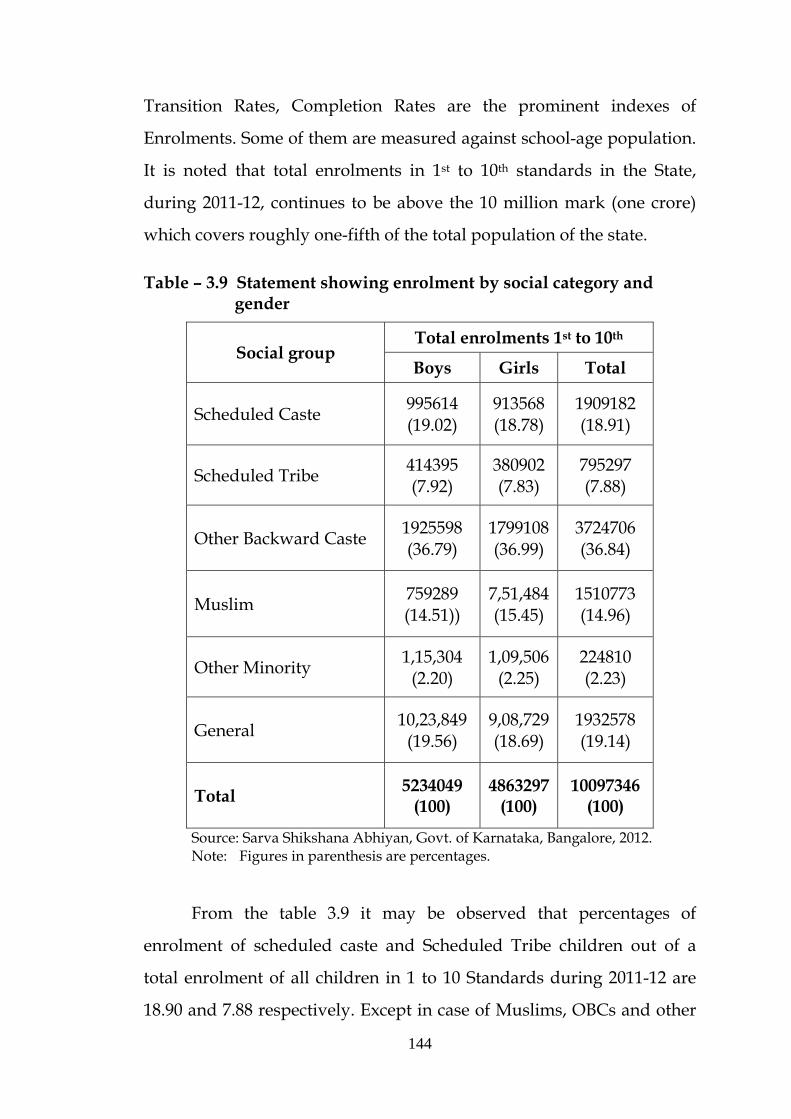
Transition Rates, Completion Rates are the prominent indexes of
Enrolments. Some of them are measured against school-age population.
It is noted that total enrolments in 1st to 10th standards in the State,
during 2011-12, continues to be above the 10 million mark (one crore)
which covers roughly one-fifth of the total population of the state.
Table – 3.9 Statement showing enrolment by social category and gender
Social group Total enrolments 1st to 10th
Boys Girls Total
Scheduled Caste 995614 (19.02)
913568 (18.78)
1909182 (18.91)
Scheduled Tribe 414395 (7.92)
380902 (7.83)
795297 (7.88)
Other Backward Caste 1925598 (36.79)
1799108 (36.99)
3724706 (36.84)
Muslim 759289 (14.51))
7,51,484 (15.45)
1510773 (14.96)
Other Minority 1,15,304 (2.20)
1,09,506 (2.25)
224810 (2.23)
General 10,23,849 (19.56)
9,08,729 (18.69)
1932578 (19.14)
Total 5234049 (100)
4863297 (100)
10097346 (100)
Source: Sarva Shikshana Abhiyan, Govt. of Karnataka, Bangalore, 2012. Note: Figures in parenthesis are percentages.
From the table 3.9 it may be observed that percentages of
enrolment of scheduled caste and Scheduled Tribe children out of a
total enrolment of all children in 1 to 10 Standards during 2011-12 are
18.90 and 7.88 respectively. Except in case of Muslims, OBCs and other

145
Minorities proportion of boys in 1 to 10 classes out of total boys in 1 to
10 classes is higher than that of girls. Further it may be attempted here
to find out the class wise enrolment in percentages for all classes from
1st to 10th standards and at different levels to the total enrolment of boys
and girls in Karnataka in 2012.
Table – 3.10 Statement showing the class wise enrolment in percentages to total enrolment in 2012
Class Enrolment in Lakh Percentage
to the total enrolment Boys Girls Total
(1) (2) (3) (4) (5) 1st std 5.86 5.33 11.19 11.09 2nd std 5.61 5.22 10.82 10.72 3rd std 5.44 5.09 10.53 10.43 4th std 5.51 5.17 10.68 10.58 5th std 5.65 5.27 10.91 10.81 6th std 5.44 5.06 10.50 10.40 7th std 5.28 4.97 10.25 10.15 8th std 4.87 4.44 9.31 9.22 9th std 4.67 4.27 8.94 8.86 10th std 4.01 3.81 7.82 7.74 Total 52.34 48.63 100.97 100.00 1st to 5th std. 28.07 26.08 54.15 53.62 6th to 7th std 10.72 10.04 20.75 20.55 6th to 8th std 15.59 14.48 30.07 29.78 1st to 7th std 38.79 36.11 74.90 74.18 1st to 8th std 43.66 40.56 84.21 83.40 8th to 10th std 13.55 12.52 26.07 25.82 1st to 10th std 52.34 48.63 100.97 1,00,97,346 Source: Sarva Shikshana Abhiyan, Govt. of Karnataka, Bangalore, 2012.
The details in the above table 3.10 show that there are 100.97
lakhs children in 1st to 10th standards in the State. Of this total, 54.15
lakhs chil
7th standa
the high
types of s
by the ba
enrolmen
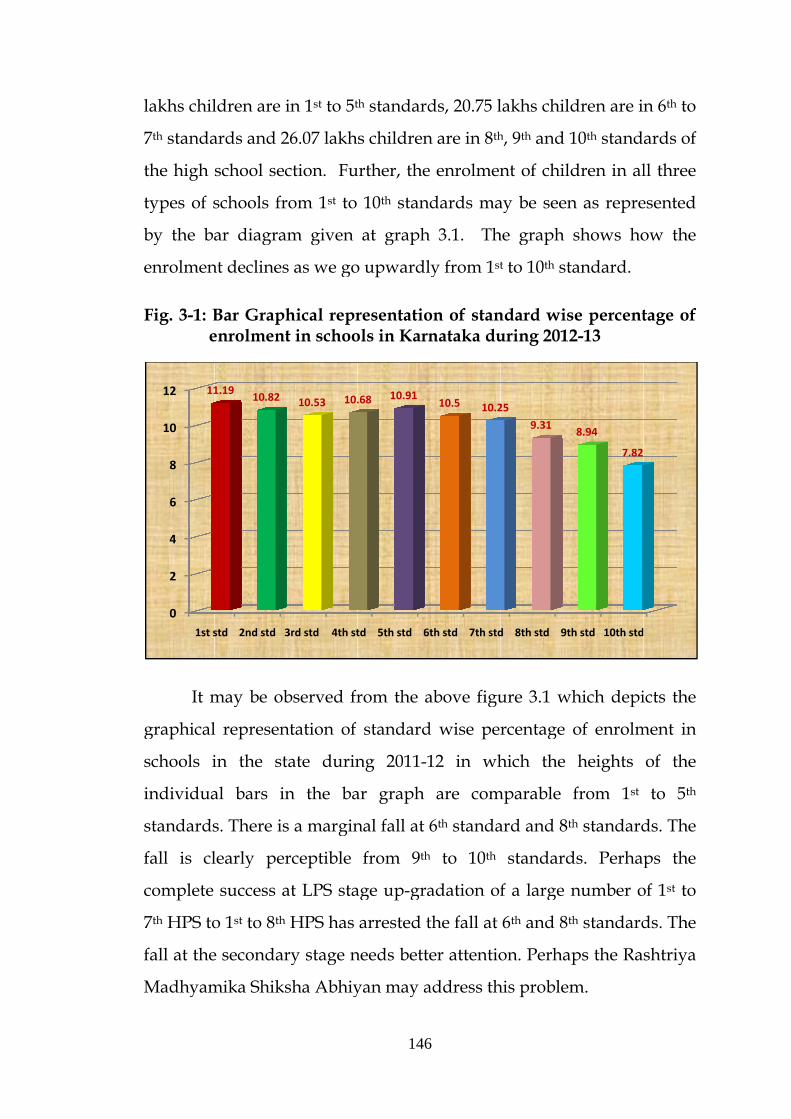
Fig. 3-1: B e
It m
graphical
schools i
individua
standards
fall is cl
complete
7th HPS to
fall at the
Madhyam
0
2
4
6
8
10
12
1st s
11
ldren are i
ards and 2
school sec
schools fr
ar diagra
nt declines
Bar Graphenrolment
may be ob
l represen
in the st
al bars in
s. There is
learly per
success a
o 1st to 8th
e secondar
mika Shiks
std 2nd std 3
1.1910.82
in 1st to 5t
26.07 lakh
ction. Fu
rom 1st to
am given
s as we go
hical reprt in schoo
bserved fr
ntation of
tate durin
n the ba
s a margin
rceptible
at LPS sta
HPS has
ry stage n
sha Abhiy
3rd std 4th st
10.53 10.
146
th standard
s children
urther, the
10th stan
at graph
o upwardl
resentatiools in Karn
rom the a
standard
ng 2011-1
ar graph
nal fall at
from 9th
age up-gra
arrested t
needs bett
yan may a
td 5th std 6
.68 10.91
6
ds, 20.75 l
n are in 8th
e enrolmen
dards ma
h 3.1. Th
ly from 1st
on of stannataka du
above figu
d wise per
12 in wh
are com
6th standah to 10th
adation of
the fall at
er attentio
address th
th std 7th std
10.5 10.2
lakhs childh, 9th and 1
nt of child
ay be seen
he graph t to 10th st
ndard wisuring 2012
ure 3.1 wh
rcentage
hich the
mparable
ard and 8th
standard
f a large n
6th and 8th
on. Perhap
his problem
d 8th std 9th
25
9.31
dren are i
10th stand
dren in al
n as repre
shows ho
andard.
se percent2-13
hich depi
of enrolm
heights
from 1st h standard
ds. Perha
number oh standard
ps the Ra
m.
h std 10th std
8.94
7.82
n 6th to
ards of
ll three
esented
ow the
tage of
icts the
ment in
of the
to 5th
ds. The
ps the
of 1st to
ds. The
shtriya

147
Further, the enrolment of students is seen by medium of
instruction in schools in the state. Kannada in undoubtedly a
prominent number of students opting to enter schools as 74.16 percent
of the enrolment registered in 2011-12 as the details in table 3.11 reveal.
Table 3.11 reveals that in 12.72 percent of schools 18.08 percent of
children are studying through the English Medium. As per population
census, proportion of people whose mother tongue is English is far
below this percentage. Hence it is understood that either children
whose mother – tongue is not Kannada and at the same time facility for
schooling in their mother – tongue is not available at their place of stay
or others who do not prefer to pursue their studies in their mother
tongue may opt for English as Medium of Instruction.
Table – 3.11 Statement showing distribution of enrolment by medium of instruction in schools in Karnataka, 2011-12 Category Kannada English Urdu Tamil Telugu Marathi Hindi Total
Lower primary (Class 1-5)
4180152 (77.20)
795518 (14.69)
339317 (6.27)
3944 (0.17)
4656 (0.09)
78947 (1.46)
6808 (0.13)
5414542 (100)
Upper primary (class 6-7)
1504351 (72.48)
416102 (20.05)
112572 (5.42)
4791 (0.23)
1530 (0.07)
33750 (1.63)
2402 (0.12)
2075498 (100)
Secondary (Class810)
1854907 (71.14)
614157 (23.56)
75650 (3.25)
903 (0.03)
834 (0.03)
48390 (1.86)
3475 (0.13)
2607306 (100)
Total 75,39,410 (74.67)
18,25,777 (18.08)
5,36,529 (5.31)
14,838 (0.15)
7,020 (0.07)
1,61,087 (1.60)
12,685 (0.13)
1,00,97,346 (100)
Source: Govt. of Karnataka, Dept. of Education, Bangalore, 2012. Note: Figures in paranthesis are percentages
The state level figures and percentages of enrolment of students
in schools in Karnataka do not provide us as to how these figures are
spread out throughout the state. In order to realize this we need to look
into the details for district wise enrolment of children in different levels
of schooling during 2011-12. The details are presented in table 3.12.

148
Table – 3.12 Statement showing district wise enrolment of children at different levels of schooling in Karnataka,
2011-12
District
Class 1-5 Class 1-7 Class 1-8 Class 8-10 Class 1-10
Enrolment % to state total
Enrolment % to state total
Enrolment % to state total
Enrolment % to state total
Enrolment % to state total
1 2 3 4 5 6 7 8 9 10 11 Bagalkot 204998 3.79 277070 3.70 306554 3.64 81631 3.13 358701 3.55 Bangalore (R) 73524 1.35 103715 1.38 118268 1.40 41591 1.60 145306 1.44 Bangalore (N) 292695 5.41 405894 5.42 458986 5.45 149727 5.74 555621 5.50 Bangalore (S) 419118 7.74 571466 7.63 642376 7.63 200632 7.69 772098 7.65 Belgaum 195251 3.61 273567 3.65 309680 3.68 102436 3.93 375703 3.72 Belgaum Chikkodi 254471 4.70 350074 4.67 393904 4.68 122355 4.69 472429 4.68 Bellary 250452 4.63 335725 4.48 370560 4.40 91791 3.52 427516 4.23 Bidar 229493 4.24 307373 4.10 337956 4.01 81128 3.11 388501 3.85 Bijapur 278951 5.15 369480 4.93 405322 4.81 99223 3.81 468703 4.64 Chamarajanagar 71797 1.33 102831 1.37 116977 1.39 38251 1.47 141082 1.40 Chikkaballapur 101607 1.88 143895 1.92 164481 1.95 57668 2.21 201563 2.00 Chikkamangalore 81044 1.50 117433 1.57 135843 1.61 51693 1.98 169126 1.67 Chitradurga 138171 2.55 196409 2.62 222635 2.64 74696 2.86 271105 2.68 Dakshina Kannada 162308 3.00 234418 3.13 269303 3.20 103114 3.95 337532 3.34 Davanagere 176173 3.25 245794 3.28 275493 3.27 85561 3.28 331355 3.28 Dharwad 171584 3.17 241179 3.22 272449 3.25 88337 3.39 329516 3.26 Gadag 101368 1.87 140807 1.88 157693 1.87 48793 1.87 189600 1.88
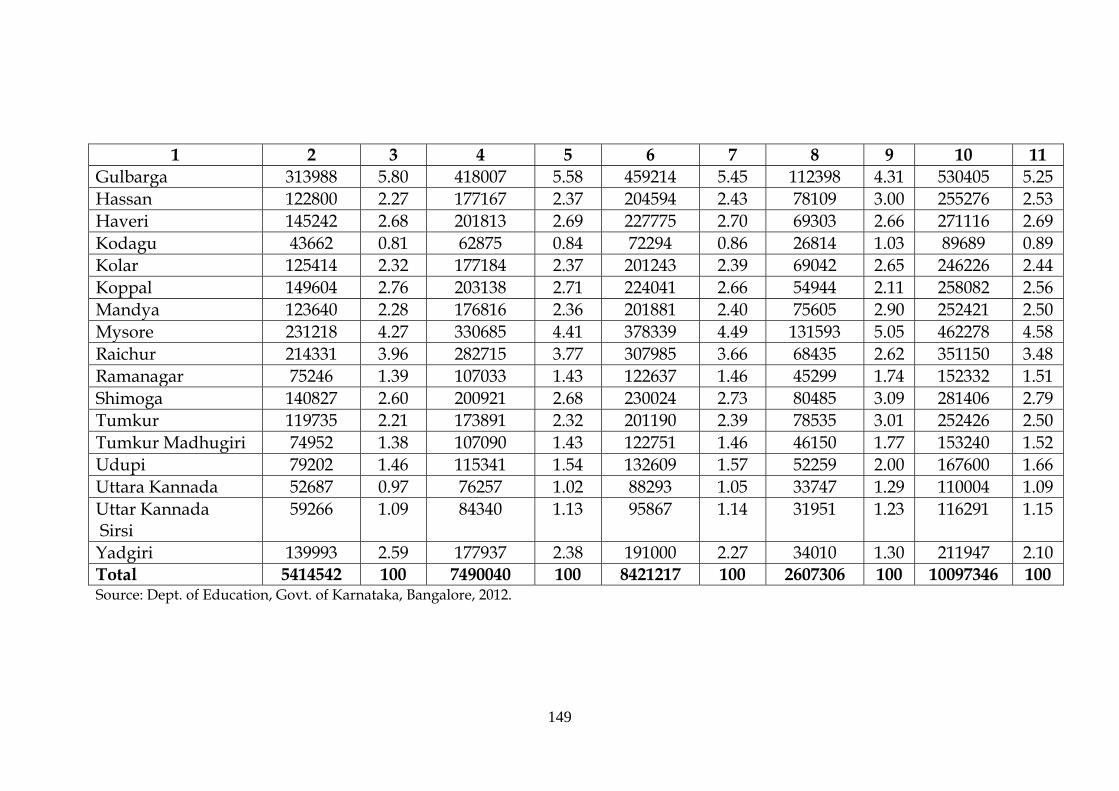
149
1 2 3 4 5 6 7 8 9 10 11 Gulbarga 313988 5.80 418007 5.58 459214 5.45 112398 4.31 530405 5.25 Hassan 122800 2.27 177167 2.37 204594 2.43 78109 3.00 255276 2.53 Haveri 145242 2.68 201813 2.69 227775 2.70 69303 2.66 271116 2.69 Kodagu 43662 0.81 62875 0.84 72294 0.86 26814 1.03 89689 0.89 Kolar 125414 2.32 177184 2.37 201243 2.39 69042 2.65 246226 2.44 Koppal 149604 2.76 203138 2.71 224041 2.66 54944 2.11 258082 2.56 Mandya 123640 2.28 176816 2.36 201881 2.40 75605 2.90 252421 2.50 Mysore 231218 4.27 330685 4.41 378339 4.49 131593 5.05 462278 4.58 Raichur 214331 3.96 282715 3.77 307985 3.66 68435 2.62 351150 3.48 Ramanagar 75246 1.39 107033 1.43 122637 1.46 45299 1.74 152332 1.51 Shimoga 140827 2.60 200921 2.68 230024 2.73 80485 3.09 281406 2.79 Tumkur 119735 2.21 173891 2.32 201190 2.39 78535 3.01 252426 2.50 Tumkur Madhugiri 74952 1.38 107090 1.43 122751 1.46 46150 1.77 153240 1.52 Udupi 79202 1.46 115341 1.54 132609 1.57 52259 2.00 167600 1.66 Uttara Kannada 52687 0.97 76257 1.02 88293 1.05 33747 1.29 110004 1.09 Uttar Kannada Sirsi
59266 1.09 84340 1.13 95867 1.14 31951 1.23 116291 1.15
Yadgiri 139993 2.59 177937 2.38 191000 2.27 34010 1.30 211947 2.10 Total 5414542 100 7490040 100 8421217 100 2607306 100 10097346 100 Source: Dept. of Education, Govt. of Karnataka, Bangalore, 2012.

150
From the above table 3.12 we may find that the enrolment in
schools is quite varying from one region to another. Certain districts
have recorded less than 2% of the total enrolment at different levels of
school in the state. Bangalore rural, Chikkamangalore, Gadag,
Ramnagar, Udupi, Uttara Kannada, Chamarajnagar, Tumkur are such
district areas having recorded less than 2% of the total enrolment.
In 22 districts enrolment in class 1 to 10 have experienced
decreases during 2011-12 as compared to their proportion in state total
during 2010-11. In 12 Districts namely Bagalkot, Bangalore Rural,
Bangalore Urban North, Bangalore Urban South, Belgaum, Chikkodi,
Bellary, Chikkaballapura, Gadag, gulbarga, Raichur, Yadgir, Mysore
where the enrolment is quite above that of 2% what certain districts
could not achieve it. On the whole, the enrolment size from class to
class as we move from 1st to 10th standard. It helps decreasing
perceptibly implying sustenance of the same spirit of enrolment
throughout from 1st standard till last. This is other words indicate that
the dropout numbers increase in the increasing order of schooling from
2nd onwards.
The details in the table 3.12 further reveal that there are 08 out of
34 educational districts in the State which belong to North Eastern
Karnataka and identified as backward districts. About 31.96 percent of
enrolments in the State are in these 08 districts. Percentage share of
districts is comparable across districts for 1 to 5 and 1 to 7 enrolments.
When 1 to 8 enrolments and 1 to 10 enrolments are considered, the
relative positions of districts receive a juggling. Enrolments at 8th
standard and beyond that stage make a perceptible difference.

151
Drop out from school as a phenomenon is considered to be
largely socio-economic and culture in origin. That is, children from
poverty ridden lower caste and having had no culture of formal
learning in the family are normally the victims in the sense they lose out
themselves from the main streaming process. However, it is important
to know who and at what level drop out from school education in
Karnataka in 2011-12. It is found that incidence drop out at primary
level education is kept to very minimum. While at higher primary level
is very high as details in the following table 3.13 reveal.
Table – 3.13 Statement of drop-out rates in State, 2011-12
Category Lower Primary Higher Primary (in %)
All Children 1.19 4.35
Boys (All) 1.21 1.08
Girls (All) 1.17 4.64
SC (All) 0.55 4.56
SC (Boys) 0.38 4.21
SC (Girls) 0.74 4.94
ST (All) 0.36 6.13
ST (Boys) 0.30 5.57
ST (Girls) 0.43 6.75
Source: Govt. of Karnataka, Annual Report of the SSA.2011-12 The details in the above table 3.13 depicts that the Drop-out rates
in the State have nose-dived to 1.19 percent at LPS stage and 4.35
percent at HPS stage. Drop-out rates at LPS of ST children are very
much lower the than State average while that of SC’s which is slightly
higher. The ST’s are focused social groups in terms of their location
while SC’s are part of general population. Highest drop-out rate in the

152
system is among SC girls, which is also marginal in magnitude. This
needs to be brought down to zero, within a time frame, which is
possible to be achieving by the state.
As has already been noticed the drop-out rate at HPS stage is
considerable that is, it is at 4.35 percent. Compared to previous years it
is low and falling. Trend is positive while concern is deep. Drop-out
rates only among boys in general and SC boys are lower than state
average. In all other cases dropout rate values are higher than state
average.
For the calculation of drop-out rates, the government follows
Average Annual Drop-out Method. But alternatively MHRD follows
Simple Cohort Method (Primary Cycle and upper primary cycle).
Methodology adopted in both the calculation process are given below:
1. Average Annual Drop-out: Drop outs are estimated or calculated
across two consecutive years. That is, for example, numbers of
children in 1st to 7th standards in 2010-11 minus number of
children in 2nd to 8th standards in 2011-12 divided by number of
children in to 7th standards in 2010-11. One hundred minus of this
figure is drop-out Rate. Drop-out rates in Karnataka, using this
method are given in the following table.
2. Simple Cohort Method: Drop-out rate at elementary stage, 1st to
8th standards, is calculated by dividing number of children who
completed 8th in 2010-11 minus number of children who joined
standard in 2003-04 and divided by number of children who
joined 1st standard in 2003-04. One hundred minus of this figure
is Drop-out rate. This method is adopted by the SES/MHRD as a
residue of grade completion.

153
Year SES/MHRD Annual Diff.
DISE/SSA
Primary Upper Primary
2002-03 48.46 -- -- --
2005-06 44.83 -- -- --
2006-07 38.79 3.96 -- --
2007-08 33.89 5.10 -- --
2008-09 30.20 6.31 10.10 14.60
2009-10 25.86 5.66 5.80 9.30
2010-11 -- -- 2.96 7.08
2011-12 -- -- 1.19 4.35 Source: Dept. of Education, Govt. of Karnataka, Annual Report, 2011-12.
Assumption: With the given trends, by beginning of 2012-13 drop-out
rate as per MHRD method and estimate, is placed at around 8 percent.
Prediction: Target for 2017 will, in all definiteness [not probability] be
zero, either by MHRD or by state/SSA/DISE method. It will be Zero
for both boys and girls. This is only an hypothetical projection which
may turn into a reality or not. Since the drop out is dependent variable,
the several independent variables might influence the phenomenon of
drop out. It is quite likely that in the process of transition from one
section to another for whatever reasons better known to student who
drop out and their parents, they would have allowed it to happen and
that finally happens. That is how we find drop out being common a
feature at least amongst the working class families in unorganized
sector of our economy.

154
Table – 3.14 Distribution of SC/ST students in schools of the state by managements in Karnataka, 2011-12
Levels Category Education
dept. Social welfare +
local Govt. Pvt. Aided Pvt. Un-aided Others Total
No % No. % No. % No. % No. % No. % Class 1-5 SC 7.72 72.70 0.08 0.79 0.96 9.07 1.82 17.12 0.03 0.32 10.61 100
ST 3.33 74.62 0.06 1.43 0.27 6.06 0.79 17.62 0.01 0.27 4.46 100
Class 6-7 SC 72.78 70.96 0.16 4.18 0.44 11.15 0.52 13.33 0.01 0.38 3.92 100
ST 1.23 74.60 0.07 4.00 0.13 7.97 0.22 13.08 0.01 0.37 1.65 100
Class 1-7 SC 10.50 72.23 0.25 1.71 1.40 9.63 2.34 16.10 0.05 0.33 14.53 100
ST 4.56 74.62 0.13 2.13 0.40 6.57 1.00 16.39 0.02 0.29 6.11 100
Class 8-10 SC 2.08 45.69 0.20 4.44 1.52 33.22 0.73 16.09 0.03 0.57 4.56 100
ST 0.93 50.53 0.06 3.21 0.56 30.26 0.28 15.39 0.01 0.60 1.85 100
Total
(1 to 10)
SC 12.58 65.89 0.45 2.36 2.91 15.26 3.07 16.10 0.07 0.39 19.09 100
ST 5.49 69.03 0.19 2.38 0.96 12.07 1.29 16.16 0.03 0.36 7.95 100
Source: Sarva Shiksha Abhiyan, Annual Report, Bangalore, 2011-12.

155
The details in the above table show that there are 54.15 lakh
children who are studying in the lower primary stage of 1st to 5th
standards. This stage included enrolments in 1st to 5 th standards in 1st to
5th lower primary and 1st to 7 th or 1st to 8 th higher primary schools as
well as to 10 th high schools or 1st to 12 th higher primary schools Like-
wise, there are 20.75 lakh children in 6th & 7th standards, in the State.
They may be distributed in HPS /LHS or HSc schools.
It may be further observed from Table 3.13 that there are 20.64
lakh children from the SC/ST categories among 74.90 lakh children in
1st to 7th standards in the State. Of them, 14.53 lakh are SC while 6.11
lakh are ST students. That is, the proportion of SC/ST children in 1st to
10tb standards in the State is 27.56 percent. About 20.64 lakh children
from SC/ST categories are in 1st to 7th standards in the system of
schooling in the State. An analysis of location of these 20.64 lakh
children in the schools of the State by management reveals that 72.23
percent of SCs and 74.62 percent of STs in 1st to 7 th standards are in
schools run by the Department of Public Instruction. Proportion of
SC/ST students in State and State supported schools that are schools
run by Education Dept, by Department of Social Welfare, Local Self
Government Institutions and Private Aided Institutions is 83.53 percent.
SC/ST proportion in un-aided schools of the State at 1st to 7 th
standards is quite low as they cannot afford to pay fees charged by such
institutions. Their total proportion is just 16.56 percent.
There are 26.07 lakh children (Table 3.10) in 8th, 9th & l0 standards
in the State. About 4.56 Iakh SCs and 1.85 lakh STs are out of this total
constituting 6.41 lakh children or 24.59 percent.Analysis of distribution
of SCs and STs in high school stage by management reveals that 45.69

156
percent of SCs and 50.53 percent of STs are in high schools belonging to
the Department of Education.
Now we need to know as to what in the proportion of general
category students enrolled in schools when compared to the
SC/ST/OBC/Minorities children put together. General category here
implies only those who do not claim concession of any fee payment and
not eligible for other benefits like scholarships, free hostel facility etc.
Such students constitute about 19 percent as the details in the table 3.14
reveal. But the details of their enrolment in various categories of
schools vis-à-vis SC/ST/OBC and minorities are also given in the table
3.15.
3.11.4 Enrolments of SC/ST children at Elementary Stage
The scheduled castes (SC) and scheduled tribes (STs) constitute
the most do not ridden sections of the society. They were kept out of
the formal education system throughout the history of Indian society.
Tumkur to universal education policy of the government of India which
gave scope by their entry into schools, colleges and universities. Their
backwarden has been due to lack of education among them which was
due to the systematic decimal by the upper castes. Now there is no
discrimination of any type meted to them in educational institutions.
Yet it is necessary to see how are the children of SC/ST categories have
enrolled themselves in the schools of all types in the state. The details
are presented in table 3.14 above.

157
Table – 3.15 Statement of enrolments by management
Stages Categories All managements Department of education Aided Unaided Others Classes 1 to 5 Total 5414542 3041447 464035 1864649 44411
All Others 4486002 2820728 397835 1239703 27736 % Total 82.85 92.74 85.73 66.48 62.45
Classes 6 to 7 Total 2075498 1218735 223090 575980 57693 All Others 1723128 1120157 186672 368461 47838
% Total 83.02 91.91 83.68 63.97 82.92 Classes 1 to 7 Total 7490040 4260182 687125 2440629 102104
All Others 6209130 3940885 584507 1608164 75574 % Total 82.90 92.51 85.07 65.89 74.02
Classes 8 to 10 Total 2607306 1023087 810122 696480 77617
All Others 1955638 860539 601499 433893 59707 % Total 75.01 84.11 74.25 62.30 76.93
Classes 1 to 10 Total 10097346 5283269 1497247 3137109 179721
All Others 8164768 4801424 1186006 3137109 135281
% Total 80.86 90.88 79.21 65.09 75.27 Source: Dept. of Education, Govt. of Karnataka, Annual Report, 2011-12. Notes : (1) All others include SC / ST / OBC / Muslims I Other Minority; that is except General Category students. (2) Others’ in Management includes Social Welfare ÷ Local Bodies+ Others.

158
The details in the Table 3.15 show that nearly 4 out of every 5
students in school education in the State, at the lower and higher
primary stages who belong to SC/ST/OBC and Minorities Categories,
are in schools across all managements. Out of them nearly 17 percent
are in un-aided schools, while rest of the 83 percent is in Govt. and
Govt. supported schools. However this proportion is reduced at the
High School stage.
3.11.5 Teachers in the Schools in Karnataka:
Teacher is an integral part of any educational system, more so the
school education. Teacher in school plays a very vital role in laying a
good foundation of learning among children. A good teacher will
develop a good student who would be good citizen of the country. But
there has been concern over the teacher student ratio which determines
learning process among students. Karnataka has a good strength of
students in schools whose number crosses 4-5 lakhs as details in the
following table 3.16 reveal.
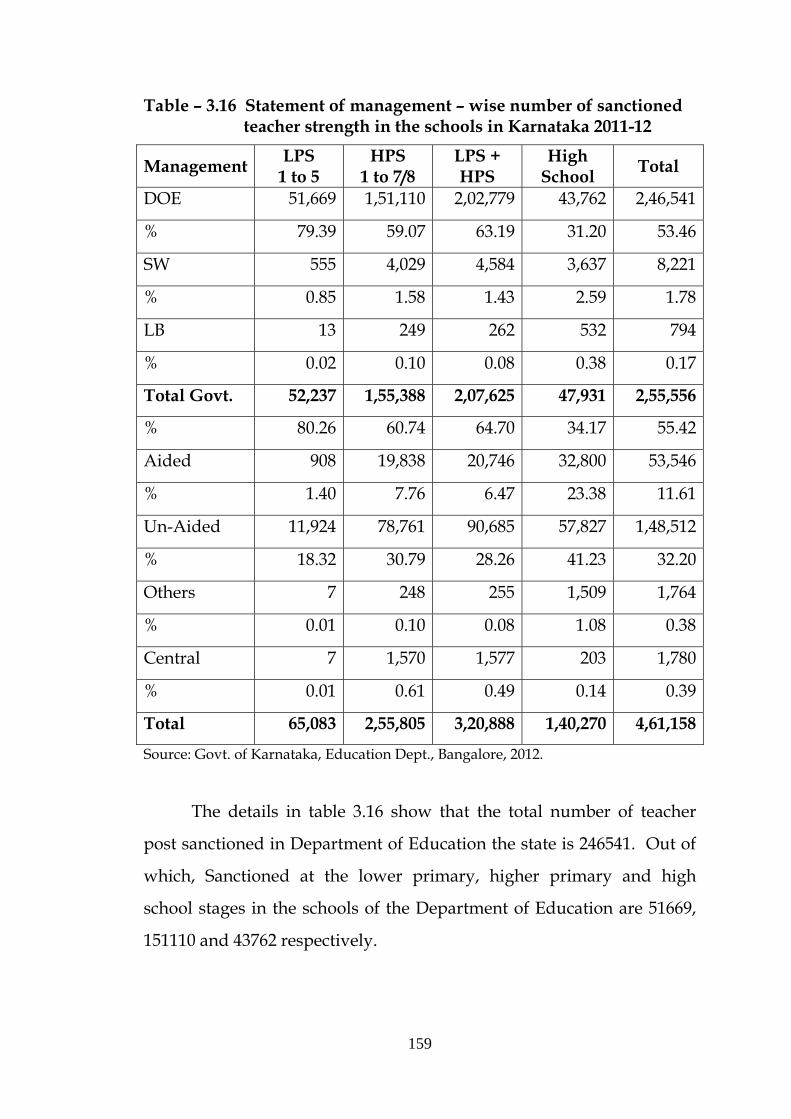
159
Table – 3.16 Statement of management – wise number of sanctioned teacher strength in the schools in Karnataka 2011-12
Management LPS 1 to 5
HPS 1 to 7/8
LPS + HPS
High School Total
DOE 51,669 1,51,110 2,02,779 43,762 2,46,541
% 79.39 59.07 63.19 31.20 53.46
SW 555 4,029 4,584 3,637 8,221
% 0.85 1.58 1.43 2.59 1.78
LB 13 249 262 532 794
% 0.02 0.10 0.08 0.38 0.17
Total Govt. 52,237 1,55,388 2,07,625 47,931 2,55,556
% 80.26 60.74 64.70 34.17 55.42
Aided 908 19,838 20,746 32,800 53,546
% 1.40 7.76 6.47 23.38 11.61
Un-Aided 11,924 78,761 90,685 57,827 1,48,512
% 18.32 30.79 28.26 41.23 32.20
Others 7 248 255 1,509 1,764
% 0.01 0.10 0.08 1.08 0.38
Central 7 1,570 1,577 203 1,780
% 0.01 0.61 0.49 0.14 0.39
Total 65,083 2,55,805 3,20,888 1,40,270 4,61,158
Source: Govt. of Karnataka, Education Dept., Bangalore, 2012.
The details in table 3.16 show that the total number of teacher
post sanctioned in Department of Education the state is 246541. Out of
which, Sanctioned at the lower primary, higher primary and high
school stages in the schools of the Department of Education are 51669,
151110 and 43762 respectively.

160
There is always a problem in maintaining full teacher strength in
schools due to retirement or delay in recruitment etc. Leading to gap in
sectional strength and the actual strength. In fact Teacher Student Ratio
(TSR) is scientifically worked out and strived to maintain it but
unfortunately in reality it is not achieved any time in the history of
primary education in Karnataka. This can be proved by comparing the
details in above table 3.15 with 3.16 given here under in which the
actual number of teachers in position in all types of management
schools in Karnataka provided revealing the fact that number of
teachers who are working at the lower primary, higher primary and
high school stages in the schools of all managements are 4,23,887
against 4,61,158 sanctioned strength, leaving vacancy of 37,271.

161
Table – 3.17 Statement of management–wise number of working teacher in the schools in Karnataka, 2011-12
Management LPS 1 to 5
HPS 1 to 7/8
LPS + HPS
High School Total
DOE 49,948 1,37,557 1,84,505 36,905 2,21,410
% 77.92 58.06 62.09 29.12 52.23
SW 440 3,312 3,752 2,978 6,730
% 0.73 1.40 1.26 2.35 1.59
LB 10 186 196 344 540
% 0.02 0.08 0.07 0.27 0.13
Total Govt. 47,398 1,41,055 1,88,453 40,227 2,28,680
% 78.67 59.54 63.42 31.74 53.95
Aided 656 16,037 16,693 28,352 45,045
% 1.09 6.77 5.62 22.37 10.63
Un-Aided 12,183 78,145 90,328 56,570 1,46,898
% 20.22 32.99 30.40 44.64 34.63
Others 7 234 241 177 418
% 0.01 0.10 0.08 0.14 0.10
Central 6 1,435 1,441 1,405 2,846
% 0.01 0.61 0.48 1.11 0.67
Total 60,250 2,36,906 2,97,156 1,26,731 4,23,887 Source: Dept. of Education, Govt. of Karnataka, Bangalore, 2012.
The details in above table 3.17 show that 52.23 percent of teachers
working in the State there in including all levels of schooling belong to
the Department of Education. If a tally is taken of only Elementary
School level teachers this percentage goes up to 78.67. If a tally of

162
proportion of teachers whose salary is paid by the government, that is
Department of Education plus schools run by the Department of Social
Welfare and Local Bodies along with private schools getting grant in aid
are considered then, the proportion of teachers maintained by it is
nearly 72 percent at the elementary level, and 57 percent at the High
School level.
Teacher Pupil ratios for working teacher are in a satisfactory state
in Government schools. This ratio is 23.09 at the elementary schools.
Still variations in this ratio are observed across districts of the state,
blocks within districts and schools within blocks. For instance, this ratio
is 1: 35.96 in Yadgir district while it is 1: 14.40 in Chikmagalur district. A
process of rational deployment of teachers is required to be done so as
to set right such imbalances in teacher pupil ratios. The details for
Student Teacher Ratio in primary schools of all managements are given
in Table 3.18 below.
Table – 3.18 Statement showing student-teacher ratio management wise primary schools in Karnataka, 2011-12
Management 1 to 7
No. of teachers working PTR No. of students
DoE 4260182 1,84,505 23.09
SW + LB 66338 3,948 16.80
Aided 687125 16,693 41.16
Un-Aided 2440629 90,328 27.02
Others 6267 241 26.00
Central 29499 1,441 20.47
Total 7490040 297156 Source: Sarva Shiksha Abhiyan, Govt. of Karnataka, Annual Report , 2011-12

163
The above table 3.18 shows that there is one teacher for every 23
students in the Department of Education; these ratios are observed to be
41 and 27 in private aided and unaided schools. The average is 25.76
students per teacher in all types of primary schools in Karnataka.
In the foregoing sections an attempt is made to present in brief
the emergence of primary education in India which has come of age due
to the keen interest of the government, society and communities have
evinced lot of interest in it. Since it is the foundation of education and
when once it is layed solidly, then the higher education could be
developed as desired and designed by the society and state. These
details are of a significance in the analysis of the problem of drop out in
north Karnataka which is looked into from the point of the person who
dropped out, his family, community and school where admitted for
primary education. These analyzed details serve a background to the
study of problem of drop out in the backward area of North Karnataka,
Bijapur district. In the following chapter, a profile of Bijapur district,
which is study area, is presented in order to serve as background details
for analytical understanding of the phenomenon of drop out problem.