CHAPTER III AGE AND SEX COMPOSITION OF THE POPULATION · Analytical Report, Census of the Maldives...
24
Analytical Report, Census of the Maldives – 2000 _______________________________________________________________________________________________________ ____________________________________________________________________________ Age and Sex Composition of the Population CHAPTER III AGE AND SEX COMPOSITION OF THE POPULATION By Ms. Fathmath Riyaza
Transcript of CHAPTER III AGE AND SEX COMPOSITION OF THE POPULATION · Analytical Report, Census of the Maldives...
Analytical Report, Census of the Maldives – 2000 _______________________________________________________________________________________________________
____________________________________________________________________________ Age and Sex Composition of the Population
CHAPTER III
AGE AND SEX COMPOSITION OF THE POPULATION
By Ms. Fathmath Riyaza
Analytical Report, Census of the Maldives – 2000 _______________________________________________________________________________________________________
_________________________________________________________________________ Age and Sex Composition of the Population
AGE & SEX COMPOSITION OF THE POPULATION
INTRODUCTION
The age and the sex structure of the population are the most important
demographic characteristics that are captured by a census of a population. Age and sex
are two attributes that largely influence an individual’s role in society. An attempt will be
made in this chapter to examine the various aspects of age and sex composition of the
population of Maldives at the national and sub-national levels using data collected from
the quinquennial censuses. Regarding the collection of these data, the each individual
was asked to give his/her current age as well as the date of birth, to aid the reporting of
age accurately.
AGE STRUCTURE
The age structure of a population, that is; the distribution of the population in
different age groups, constitutes an important subject of demographic analysis and
development planning. Age structural dynamics includes fertility, mortality and as well
as related changes in family planning and social arrangements. The use of age-
structure goes beyond demographic analysis to other important areas. Public polices
aim to improve the welfare of a population; population welfare in turn is determined and
shaped by the needs of present and future population; a population’s needs and its
potential are strongly shaped by its demographic composition- i.e. by age-structural
transition. In consideration of various uses of age data, information on age is routinely
collected in every census and survey conducted in the country. As in most developing
countries the quality of age reporting is a matter of contention in the Maldives. Age
misreporting remains a problem in the census. Certain segments of the population do
not know their dates of birth so it ultimately leaves the enumerator to estimate the age
to the likeliest age to be. In some cases the estimates could be several years off from
their actual age.
Analytical Report, Census of the Maldives – 2000 _______________________________________________________________________________________________________
_________________________________________________________________________ Age and Sex Composition of the Population
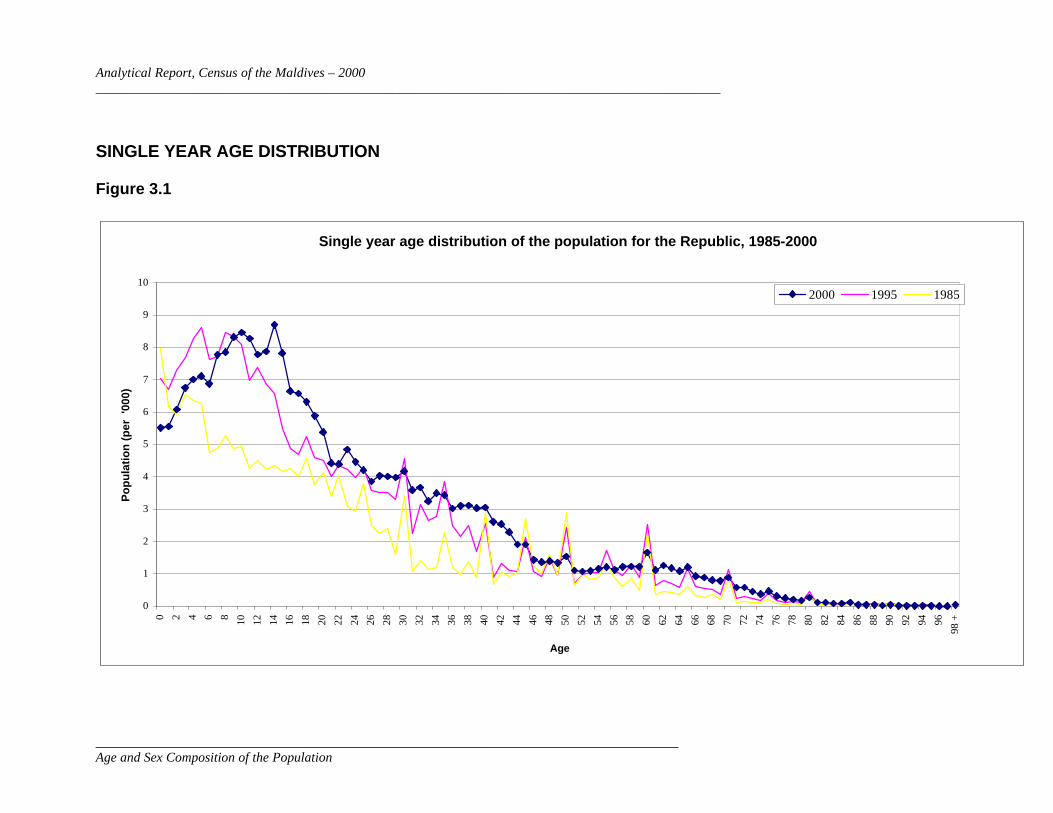
SINGLE YEAR AGE DISTRIBUTION Figure 3.1
Single year age distribution of the population for the Republic, 1985-2000
0
1
2
3
4
5
6
7
8
9
10
0 2 4 6 8 10 12 14 16 18 20 22 24 26 28 30 32 34 36 38 40 42 44 46 48 50 52 54 56 58 60 62 64 66 68 70 72 74 76 78 80 82 84 86 88 90 92 94 96
98 +
Age
Po
pu
lati
on
(p
er '
000)
2000 1995 1985
Analytical Report, Census of the Maldives – 2000 _______________________________________________________________________________________________________
____________________________________________________________________________ Age and Sex Composition of the Population
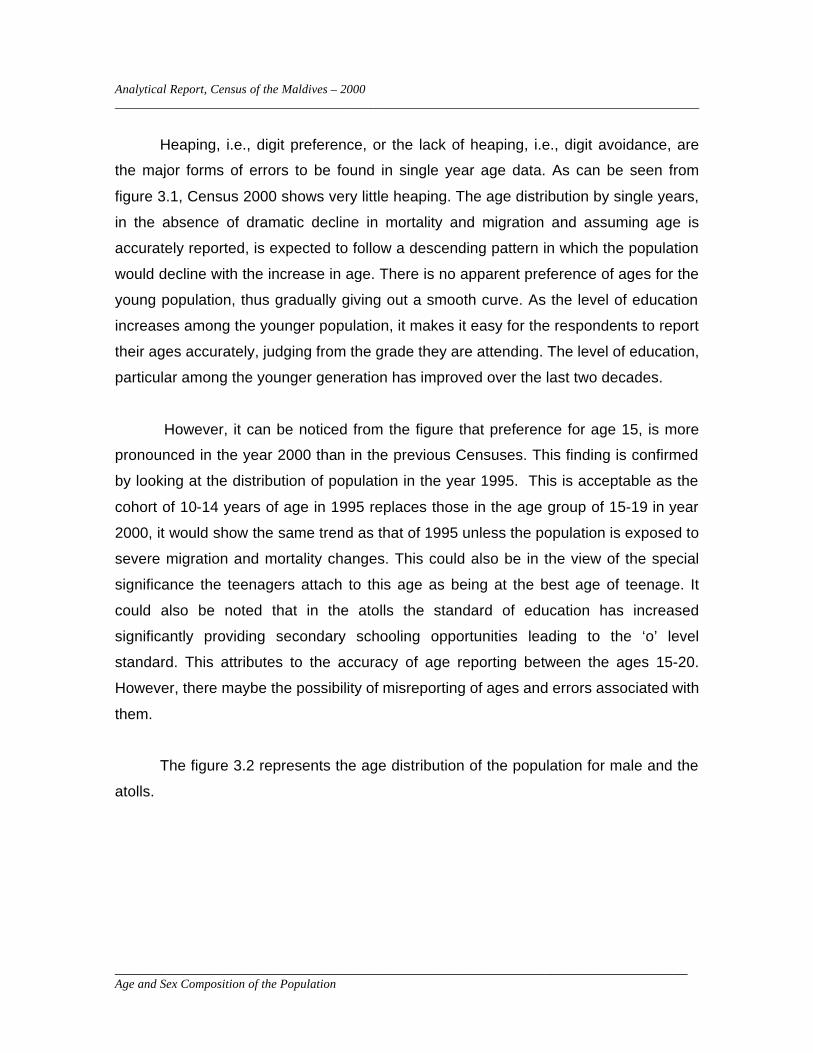
Heaping, i.e., digit preference, or the lack of heaping, i.e., digit avoidance, are
the major forms of errors to be found in single year age data. As can be seen from
figure 3.1, Census 2000 shows very little heaping. The age distribution by single years,
in the absence of dramatic decline in mortality and migration and assuming age is
accurately reported, is expected to follow a descending pattern in which the population
would decline with the increase in age. There is no apparent preference of ages for the
young population, thus gradually giving out a smooth curve. As the level of education
increases among the younger population, it makes it easy for the respondents to report
their ages accurately, judging from the grade they are attending. The level of education,
particular among the younger generation has improved over the last two decades.
However, it can be noticed from the figure that preference for age 15, is more
pronounced in the year 2000 than in the previous Censuses. This finding is confirmed
by looking at the distribution of population in the year 1995. This is acceptable as the
cohort of 10-14 years of age in 1995 replaces those in the age group of 15-19 in year
2000, it would show the same trend as that of 1995 unless the population is exposed to
severe migration and mortality changes. This could also be in the view of the special
significance the teenagers attach to this age as being at the best age of teenage. It
could also be noted that in the atolls the standard of education has increased
significantly providing secondary schooling opportunities leading to the ‘o’ level
standard. This attributes to the accuracy of age reporting between the ages 15-20.
However, there maybe the possibility of misreporting of ages and errors associated with
them.
The figure 3.2 represents the age distribution of the population for male and the
atolls.
Analytical Report, Census of the Maldives – 2000 _______________________________________________________________________________________________________
_________________________________________________________________________ Age and Sex Composition of the Population
Figure 3.2
Single year age distribution of the Populationfor Male' and the Atolls, Census 2000
0
1
2
3
4
5
6
7
8
0 2 4 6 8 10 12 14 16 18 20 22 24 26 28 30 32 34 36 38 40 42 44 46 48 50 52 54 56 58 60 62 64 66 68 70 72 74 76 78 80 82 84 86 88 90 92 94 96 98+
Age
Po
pu
lati
on
( p
er '
000)
Atolls Male'
Analytical Report, Census of the Maldives – 2000 _______________________________________________________________________________________________________
____________________________________________________________________________ Age and Sex Composition of the Population
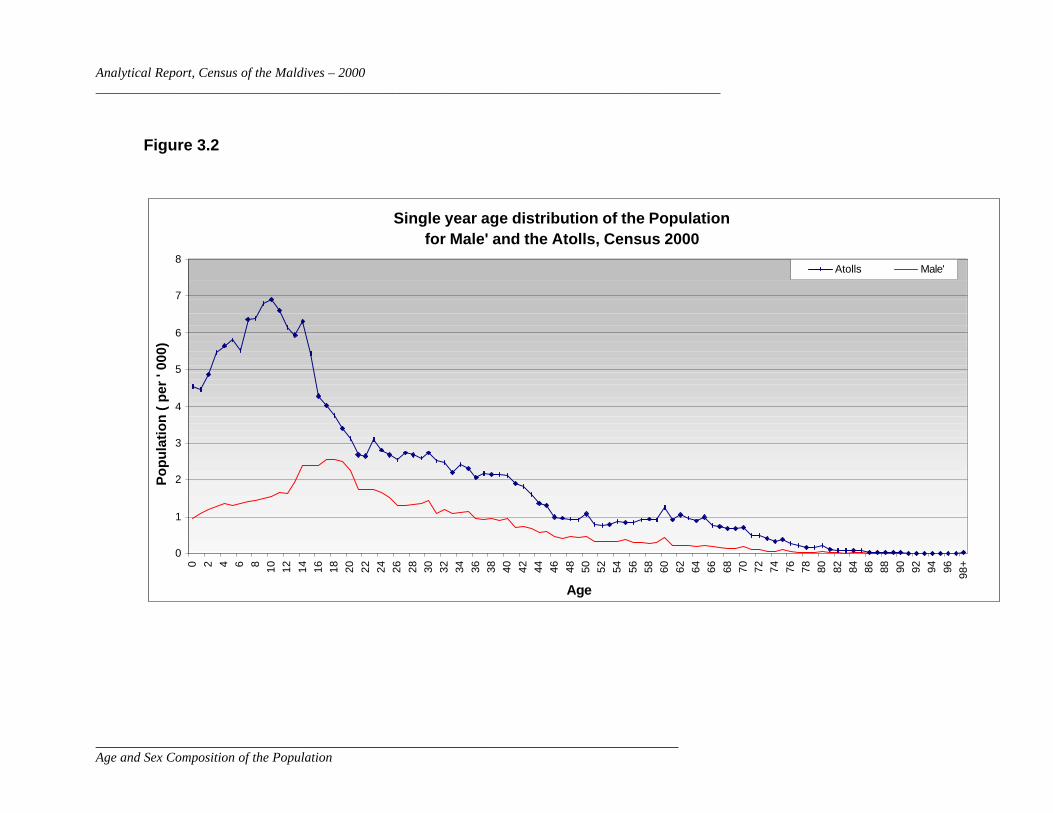
Figure 3.2 suggests that the same age preference is there for the Male’ as well
as for the Atoll. However it is more pronounced in the single year age distribution for the
Atolls. This occurs from age 25 onwards where ages ending in 10 and 20 are obviously
the preferred digits during the 2000 census. The peak for age 15 is significant here also,
showing a greater preference for the digit than the previous census. Compared to
previous censuses, certain contradictions could also be revealed from the figure. It can
also be noticed from the single year age distribution of the atolls that the peak for age 5
has gone down in 2000, as it moved to 9-10 years old cohort. The preference for the
ages 30, 36, 50 & 60 has gone down considerably showing an improvement in age
reporting. On the other hand, the population distribution of Male’ does not show such
significant peaks.
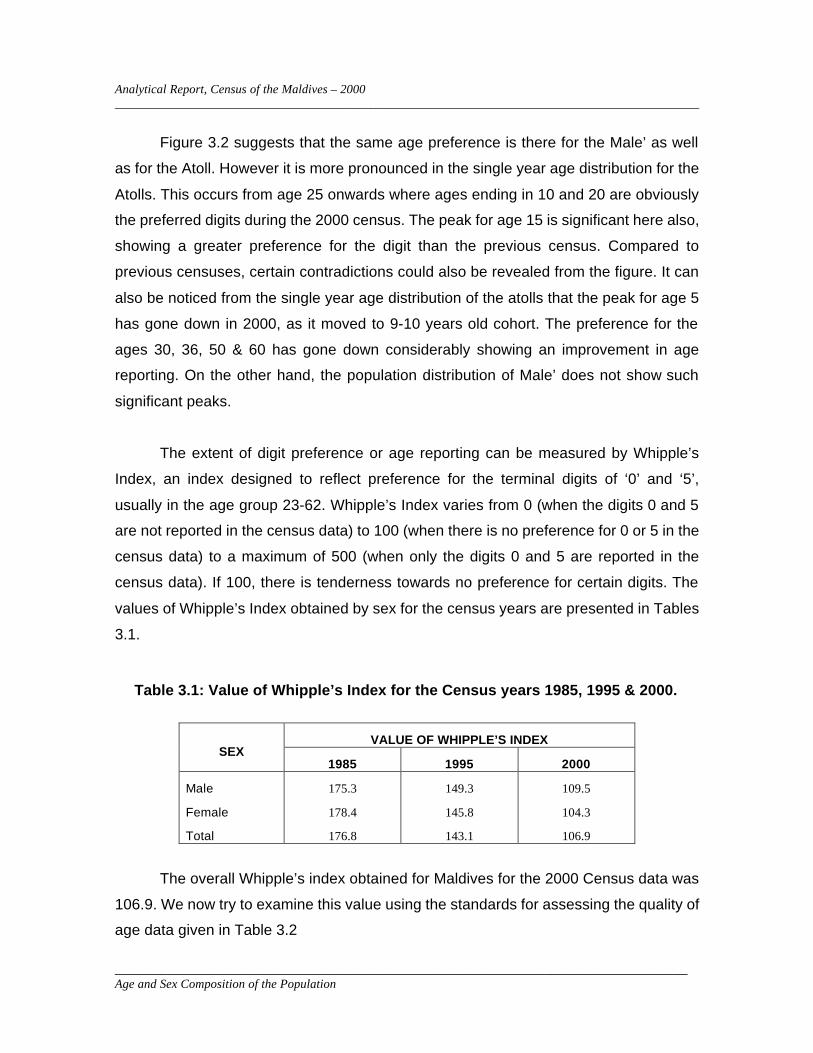
The extent of digit preference or age reporting can be measured by Whipple’s
Index, an index designed to reflect preference for the terminal digits of ‘0’ and ‘5’,
usually in the age group 23-62. Whipple’s Index varies from 0 (when the digits 0 and 5
are not reported in the census data) to 100 (when there is no preference for 0 or 5 in the
census data) to a maximum of 500 (when only the digits 0 and 5 are reported in the
census data). If 100, there is tenderness towards no preference for certain digits. The
values of Whipple’s Index obtained by sex for the census years are presented in Tables
3.1.
Table 3.1: Value of Whipple’s Index for the Census years 1985, 1995 & 2000.
VALUE OF WHIPPLE’S INDEX SEX
1985 1995 2000
Male
Female
Total
175.3
178.4
176.8
149.3
145.8
143.1
109.5
104.3
106.9
The overall Whipple’s index obtained for Maldives for the 2000 Census data was
106.9. We now try to examine this value using the standards for assessing the quality of
age data given in Table 3.2
Analytical Report, Census of the Maldives – 2000 _______________________________________________________________________________________________________
_________________________________________________________________________ Age and Sex Composition of the Population
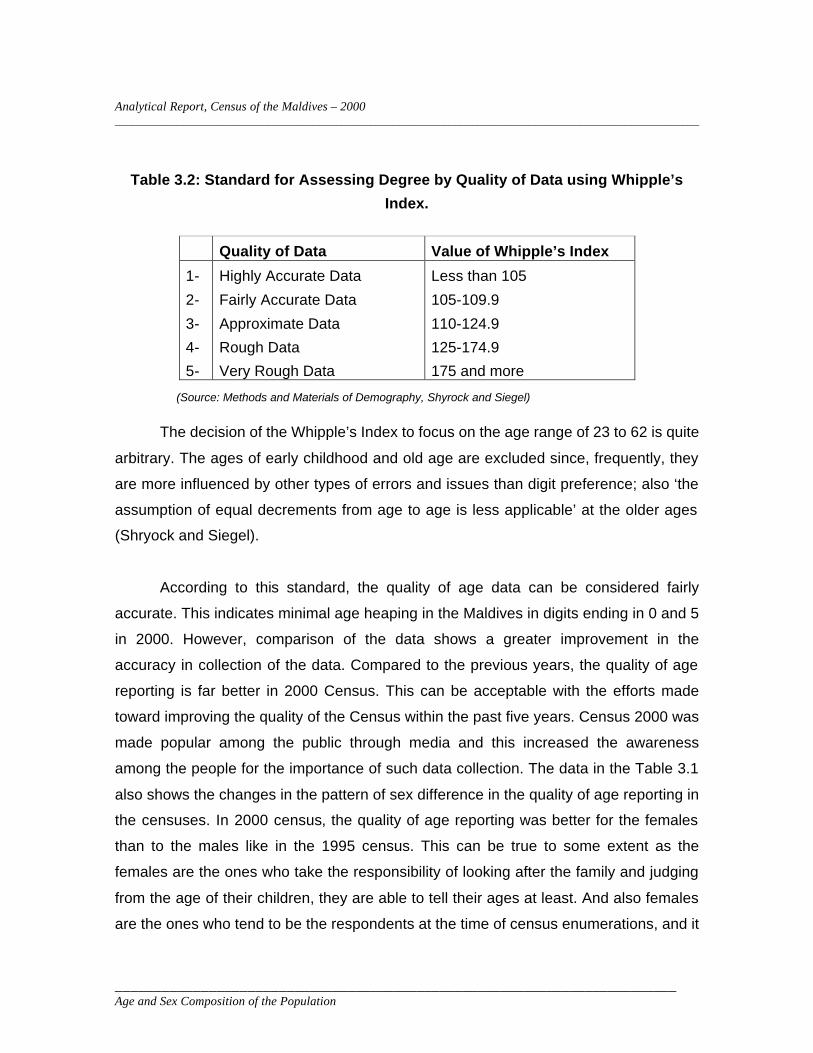
Table 3.2: Standard for Assessing Degree by Quality of Data using Whipple’s
Index.
Quality of Data Value of Whipple’s Index
1-
2-
3-
4-
5-
Highly Accurate Data
Fairly Accurate Data
Approximate Data
Rough Data
Very Rough Data
Less than 105
105-109.9
110-124.9
125-174.9
175 and more
(Source: Methods and Materials of Demography, Shyrock and Siegel)
The decision of the Whipple’s Index to focus on the age range of 23 to 62 is quite
arbitrary. The ages of early childhood and old age are excluded since, frequently, they
are more influenced by other types of errors and issues than digit preference; also ‘the
assumption of equal decrements from age to age is less applicable’ at the older ages
(Shryock and Siegel).
According to this standard, the quality of age data can be considered fairly
accurate. This indicates minimal age heaping in the Maldives in digits ending in 0 and 5
in 2000. However, comparison of the data shows a greater improvement in the
accuracy in collection of the data. Compared to the previous years, the quality of age
reporting is far better in 2000 Census. This can be acceptable with the efforts made
toward improving the quality of the Census within the past five years. Census 2000 was
made popular among the public through media and this increased the awareness
among the people for the importance of such data collection. The data in the Table 3.1
also shows the changes in the pattern of sex difference in the quality of age reporting in
the censuses. In 2000 census, the quality of age reporting was better for the females
than to the males like in the 1995 census. This can be true to some extent as the
females are the ones who take the responsibility of looking after the family and judging
from the age of their children, they are able to tell their ages at least. And also females
are the ones who tend to be the respondents at the time of census enumerations, and it
Analytical Report, Census of the Maldives – 2000 _______________________________________________________________________________________________________
_________________________________________________________________________ Age and Sex Composition of the Population
is difficult for them to give the exact age of their husbands or spouses, in turn giving
inaccurate data on them.
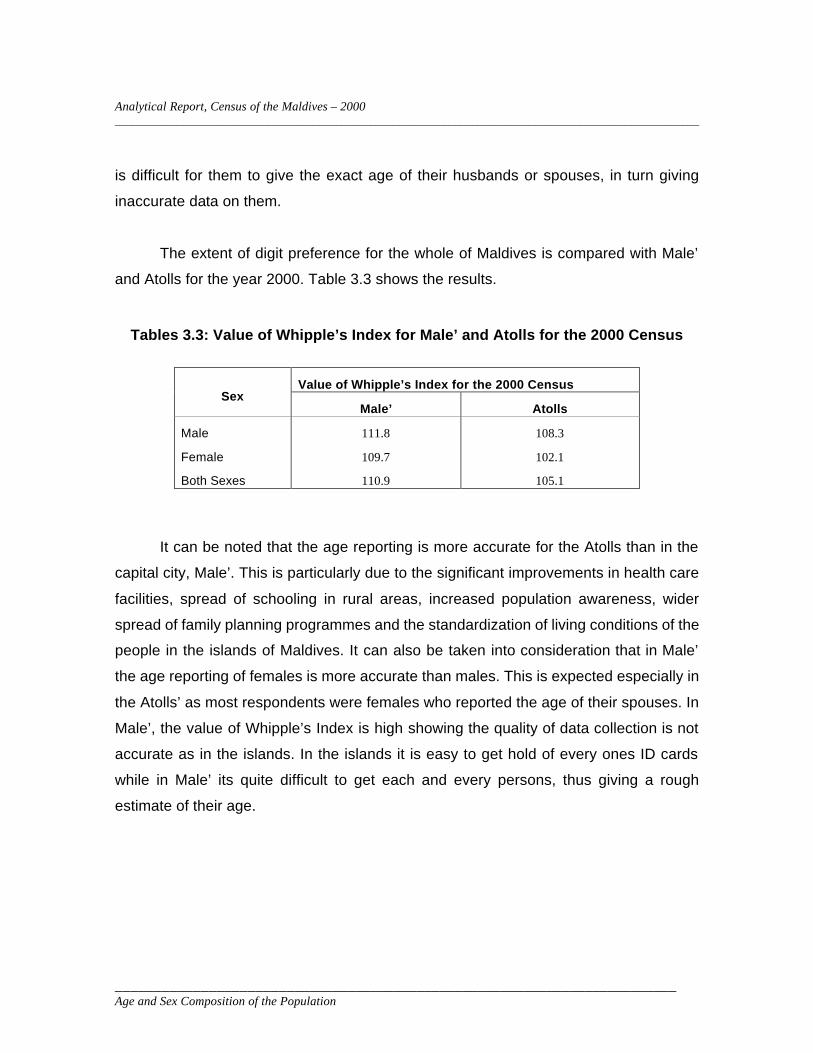
The extent of digit preference for the whole of Maldives is compared with Male’
and Atolls for the year 2000. Table 3.3 shows the results.
Tables 3.3: Value of Whipple’s Index for Male’ and Atolls for the 2000 Census
Value of Whipple’s Index for the 2000 Census Sex
Male’ Atolls
Male
Female
Both Sexes
111.8
109.7
110.9
108.3
102.1
105.1
It can be noted that the age reporting is more accurate for the Atolls than in the
capital city, Male’. This is particularly due to the significant improvements in health care
facilities, spread of schooling in rural areas, increased population awareness, wider
spread of family planning programmes and the standardization of living conditions of the
people in the islands of Maldives. It can also be taken into consideration that in Male’
the age reporting of females is more accurate than males. This is expected especially in
the Atolls’ as most respondents were females who reported the age of their spouses. In
Male’, the value of Whipple’s Index is high showing the quality of data collection is not
accurate as in the islands. In the islands it is easy to get hold of every ones ID cards
while in Male’ its quite difficult to get each and every persons, thus giving a rough
estimate of their age.
Analytical Report, Census of the Maldives – 2000 _______________________________________________________________________________________________________
_________________________________________________________________________ Age and Sex Composition of the Population
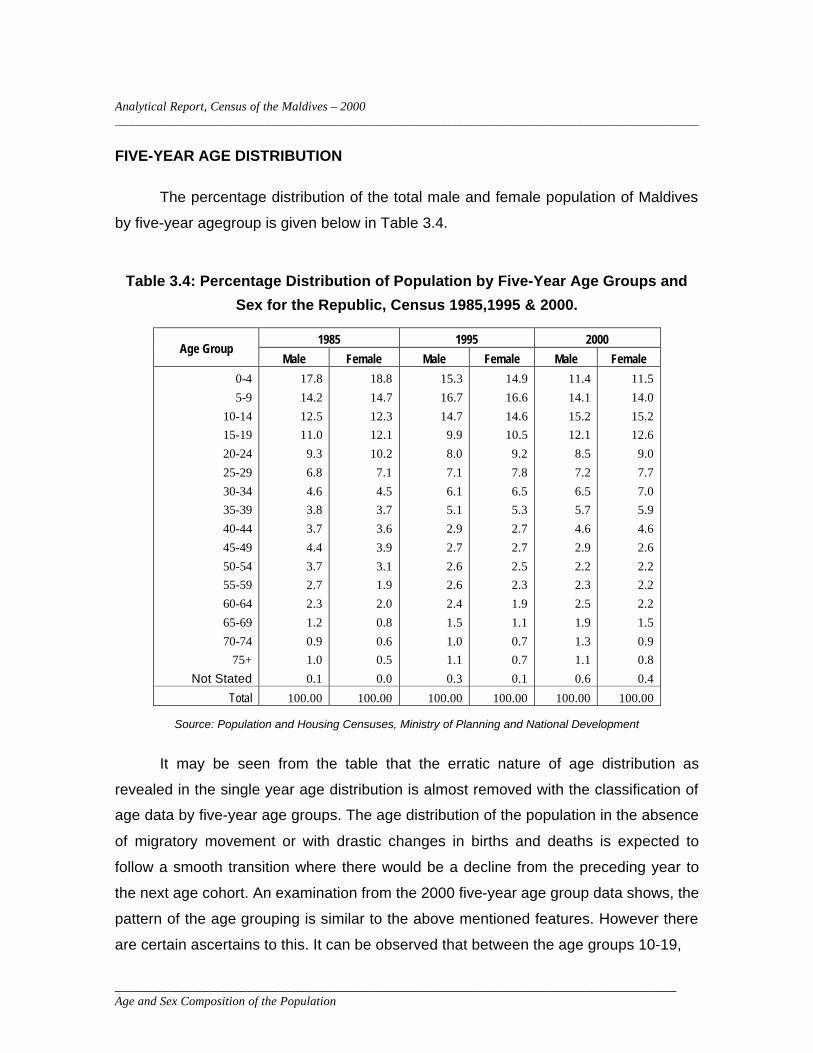
FIVE-YEAR AGE DISTRIBUTION
The percentage distribution of the total male and female population of Maldives
by five-year agegroup is given below in Table 3.4.
Table 3.4: Percentage Distribution of Population by Five-Year Age Groups and
Sex for the Republic, Census 1985,1995 & 2000.
Source: Population and Housing Censuses, Ministry of Planning and National Development
It may be seen from the table that the erratic nature of age distribution as
revealed in the single year age distribution is almost removed with the classification of
age data by five-year age groups. The age distribution of the population in the absence
of migratory movement or with drastic changes in births and deaths is expected to
follow a smooth transition where there would be a decline from the preceding year to
the next age cohort. An examination from the 2000 five-year age group data shows, the
pattern of the age grouping is similar to the above mentioned features. However there
are certain ascertains to this. It can be observed that between the age groups 10-19,
1985 1995 2000 Age Group
Male Female Male Female Male Female
0-4
5-9
10-14
15-19
20-24
25-29
30-34
35-39
40-44
45-49
50-54
55-59
60-64
65-69
70-74
75+
Not Stated
17.8
14.2
12.5
11.0
9.3
6.8
4.6
3.8
3.7
4.4
3.7
2.7
2.3
1.2
0.9
1.0
0.1
18.8
14.7
12.3
12.1
10.2
7.1
4.5
3.7
3.6
3.9
3.1
1.9
2.0
0.8
0.6
0.5
0.0
15.3
16.7
14.7
9.9
8.0
7.1
6.1
5.1
2.9
2.7
2.6
2.6
2.4
1.5
1.0
1.1
0.3
14.9
16.6
14.6
10.5
9.2
7.8
6.5
5.3
2.7
2.7
2.5
2.3
1.9
1.1
0.7
0.7
0.1
11.4
14.1
15.2
12.1
8.5
7.2
6.5
5.7
4.6
2.9
2.2
2.3
2.5
1.9
1.3
1.1
0.6
11.5
14.0
15.2
12.6
9.0
7.7
7.0
5.9
4.6
2.6
2.2
2.2
2.2
1.5
0.9
0.8
0.4
Total 100.00 100.00 100.00 100.00 100.00 100.00
Analytical Report, Census of the Maldives – 2000 _______________________________________________________________________________________________________
_________________________________________________________________________ Age and Sex Composition of the Population
the population is in excess to the previous age group. This can be explained from the
table as we compared the 2000 data with the 1995 five age groups. As the ages 0-14
from the 1995 data shift one cohort up, this trend is observed in the population by the
year 2000. The trend is also observed in the age group 60-64. It is worthwhile noting
that; it was the case in 1995 for the age group 59-60 with the excess of males. Apart
from this, the population has followed a smooth declining trend as the population moves
from one cohort to the next cohort.
AGE DISTRIBUTION
Keeping in mind the preceding discussion on the quality of age data, we will
examine the age structure of the Maldivian population and its implications on future
demographic trends.
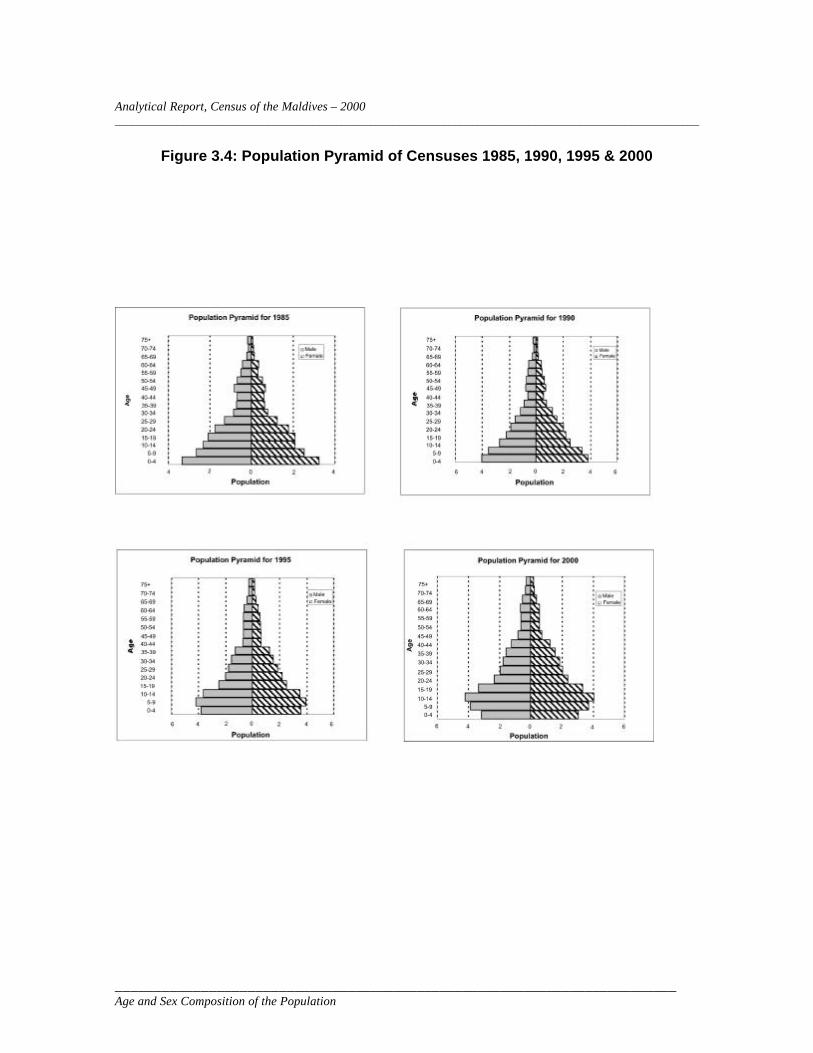
As can be seen in Figure 3.4 the age structure of the Maldivian population
remains one that is young. A population pyramid is a graphical way to show the age and
sex composition of a population. Census results of 2000 further show that in the
Maldives 11 percent of the population are under five years of age children while 51 or
more percent were aged 18 years or more. As of 2000, less than half of the population
is below the age of 15. (40.7 percent). This may have resulted from the low level of
fertility that has prevailed in the country recently. It is interesting to note that the, size of
the age 0-4 group has given the pyramid quite a narrow base when compared with the
1995 age cohort and the age group when compared with the age cohort 5-9 is smaller.
This picture suggests that the level of fertility has gone down considerably during the
intercensal period. A declining fertility trend could only be reflected in terms of smaller
number of children born each year after a time lag from the start of the decline. This
structure also predicts effects on population. At the same time, the number of new
entrants to the labour force would increase.
Analytical Report, Census of the Maldives – 2000 _______________________________________________________________________________________________________
_________________________________________________________________________ Age and Sex Composition of the Population
Figure 3.4: Population Pyramid of Censuses 1985, 1990, 1995 & 2000
Analytical Report, Census of the Maldives – 2000 _______________________________________________________________________________________________________
_________________________________________________________________________ Age and Sex Composition of the Population
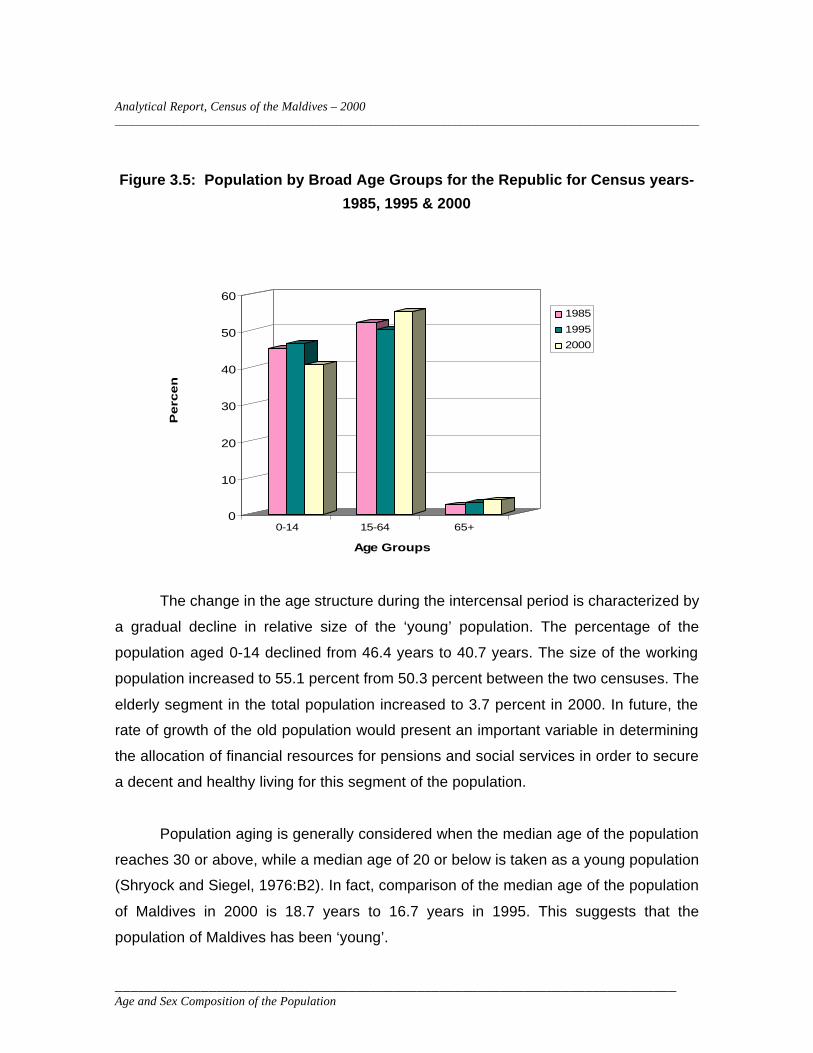
Figure 3.5: Population by Broad Age Groups for the Republic for Census years-
1985, 1995 & 2000
The change in the age structure during the intercensal period is characterized by
a gradual decline in relative size of the ‘young’ population. The percentage of the
population aged 0-14 declined from 46.4 years to 40.7 years. The size of the working
population increased to 55.1 percent from 50.3 percent between the two censuses. The
elderly segment in the total population increased to 3.7 percent in 2000. In future, the
rate of growth of the old population would present an important variable in determining
the allocation of financial resources for pensions and social services in order to secure
a decent and healthy living for this segment of the population.
Population aging is generally considered when the median age of the population
reaches 30 or above, while a median age of 20 or below is taken as a young population
(Shryock and Siegel, 1976:B2). In fact, comparison of the median age of the population
of Maldives in 2000 is 18.7 years to 16.7 years in 1995. This suggests that the
population of Maldives has been ‘young’.
0
10
20
30
40
50
60
Pe
rce
nt
0-14 15-64 65+
Age Groups
1985
1995
2000
Analytical Report, Census of the Maldives – 2000 _______________________________________________________________________________________________________
_________________________________________________________________________ Age and Sex Composition of the Population
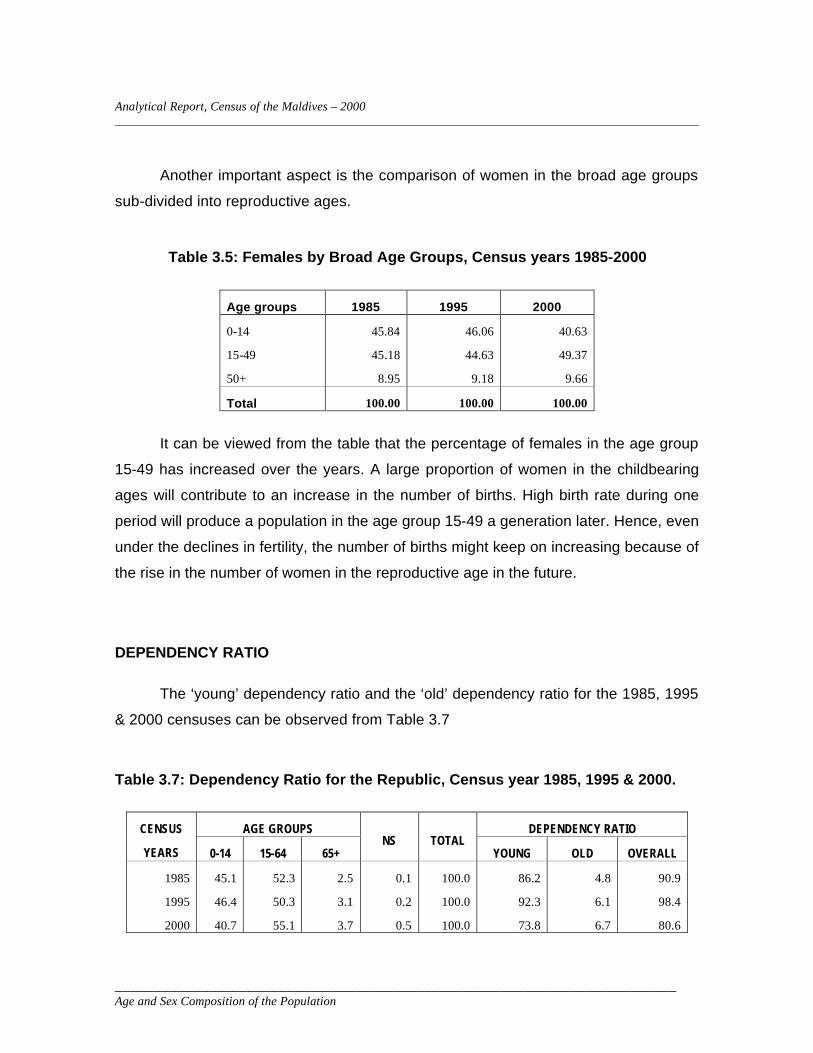
Another important aspect is the comparison of women in the broad age groups
sub-divided into reproductive ages.
Table 3.5: Females by Broad Age Groups, Census years 1985-2000
Age groups 1985 1995 2000
0-14
15-49
50+
45.84
45.18
8.95
46.06
44.63
9.18
40.63
49.37
9.66
Total 100.00 100.00 100.00
It can be viewed from the table that the percentage of females in the age group
15-49 has increased over the years. A large proportion of women in the childbearing
ages will contribute to an increase in the number of births. High birth rate during one
period will produce a population in the age group 15-49 a generation later. Hence, even
under the declines in fertility, the number of births might keep on increasing because of
the rise in the number of women in the reproductive age in the future.
DEPENDENCY RATIO
The ‘young’ dependency ratio and the ‘old’ dependency ratio for the 1985, 1995
& 2000 censuses can be observed from Table 3.7
Table 3.7: Dependency Ratio for the Republic, Census year 1985, 1995 & 2000.
AGE GROUPS DEPENDENCY RATIO CENSUS
YEARS 0-14 15-64 65+ NS TOTAL
YOUNG OLD OVERALL
1985
1995
2000
45.1
46.4
40.7
52.3
50.3
55.1
2.5
3.1
3.7
0.1
0.2
0.5
100.0
100.0
100.0
86.2
92.3
73.8
4.8
6.1
6.7
90.9
98.4
80.6
Analytical Report, Census of the Maldives – 2000 _______________________________________________________________________________________________________
_________________________________________________________________________ Age and Sex Composition of the Population
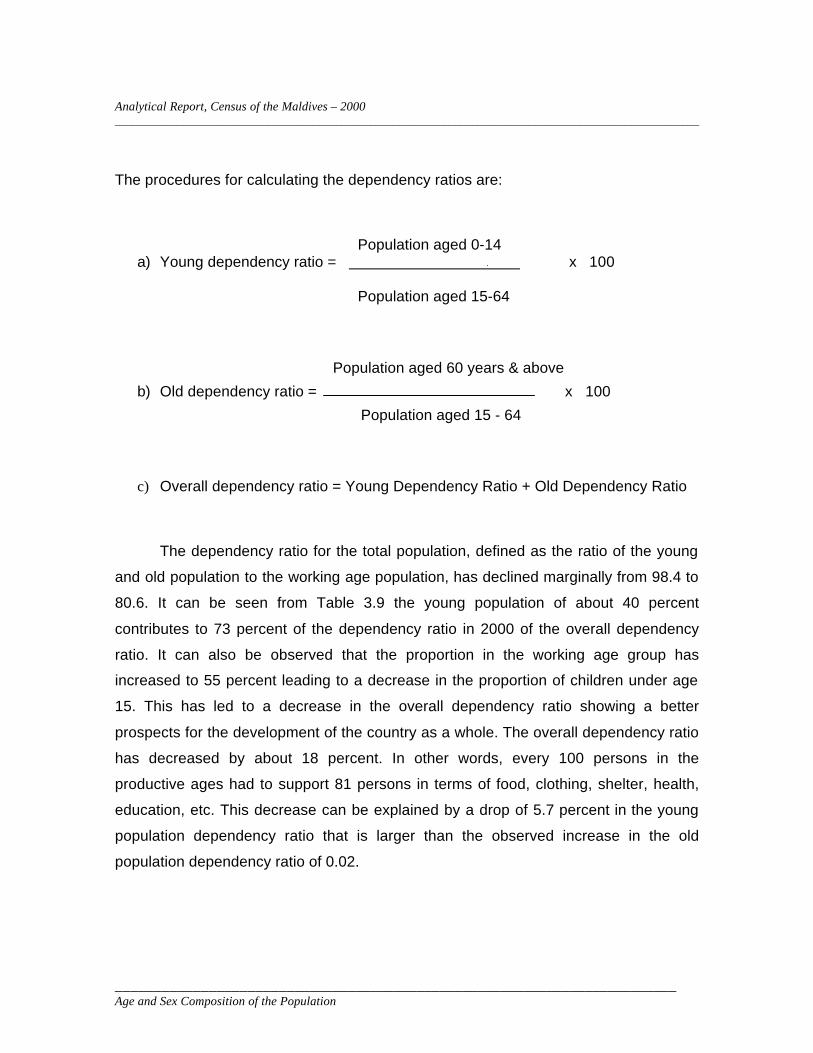
The procedures for calculating the dependency ratios are:
Population aged 0-14
a) Young dependency ratio = x 100 Population aged 15-64
Population aged 60 years & above
b) Old dependency ratio = x 100
Population aged 15 - 64
c) Overall dependency ratio = Young Dependency Ratio + Old Dependency Ratio
The dependency ratio for the total population, defined as the ratio of the young
and old population to the working age population, has declined marginally from 98.4 to
80.6. It can be seen from Table 3.9 the young population of about 40 percent
contributes to 73 percent of the dependency ratio in 2000 of the overall dependency
ratio. It can also be observed that the proportion in the working age group has
increased to 55 percent leading to a decrease in the proportion of children under age
15. This has led to a decrease in the overall dependency ratio showing a better
prospects for the development of the country as a whole. The overall dependency ratio
has decreased by about 18 percent. In other words, every 100 persons in the
productive ages had to support 81 persons in terms of food, clothing, shelter, health,
education, etc. This decrease can be explained by a drop of 5.7 percent in the young
population dependency ratio that is larger than the observed increase in the old
population dependency ratio of 0.02.
Analytical Report, Census of the Maldives – 2000 _______________________________________________________________________________________________________
_________________________________________________________________________ Age and Sex Composition of the Population
AGE DISTRIBUTION OF THE POPULATION BY RURAL AND URBAN AREAS
This refers to the age distribution in Male’ and in the other atolls. The percentage
distribution of the population for urban and rural areas are given below in table 3.6.
Table 3.6: Population by Broad Age Group for the Atolls and Male’- 1985, 1995 &
2000 Census
Age Groups
0-14 15-64 65+ NS Total
Male’
1985
1995
2000
Atolls
1985
1995
2000
37.4
34.8
29.84
47.7
50.4
44.8
60.9
62.6
67.1
49.4
46.1
50.6
1.6
2.2
2.4
2.8
3.4
4.2
0.0
0.3
0.2
0.1
0.2
0.4
100
100
100
100
100
100
It can be observed from the table that the proportion of those in the age group
65+ has increased both in the Atolls and in Male’. The proportion in the age group 15-
64 has also increased. However, for the age group 0-14, the population has gone down.
This shows that the fertility rate has gone down within the intercensal period.
In the age structure of the population of Male’ and Atolls there has been a shift in
percentage. The most noticeable change that had occurred was the decrease in the
proportion of population in the age group 0-14. Overall, it can still be defined as a young
population.
If indeed the transition from high to low fertility is already on track, the proportion
of the children will decline in the short term period while the economically active
Analytical Report, Census of the Maldives – 2000 _______________________________________________________________________________________________________
_________________________________________________________________________ Age and Sex Composition of the Population
population will increase and will do so for sometime to come. Demographically this may
bring about a positive change in economic dependency ratios among the population but
unless the economic environment allows a nearly full participation of the working age
population, the actual burden of supporting a dependent population may remain the
same if not worse.
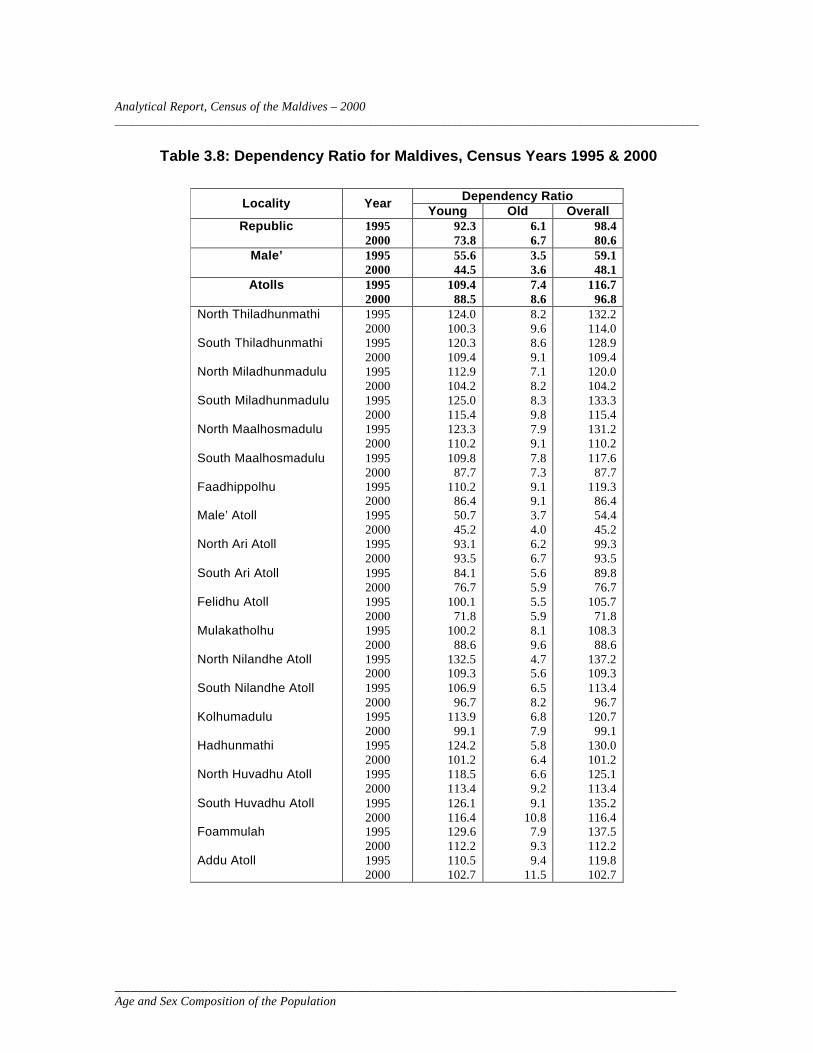
DEPENDENCY RATIO OF THE POPULATION BY RURAL AND URBAN AREAS
If we compare the dependency ratio for the capital and the atolls, it can be
viewed from the following Table 3.8
Analytical Report, Census of the Maldives – 2000 _______________________________________________________________________________________________________
_________________________________________________________________________ Age and Sex Composition of the Population
Table 3.8: Dependency Ratio for Maldives, Census Years 1995 & 2000
Dependency Ratio
Locality Year Young Old Overall
Republic 1995 2000
92.3 73.8
6.1 6.7
98.4 80.6
Male’ 1995 2000
55.6 44.5
3.5 3.6
59.1 48.1
Atolls 1995 2000
109.4 88.5
7.4 8.6
116.7 96.8
North Thiladhunmathi South Thiladhunmathi North Miladhunmadulu South Miladhunmadulu North Maalhosmadulu South Maalhosmadulu Faadhippolhu Male’ Atoll North Ari Atoll South Ari Atoll Felidhu Atoll Mulakatholhu North Nilandhe Atoll South Nilandhe Atoll Kolhumadulu Hadhunmathi North Huvadhu Atoll South Huvadhu Atoll Foammulah Addu Atoll
1995 2000 1995 2000 1995 2000 1995 2000 1995 2000 1995 2000 1995 2000 1995 2000 1995 2000 1995 2000 1995 2000 1995 2000 1995 2000 1995 2000 1995 2000 1995 2000 1995 2000 1995 2000 1995 2000 1995 2000
124.0 100.3 120.3 109.4 112.9 104.2 125.0 115.4 123.3 110.2 109.8
87.7 110.2
86.4 50.7 45.2 93.1 93.5 84.1 76.7
100.1 71.8
100.2 88.6
132.5 109.3 106.9
96.7 113.9
99.1 124.2 101.2 118.5 113.4 126.1 116.4 129.6 112.2 110.5 102.7
8.2 9.6 8.6 9.1 7.1 8.2 8.3 9.8 7.9 9.1 7.8 7.3 9.1 9.1 3.7 4.0 6.2 6.7 5.6 5.9 5.5 5.9 8.1 9.6 4.7 5.6 6.5 8.2 6.8 7.9 5.8 6.4 6.6 9.2 9.1
10.8 7.9 9.3 9.4
11.5
132.2 114.0 128.9 109.4 120.0 104.2 133.3 115.4 131.2 110.2 117.6
87.7 119.3
86.4 54.4 45.2 99.3 93.5 89.8 76.7
105.7 71.8
108.3 88.6
137.2 109.3 113.4
96.7 120.7
99.1 130.0 101.2 125.1 113.4 135.2 116.4 137.5 112.2 119.8 102.7
Analytical Report, Census of the Maldives – 2000 _______________________________________________________________________________________________________
_________________________________________________________________________ Age and Sex Composition of the Population
The decrease in overall dependency ratio observed for the Republic is also
observed for Male’, Atolls and at the atoll levels. It can be observed from the table that
the dependency ratio has decreased in all the atolls when compared with the 1995
Census results. On a locality basis, the lowest dependency ratio was observed in 2000
for the Male’ Atoll (45.2) when compared with the 54.4 in 1995. This is largely due to the
fact that the main tourism zone is located in the atoll. This attracts many working age
people to the atoll, in search of jobs, in the resorts. Felidhu Atoll came second with a
decrease in dependency ratio from 105.7 to 71.8 with South Ari Atoll next with a decline
in ratio from 89.8 to 76.7. The highest dependency ratio was observed for South
Huvadhu Atoll with 116.4. South Miladhunmadulu had the second highest dependency
ratio with 115.4 and North Thiladhunmadulu the third with 114.0. The most significant
change in dependency ratio is observed for Felidhu Atoll.
As expected, the dependency ratio is higher in the rural areas than in Male’ as
the proportion of children and older population is high in rural than the urban, while the
proportion of people in the productive age group is higher in the urban area than in rural
area. If we could bring about this change in the near future, the rural- urban differential
wouldn’t last long.
SEX COMPOSITION
Sex composition of the human population is one of the basic demographic
characteristics, which is extremely vital for any meaningful demographic analysis.
Changes in sex composition largely reflect the underlying socio-economic and cultural
patterns of a society in different ways. Sex ratio defined here as the number of females
per 100 males in the population, is an important social indicator to measure the extent
of prevailing equity between males and females in a society and influences directly the
incidence of marriage, birth, migration, economic activities, etc. Development
programmes may also have differential impact on male and females quality of life.
Analytical Report, Census of the Maldives – 2000 _______________________________________________________________________________________________________
_________________________________________________________________________ Age and Sex Composition of the Population
Only one indicator is used to study the sex composition of the population of
Maldives: i.e. sex ratio.
SEX RATIO
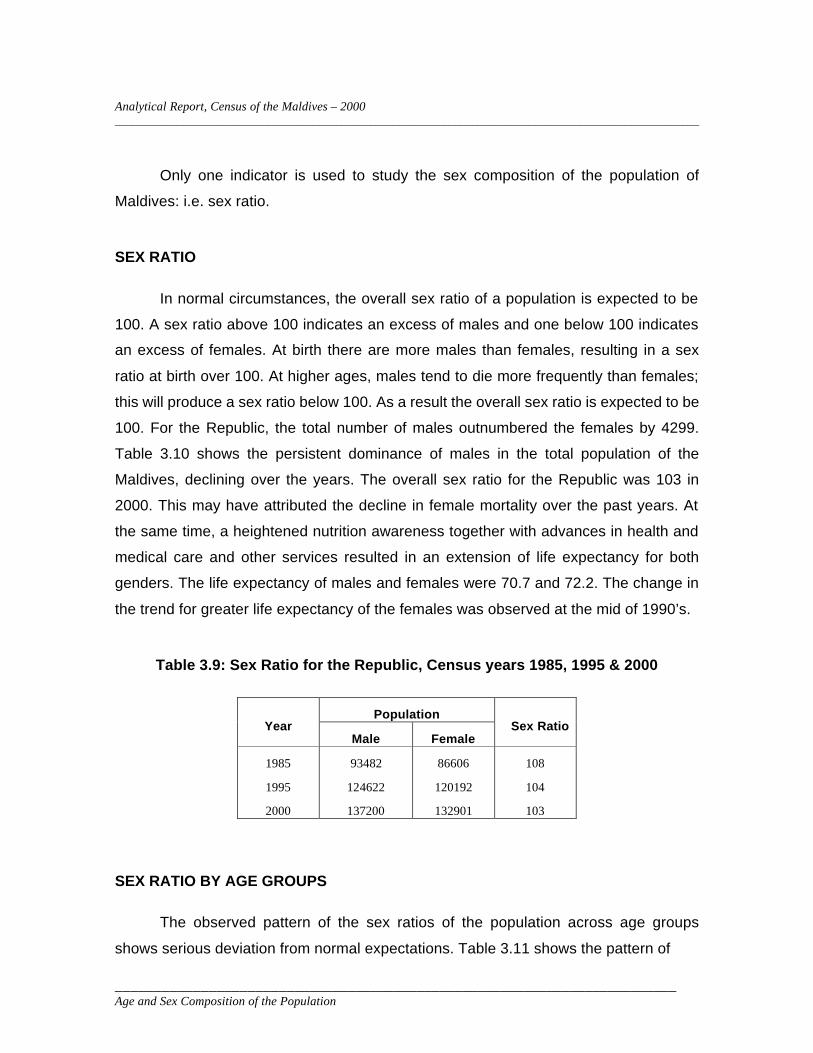
In normal circumstances, the overall sex ratio of a population is expected to be
100. A sex ratio above 100 indicates an excess of males and one below 100 indicates
an excess of females. At birth there are more males than females, resulting in a sex
ratio at birth over 100. At higher ages, males tend to die more frequently than females;
this will produce a sex ratio below 100. As a result the overall sex ratio is expected to be
100. For the Republic, the total number of males outnumbered the females by 4299.
Table 3.10 shows the persistent dominance of males in the total population of the
Maldives, declining over the years. The overall sex ratio for the Republic was 103 in
2000. This may have attributed the decline in female mortality over the past years. At
the same time, a heightened nutrition awareness together with advances in health and
medical care and other services resulted in an extension of life expectancy for both
genders. The life expectancy of males and females were 70.7 and 72.2. The change in
the trend for greater life expectancy of the females was observed at the mid of 1990’s.
Table 3.9: Sex Ratio for the Republic, Census years 1985, 1995 & 2000
Population Year
Male Female Sex Ratio
1985
1995
2000
93482
124622
137200
86606
120192
132901
108
104
103
SEX RATIO BY AGE GROUPS
The observed pattern of the sex ratios of the population across age groups
shows serious deviation from normal expectations. Table 3.11 shows the pattern of

Analytical Report, Census of the Maldives – 2000 _______________________________________________________________________________________________________
_________________________________________________________________________ Age and Sex Composition of the Population
these ratios derived from the enumerated population of the censuses 1985,1995 and
2000. In both the three years the pattern was the same- high at young ages, declining
to less than 100 at ages 15 to 35 and again excesses of males at the older ages. At
young ages the sex ratios are high as expected; that is, an excess number of males
primarily because at birth, more males babies are born. The short time within the
following age cohort, this excess of males are offset by the differential mortality rates. It
can be noticed that the sex ratio has gone down over the intercensal period of 1995-
2000. The increase in the deficit of females with the advancement of age may be
explained either in terms of increasing net higher emigration of females than males or
increasing excess risk of deaths among the females than among the males with the
advancement of the age.
Table 3.10
Sex Ratio by Five Year Age Groups.
Sex Ratios Age Groups
1985 1995 2000
0-4
5-9
10-14
15-19
20-24
25-29
30-34
35-39
40-44
45-49
50-54
55-59
60-64
65-69
70-74
75+
102
104
110
99
98
103
110
111
111
121
125
158
128
161
148
211
107
105
104
98
90
94
97
100
110
105
105
119
132
145
156
161
103
104
103
99
98
95
96
99
102
114
105
109
115
135
153
151
Analytical Report, Census of the Maldives – 2000 _______________________________________________________________________________________________________
_________________________________________________________________________ Age and Sex Composition of the Population
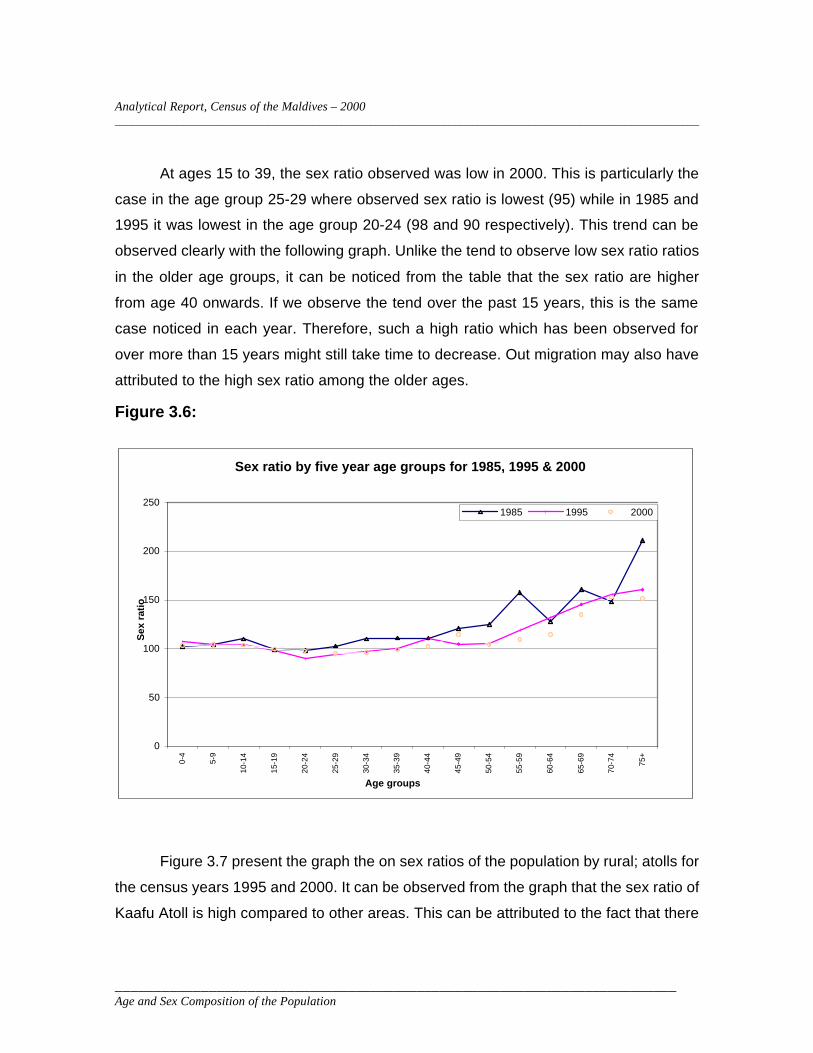
At ages 15 to 39, the sex ratio observed was low in 2000. This is particularly the
case in the age group 25-29 where observed sex ratio is lowest (95) while in 1985 and
1995 it was lowest in the age group 20-24 (98 and 90 respectively). This trend can be
observed clearly with the following graph. Unlike the tend to observe low sex ratio ratios
in the older age groups, it can be noticed from the table that the sex ratio are higher
from age 40 onwards. If we observe the tend over the past 15 years, this is the same
case noticed in each year. Therefore, such a high ratio which has been observed for
over more than 15 years might still take time to decrease. Out migration may also have
attributed to the high sex ratio among the older ages.
Figure 3.6:
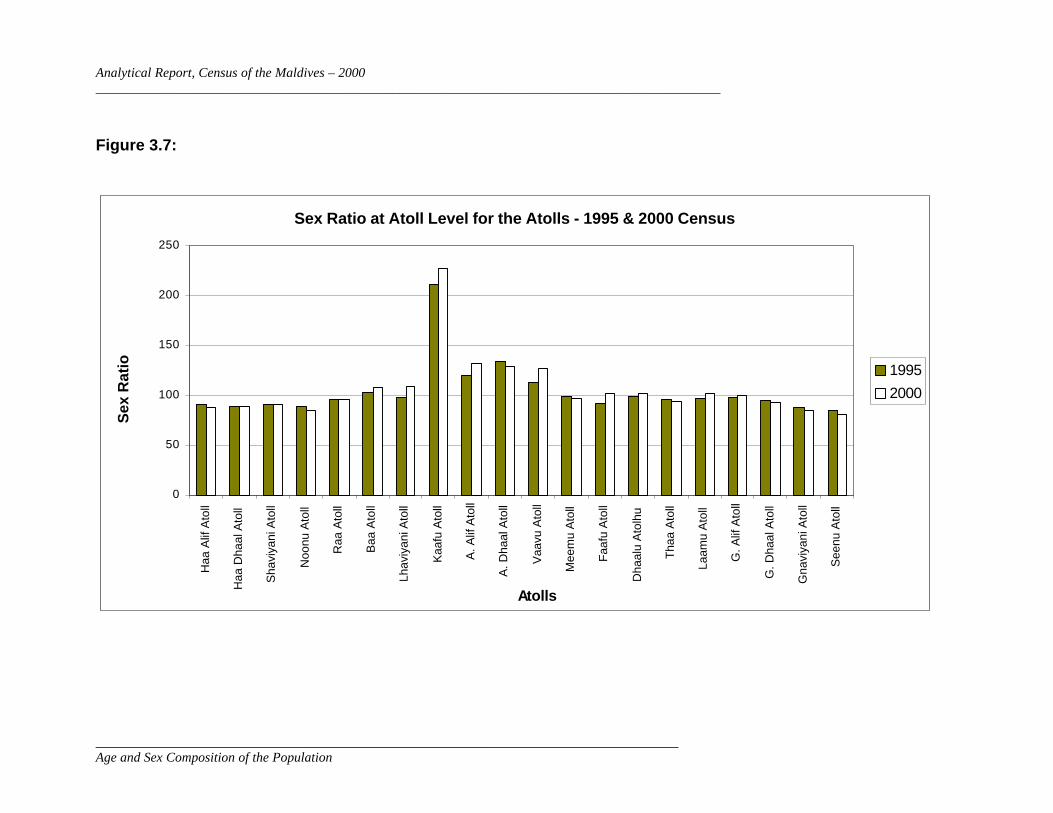
Figure 3.7 present the graph the on sex ratios of the population by rural; atolls for
the census years 1995 and 2000. It can be observed from the graph that the sex ratio of
Kaafu Atoll is high compared to other areas. This can be attributed to the fact that there
Sex ratio by five year age groups for 1985, 1995 & 2000
0
50
100
150
200
250
0-4
5-9
10-1
4
15-1
9
20-2
4
25-2
9
30-3
4
35-3
9
40-4
4
45-4
9
50-5
4
55-5
9
60-6
4
65-6
9
70-7
4
75+
Age groups
Sex
rat
io
1985 1995 2000
Analytical Report, Census of the Maldives – 2000 _______________________________________________________________________________________________________
_________________________________________________________________________ Age and Sex Composition of the Population
are excess of males in this atoll than females reflecting the concentration of
employment opportunities in this atoll.
Analytical Report, Census of the Maldives – 2000 _______________________________________________________________________________________________________
_________________________________________________________________________ Age and Sex Composition of the Population
Figure 3.7:
Sex Ratio at Atoll Level for the Atolls - 1995 & 2000 Census
0
50
100
150
200
250
Haa
Alif
Ato
ll
Haa
Dha
al A
toll
Sha
viya
ni A
toll
Noo
nu A
toll
Raa
Ato
ll
Baa
Ato
ll
Lhav
iyan
i Ato
ll
Kaa
fu A
toll
A. A
lif A
toll
A. D
haal
Ato
ll
Vaa
vu A
toll
Mee
mu
Ato
ll
Faa
fu A
toll
Dha
alu
Ato
lhu
Tha
a A
toll
Laam
u A
toll
G. A
lif A
toll
G. D
haal
Ato
ll
Gna
viya
ni A
toll
See
nu A
toll
Atolls
Sex
Rat
io 1995
2000
Analytical Report, Census of the Maldives – 2000 _______________________________________________________________________________________________________
____________________________________________________________________________ Age and Sex Composition of the Population
CONCLUSION
This chapter has evaluated the quality of age and sex data for the 2000
Population and Housing Census of Maldives. The first pertained only to age data and
evaluate the degree to which the Maldivians preferred or avoided in their census
response ages ending in certain digits. The Whipple’s Index, calculated showed virtually
no preference for ages or avoidance of such ages.
The population pyramid for the Census 2000 showed expectations for a
population in the future with the decline in fertility rate.
It was also focused on the dependency ratio. The Census 2000 showed a
dependency ratio of about 81 percent for the Republic. This showed that the
dependency ratio has improved over the past 5 years indicating the increased number
in the ’working age group’. A comparative analysis was also made on a regional basis
showing the highest dependency ratio for the South Miladhunmadulu Atoll.
The sex composition of a population refers to the distribution of the people by
sex. The calculated sex ratio for the country as a whole for the Census 2000 was 103.
This might have attributed to the decline in female mortality and current circumstances
in the country.