
Growth Strategies, Expansion strategies, Strategic management

Statistical Annex
56
Chapter Four
chapter four
ICT growth strategies

57World Information Society Report 2007
Box 4.1: National e-strategies in the WSIS Geneva Plan of Action
“The effective participation of governments and all stakeholders is vital in developing the Information Soci-ety requiring cooperation and partnerships among all of them.
a) Development of national e-strategies, including the necessary human capacity-building, should be encour-aged by all countries by 2005, taking into account different national circumstances.
b) Initiate at the national level a structured dialogue involving all relevant stakeholders, including through public/private partnerships, in devising e-strategies for the Information Society and for the exchange of best practices.
c) In developing and implementing national e-strategies, stakeholders should take into consideration local, regional and national needs and concerns. To maximize the benefits of initiatives undertaken, these should include the concept of sustainability. The private sector should be engaged in concrete projects to develop the Information Society at local, regional and national levels. …”
Source: WSIS Geneva Plan of Action, Para 8.
4.1 Introduction:Strategiesthatwork
The remarkable growth of the Information and Communication Technology (ICT) sector over the last two decades has transformed many economies. The drivers of economic growth have become more information-intensive and less dependent on natural resources. Affordable access to high-quality ICTs has become a key pri-ority for policy-makers and businesses. Chapter two of this report examined disparities in access to ICTs and Chapter three reviewed trends in the deployment of ICTs. In this chapter, the focus shifts to ICT growth strategies or “e-strategies” and what can be done to promote the adoption of ICTs. Case studies from different regions are used to illustrate ICT growth strategies and key ena-blers in the transition towards modern ICT-inten-sive economies.
The WSIS process recognized that the develop-ment of national e-strategies is the responsibility of all stakeholders, not just governments (Box 4.1). During the Geneva Phase of WSIS, stakeholders committed to developing national e-strategies by 2005 and to achieving the WSIS goals by 2015. Many economies already have national strategies for the ICT sector, telecommunications and/or information technology. National growth strate-gies are path-dependent and no two economies start from the same point. Furthermore, strate-gies vary according to social policy objectives, the market and policy tools adopted, the size of the economy, income and demographic distribution, among other factors. There is no “one-size-fits-all” strategy for creating digital opportunity. As the WSIS outcome documents makes clear, each coun-
try must set its own specific targets, in accordance with national development policies and taking into account national circumstances.1
Developing countries are often disadvantaged by limited infrastructure and human resources, insuf-ficient policy incentives and scarce investment, while the high cost of services and other barriers may constrain growth in ICTs. There is a close cor-relation between digital opportunity and GDP per capita: digital opportunity tends to be greater in wealthier economies, but digital opportunity can also generate wealth, resulting in a positive feed-back cycle.2 Where both digital opportunity and wealth are limited, as is the case in some LDCs, it can be difficult to break out of the trap of limited investment in infrastructure. For instance, there were only two economies—Turkmenistan and Zimbabwe—that experienced falls in their Digital Opportunity Index (DOI) scores, between 2004-2006. In each case, their GDP per capita also fell in USD terms.
Countries with similar levels of digital opportu-nity may experience different growth outcomes depending on their policies. In some cases, for instance, these disparities may result from the adoption (or failure to adopt) of a particular tech-nology.3 In certain cases, innovative technologies (or services) have been used by developing coun-tries to leapfrog—examples include China, which is moving directly to broadband Internet access without a large installed base of dial-up Internet users; and India, which moved directly to digital mobile service without investing first in analogue services. In general, developed countries benefit from the faster adoption and greater diffusion of new technologies, while developing countries often experience faster rates of growth (in per-centage terms).

Statistical Annex
58
Chapter Four
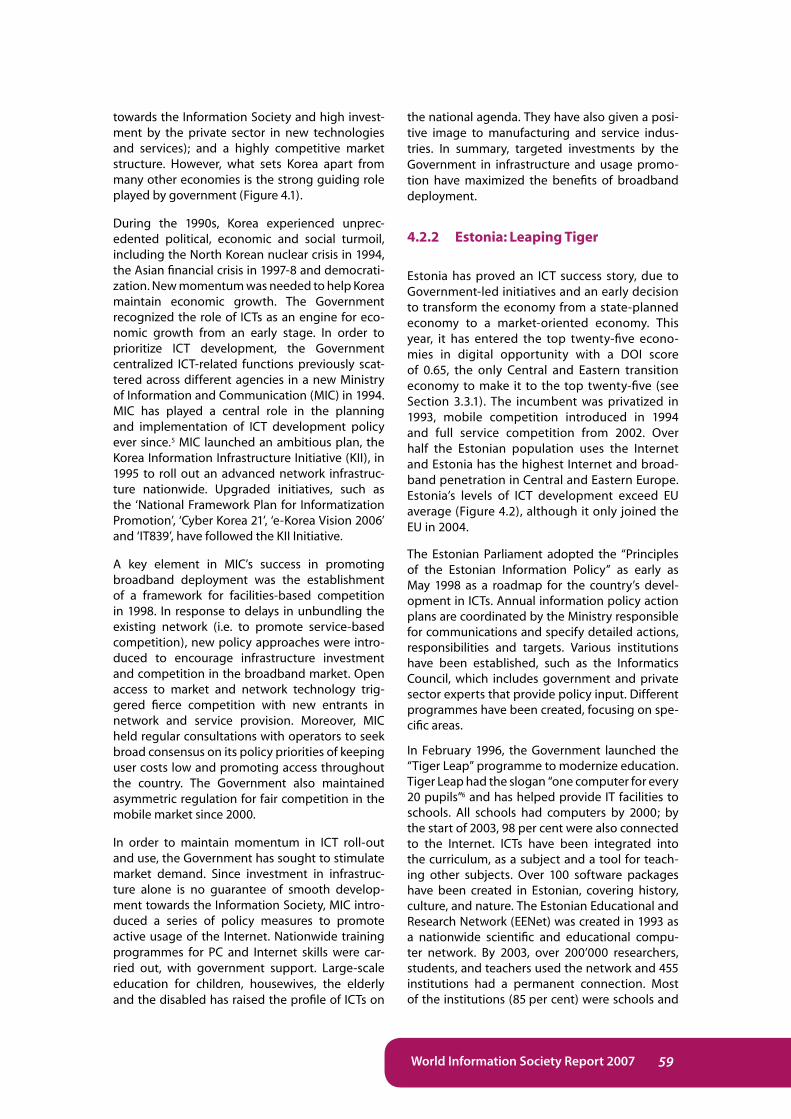
Figure 4.1: The Korean Government’s approach to public/private cooperation for ICT sector promotion
Source: Updated from ITU (2003) “Broadband Korea: Internet Case Study”, available at: www.itu.int/ITU-D/ict/cs/korea/material/CS_KOR.pdf.
As ICT policies and strategies are cross-cutting in nature, they are being mainstreamed into the frameworks for national strategies for develop-ment and poverty alleviation in many develop-ing countries.4 This chapter illustrates different ICT growth strategies using a range of country case studies. The chapter begins by examining the role for government in leadership (Section 4.2), before examining market liberalization and competition (Section 4.3) privatization (Section 4.4), regulatory reforms (Section 4.5), the promo-tion of infrastructure (Section 4.6), an enabling environment for investment (Section 4.7), before concluding with the need to establish human resource policies (Section 4.8).
4.2Whatroleforgovernment?
In market economies, both the public and pri-vate sector can promote digital opportunity. Government has an important role to play in establishing an enabling environment for invest-ment and market competition, as well as inter-vening to achieve socio-economic goals in areas where normal market incentives may be insuf-ficient to create balanced growth. In reality, the roles of governments and the private sector over-lap and include additional elements:
» First, positive incentives stimulating market dynamics: for instance, by establishing an enabling environment for investment, ensur-ing private sector participation or in promot-ing the take-up of broadband;
» Second, measures preventing uneven devel-opment (for example, by use of regulatory cri-teria or restrictions) or counteracting negative effects (for instance, by combating the rise of spam).
4.2.1 RepublicofKorea:Thegovernment’sroleinbroadbanddeployment
Despite disputes over the role of government in a market economy, government-led initiatives can promote successful ICT deployment. The Government of Korea’s successful deployment of broadband and its rapid transformation towards an Information Society is one notable example.
Ranked first in the DOI since 2002 (when it over-took Iceland: see Table 3 in the Statistical Annex), Korea’s success in digital opportunity is the result of a combination of: environmental factors (e.g. high literacy and school enrolment, tech-savvy consumers and a largely urbanized population); policy factors (e.g. a strong government push
National Basic Information System (1987 – 1996)
Korea Information Infrastructure Initiative (1995-2005)
Measures to nurture IT Industry(1987 – 1985)
CYBER KOREA 21(1999-2002)
E-Korea Vision 2006(2002-2006)
National Framework Plan forInformatization Promotion
(1996-2000)
Focus on manufacturing
Administration, defence , public
National information superhighway
Ten priority areasAnnual action plans
Vision of a creative knowledge -based society
Maximize ability of all citizens to use ICTs
IT 839 Strategy(2004-07)
Prepare for ubiquitous networksociety: improve competitiveness
59World Information Society Report 2007
towards the Information Society and high invest-ment by the private sector in new technologies and services); and a highly competitive market structure. However, what sets Korea apart from many other economies is the strong guiding role played by government (Figure 4.1).
During the 1990s, Korea experienced unprec-edented political, economic and social turmoil, including the North Korean nuclear crisis in 1994, the Asian financial crisis in 1997-8 and democrati-zation. New momentum was needed to help Korea maintain economic growth. The Government recognized the role of ICTs as an engine for eco-nomic growth from an early stage. In order to prioritize ICT development, the Government centralized ICT-related functions previously scat-tered across different agencies in a new Ministry of Information and Communication (MIC) in 1994. MIC has played a central role in the planning and implementation of ICT development policy ever since.5 MIC launched an ambitious plan, the Korea Information Infrastructure Initiative (KII), in 1995 to roll out an advanced network infrastruc-ture nationwide. Upgraded initiatives, such as the ‘National Framework Plan for Informatization Promotion’, ‘Cyber Korea 21’, ‘e-Korea Vision 2006’ and ‘IT839’, have followed the KII Initiative.
A key element in MIC’s success in promoting broadband deployment was the establishment of a framework for facilities-based competition in 1998. In response to delays in unbundling the existing network (i.e. to promote service-based competition), new policy approaches were intro-duced to encourage infrastructure investment and competition in the broadband market. Open access to market and network technology trig-gered fierce competition with new entrants in network and service provision. Moreover, MIC held regular consultations with operators to seek broad consensus on its policy priorities of keeping user costs low and promoting access throughout the country. The Government also maintained asymmetric regulation for fair competition in the mobile market since 2000.
In order to maintain momentum in ICT roll-out and use, the Government has sought to stimulate market demand. Since investment in infrastruc-ture alone is no guarantee of smooth develop-ment towards the Information Society, MIC intro-duced a series of policy measures to promote active usage of the Internet. Nationwide training programmes for PC and Internet skills were car-ried out, with government support. Large-scale education for children, housewives, the elderly and the disabled has raised the profile of ICTs on
the national agenda. They have also given a posi-tive image to manufacturing and service indus-tries. In summary, targeted investments by the Government in infrastructure and usage promo-tion have maximized the benefits of broadband deployment.
4.2.2 Estonia:LeapingTiger
Estonia has proved an ICT success story, due to Government-led initiatives and an early decision to transform the economy from a state-planned economy to a market-oriented economy. This year, it has entered the top twenty-five econo-mies in digital opportunity with a DOI score of 0.65, the only Central and Eastern transition economy to make it to the top twenty-five (see Section 3.3.1). The incumbent was privatized in 1993, mobile competition introduced in 1994 and full service competition from 2002. Over half the Estonian population uses the Internet and Estonia has the highest Internet and broad-band penetration in Central and Eastern Europe. Estonia’s levels of ICT development exceed EU average (Figure 4.2), although it only joined the EU in 2004.
The Estonian Parliament adopted the “Principles of the Estonian Information Policy” as early as May 1998 as a roadmap for the country’s devel-opment in ICTs. Annual information policy action plans are coordinated by the Ministry responsible for communications and specify detailed actions, responsibilities and targets. Various institutions have been established, such as the Informatics Council, which includes government and private sector experts that provide policy input. Different programmes have been created, focusing on spe-cific areas.
In February 1996, the Government launched the “Tiger Leap” programme to modernize education. Tiger Leap had the slogan “one computer for every 20 pupils”6 and has helped provide IT facilities to schools. All schools had computers by 2000; by the start of 2003, 98 per cent were also connected to the Internet. ICTs have been integrated into the curriculum, as a subject and a tool for teach-ing other subjects. Over 100 software packages have been created in Estonian, covering history, culture, and nature. The Estonian Educational and Research Network (EENet) was created in 1993 as a nationwide scientific and educational compu-ter network. By 2003, over 200’000 researchers, students, and teachers used the network and 455 institutions had a permanent connection. Most of the institutions (85 per cent) were schools and

Statistical Annex
60
Chapter Four
Figure 4.2: Selected Information Society indicators, Estonia, 2005
Source: EUROSTAT.
0
10
20
30
40
50
60
EU-15
EU-25
Estonia
Share of householdswith a broadband connection
Share of individualsregularly using the Internet
Pro
po
rtio
n (%
)
universities, but they also included public Internet access points, libraries and archives.
Estonia has also been successful in e-government and ranks 19th out of 191 countries in the UN’s global e-government report 20057, higher than any other Central or Eastern European nation. The Government comprised some 64 public agencies staffed by 21’400 people in 2003. Nearly all staff needing a PC with Internet access have it. Estonia ranks fourth in the EU for interactive government services8, while three-quarters of all Estonian Internet users file their income taxes online.
In rural areas, the law requires that Estonia’s 4’000 villages be connected to the PSTN network, if con-nection is technically possible. With mobile signal covering 99 per cent of the population, virtually all villages have access to voice services. The number of mobile subscriptions in Estonia has exceeded the population and, by the first quarter of 2005, 81 per cent of Estonian households had a mobile phone. In broadband, the KülaTee 3 (VillageWay 3) programme ensures that over 90 per cent of Estonian territory has broadband access, with the Government supporting broadband roll-out in rural areas. In community access, Estonia had 0.76 Public Internet Access Points (PIAPs) per 1’000 inhabitants in 2003, the highest among new EU member states. Government policy provides for free Internet access from PIAPs.
Tiger Leap is an apt name for Estonia’s school ICT programme and, indeed, applies to the whole
country. The nation has taken a giant leap forward in ICTs. The word “tiger” implies a connection to the Asian Tigers, where rapid economic growth has made them developed economies. In the same way, Estonia is a Baltic tiger whose ICT sector today is as strong as most developed nations.
4.3 Marketliberalizationandcompetition
Market-focused strategies allow governments to meet social and economic goals, such as increas-ing access to ICTs and revenue from telecommuni-cation services. Market reforms can boost produc-tivity and profitability and stimulate investment, enhancing the performance of the ICT sector. Sector reform includes: (1) market liberalization and competition; (2) private sector participation; and (3) effective regulation. Liberalized markets are generally more efficient than markets under government control, and they are more likely to generate greater benefits for consumers and businesses.
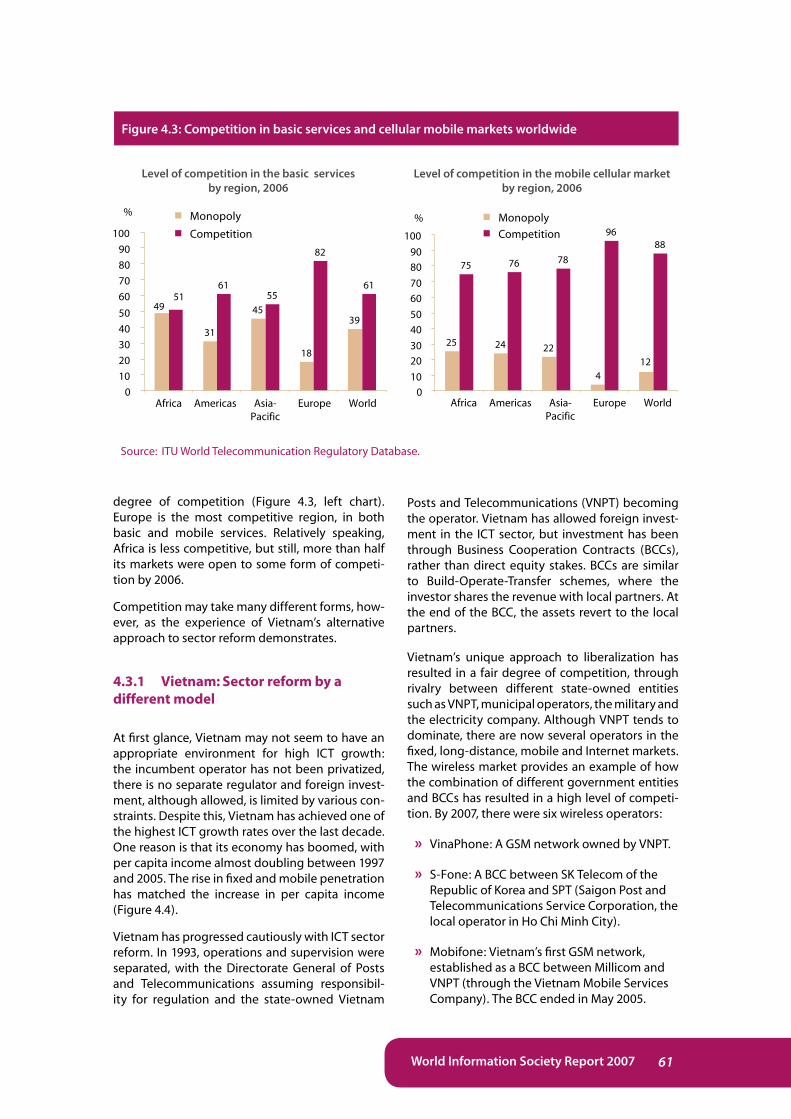
Mobile and Internet markets are generally more competitive than fixed line markets, due to the proliferation of multiple new, private entrants in these markets (Figure 4.3). Basic voice services are less competitive than mobile services, but still, over 60 per cent of the world’s economies have opened up their basic services market to some
61World Information Society Report 2007
Figure 4.3: Competition in basic services and cellular mobile markets worldwide
Source: ITU World Telecommunication Regulatory Database.
Level of competition in the mobile cellular market by region, 2006
Level of competition in the basic services by region, 2006
31
45
18
39
6155
82
61
4951
0
10
20
30
40
50
60
70
80
90
100
Africa Americas Asia-Pacific
Europe World
Monopoly
Competition
%
degree of competition (Figure 4.3, left chart). Europe is the most competitive region, in both basic and mobile services. Relatively speaking, Africa is less competitive, but still, more than half its markets were open to some form of competi-tion by 2006.
Competition may take many different forms, how-ever, as the experience of Vietnam’s alternative approach to sector reform demonstrates.
4.3.1 Vietnam:Sectorreformbyadifferentmodel
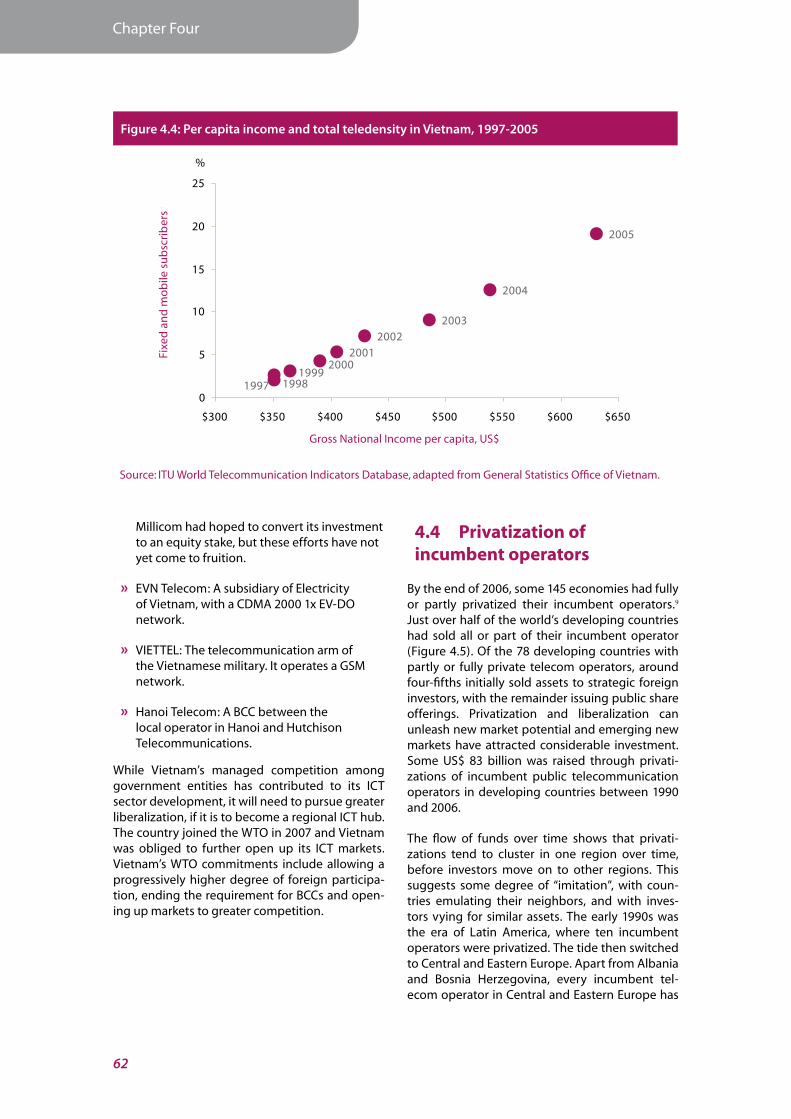
At first glance, Vietnam may not seem to have an appropriate environment for high ICT growth: the incumbent operator has not been privatized, there is no separate regulator and foreign invest-ment, although allowed, is limited by various con-straints. Despite this, Vietnam has achieved one of the highest ICT growth rates over the last decade. One reason is that its economy has boomed, with per capita income almost doubling between 1997 and 2005. The rise in fixed and mobile penetration has matched the increase in per capita income (Figure 4.4).
Vietnam has progressed cautiously with ICT sector reform. In 1993, operations and supervision were separated, with the Directorate General of Posts and Telecommunications assuming responsibil-ity for regulation and the state-owned Vietnam
Posts and Telecommunications (VNPT) becoming the operator. Vietnam has allowed foreign invest-ment in the ICT sector, but investment has been through Business Cooperation Contracts (BCCs), rather than direct equity stakes. BCCs are similar to Build-Operate-Transfer schemes, where the investor shares the revenue with local partners. At the end of the BCC, the assets revert to the local partners.
Vietnam’s unique approach to liberalization has resulted in a fair degree of competition, through rivalry between different state-owned entities such as VNPT, municipal operators, the military and the electricity company. Although VNPT tends to dominate, there are now several operators in the fixed, long-distance, mobile and Internet markets. The wireless market provides an example of how the combination of different government entities and BCCs has resulted in a high level of competi-tion. By 2007, there were six wireless operators:
» VinaPhone: A GSM network owned by VNPT.
» S-Fone: A BCC between SK Telecom of the Republic of Korea and SPT (Saigon Post and Telecommunications Service Corporation, the local operator in Ho Chi Minh City).
» Mobifone: Vietnam’s first GSM network, established as a BCC between Millicom and VNPT (through the Vietnam Mobile Services Company). The BCC ended in May 2005.
25 24 22
412
75 76 78
9688
0
10
20
30
40
50
60
70
80
90
100
Monopoly
Competition
%
Africa Americas Asia-Pacific
Europe World
Statistical Annex
62
Chapter Four
20002001
20022003
19991997 1998
2004
2005
0
5
10
15
20
25
$300 $350 $400 $450 $500 $550 $600 $650
Gross National Income per capita, US$
Fixe
d a
nd
mo
bile
su
bsc
rib
ers
per
100
inh
abit
ants
Figure 4.4: Per capita income and total teledensity in Vietnam, 1997-2005
Source: ITU World Telecommunication Indicators Database, adapted from General Statistics Office of Vietnam.
%
Millicom had hoped to convert its investment to an equity stake, but these efforts have not yet come to fruition.
» EVN Telecom: A subsidiary of Electricity of Vietnam, with a CDMA 2000 1x EV-DO network.
» VIETTEL: The telecommunication arm of the Vietnamese military. It operates a GSM network.
» Hanoi Telecom: A BCC between the local operator in Hanoi and Hutchison Telecommunications.
While Vietnam’s managed competition among government entities has contributed to its ICT sector development, it will need to pursue greater liberalization, if it is to become a regional ICT hub. The country joined the WTO in 2007 and Vietnam was obliged to further open up its ICT markets. Vietnam’s WTO commitments include allowing a progressively higher degree of foreign participa-tion, ending the requirement for BCCs and open-ing up markets to greater competition.
4.4 Privatizationofincumbentoperators
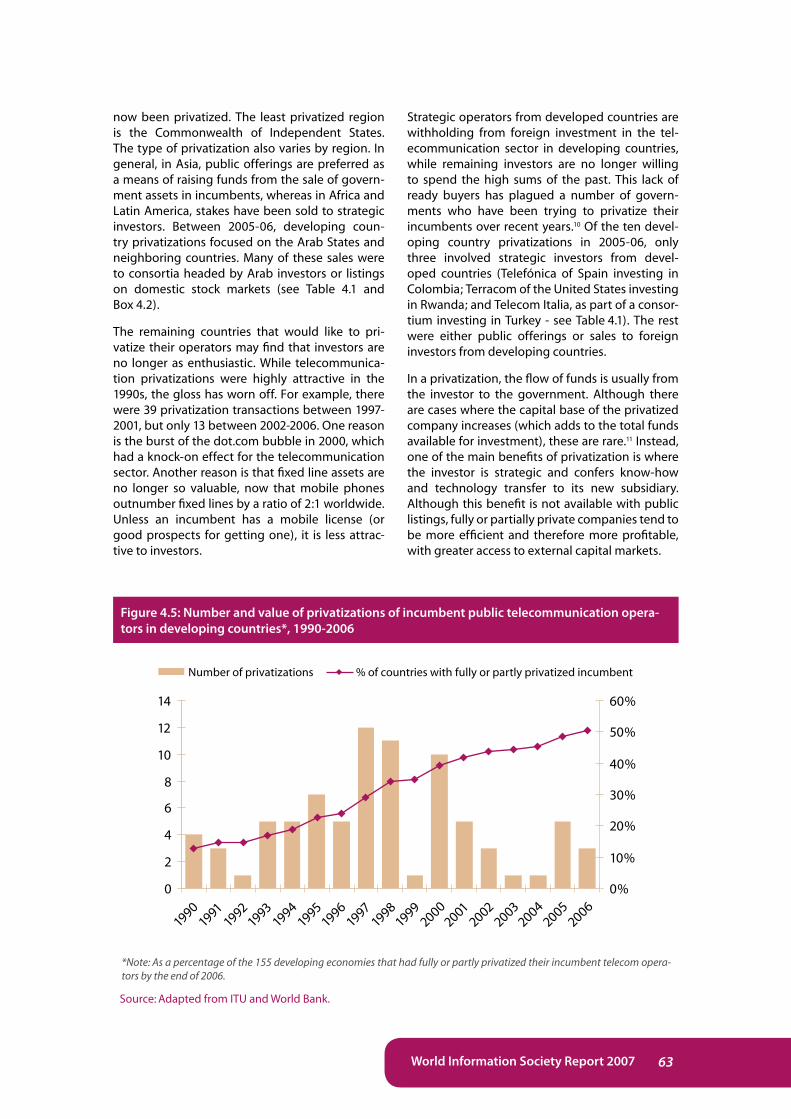
By the end of 2006, some 145 economies had fully or partly privatized their incumbent operators.9
Just over half of the world’s developing countries had sold all or part of their incumbent operator (Figure 4.5). Of the 78 developing countries with partly or fully private telecom operators, around four-fifths initially sold assets to strategic foreign investors, with the remainder issuing public share offerings. Privatization and liberalization can unleash new market potential and emerging new markets have attracted considerable investment. Some US$ 83 billion was raised through privati-zations of incumbent public telecommunication operators in developing countries between 1990 and 2006.
The flow of funds over time shows that privati-zations tend to cluster in one region over time, before investors move on to other regions. This suggests some degree of “imitation”, with coun-tries emulating their neighbors, and with inves-tors vying for similar assets. The early 1990s was the era of Latin America, where ten incumbent operators were privatized. The tide then switched to Central and Eastern Europe. Apart from Albania and Bosnia Herzegovina, every incumbent tel-ecom operator in Central and Eastern Europe has
63World Information Society Report 2007
0
2
4
6
8
10
12
14
19901991
19921993
19941995
19961997
19981999
20002001
20022003
20042005
2006
0%
10%
20%
30%
40%
50%
60%
Figure 4.5: Number and value of privatizations of incumbent public telecommunication opera-tors in developing countries*, 1990-2006
Source: Adapted from ITU and World Bank.
*Note: As a percentage of the 155 developing economies that had fully or partly privatized their incumbent telecom opera-tors by the end of 2006.
Number of privatizations % of countries with fully or partly privatized incumbent
now been privatized. The least privatized region is the Commonwealth of Independent States. The type of privatization also varies by region. In general, in Asia, public offerings are preferred as a means of raising funds from the sale of govern-ment assets in incumbents, whereas in Africa and Latin America, stakes have been sold to strategic investors. Between 2005-06, developing coun-try privatizations focused on the Arab States and neighboring countries. Many of these sales were to consortia headed by Arab investors or listings on domestic stock markets (see Table 4.1 and Box 4.2).
The remaining countries that would like to pri-vatize their operators may find that investors are no longer as enthusiastic. While telecommunica-tion privatizations were highly attractive in the 1990s, the gloss has worn off. For example, there were 39 privatization transactions between 1997-2001, but only 13 between 2002-2006. One reason is the burst of the dot.com bubble in 2000, which had a knock-on effect for the telecommunication sector. Another reason is that fixed line assets are no longer so valuable, now that mobile phones outnumber fixed lines by a ratio of 2:1 worldwide. Unless an incumbent has a mobile license (or good prospects for getting one), it is less attrac-tive to investors.
Strategic operators from developed countries are withholding from foreign investment in the tel-ecommunication sector in developing countries, while remaining investors are no longer willing to spend the high sums of the past. This lack of ready buyers has plagued a number of govern-ments who have been trying to privatize their incumbents over recent years.10 Of the ten devel-oping country privatizations in 2005-06, only three involved strategic investors from devel-oped countries (Telefónica of Spain investing in Colombia; Terracom of the United States investing in Rwanda; and Telecom Italia, as part of a consor-tium investing in Turkey - see Table 4.1). The rest were either public offerings or sales to foreign investors from developing countries.
In a privatization, the flow of funds is usually from the investor to the government. Although there are cases where the capital base of the privatized company increases (which adds to the total funds available for investment), these are rare.11 Instead, one of the main benefits of privatization is where the investor is strategic and confers know-how and technology transfer to its new subsidiary. Although this benefit is not available with public listings, fully or partially private companies tend to be more efficient and therefore more profitable, with greater access to external capital markets.
Statistical Annex
64
Chapter Four
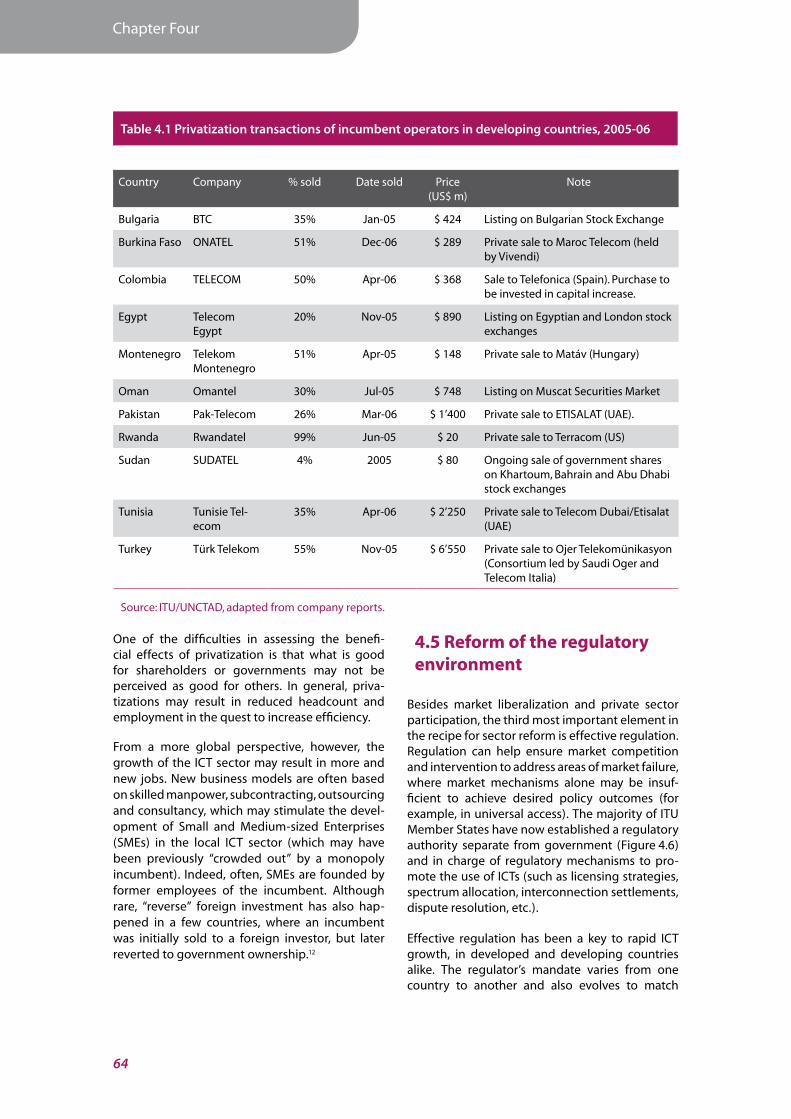
Source: ITU/UNCTAD, adapted from company reports.
Table 4.1 Privatization transactions of incumbent operators in developing countries, 2005-06
Country Company % sold Date sold Price(US$ m)
Note
Bulgaria BTC 35% Jan-05 $ 424 Listing on Bulgarian Stock Exchange
Burkina Faso ONATEL 51% Dec-06 $ 289 Private sale to Maroc Telecom (held by Vivendi)
Colombia TELECOM 50% Apr-06 $ 368 Sale to Telefonica (Spain). Purchase to be invested in capital increase.
Egypt Telecom Egypt
20% Nov-05 $ 890 Listing on Egyptian and London stock exchanges
Montenegro Telekom Montenegro
51% Apr-05 $ 148 Private sale to Matáv (Hungary)
Oman Omantel 30% Jul-05 $ 748 Listing on Muscat Securities Market
Pakistan Pak-Telecom 26% Mar-06 $ 1’400 Private sale to ETISALAT (UAE).
Rwanda Rwandatel 99% Jun-05 $ 20 Private sale to Terracom (US)
Sudan SUDATEL 4% 2005 $ 80 Ongoing sale of government shares on Khartoum, Bahrain and Abu Dhabi stock exchanges
Tunisia Tunisie Tel-ecom
35% Apr-06 $ 2’250 Private sale to Telecom Dubai/Etisalat (UAE)
Turkey Türk Telekom 55% Nov-05 $ 6’550 Private sale to Ojer Telekomünikasyon (Consortium led by Saudi Oger and Telecom Italia)
One of the difficulties in assessing the benefi-cial effects of privatization is that what is good for shareholders or governments may not be perceived as good for others. In general, priva-tizations may result in reduced headcount and employment in the quest to increase efficiency.
From a more global perspective, however, the growth of the ICT sector may result in more and new jobs. New business models are often based on skilled manpower, subcontracting, outsourcing and consultancy, which may stimulate the devel-opment of Small and Medium-sized Enterprises (SMEs) in the local ICT sector (which may have been previously “crowded out” by a monopoly incumbent). Indeed, often, SMEs are founded by former employees of the incumbent. Although rare, “reverse” foreign investment has also hap-pened in a few countries, where an incumbent was initially sold to a foreign investor, but later reverted to government ownership.12
4.5Reformoftheregulatoryenvironment
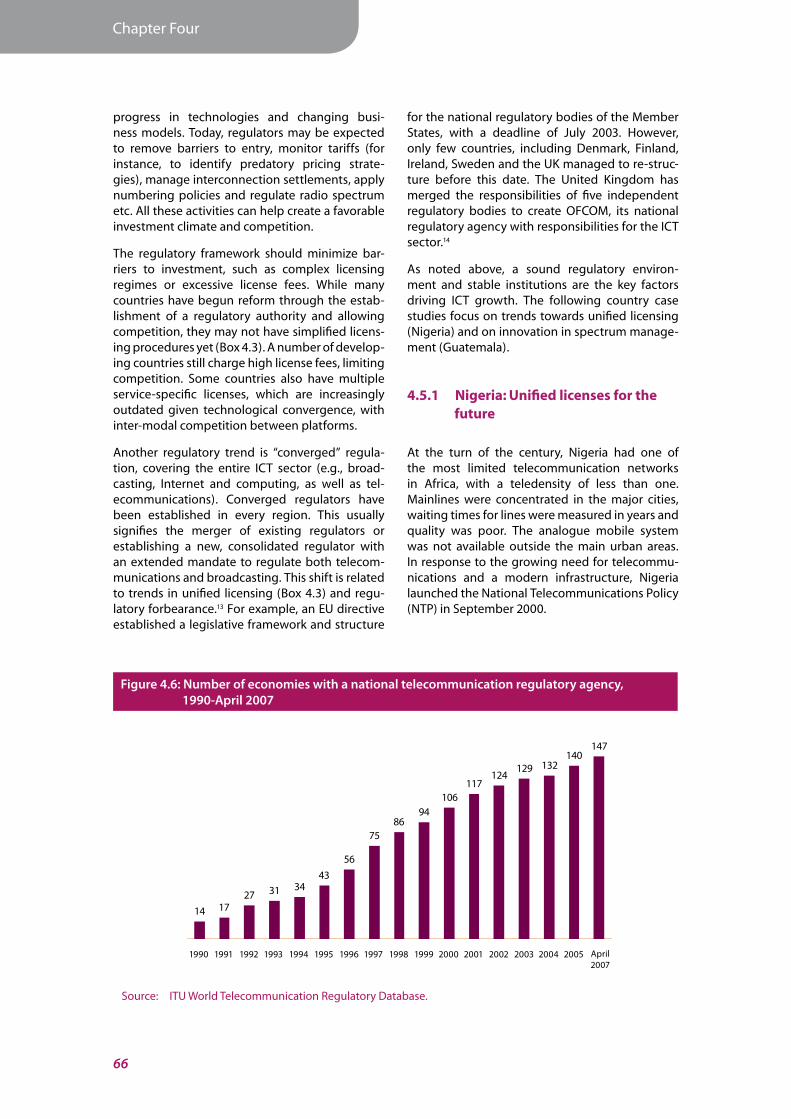
Besides market liberalization and private sector participation, the third most important element in the recipe for sector reform is effective regulation. Regulation can help ensure market competition and intervention to address areas of market failure, where market mechanisms alone may be insuf-ficient to achieve desired policy outcomes (for example, in universal access). The majority of ITU Member States have now established a regulatory authority separate from government (Figure 4.6) and in charge of regulatory mechanisms to pro-mote the use of ICTs (such as licensing strategies, spectrum allocation, interconnection settlements, dispute resolution, etc.).
Effective regulation has been a key to rapid ICT growth, in developed and developing countries alike. The regulator’s mandate varies from one country to another and also evolves to match

65World Information Society Report 2007
Box 4.2: Privatization and FDI in the Moroccan telecom sector
Morocco is a good example of Foreign Direct Investment (FDI) in the telecommunication sector, as it has experienced both incumbent privatization to a strategic foreign operator, as well as foreign investment in a new mobile operator. It also illustrates the emerging trend of South-South FDI.
The government-owned incumbent operator, Maroc Telecom, was partially privatized in 2001, when 35 per cent of the operator was sold to Vivendi of France for US$ 2.1 billion. This amount reverted to the Moroccan government, so there was no actual increase in capital expenditure from the foreign investor. Maroc Telecom was later listed on the Casablanca and Paris Stock Exchanges in 2004, when 14.9 per cent of government holdings were floated for US$ 1 billion. Again, the money reverted to the state, with no actual increase in the company’s capital. In 2005, Vivendi acquired an additional 16 per cent of government shares for US$ 1.4 bil-lion, with the purchase price going to the government. Furthermore, half of the amount paid by Vivendi was to be raised from Moroccan capital markets, resulting in local investment, rather than foreign.
Vivendi has accrued significant financial benefits from its investment in Maroc Telecom. Maroc Telecom has not taken on any new debt since privatization and has been reducing its old, pre-purchase debt. Maroc Tel-ecom has proved financially robust, generating dividends every year since privatization. Indeed, Vivendi’s share of accumulated dividends since purchase was US$ 700 million and the market value of its holdings (based on the share price of December 2005) was around US$ 5 billion, a premium of US$ 3.5 billion over its initial investments.
Maroc Telecom has also emerged as a strategic foreign investor in its own right. It purchased 54 per cent of Mauritel, the incumbent operator of Mauritania, for US$ 48 million in 2001 and paid US$ 289 million in late 2006 for 51 per cent of ONATEL, the incumbent operator in Burkina Faso. This was followed by the purchase of 51 per cent of Gabon Telecom for US$ 80 million in February 2007.
In addition to privatizing Marco Telecom, Morocco has also injected foreign investment into its telecommu-nication sector through the licensing of new operators. In 1999, a consortium comprising Telefónica of Spain, Portugal Telecom and local investors formed Médi Telecom and paid US$ 1.1 billion for Morocco’s second mobile license. The results have been impressive, with mobile penetration rising from just 1 per cent in 1999 to 41 per cent in 2005. Médi Telecom won the bid for Morocco’s second fixed license in 2005, paying US$ 8.3 million.
In total, the Moroccan government has earned around US$ 5.6 billion from privatization receipts and license fees paid by foreign investors in the 7-year period between 1999 and February 2007, while outgoing FDI amounted to US$ 417m (Box Figure 4.2). Morocco’s privatization policy has also boosted its ICT sector and Morocco scored the highest rise in DOI scores between 2004 and 2006 (see Table 3.3 and Box 3.1).
-$500
$0
$500
$1'000
$1'500
$2'000
$2'500
1999 2000 2001 2002 2003 2004 2005 2006 2007
Incoming FDI
Outgoing FDI
Source: Adapted from Vivendi, Maroc Telecom and ANRT.
Box Figure 4.2: Receipts by the Moroccan government from Foreign Direct Investment (FDI) in the telecommunication sector, 1999-February 2007
Note: Figures for 2007 relate to the first quarter only.
Statistical Annex
66
Chapter Four
Figure 4.6: Number of economies with a national telecommunication regulatory agency, 1990-April 2007
Source: ITU World Telecommunication Regulatory Database.
progress in technologies and changing busi-ness models. Today, regulators may be expected to remove barriers to entry, monitor tariffs (for instance, to identify predatory pricing strate-gies), manage interconnection settlements, apply numbering policies and regulate radio spectrum etc. All these activities can help create a favorable investment climate and competition.
The regulatory framework should minimize bar-riers to investment, such as complex licensing regimes or excessive license fees. While many countries have begun reform through the estab-lishment of a regulatory authority and allowing competition, they may not have simplified licens-ing procedures yet (Box 4.3). A number of develop-ing countries still charge high license fees, limiting competition. Some countries also have multiple service-specific licenses, which are increasingly outdated given technological convergence, with inter-modal competition between platforms.
Another regulatory trend is “converged” regula-tion, covering the entire ICT sector (e.g., broad-casting, Internet and computing, as well as tel-ecommunications). Converged regulators have been established in every region. This usually signifies the merger of existing regulators or establishing a new, consolidated regulator with an extended mandate to regulate both telecom-munications and broadcasting. This shift is related to trends in unified licensing (Box 4.3) and regu-latory forbearance.13 For example, an EU directive established a legislative framework and structure
for the national regulatory bodies of the Member States, with a deadline of July 2003. However, only few countries, including Denmark, Finland, Ireland, Sweden and the UK managed to re-struc-ture before this date. The United Kingdom has merged the responsibilities of five independent regulatory bodies to create OFCOM, its national regulatory agency with responsibilities for the ICT sector.14
As noted above, a sound regulatory environ-ment and stable institutions are the key factors driving ICT growth. The following country case studies focus on trends towards unified licensing (Nigeria) and on innovation in spectrum manage-ment (Guatemala).
4.5.1 Nigeria:Unifiedlicensesforthefuture
At the turn of the century, Nigeria had one of the most limited telecommunication networks in Africa, with a teledensity of less than one. Mainlines were concentrated in the major cities, waiting times for lines were measured in years and quality was poor. The analogue mobile system was not available outside the main urban areas. In response to the growing need for telecommu-nications and a modern infrastructure, Nigeria launched the National Telecommunications Policy (NTP) in September 2000.
14 1727 31 34
43
56
7586
94106
117124
129 132140
147
1990 1991 1992 1993 1994 1995 1996 1997 1998 1999 2000 2001 2002 2003 2004 2005 April 2007
67World Information Society Report 2007
Box 4.3: Licensing regimes
Licensing frameworks traditionally comprised a large number of different service and technology categories. Many countries used either individual licenses, class licenses or open entry to regulate telecommunications networks and services. Applicants had to apply for separate licenses in order to provide each service. Indi-vidual licenses can provide a higher degree of regulatory control over market entry, mainly in the case of tar-geted economic promotion policy or scarce resources (spectrum, numbering). Convergence transformed this categorization and regulators are optimizing licenses and simplifying licensing regimes. A growing number of regulators are adopting alternative approaches to rationalize the licensing regime,, including:
1. General License Categories and Technology Neutrality: the underlying licensing reform is to introduce technology-neutral licenses that combine converged services or broaden the types of services that fall within a single license (“class licenses”).
In Malaysia, the licensing framework previously consisted of 31 service-based licenses. Its new framework consists of four general and technology-neutral licenses: Network Facilities Provider (NFP); Network Services Provider (NSP); Application Services Provider (ASP); and Content Application Services (CSP - a special subset of application services that includes television and radio broadcast services and Internet content services).
2. Unified Licensing: under this regime, licenses are amalgamated into a single license covering a wide range of services.
In Kenya, the new licensing regime announced in September 2004 adopts a unified and technology-neutral licensing framework that allows any form of communications infrastructure to be used for any type of com-munications service. This licensing regime is simpler than the previous service-specific licensing regime (con-sisting of 46 types of licenses grouped into nine categories). Kenya is introducing its new regime gradually and has established a transition period during which it will issue three types of technology-neutral licenses i.e., individual network operator (major) licenses, non-facility based service provider (minor) licenses, and fre-quency licenses, before moving to its full unified licensing regime.
3. De-licensing: Many countries have moved towards a general authorization regime, in which operators are free to provide services subject to regulatory obligations. Typically, the operator must notify the regulator before, or shortly after, initiating service. However, operators do not have to wait for approval before com-mencing service.
The member states of the EU are moving to a simple authorization regime using minimal regulatory inter-vention and requiring individual licenses only where strictly necessary (e.g., for the use of scarce resources such as radio frequencies and numbering). The regime covers authorization of all electronic communications networks and services, regardless of whether or not they are provided to the public.
4. Eliminating License Requirements on New Converged Services: another way of addressing convergence is to eliminate filing requirements with the regulator on the basis that the services fall outside of the regula-tor’s authority or because the regulator has decided to forbear from regulating a particular service.
The US followed this approach for ISPs offering email, Internet access and VoIP services. Services provided by ISPs are treated as unregulated “information services” to promote the development of the Internet.
5. Adherence to Regulatory Requirements and Obligations: as many regulatory functions were based on a license at inception, the move to forbear from licensing is viewed by some as eroding the regulator’s au-thority over new entrants, leading to a license being issued, even when regulatory oversight is no longer required. Although a regulator may decide that certain categories of service or network providers are exempt from licensing requirements, regulators may still impose certain regulatory obligations on such providers (e.g., contributions towards universal service funds or compliance with emergency service requirements). For instance, although the FCC (the US regulator) has not implemented licensing, notification or registration requirements for ISPs, it has determined that certain VoIP providers must comply with emergency number (E911) requirements. This determination is part of a rule-making proceeding that was initiated by the FCC to determine whether VoIP services should be regulated and whether providers of such services should be subject to certain regulatory requirements.
Source: ITU/infoDev ICT Regulation Toolkit, available at www.ictregulationtoolkit.org/en/Section.2091.html.
Statistical Annex
68
Chapter Four
0
10
20
30
40
50
60
70
80
90
100
2000 2001 2002 2003 2004 2005 juin.06
Mo
bile
po
pu
lati
on
co
vera
ge
(%)
0
5
10
15
20
25
30
Mo
bile
su
bsc
rib
ers
per
100
in
hab
ita n
ts
Mobile population coverage (%) Mobile subscribers per 100 inhabitants
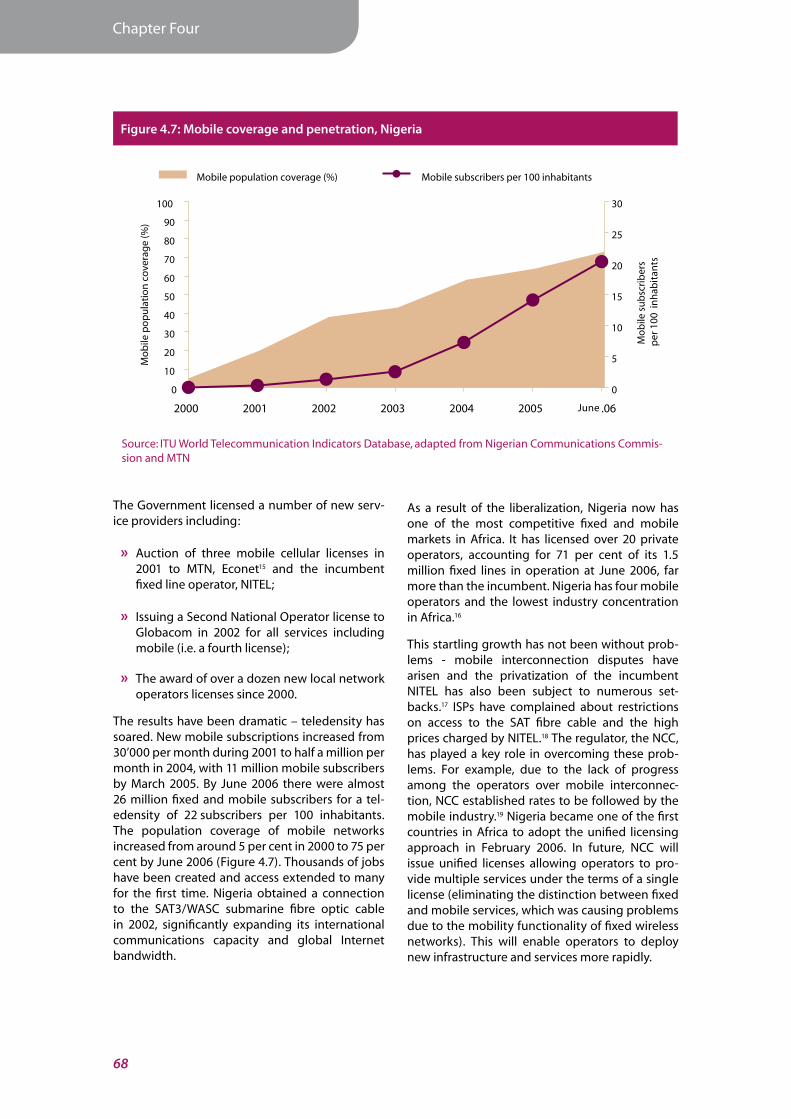
Figure 4.7: Mobile coverage and penetration, Nigeria
Source: ITU World Telecommunication Indicators Database, adapted from Nigerian Communications Commis-sion and MTN
The Government licensed a number of new serv-ice providers including:
» Auction of three mobile cellular licenses in 2001 to MTN, Econet15 and the incumbent fixed line operator, NITEL;
» Issuing a Second National Operator license to Globacom in 2002 for all services including mobile (i.e. a fourth license);
» The award of over a dozen new local network operators licenses since 2000.
The results have been dramatic – teledensity has soared. New mobile subscriptions increased from 30’000 per month during 2001 to half a million per month in 2004, with 11 million mobile subscribers by March 2005. By June 2006 there were almost 26 million fixed and mobile subscribers for a tel-edensity of 22 subscribers per 100 inhabitants. The population coverage of mobile networks increased from around 5 per cent in 2000 to 75 per cent by June 2006 (Figure 4.7). Thousands of jobs have been created and access extended to many for the first time. Nigeria obtained a connection to the SAT3/WASC submarine fibre optic cable in 2002, significantly expanding its international communications capacity and global Internet bandwidth.
As a result of the liberalization, Nigeria now has one of the most competitive fixed and mobile markets in Africa. It has licensed over 20 private operators, accounting for 71 per cent of its 1.5 million fixed lines in operation at June 2006, far more than the incumbent. Nigeria has four mobile operators and the lowest industry concentration in Africa.16
This startling growth has not been without prob-lems - mobile interconnection disputes have arisen and the privatization of the incumbent NITEL has also been subject to numerous set-backs.17 ISPs have complained about restrictions on access to the SAT fibre cable and the high prices charged by NITEL.18 The regulator, the NCC, has played a key role in overcoming these prob-lems. For example, due to the lack of progress among the operators over mobile interconnec-tion, NCC established rates to be followed by the mobile industry.19 Nigeria became one of the first countries in Africa to adopt the unified licensing approach in February 2006. In future, NCC will issue unified licenses allowing operators to pro-vide multiple services under the terms of a single license (eliminating the distinction between fixed and mobile services, which was causing problems due to the mobility functionality of fixed wireless networks). This will enable operators to deploy new infrastructure and services more rapidly.
June

69World Information Society Report 2007
0
5
10
15
20
25
30
35
40
El Salvador
Nicaragua
Honduras
Guatemala
Costa Rica
20052004200320022001200019991998199719961995
Figure 4.8: Mobile subscribers per 100 inhabitants, Central America
Source: ITU World Telecommunication Indicators Database, adapted from regulatory and operator reports.
Mo
bile
su
bsc
rib
ers
per
100
in
hab
itan
ts4.5.2 Guatemala:Spectruminnovator
In 1996, Guatemala signed peace accords. That same year, it also introduced sector reforms with its new General Telecommunications Law20 mini-mizing license conditions, eliminating investment requirements and ending price controls. A regu-lator was created, the Superintendent’s Office of Telecommunications (SIT), as well as a fund for rural telecommunications. One of the most innova-tive outcomes of the General Telecommunications Law was a new spectrum regime.
Under the law, spectrum is assigned through “Frequency Usufruct Titles” (TUFs). The TUF is valid during 15 years, during which owners can lease, sell, subdivide or consolidate spectrum, without actually owning it. The TUFs are auctioned by the SIT. 4’000 TUFs have been issued (with about half through auction) and almost the entire spectrum is in use. The TUF is a certificate containing infor-mation about the spectrum pertaining to it:
» range of frequencies;
» hours of operation;
» maximum power transmitted;
» maximum power emitted at the border of adjacent frequencies;
» geographic coverage;
» date of issue and expiry.
The back of the TUF is for endorsements, required whenever it is traded. The SIT maintains an inven-tory of assigned frequencies on its website.21
The country has also licensed several mobile oper-ators. Guatemala’s first mobile telephone operator, Comcel, started in 1990. It held a monopoly until 1999, when two additional operators (Telefónica of Spain and TELGUA, the incumbent fixed line operator) were licensed, following the telecom reforms of 1996. A fourth operator, BellSouth, began operations in 2001, but it was acquired by Telefónica in 2004. By 2006, there were three mobile companies operating. Two additional mobile licenses were issued in 2003, but have yet to begin operations.
Spectrum flexibility has lowered investment costs for mobile operators by making a large amount of spectrum available, lowering mobile intercon-nection charges and prices.22 Guatemala has the lowest mobile tariffs in Latin America and the highest mobile penetration in Central America (Figure 4.8), mainly due to the liberal spectrum environment.23 Spectrum trading is being widely adopted elsewhere and was the focus of a recent ITU workshop.24

Statistical Annex
70
Chapter Four
Box 4.4: The Government of India seeks to expand its USO fund to improve rural mobile infrastructure
In 2006, the Indian government extended financial support from the Universal Service Obligation (USO) Fund to mobile operators to create infrastructure in rural and remote areas, according to local press re-ports. The USO Fund, which previously provided subsidies only to basic telecoms operators for fixed-line services in rural areas, will now also cover mobile operators.
The USO Fund can be used for the creation of infrastructure such as towers, power supply and back-up, in rural and remote areas which are not covered by wireless signals. Telecommunications operators will utilize the infrastructure created with the support from USO Fund to extend mobile services in these ar-eas and a maximum of three telecoms service providers will be able to share the new infrastructure. This will also be used for providing broadband services in villages. It is expected that approximately 10’000 wireless masts would be set up in different parts of the country. The scheme is aiming to increase the cov-erage of villages and other remote areas. With an estimated 670 million people living in low-income rural areas, around half India’s population is poorly served by current fixed and mobile networks. Increasing rural teledensity levels is also a key to achieving the Department of Telecommunications’ (DoT) target of 250 million subscribers in India by 2007.
Source: Global Insight, 17 October 2006.
4.6 Infrastructuredevelopment
Infrastructure is one of the key foundations for building an Information Society and bringing the benefits of ICTs to all. The WSIS called for mobiliza-tion by different stakeholders to establish better and more extensive infrastructure. Infrastructure is now provided by alternative sources - for instance, many local authorities around the world have begun financing or constructing Wi-Fi networks, while mesh networks and peer-to-peer network infrastructures foresee end-users as being infra-structure providers.
The facilitation of the implementation of WSIS Action Line C2 at the international level is led by ITU25 and should provide guidance on relevant topics, such as policy harmonization, regulation, financing mechanisms and the use of innovative technologies. The multi-stakeholder nature of the WSIS implementation process is useful as a new model for addressing universal service provision (see Box 4.4).
The following country case studies, on Tunisia, Netherlands and Pakistan, illustrate different aspects of infrastructure investment.
4.6.1 TunisiaofTomorrow
Tunisia was the country that originally proposed the holding of a World Summit on the Information Society and it hosted the second Phase of the Summit in November 2005. The Tunisian govern-ment views ICTs as a key way for Tunisia to face the challenges of the 21st century. President Ben Ali’s campaign motto during the 2004 elections was Tunisie de Demain (“Tunisia of Tomorrow”).26 ICTs figured prominently in the President’s Election Platform for 2004-2009 and constitute one of the pillars is the construction of a knowledge economy.
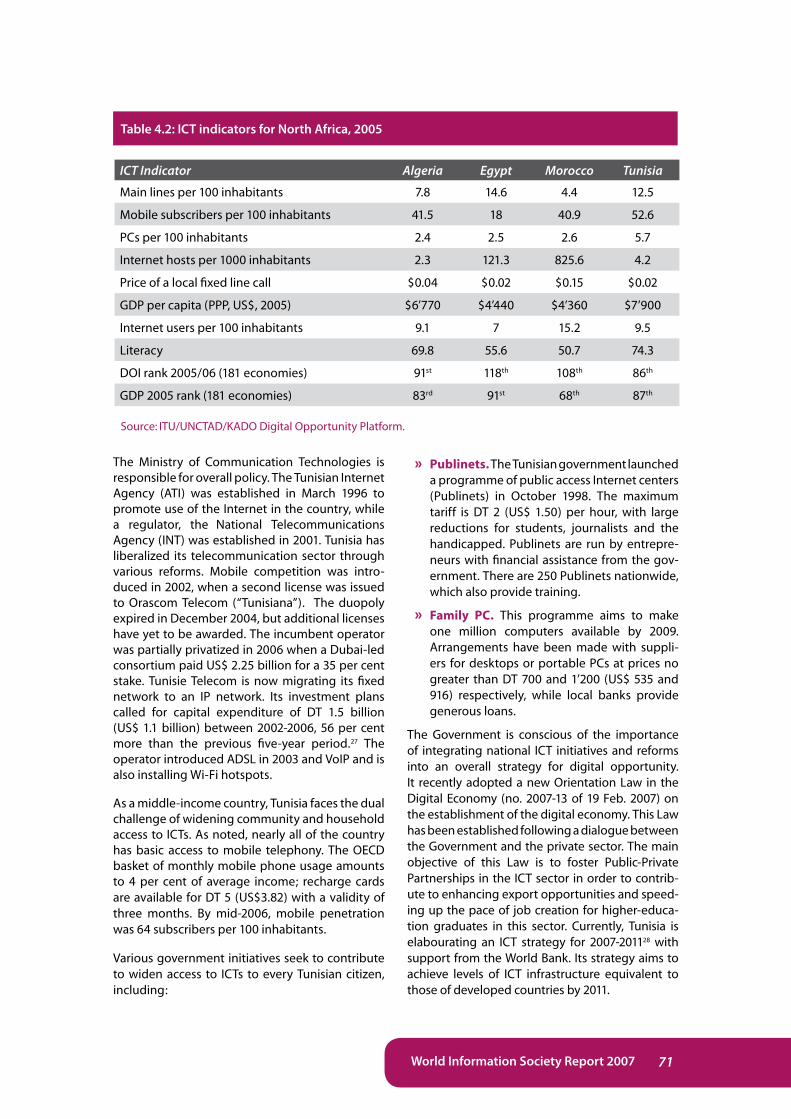
Tunisia was the first African and Arab nation to connect to the Internet backbone in 1991. Since then, international Internet bandwidth has grown from 19.2 kbit/s to 600 Mbit/s in 2005. Connections to two submarine fibre networks (SEA-ME-WE and Italy-Tunisia) guarantee ample bandwidth. It has the second-highest fixed line penetration and the highest mobile and PC pen-etration among North African countries. While fixed line growth has slowed, mobile has taken off rapidly, following the award of a second license in 2002. The mobile network covers virtually the entire population. Tunisia has also been trialing 3G mobile systems.
71World Information Society Report 2007
Source: ITU/UNCTAD/KADO Digital Opportunity Platform.
Table 4.2: ICT indicators for North Africa, 2005
ICT Indicator Algeria Egypt Morocco Tunisia
Main lines per 100 inhabitants 7.8 14.6 4.4 12.5
Mobile subscribers per 100 inhabitants 41.5 18 40.9 52.6
PCs per 100 inhabitants 2.4 2.5 2.6 5.7
Internet hosts per 1000 inhabitants 2.3 121.3 825.6 4.2
Price of a local fixed line call $0.04 $0.02 $0.15 $0.02
GDP per capita (PPP, US$, 2005) $6’770 $4’440 $4’360 $7’900
Internet users per 100 inhabitants 9.1 7 15.2 9.5
Literacy 69.8 55.6 50.7 74.3
DOI rank 2005/06 (181 economies) 91st 118th 108th 86th
GDP 2005 rank (181 economies) 83rd 91st 68th 87th
The Ministry of Communication Technologies is responsible for overall policy. The Tunisian Internet Agency (ATI) was established in March 1996 to promote use of the Internet in the country, while a regulator, the National Telecommunications Agency (INT) was established in 2001. Tunisia has liberalized its telecommunication sector through various reforms. Mobile competition was intro-duced in 2002, when a second license was issued to Orascom Telecom (“Tunisiana”). The duopoly expired in December 2004, but additional licenses have yet to be awarded. The incumbent operator was partially privatized in 2006 when a Dubai-led consortium paid US$ 2.25 billion for a 35 per cent stake. Tunisie Telecom is now migrating its fixed network to an IP network. Its investment plans called for capital expenditure of DT 1.5 billion (US$ 1.1 billion) between 2002-2006, 56 per cent more than the previous five-year period.27 The operator introduced ADSL in 2003 and VoIP and is also installing Wi-Fi hotspots.
As a middle-income country, Tunisia faces the dual challenge of widening community and household access to ICTs. As noted, nearly all of the country has basic access to mobile telephony. The OECD basket of monthly mobile phone usage amounts to 4 per cent of average income; recharge cards are available for DT 5 (US$3.82) with a validity of three months. By mid-2006, mobile penetration was 64 subscribers per 100 inhabitants.
Various government initiatives seek to contribute to widen access to ICTs to every Tunisian citizen, including:
» Publinets. The Tunisian government launched a programme of public access Internet centers (Publinets) in October 1998. The maximum tariff is DT 2 (US$ 1.50) per hour, with large reductions for students, journalists and the handicapped. Publinets are run by entrepre-neurs with financial assistance from the gov-ernment. There are 250 Publinets nationwide, which also provide training.
» Family PC. This programme aims to make one million computers available by 2009. Arrangements have been made with suppli-ers for desktops or portable PCs at prices no greater than DT 700 and 1’200 (US$ 535 and 916) respectively, while local banks provide generous loans.
The Government is conscious of the importance of integrating national ICT initiatives and reforms into an overall strategy for digital opportunity. It recently adopted a new Orientation Law in the Digital Economy (no. 2007-13 of 19 Feb. 2007) on the establishment of the digital economy. This Law has been established following a dialogue between the Government and the private sector. The main objective of this Law is to foster Public-Private Partnerships in the ICT sector in order to contrib-ute to enhancing export opportunities and speed-ing up the pace of job creation for higher-educa-tion graduates in this sector. Currently, Tunisia is elabourating an ICT strategy for 2007-201128 with support from the World Bank. Its strategy aims to achieve levels of ICT infrastructure equivalent to those of developed countries by 2011.

Statistical Annex
72
Chapter Four
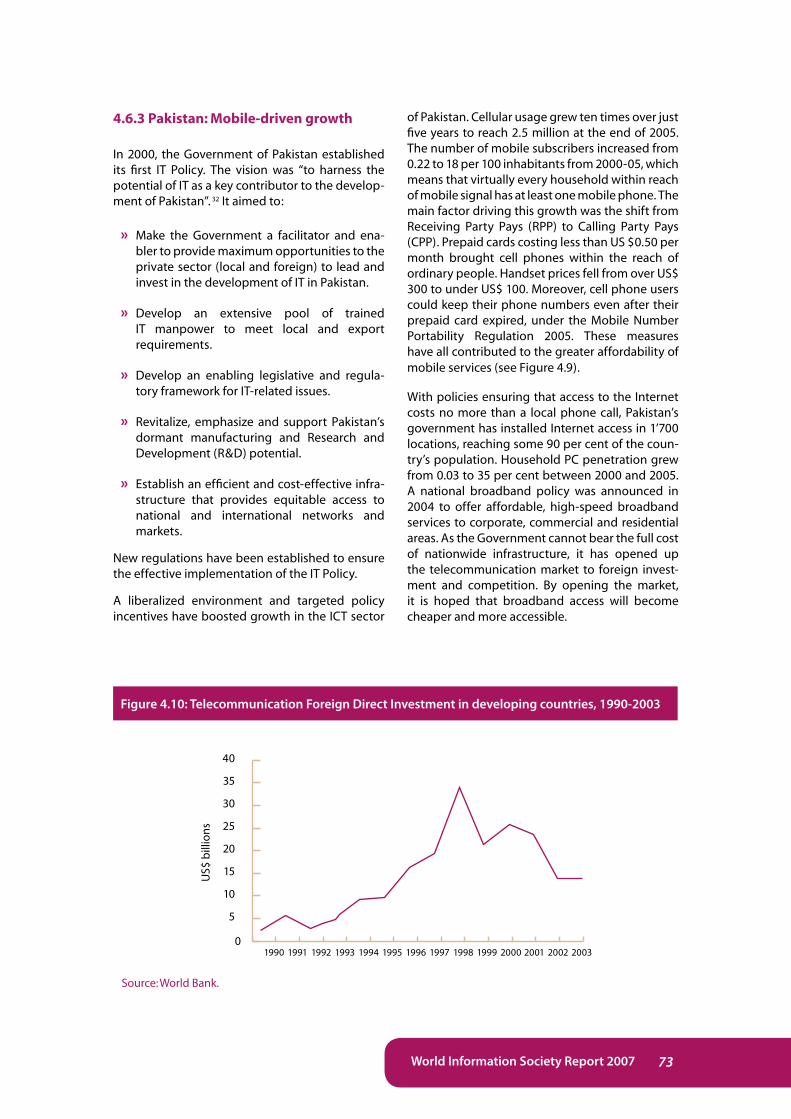
Figure 4.9: Mobile tariffs as a proportion of per capita income, Pakistan, 2000-2006
Source: Wilson, Joseph (2007), “Digital Opportunities in Pakistan”, available at: www.itu.int/osg/spu/digital-bridges/materials/wilson-paper.pdf.
0
50
100
150
200
250
300
2006200520042003200220012000
Mo
bile
cel
lula
r tar
iffs
as
% o
f per
cap
ita
inco
me
253
204
115
5630
9 3
4.6.2Netherlands:Broadbandheaven
The Netherlands is fast developing its broadband infrastructure. By October 2006, broadband pen-etration had reached 29.8 subscribers per 100, equivalent to over half of all households.29 As a member of the EU, the Netherlands adheres to regional ICT policy initiatives such as the eEurope Action Plans, which call for widespread broad-band infrastructure.30 Dutch ICT policy aims to be among the ICT leaders in Europe. Given the Netherlands’ broadband penetration, it has been successful in meeting this goal.
Geography plays a large part in explaining Dutch broadband success. The country is flat and urban-ized, with a high population density. These factors make it easy to roll out ICT infrastructure. Almost all houses have a fixed line telephone connec-tion and 97 per cent have a cable television con-nection. While geography has contributed to the Netherlands’ good connectivity, policy has also played a large role. The incumbent operator, KPN, was privatized in 1994 and a telecom regu-lator, “Onafhankelijke Post en Telecommunicatie Authoriteit” (OPTA), was created in 1997.
In broadband policy, the Dutch have loosely fol-lowed the investment ladder theory31, requiring the incumbent to open up its copper wire access network. Investment ladder theory suggests that competition increases, as newcomers grow in their ability to make investments. In the early stages of competition, where newcomers cannot yet make large levels of investment, resale can
help to grow the market (including simple resale, bitstream access and unbundled local loop). The market moves up the investment ladder as new-comers invest more in their own technology. Inter-modal competition is beneficial in this, in addition to intra-modal. In the Netherlands, cable TV has proved an effective competitor to DSL through the availability of Internet access via cable modem. As a result, the incumbent had a broadband market share of less than 45 per cent in October 2006.
The competition has also lowered prices and improved quality. Broadband pricing has dropped dramatically. KPN charged some € 74 per Mbit/s in 2001 for DSL, but by 2006, this had fallen to € 8. Users in turn want faster connections. By the end of 2005, over half of the incumbent’s broadband subscribers were already at speeds greater than 3 Mbit/s. KPN has plans to provide fibre optic connections to all neighborhoods (i.e., fibre to the curb) as part of its Next-Generation Network (NGN) strategy. Already, by the end of 2005, fewer than half of all calls were made over the tradi-tional PSTN telephone network.
From the experience of the Netherlands, effective competition is critical to achieving a high level of broadband. Competition policies have made a crucial difference in raising broadband pen-etration. Further steps include the promotion of both intra-modal and inter-modal competition by requiring incumbent operators to provide whole-sale access to their networks, while encouraging the build-out of alternative infrastructure.
73World Information Society Report 2007
4.6.3Pakistan:Mobile-drivengrowth
In 2000, the Government of Pakistan established its first IT Policy. The vision was “to harness the potential of IT as a key contributor to the develop-ment of Pakistan”. 32 It aimed to:
» Make the Government a facilitator and ena-bler to provide maximum opportunities to the private sector (local and foreign) to lead and invest in the development of IT in Pakistan.
» Develop an extensive pool of trained IT manpower to meet local and export requirements.
» Develop an enabling legislative and regula-tory framework for IT-related issues.
» Revitalize, emphasize and support Pakistan’s dormant manufacturing and Research and Development (R&D) potential.
» Establish an efficient and cost-effective infra-structure that provides equitable access to national and international networks and markets.
New regulations have been established to ensure the effective implementation of the IT Policy.
A liberalized environment and targeted policy incentives have boosted growth in the ICT sector
of Pakistan. Cellular usage grew ten times over just five years to reach 2.5 million at the end of 2005. The number of mobile subscribers increased from 0.22 to 18 per 100 inhabitants from 2000-05, which means that virtually every household within reach of mobile signal has at least one mobile phone. The main factor driving this growth was the shift from Receiving Party Pays (RPP) to Calling Party Pays (CPP). Prepaid cards costing less than US $0.50 per month brought cell phones within the reach of ordinary people. Handset prices fell from over US$ 300 to under US$ 100. Moreover, cell phone users could keep their phone numbers even after their prepaid card expired, under the Mobile Number Portability Regulation 2005. These measures have all contributed to the greater affordability of mobile services (see Figure 4.9).
With policies ensuring that access to the Internet costs no more than a local phone call, Pakistan’s government has installed Internet access in 1’700 locations, reaching some 90 per cent of the coun-try’s population. Household PC penetration grew from 0.03 to 35 per cent between 2000 and 2005. A national broadband policy was announced in 2004 to offer affordable, high-speed broadband services to corporate, commercial and residential areas. As the Government cannot bear the full cost of nationwide infrastructure, it has opened up the telecommunication market to foreign invest-ment and competition. By opening the market, it is hoped that broadband access will become cheaper and more accessible.
0
5
10
15
20
25
30
35
40
20032002200120001999199819971996199519941993199219911990
US$
bill
ion
s
Figure 4.10: Telecommunication Foreign Direct Investment in developing countries, 1990-2003
Source: World Bank.
Statistical Annex
74
Chapter Four
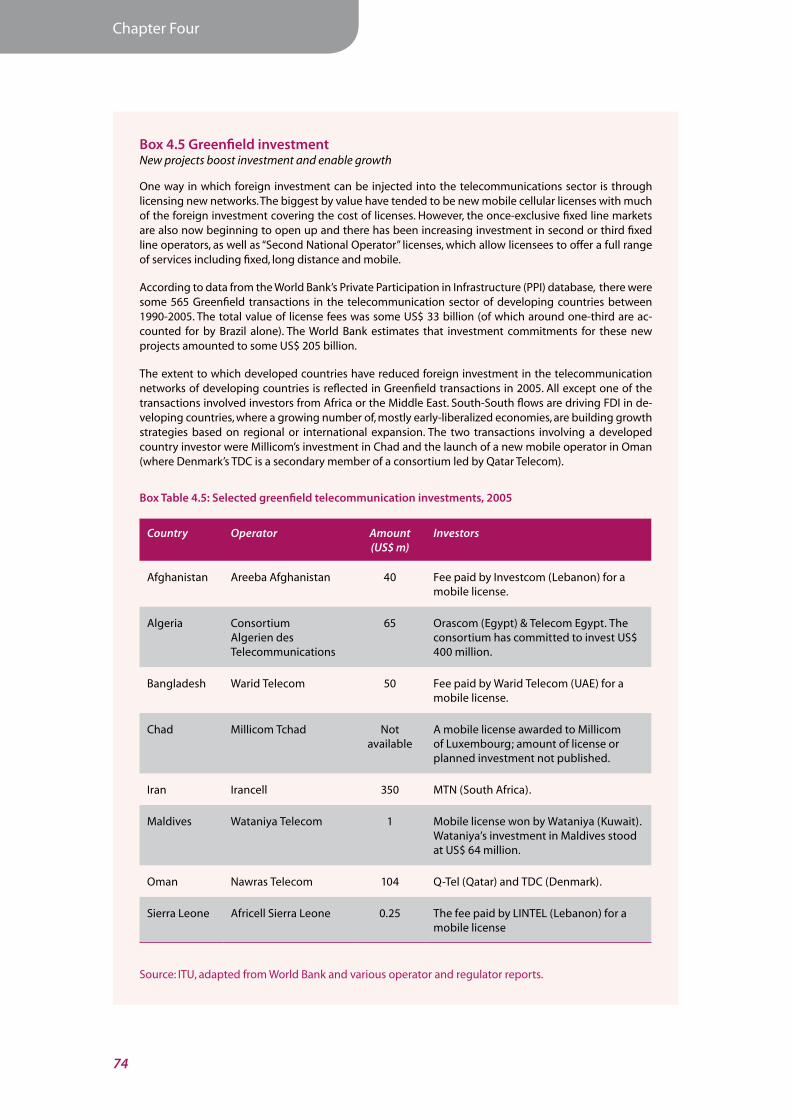
Box 4.5 Greenfield investmentNew projects boost investment and enable growth
One way in which foreign investment can be injected into the telecommunications sector is through licensing new networks. The biggest by value have tended to be new mobile cellular licenses with much of the foreign investment covering the cost of licenses. However, the once-exclusive fixed line markets are also now beginning to open up and there has been increasing investment in second or third fixed line operators, as well as “Second National Operator” licenses, which allow licensees to offer a full range of services including fixed, long distance and mobile.
According to data from the World Bank’s Private Participation in Infrastructure (PPI) database, there were some 565 Greenfield transactions in the telecommunication sector of developing countries between 1990-2005. The total value of license fees was some US$ 33 billion (of which around one-third are ac-counted for by Brazil alone). The World Bank estimates that investment commitments for these new projects amounted to some US$ 205 billion.
The extent to which developed countries have reduced foreign investment in the telecommunication networks of developing countries is reflected in Greenfield transactions in 2005. All except one of the transactions involved investors from Africa or the Middle East. South-South flows are driving FDI in de-veloping countries, where a growing number of, mostly early-liberalized economies, are building growth strategies based on regional or international expansion. The two transactions involving a developed country investor were Millicom’s investment in Chad and the launch of a new mobile operator in Oman (where Denmark’s TDC is a secondary member of a consortium led by Qatar Telecom).
Box Table 4.5: Selected greenfield telecommunication investments, 2005
Country Operator Amount (US$ m)
Investors
Afghanistan Areeba Afghanistan 40 Fee paid by Investcom (Lebanon) for a mobile license.
Algeria Consortium Algerien des Telecommunications
65 Orascom (Egypt) & Telecom Egypt. The consortium has committed to invest US$ 400 million.
Bangladesh Warid Telecom 50 Fee paid by Warid Telecom (UAE) for a mobile license.
Chad Millicom Tchad Not available
A mobile license awarded to Millicom of Luxembourg; amount of license or planned investment not published.
Iran Irancell 350 MTN (South Africa).
Maldives Wataniya Telecom 1 Mobile license won by Wataniya (Kuwait). Wataniya’s investment in Maldives stood at US$ 64 million.
Oman Nawras Telecom 104 Q-Tel (Qatar) and TDC (Denmark).
Sierra Leone Africell Sierra Leone 0.25 The fee paid by LINTEL (Lebanon) for a mobile license
Source: ITU, adapted from World Bank and various operator and regulator reports.

75World Information Society Report 2007
4.7Attractinginvestment
Regulatory changes have to be coupled with appropriate incentives. The creation of an ena-bling environment is the foundation for a vibrant ICT sector and for maximizing the benefits of ICTs. The multiplier effect of investment incentives can help ensure a high return and contribute to the overall performance of the ICT sector. This section reviews national ICT strategies aimed at creating an enabling environment for investment.
4.7.1 ForeignDirectInvestment(FDI)
As noted above, FDI has helped finance ICT infra-structure and develop telecommunication serv-ices in many countries since the 1990s. FDI has come into the telecom sector in two broad waves:
» the first, in the early 1990s, arose in response to numerous privatizations of incumbent operators around the world (Figure 4.10);
» the second, in the mid- to late-1990s, flooded into new mobile markets. FDI also provides an additional source of revenue in licensing fees (Box 4.5). Technology-intensive FDI can trig-ger productivity gains and improve business processes, with important spillover effects in better management practices and technol-ogy-intensive skills.33
Countries seeking to attract FDI must ensure that they have an adequate enabling environment (in political risk, taxation incentives, investment restrictions and regulatory environment). They can also allow high levels of foreign ownership/control and commit to regional and global trade agreements offering flexibility and security to investors. However, many countries retain foreign investment caps that can inhibit investment in the ICT sector. For example, companies were reluctant to invest in India’s telecommunication sector until the government lifted the cap on foreign owner-ship in any operator from 49 per cent to 72 per cent.34 China is raising foreign investment limits in its mobile and wireline markets to 49 per cent by the end of 2006 and 2007 respectively.
Commitments to trade agreements help provide security to investors by enshrining telecommuni-cations liberalization in multilateral treaties. If a country violates its commitment, it can then be brought before the trade organization. Some 69 countries have offered commitments at the WTO negotiations on basic telecommunications which entered into force on 1 January, 1998.35 Other countries can also benefit, by using the WTO com-mitments as a lever for pursuing liberalization in their telecommunication sectors.
According to the World Bank, FDI in telecommu-nications jumped from $2 billion in 1990 to $33 billion in 1998 (Figure 4.10) — but gradually fell to about $13 billion in 2002 and 2003.36 While there
Figure 4.11: Foreign Direct Investment in India’s computer services sector
Source: Reserve Bank of India.
0
100
200
300
400
500
600
700
800
900
2004 2005 2006
FDI i
n c
om
pu
ter s
ervi
ces,
US$
m
0
5
10
15
20
25
As
% o
f to
tal F
DI
FDI in Computer Services (US$ m) As % of total FDI %

Statistical Annex
76
Chapter Four
are fewer opportunities today (given that many privatizations that have already occurred and fewer mobile licenses are being issued), there are still many opportunities in the broader ICT sector. Although data are scarce, investment is growing in terms of the number of transactions. However, values remain low, due to the underdeveloped state of Internet and computer services markets in most developing economies. Take African Lakes, the UK-based company that bought Africa Online in 1998. Although Africa Online operates in 8 countries and is the largest ISP in Africa out-side of South Africa, African Lakes paid only US$ 4.4 million to acquire it.37 Nonetheless, its value has grown massively, with Africa Online chang-ing ownership nine years later for US$ 20 million in February 1997, when South Africa’s Telkom bought it.38
The golden era of large foreign investment in major infrastructure providers may seem to be over, but there is scope for investment in down-stream activities, such as call centers, software development and outsourcing. This is occurring is India, where the FDI inflows into India’s com-puter services sector rose from US$ 166 million in 2004 to US$ 770 million in 2006, when computer services accounted for 23 per cent of total FDI to India (Figure 4.11). This rise in FDI to India’s com-puter services sector has fueled rapidly-grow-ing IT-enabled export services, from just US$ 753 million in 1996 to US$ 23.6 billion by 2006. Today, India is the third-largest exporter of computer and information services in the world.
4.7.2 Taxincentives39
In economies where the private sector is increas-ingly dominant as a result of privatization, one of the main areas where governments retain influ-ence is the tax framework they offer to foreign investors to attract investment. A country’s tax regime is a major part of its investment promotion strategy (which may also include steps to reduce bureaucracy, streamline customs and export procedures, and simplify permits and licensing procedures).
Asian governments were among the first to pioneer the use of fiscal and export incentives in reduced tax rates, waivers and exemptions to specific groups of investors to build compara-tive advantage.40 Tax incentives are often offered to large Multi-National Corporations (MNCs) and listed companies, on a standardized or negotiated basis. Fiscal incentives are widely used in technol-
ogy-intensive sectors with global production and supply chains dominated by MNCs. In many coun-tries, government policy has sought to attract MNCs with their large resources of ‘hot’ capital with specific incentives.
Based on a review of the incentives offered by twenty developing countries, virtually all coun-tries offered tax incentives (in reduced rates, exemptions, tax holidays or stability agreements) for investment in manufacturing, technology-intensive and export sectors (Table 4.3). Some countries target specific fields (e.g., Singapore’s targeted incentives in the infocomm and bio-technology sectors). Survey evidence suggests that investors do take tax incentives into account in deciding where to invest41, although critics argue that tax competition between neigh-boring countries has resulted in a “race to the bottom”. Nevertheless, tax incentives to attract high-tech telecommunication investments are an important means of revitalizing a lackluster telecom sector.
4.8Innovation-drivenandhumancapacity-buildingstrategies
Most recent growth in the ICT sector has involved targeted innovation and human capacity-build-ing strategies. ICT skills are crucial to innovation. Likewise, ICT innovation plays an important role in raising productivity and competitiveness.42 Markets for basic services in most developed economies are now relatively mature and close to saturation. For many developed economies, inno-vation in products and services will continue to be one of the main drivers of future growth in the ICT sector. The development of an adequate pool of highly-skilled labour is the foundation for the suc-cess of national innovation policies. An example of this strategy is the case of Singapore.
4.8.1 Singapore:Innovation,IntegrationandInternationalization
Singapore is seeking to establish high, but sus-tained ICT growth, based on people-centered and innovation-driven national policies. Market and regulatory reforms have catalyzed growth in the ICT sector over the last decade. Singapore was one the first countries to introduce a nation-wide ICT strategy. The National Computerization

77World Information Society Report 2007
Plan was adopted in 1980. As a result, over the next five years, all government offices were com-puterized and the ICT services industry grew ten-fold. The National IT Plan (1986-1991) and IT2000 (1992-1999) provided the framework for ena-bling online services, e-commerce and e-indus-try. Infocomm21 (2000-2003) identified the ICT sector as a government priority and key sector for growth. The program aimed to boost the com-petitiveness of Singaporean firms and enhance
quality of life through ICTs or “infocomm”. In 2000, Singapore fully liberalized its telecommunica-tion market, allowing competition in all markets and lifting all limits on direct and indirect foreign equity investment in Singaporean operators. The first e-Government Action Plan was also launched. The most recent national ICT strategy (2003-2006), Connected Singapore, focuses on enabling indi-viduals, organizations and business to become more viable, efficient and innovative. In March
Table 4.3: Investment Tax Incentives in Selected Developing Countries
Source: Biggs (2007), adapted from UNCTAD Investment Policy Review series.
Note: N/a: Not available.
Country Investment Tax Credit
(%)
Accelerated Depreciation (% per year)
Sectoral incentives
Export incentives
Regional incentives
Loss carry forward
Tax holidays (Years)
Corporation Tax rate
(%)
Botswana None Mining+ capital
allowances
Yes Duty exemptions
No 5 None 25
Brazil None Yes Yes Yes Yes 4 15 34
Ecuador In tourism 5-10 Yes Yes Yes N/a 20 25+15
Ethiopia N/a Yes Yes Yes Yes 3-5 1-5 35
Ghana None 5-20 Yes Yes Yes (-25-50%)
5 5-10 30-32.5
Kenya None Yes Limited Yes No Unlimited 10 30-37.5
Korea 6-10 Yes Yes Yes No 3 5 15-25
Lesotho None 5-25 Yes Yes No N/a None 15-35
Mauritius 10% anti-pollution
Yes Yes Extensive No Unlimited 0-10 15-35
Mexico 19-25 Yes Yes Yes Yes 4 None 34
Nepal None 5-25 Yes Yes Yes N/a 5-10 20-30
Nigeria 5-20 No Yes Yes No 4 3-5 30
Peru None 3-20 Yes Yes Yes 4 None 27
Philippines 75-100 No Yes Yes No N/a 4-5 32
Rwanda None 5-50 Yes Yes Yes 5 None 30
Singapore 33.3/3-50 Yes Yes Yes No Unlimited 5-10 20
Sri Lanka None Yes Yes Yes Yes 6 5 30
Tanzania None 25-100 Yes Yes Yes 5 2-5 30
Uganda None 5-20 Yes Yes Yes Unlimited 10 30

Statistical Annex
78
Chapter Four
2005, there were 35 Facilities-Based Operator (FBO) licensees that owned their own facilities and more than 700 Service-Based Operator (SBO) licensees that provided telecommunications serv-ices over third-party networks.43
Today, Singaporeans enjoy easy and widespread access to advanced telecommunication networks and services. In its vision iN2015 for An Intelligent Nation, Global City, Powered by Infocomm, the Government views infocomm as integral to ena-bling growth in the economic and social spheres. Highly-skilled human resources, R&D and innova-tion are the key pillars of Singapore’s strategy for growth. The ambitious targets of in2015 include creating 80’000 additional jobs, with 90 per cent of all households using broadband and 100 per cent computer ownership in households with school-age children.44
Singapore was also the first country in the world to focus on computerized primary education. In 2002, there was a 2:1 pupil-computer ratio in all primary schools. The Ministry of Education has decided to move away from general purpose computer labs and to invest in the concept of classroom connectivity. Today, every classroom
is connected to the Internet and the high-speed Singapore ONE backbone. Singapore already col-lects age-differentiated ICT data and this makes it possible to assess the age divide in Singapore, by calculating the DOI for different age groups (Table 4.4). Not surprisingly, the 15-29 age group does best, while the 60+ age group falls below the national average.
The vision of the Government of Singapore is to have “an infocomm-savvy workforce and glo-bally competitive infocomm manpower to drive national economic competitiveness”.45 On the basis of digital opportunity among the young generation of tomorrow, Singapore’s future seems bright and assured. The Government of Singapore has introduced a comprehensive plan, in2015, that seeks to address the age divide, among other issues.
Table 4.4: The age divide in Singapore
Source: ITU/UNCTAD Digital Opportunity Platform, adapted from the Singapore Infocomm Development Agency (IDA).
AGE-DISAGGREGATED DOI 2005/06 15-29 45-59 60+
OPPORTUNITY 1.00 1.00 1.00 1.00
INFRASTRUCTURE 0.71 0.76 0.54 0.42
4. % households with a fixed-line telephone 0.98 0.98 0.98 0.98
5. % households with a computer 0.74 0.86 0.55 0.34
6. % households with Internet access at home 0.66 0.83 0.48 0.24
7. Mobile cellular subscribers per 100 inhabitants 0.98 0.87 0.61 0.38
8. Mobile Internet subscribers per 100 inhabitants 0.18 0.24 0.1 0.15
UTILIZATION 0.45 0.65 0.49 0.49
9. % individuals that used the Internet 0.49 0.83 0.48 0.24
10. Fixed broadband subscribers / total Internet subscribers 0.83 0.83 0.83 0.83
11. Mobile broadband subscribers / total mobile subscribers 0.04 0.28 0.16 0.39
DIGITAL OPPORTUNITY INDEX 0.72 0.80 0.68 0.63

79World Information Society Report 2007
4.9 Conclusions
Which strategies are likely to be the most suc-cessful in stimulating ICT growth? There are likely to be as many answers as there are econo-mies, because ICT growth is specific to different national contexts, policy goals and market struc-tures. Nevertheless, the review in this chapter shows that certain factors are common to most economies in growing their ICT sector; further, these factors need to be integrated and main-streamed into national growth strategies. Market reforms (including liberalization, privatization and competition) have proven vital enablers of
growth. Proactive regulation can increase produc-tivity and spread the benefits of ICTs across differ-ent sectors. Developing extensive and adequate infrastructure capacity is a key to enhanced con-nectivity. Creating an enabling environment for investment is another driver. Last, but not least, a prosperous and inclusive Information Society could not be built without highly-skilled labour.
The case studies presented in this chapter show that success in ICTs is not the preserve of devel-oped economies alone, but can serve to promote national socio-economic development at any stage of the development process, as part of an overall national growth strategy.
Statistical Annex
80
Chapter Four
1 See WSIS Geneva Plan of Action, para 5, available at: www.itu.int/wsis/documents/doc_multi.asp?lang=en&id=2316|0.
2 For instance, in the European Union, the ICT Sector is growing faster than the general economy and contributed nearly 50 per cent of productivity growth between 2000 and 2004: see i2010 Second annual report (2006), available from: http://ec.europa.eu/information_society/newsroom/cf/itemdetail.cfm?item_id=3303.
3 For instance, France’s early start with non-IP-based interactive media, such as the videotext-based minitel system, arguably slowed the pace at which it initially adopted the Internet.
4 See “Information Society and Information Policy”, Chapter 2 of G.S. Oh (2005), “The Process of Korean Information Policy”, Korea Information Strategy Development Institute.
5 See the review by the Overseas Development Institute (Chapman and Slaymaker, 2002), in the UNCTAD Information Economy Report 2006, available at: www.unctad.org/Templates/WebFlyer.asp?intItemID=3991&lang=1.
6 UNDP (2000), The Estonian Tiger Leap into the 21st Century, available from: www.esis.ee/ist2000/background/tiigri-hype/contents.html
7 UNPAN (2005), “Global E-government Readiness Report 2005: From E-government to E-inclusion”, available from: www.unpan.org/egovernment5.asp
8 EU (2005), “Information Society Benchmarking Report”, available from: http://europa.eu.int/information_society/eeurope/i2010/docs/benchmarking/051222%20Final%20Benchmarking%20Report.pdf
9 Statistics are from the ITU World Telecommunication Regulatory Database, available through the ICT Eye portal - see: www.itu.int/ITU-D/ICTEYE/Default.aspx.
10 For example, Albania has been attempting to privatize incumbent AlbTelecom since 2002, when it was announced that it would be partially privatized by the end of that year. The deadline passed and an agreement was eventually reached on the sale in 2005, but it was later cancelled. The government then announced that the sale would take place by the end of 2006, but that deadline has also passed (www.itu.int/ituweblogs/treg/Albtelecom+Privatisation+Process+To+Begin+By+End+2006.aspx). Likewise, efforts to privatize Nigeria’s incumbent operator NITEL have been ongoing since 2001, see: www.state.gov/e/eb/ifd/2005/43036.htm
11 One exception was the 2006 sale of 50 per cent of Colombia’s TELECOM to Telefónica of Spain. The funds will be used for a capital increase in TELECOM instead of accruing to the government: “Telefónica Takes Control of Colombia Telecom.” April 7, 2006, Press Release.
12 One example is Ghana, where 30 per cent of the incumbent was sold in 1997 for US$ 38 million to a consortium headed by Telekom Malaysia. The government later cancelled the agreement in 2002 and was taken to court by Telekom Malaysia. The case was finally settled by international arbitration in 2005, with the Ghanaian government agreeing to pay US$ 52.2 million. Another example is Yemen where the license of the TeleYemen joint venture between Cable and Wireless of the UK and the Yemeni government came to an end in 2003. The Yemen government subsequently awarded a five-year contract to France Télécom to manage the company, but with no equity stake.
13 For more information on this subject, see ITU “Trends in Telecommunication Reform Report 2007: On the Road to NGN”, available at: www.itu.int/pub/D-REG-TTR.9-2007.
14 For more information, OFCOM’s website can be found at: www.ofcom.org.uk/.
15 Econet Nigeria’s shareholding has been the subject of ongoing disputes. See: iafrica.com, “Econet Nigeria dispute nears end”. February 8, 2005. Available at: http://business.iafrica.com/news/411769.htm. In 2006, MTC of Kuwait purchased 60 per cent of the company and rebranded it. See: Celtel. “Celtel International acquires controlling stake in Vmobile Nigeria”, Press Release, May 31, 2006. Available at: www.mtctelecom.com/muse/obj/lang.default/portal.view/content/About%20us/Worldwide%20Presence/Nigeria
16 As measured by the Hirschmann-Herfindahl Index, which was 3’341 at December 2005, World Bank, “Information & Communications for Development 26: Policies and Trends”. The Hirschmann-Herfindahl Index (HHI) is a common measure of industry concentration, computed by summing the square roots of the market shares of each company. An HHI of 10’000 = monopoly.
17 www.firstglobalselect.com/scripts/cgiip.exe/WService=globalone001/globalone/htm/news_article.r?vcnews-id=218814
18 www.cipaco.org/spip.php?article505
19 Nigerian Communications Commission, Determination of Interconnection Rate, June 21, 2006.
20 Guatemalan Republic (1996), General Telecommunications Law, available at: www.sit.gob.gt/docs/lgt.pdf
21 See: www.sit.gob.gt/regulaciondefrecuencia.html
22 After Paraguay, Guatemala has the largest amount of spectrum available for mobile operators in Latin America. See Hazlett, Thomas W. and Munoz, Roberto E., “Spectrum Allocation in Latin America: An Economic Analysis” (September 2006), George Mason Law & Economics Research Paper No. 06-44. Available at SSRN: http://ssrn.com/abstract=928521
Notes for Chapter Four
81World Information Society Report 2007
23 “The empirical evidence gleaned across the four estimated equations is consistent with the hypothesis that spec-trum reforms in Guatemala and El Salvador have resulted both in expanded deployment of radio spectrum and in less concentrated markets… Given that Guatemala and El Salvador have succeeded in having much more bandwidth deployed by operators than in the average Latin American regime (approximately 139 MHz to 90 MHz), competi-tion has been enabled.” Hazlett, Thomas W., Ibarguen, Giancarlo and Leighton, Wayne A., “Property Rights to Radio Spectrum in Guatemala and El Salvador: An Experiment in Liberalization” (10 March 2006). George Mason Law & Economics Research Paper No. 06-07. Available at SSRN: http://ssrn.com/abstract=889409
24 The ITU/Ugo Bordoni Foundation workshop “Market mechanisms for spectrum management” was held at ITU in Geneva, 22-23 January 2007. More information is available at: www.itu.int/osg/spu/stn/spectrum/index.html.
25 ITU was selected by WSIS as the facilitator for WSIS Action Line C2 (information and communication infrastructure), with assistance from the Association for Progressive Communications (APC) and NGO. For more detail about WSIS Action Line C2, and the third facilitation meeting due to taking place on 16 May 2007 in Geneva, see: www.itu.int/wsis/c2/index.html#16-May-2007.
26 “Le Programme Electoral du Président Zine El Abidine Ben Ali, 2004-2009”, available from: www.benali.tn/francais/pdf/benali2004_fr.pdf
27 www.itu.int/ITU-D/imt-2000/documents/Tunis2005/Presentations/Day%201/Presentation_Houerbi.pdf
28 http://web.worldbank.org/external/projects/main?pagePK=64283627&piPK=64290415&theSitePK=40941&menuPK=228424&Projectid=P088929
29 See “12th EU Telecom Rules implementation report”, available at: http://ec.europa.eu/information_society/news-room/cf/document.cfm?action=display&doc_id=258.
30 See: http://europa.eu.int/information_society/eeurope/2005/index_en.htm
31 See: http://erg.eu.int/doc/publications/erg_05_23_broadbd_mrkt_comp_report_p.pdf
32 Wilson, J. (2007), “Digital opportunities in Pakistan”, input for the DOF 2006, available from: www.itu.int/osg/spu/digitalbridges/materials/wilson-paper.pdf
33 See Machin and Van Reenen (1998), “Technology and Changes in Skill Structure: Evidence from Seven OECD Countries”. Quarterly Journal of Economics 443: 195–226, WEF, Global Competitiveness Report 2006.
34 See: www.networkworld.com/news/2007/020707-verizon-enters-indias-long-distance.html
35 See: www.wto.org/english/news_e/pres97_e/data3.htm
36 wwwwds.worldbank.org/external/default/WDSContentServer/WDSP/IB/2006/04/20/000012009_20060420105118/Rendered/PDF/359240PAPER0In101OFFICIAL0USE0ONLY1.pdf
37 See: www.nationaudio.com/News/EastAfrican/03122000/Features/Supplement4.htm
38 See: www.telkom.co.za/pls/portal/docs/page/contents/minisites/ir/sens/sensarticle_197.pdf
39 This section is based on the research and analysis in “ICT Tax incentives”, Phillippa Biggs, ITU (forthcoming).
40 Lall, Sanjaya, “Competitiveness, FDI and Technological Activity in East Asia”, 2003, Edward Elgar Publishing Ltd, UK.
41 Morrisset & Pirnia (2000), World Bank, Working Paper 2509, “How Tax Policy and Incentives Affect FDI”, World Bank, Washington.
42 Lindbaek, J. (1997). “Emerging Economies: How Long Will The Low-Wage Advantage Last?”, Background paper for a speech by IFC Executive Vice President, APPI Meeting, October 1997, Helsinki.
43 See: www.itu.int/osg/spu/ni/ubiquitous/Papers/UNSSingaporeCaseStudy.pdf
44 For more information on Singapore’s iN2015 strategy, see: www.in2015.sg/.
45 See: www.ida.gov.sg/Manpower/20060414201723.aspx