Chapter Five: Atmospheric Processing of Organic Aerosols...
38
2004 PhD Thesis 99 M. Rami Alfarra Chapter Five: Atmospheric Processing of Organic Aerosols: Measurements at Urban, Rural and Remote Locations 5.1 Introduction Understanding the composition of atmospheric aerosol particles is necessary for identifying their sources and predicting their effect on the various atmospheric processes discussed in the introduction (see section 1.1.2). Although organic compounds typically account for 10 – 70% of the total dry fine particle mass in the atmosphere [Gray et al., 1986; Middlebrook et al., 1998], organic PM concentrations, composition and formation mechanisms are not well understood, particularly in relation to the other major fine particle constituents, i.e. sulphate and nitrate compounds. This is because particulate organic matter is part of a complex atmospheric system with hundreds of different compounds, both natural and anthropogenic, covering a wide range of chemical and thermodynamic properties [Saxena and Hildemann, 1996]. The presence of semi-volatile compounds complicates the sampling of organic particulate matter. In addition, there is a current lack of a single technique that is capable of analysing the entire range of organics present. Organic particulate matter is both emitted directly in particle form (primary organic aerosols) and formed in the atmosphere through photochemical oxidation of reactive organic gases forming low-volatility products that condense or adsorb onto particle surfaces, or absorb into pre-existing particulate matter resulting in the addition of material to atmospheric particles; this process is known as “secondary organic aerosol particle formation”. Under certain conditions atmospheric reaction products can nucleate to form new particles. Both biogenic and anthropogenic sources contribute to primary and secondary organic particles [Hildemann et al., 1996]. Secondary organic particles can be a major contributor to fine particulate matter levels in both urban and rural atmospheres [Turpin and Huntzicker, 1995; Castro et al., 1999]. However, the contributions of the primary and secondary components of particulate organic carbon (OC) have long been difficult to quantify. The lack of a direct chemical analysis method for the identification of either of these components has led researchers to employ several indirect methods. These include the use of tracer compounds for either the primary or the secondary OC [Gray et al., 1986; Turpin and Huntzicker, 1991], the use
Transcript of Chapter Five: Atmospheric Processing of Organic Aerosols...
2004 PhD Thesis 99
M. Rami Alfarra
Chapter Five: Atmospheric Processing of Organic Aerosols: Measurements at Urban, Rural and Remote Locations
5.1 Introduction
Understanding the composition of atmospheric aerosol particles is necessary for
identifying their sources and predicting their effect on the various atmospheric
processes discussed in the introduction (see section 1.1.2). Although organic
compounds typically account for 10 – 70% of the total dry fine particle mass in the
atmosphere [Gray et al., 1986; Middlebrook et al., 1998], organic PM concentrations,
composition and formation mechanisms are not well understood, particularly in relation
to the other major fine particle constituents, i.e. sulphate and nitrate compounds. This is
because particulate organic matter is part of a complex atmospheric system with
hundreds of different compounds, both natural and anthropogenic, covering a wide
range of chemical and thermodynamic properties [Saxena and Hildemann, 1996]. The
presence of semi-volatile compounds complicates the sampling of organic particulate
matter. In addition, there is a current lack of a single technique that is capable of
analysing the entire range of organics present.
Organic particulate matter is both emitted directly in particle form (primary organic
aerosols) and formed in the atmosphere through photochemical oxidation of reactive
organic gases forming low-volatility products that condense or adsorb onto particle
surfaces, or absorb into pre-existing particulate matter resulting in the addition of
material to atmospheric particles; this process is known as “secondary organic aerosol
particle formation”. Under certain conditions atmospheric reaction products can
nucleate to form new particles. Both biogenic and anthropogenic sources contribute to
primary and secondary organic particles [Hildemann et al., 1996]. Secondary organic
particles can be a major contributor to fine particulate matter levels in both urban and
rural atmospheres [Turpin and Huntzicker, 1995; Castro et al., 1999]. However, the
contributions of the primary and secondary components of particulate organic carbon
(OC) have long been difficult to quantify. The lack of a direct chemical analysis method
for the identification of either of these components has led researchers to employ
several indirect methods. These include the use of tracer compounds for either the
primary or the secondary OC [Gray et al., 1986; Turpin and Huntzicker, 1991], the use
2004 PhD Thesis 100
M. Rami Alfarra
of models describing the formation of secondary OC [Pandis et al., 1992] and the use of
models describing the emission and dispersion of primary OC [Harley and Cass, 1995].
One of the main objectives of this work has been to validate the AMS as a tool of
quantitative measurement of the size distribution and chemical composition of the non-
refractory fraction of submicron atmospheric particles (~PM1.0) and utilise it, in
conjunction with other instruments, to further our current understanding of the
behaviour of atmospheric aerosols. The AMS has been deployed in many field studies
covering a wide range of environments worldwide over the past few years. In this
chapter, data from locations representing various environments have been synthesised in
order to investigate and improve our understanding of the sources, distribution,
chemical composition and processing of atmospheric particles, in particular its organic
fraction. Specifically, the aim of this chapter is to characterise the variability of the
organic particulate composition and size distributions as a function of location and
photochemical activity using, mainly, AMS data representing a range of emission-
dominated to formation-controlled regimes in different parts of the world, and
investigate the effect of atmospheric processing on the chemical composition and size
distribution of the organic fraction. Correlations with gas phase marker compounds
have been used to explain both sources and modal behaviour of organic particulate.
Identification of organic ion series, as well as key mass fragments has been used in an
attempt to further understand the chemical composition of the organic fraction of the
aerosol particles.
The data discussed in this chapter have been collected in urban locations in Manchester
and Edinburgh in the UK and Vancouver in Canada. Two data sets have been obtained
in Manchester during summer and winter periods. On the other hand, data from rural
and semi-rural locations in Canada, a high alpine site in central Europe and a remote
marine site on Jeju Island, South Korea have also been obtained. It is important to note
that there is no intention in this chapter to provide a detailed analysis of the individual
field studies. Such data have been already presented for the two U.K. cities by Allan et
al., [2003a; 2003b], for the Korean data by Topping et al., [2004], and the Canadian
data by Alfarra et al., [2004] and Boudries et al., [2004]. The reader is directed to these
2004 PhD Thesis 101
M. Rami Alfarra
publications for more background details on the corresponding experiments and a more
detailed discussion of the sources, composition and behaviour of the inorganic fraction
of the aerosols. A detailed discussion of the data from the high alpine location is
presented in Chapter 7 of this thesis. All sampling locations and protocols are briefly
described in the following section.
5.2 Field Sites and AMS Sampling
5.2.1 Edinburgh, UK (2000)
The first field deployment of the UMIST AMS was during the third campaign of the
Sources And Sinks of Urban Aerosol (SASUA3) experiment in Edinburgh, UK in
October- November 2000. The experiment was organised jointly between the Centre for
Ecology and Hydrology (CEH) in Edinburgh and UMIST, with the aim of measuring
aerosol fluxes and emission velocities above the city. The AMS involvement in this
experiment was mainly a chance to provide a first shakedown for the UMIST
instrument and to validate that it is capable of producing reliable and robust field data.
The simultaneous aerosol size and chemical composition measurements made by both
CEH and UMIST groups provided a good chance for data comparisons with the AMS
[Allan et al., 2003a].
AMS Measurements were made at the Observatory House on the top of Calton Hill
(55.955 °N, 3.184 °W), 50 m above the main street in the centre of the city of
Edinburgh from 31/10 to 10/11/2000, with an averaging time of 30 min. A basic inlet,
made of a gauze-covered, upturned funnel at the end of 2-m long 6.35 mm internal
diameter tube, was used for sampling. The suspected major local particle source was
Princess Street, the main shopping street in the centre of Edinburgh with a high traffic
density. Dorsey et al., [2002] provides a more detailed description of the site and the
SASUA project.
5.2.2 Jeju Island, South Korea (2001)
ACE-Asia was the third of the Aerosol Characterisation Experiments (ACE) organised
by the International Global Atmospheric Chemistry Project (IGAC). The experiment
was a major international collaboration led by the National Science Foundation (NSF)
2004 PhD Thesis 102
M. Rami Alfarra
and National Oceanic and Atmospheric Administration (NOAA) in the USA. It took
place on the South Korean island of Jeju and was designed to study the size and
chemical composition along with other radiative properties of the Asian aerosols in
order to establish a better understanding of their radiative impact in the atmosphere
[Huebert et al., 2003].
The island of Jeju is a major resort with no large industrial sources [Carmichael et al.,
1997]. It is located in the Yellow Sea about 100 km to the south of the Korean
mainland, 500 km to the northeast of Shangahi, China, and 250 km to the west of
Kyushu Island, Japan. Its location and lack of major local sources of pollution make
Jeju Island an ideal position to monitor the pollution in East Asia [Carmichael et al.,
1996; Carmichael et al., 1997; Chen et al., 1997]. During ACE Asia, the AMS was
deployed at the Gosan supersite (33.29 °N, 126.16 °E), located at the small costal
village of Gosan on the western tip of Jeju Island overlooking the Yellow Sea.
Measurements were made from 12/04 to 30/04/2001, with 30 min averaging time. The
AMS sample flow was sub-sampled from a 10.5 m mast equipped with a standard PM10
inlet.
5.2.3 Manchester, UK (2001 & 2002)
AMS measurements have been carried out in Manchester during two periods in summer
2001, and winter 2002 with the aim of comparing the summer and winter aerosol
composition and size distribution in Manchester, UK. During both periods, ambient
aerosols were sampled through a standard PM10 inlet on the roof of the UMIST Main
Building, approximately 30 m above street level and located near the centre of the city
of Manchester (53.476 °N, 2.234 °W). The inlet was approximately 2 m above roof
level and was connected to the AMS by a 25.4 mm internal diameter stainless steel tube
approximately 7 m long. The nominal inlet flow rate was 17 l min-1 and the AMS
sampled through a 2.8 mm internal diameter stainless steel tube. Gas phase
measurements were carried out at 25 m above street level by an automated monitoring
site (Department of the Environment, Transport and the Regions) on the roof of
Manchester Town Hall, located about 0.75 km away in the centre of Manchester.
2004 PhD Thesis 103
M. Rami Alfarra
Summer Sampling took place between 14/06 and 25/06/2001, with 30 min averaging
time, and winter measurements were taken between 17/01 and 28/01/2002.
5.2.4 British Columbia, Canada (2001)
In August 2001, the PACIFIC 2001 field study was conducted in the Lower Fraser
Valley (LFV), British Columbia, Canada in order to provide a better understanding of
the sources, formation and distribution of particulate matter and ozone in that area. The
LFV has topographic features similar to that of the Los Angeles basin and experiences
the interaction of urban, suburban, marine, and agricultural emissions of pollutants and
their subsequent transformation in ambient air [Li, 2004]. The valley periodically
experiences episodes of elevated levels of ozone and fine particulate matter in the
summer resulting in poor visibility and possible health effects. These episodes are
typically experienced when the region is under the influence of synoptic high pressure
systems that lead to subsidence inversions which trap the surface primary pollutants in a
shallow boundary layer [Li et al., 1997]. Specific goals of the PACIFIC 2001 study
were to determine the horizontal and vertical distributions and physical and chemical
characteristics of fine PM and ozone in order to understand the transition between
primary emission and secondary aerosol formation in the valley, and to identify the
major physical and chemical processes and roles of biogenic and anthropogenic
emissions in the secondary organic aerosol particles and ozone formation [Li, 2004].
Two Aerodyne Aerosol Mass Spectrometers were operated at three main field sites
during the PACIFIC 2001 experiment in the Lower Fraser Valley, British Columbia,
Canada during the summer of 2001. The Slocan Park site was located in the city of
Vancouver (49.244 oN, 123.049 oW) and represented a background urban location,
where a mixture of primary and secondary particulate matter was expected. The site was
surrounded by 2-3 storied residential houses situated at least 80 m away from the
sampling location. There were no major point sources within a radius of 3 km of the
site. Traffic in the nearby streets was typically light. The first AMS was deployed at this
site from the 12/08 to 24/08/2001, and data was averaged every 15 min. Sampling was
carried out through a PM2.5 cyclone inlet about 2 m above the trailer roof using 8 m of
0.5” (1.27 cm) O.D. copper tubing, at a flow rate of 10 l min-1. The Langley site was
2004 PhD Thesis 104
M. Rami Alfarra
selected to study the transition from an urban to rural setting, and to characterise
particles arising from agricultural activities. It was located in the middle of agricultural
fields to the southeast of the city of Vancouver (49.028 oN, 122.604 oW) with no nearby
major residential houses or traffic. The second AMS was deployed at this site for the
duration of the field study from the 12/08 to 01/09/2001, and collected data with 15 min
averaging time. Ambient sampling was carried out using the same inlet system as the
one described above for the Slocan Park site. The Sumas mountain site was located on
the eastern side of the valley (49.052 oN, 122.246 oW). It was chosen to address the
interaction between aging urban pollution and biogenic emissions resulting from the
coniferous tree covered slopes of the mountain. The first AMS was relocated from
Slocan Park to Sumas on 25/08 and continued to measure at the latter site to
30/08/2001, with 5 min averaging time, using the same inlet system from the Slocan
Park site. For additional details about the PACIFIC 2001 objectives and other scientific
findings, the reader is directed to volume 38, issue 34 of Atmospheric Environment
(November 2004), which is a special issue on this specific experiment.
5.2.5 Jungfraujoch, Switzerland (2002)
AMS measurements have been made as part of the second Cloud and Aerosol
Characterisation Experiment (CLACE 2), which took place at the Jungfraujoch high-
alpine research station (46.33 oN, 7.59 oE, 3580 m asl) in the Swiss Alps during June –
July 2002. The objectives of the CLACE 2 and detailed description of the sampling
location, protocol and scientific findings can be found in Chapter 7 of this thesis.
During summer, the site is often influenced in the early afternoon by the planetary
boundary layer (PBL) through thermally driven aerosol transport, while at other times
and seasons, free tropospheric conditions prevail. Results reported in this chapter were
for aerosol particles sampled, with 6 min averaging time through an inlet heated to 25 oC in order to evaporate all activated cloud droplets at an early stage of the sampling
process leaving the ambient aerosol, including the cloud droplet residuals, to pass
through the inlet and be sampled.
2004 PhD Thesis 105
M. Rami Alfarra
5.2.6 AMS Particle Collection Efficiency (CE)
Previous field studies [Drewnick et al., 2003] have shown that particle mass is
underestimated by the AMS for ammonium sulphate dominated aerosol by a factor of 2
(i.e. CEsulphate = 50%), when compared to other collocated instruments such as the
particle into liquid sampler (PILS) described previously in chapter 2 (section 2.4.2).
Allan et al., [2004a] found that if the sampled aerosol flow into the inlet of the
instrument is maintained at a high relative humidity, the mass of all the accumulation
mode species increases by approximately a factor of 2. They argued that this reduction
in CEsulphate was due to the efflorescence of ammonium sulphate particles at lower RH
causing the particles to become non-spherical, dropping the CEsulphate to approximately
50%. CE should therefore be a function of particle composition and the relative
humidity within the inlet, which is dependent on the ambient water vapour
concentration and temperature, and the temperature of the laboratory. This indeed was
the case for the Edinburgh, Manchester and Jeju Island datasets, where external
comparisons with other collocated instruments (e.g. MOUDI or Berner impactors)
showed that the AMS particle mass for sulphate was underestimated by a factor of 2
[Allan et al., 2003a; Topping et al., 2004].
Clearly different AMS instruments operating in different laboratories at different
temperatures may have different values of CE. This was the case in PACIFIC 2001, the
temperature control in the Slocan Park cabin was poor and often the sampling inlet
temperature was higher than ambient (RH low), while the cabin at Langley was well air
conditioned (Tsample < Tambient; RH high). The high RH sampling of ammonium
sulphate dominated aerosol at Langley taken together with the observations of Allan et
al., [2004a] leads to the use of a CEsulphate of 100% at Langley and 50% at Slocan. The
AMS results were compared to other independent methods of PM2.5 measurement
(MOUDI and TEOM) [K. Anlauf and J. Brook, personal communications, Environment
Canada, Toronto, Canada, 2003] at both sites and produced excellent correlations.
However, the TEOM and MOUDI reported higher absolute mass concentrations relative
to the AMS, particularly at Slocan Park. The comparisons between the AMS and
MOUDI mass size distributions for PM1.0 indicate that the discrepancy in total mass
between the AMS and the other instruments is likely due to the difference in size cuts
2004 PhD Thesis 106
M. Rami Alfarra
between the PM1.0 AMS and the other PM2.5 instruments. A similar comparison (using
MOUDI) was performed at the Sumas site and showed that a CEsulphate of 50% is
applicable. On the other hand a comparison of the sulphate mass measured by the AMS
and filter samplers at the Jungfraujoch site during CLACE2 experiment revealed that
the CEsulphate is only 25%.
AMS results [Allan et al., 2003a; Alfarra et al., 2004; Boudries et al., 2004] (and
results presented in this chapter) provide indirect evidence that the organic and
inorganic components in the accumulation mode are internally mixed based on the
similar temporal variability and shape of their modes. It is therefore reasonable to
assume a CE of 50% for accumulation mode nitrate, ammonium and organics. To date,
there are no studies to determine the CE of the organic material in the small organic
mode. Since these organic particles are known to have irregular shapes [McMurry et al.,
1996; Weingartner et al., 1997], it is probable that they will not be totally focused
through the aerodynamic lens and as a result may have a CE less than 100%. A CE of
50% for the small organic particles is assumed in this study. Current experiments to
analyse the particle beam shape are underway to investigate the validity of this
assumption for future experiments. The CEs and RIEs (the latter is discussed in chapter
3, section 3.3) factors used in this thesis are shown in Table 5.1 for each species and
location. The RIEs values in the table have been determined from laboratory calibrations
with particles of each species [Hogrefe et al., 2004].
Recently, a beam width probe (0.4 mm) has been introduced to many AMS instruments
(including the UMIST AMS) to provide more information on the possible divergence of
the aerosol particle beam. Results show a well-focused beam when sampling is
performed at RH close to saturation or if the shape of the sampled particles is known to
be spherical (this was the case during the AMS chamber study discussed in chapter 6),
while wider particle beams (i.e. lower CE) are observed at dry conditions. Particle
bounce off the vaporiser is likely to explain the observed low CE. Work is still
underway to further understand and quantify this behaviour. For example, in the most
recent experiments (not discussed in this thesis) the beam width probe has been
included and the RH of the inlet system is switched between close to saturation and dry.
2004 PhD Thesis 107
M. Rami Alfarra
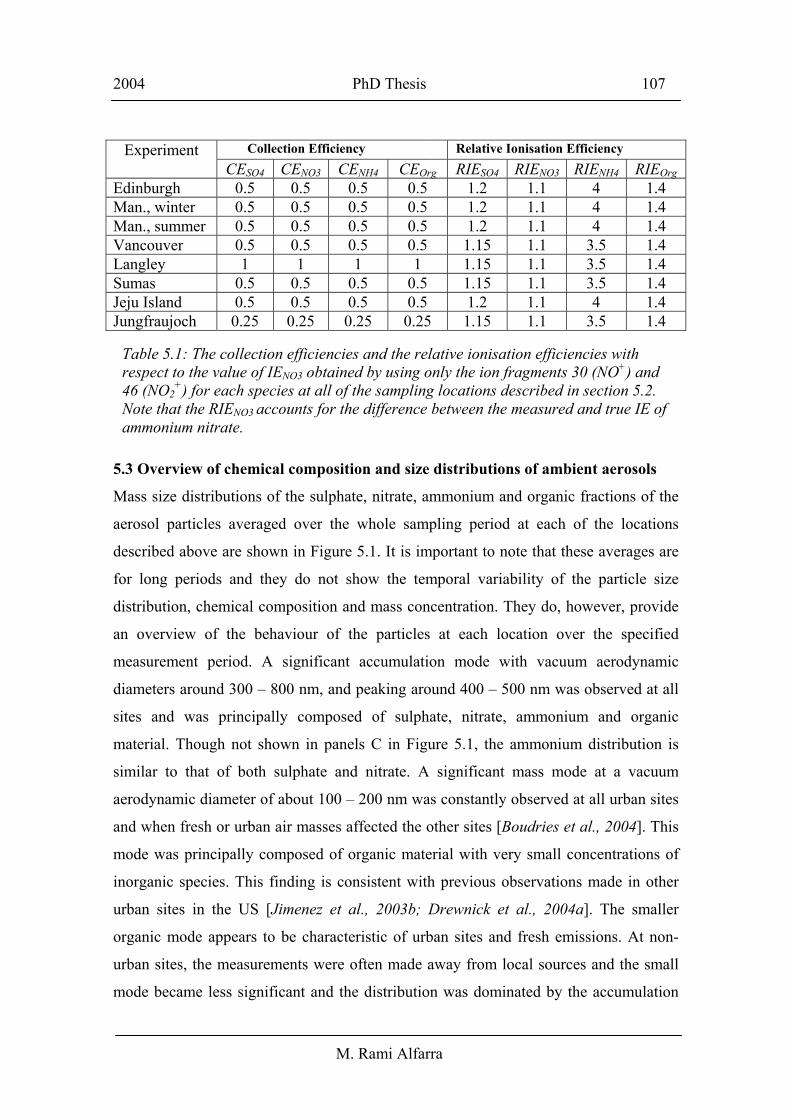
Experiment Collection Efficiency Relative Ionisation Efficiency CESO4 CENO3 CENH4 CEOrg RIESO4 RIENO3 RIENH4 RIEOrg Edinburgh 0.5 0.5 0.5 0.5 1.2 1.1 4 1.4 Man., winter 0.5 0.5 0.5 0.5 1.2 1.1 4 1.4 Man., summer 0.5 0.5 0.5 0.5 1.2 1.1 4 1.4 Vancouver 0.5 0.5 0.5 0.5 1.15 1.1 3.5 1.4 Langley 1 1 1 1 1.15 1.1 3.5 1.4 Sumas 0.5 0.5 0.5 0.5 1.15 1.1 3.5 1.4 Jeju Island 0.5 0.5 0.5 0.5 1.2 1.1 4 1.4 Jungfraujoch 0.25 0.25 0.25 0.25 1.15 1.1 3.5 1.4
5.3 Overview of chemical composition and size distributions of ambient aerosols
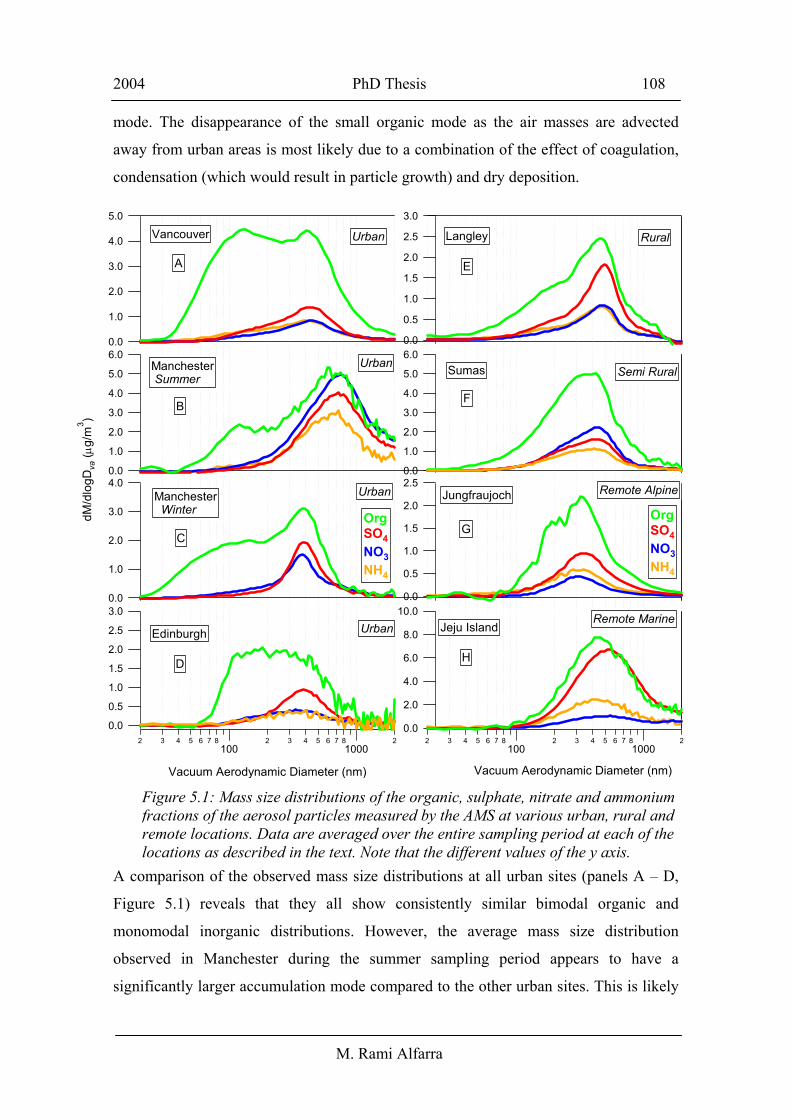
Mass size distributions of the sulphate, nitrate, ammonium and organic fractions of the
aerosol particles averaged over the whole sampling period at each of the locations
described above are shown in Figure 5.1. It is important to note that these averages are
for long periods and they do not show the temporal variability of the particle size
distribution, chemical composition and mass concentration. They do, however, provide
an overview of the behaviour of the particles at each location over the specified
measurement period. A significant accumulation mode with vacuum aerodynamic
diameters around 300 – 800 nm, and peaking around 400 – 500 nm was observed at all
sites and was principally composed of sulphate, nitrate, ammonium and organic
material. Though not shown in panels C in Figure 5.1, the ammonium distribution is
similar to that of both sulphate and nitrate. A significant mass mode at a vacuum
aerodynamic diameter of about 100 – 200 nm was constantly observed at all urban sites
and when fresh or urban air masses affected the other sites [Boudries et al., 2004]. This
mode was principally composed of organic material with very small concentrations of
inorganic species. This finding is consistent with previous observations made in other
urban sites in the US [Jimenez et al., 2003b; Drewnick et al., 2004a]. The smaller
organic mode appears to be characteristic of urban sites and fresh emissions. At non-
urban sites, the measurements were often made away from local sources and the small
mode became less significant and the distribution was dominated by the accumulation
Table 5.1: The collection efficiencies and the relative ionisation efficiencies with respect to the value of IENO3 obtained by using only the ion fragments 30 (NO+) and 46 (NO2
+) for each species at all of the sampling locations described in section 5.2. Note that the RIENO3 accounts for the difference between the measured and true IE of ammonium nitrate.
2004 PhD Thesis 108
M. Rami Alfarra
mode. The disappearance of the small organic mode as the air masses are advected
away from urban areas is most likely due to a combination of the effect of coagulation,
condensation (which would result in particle growth) and dry deposition.
A comparison of the observed mass size distributions at all urban sites (panels A – D,
Figure 5.1) reveals that they all show consistently similar bimodal organic and
monomodal inorganic distributions. However, the average mass size distribution
observed in Manchester during the summer sampling period appears to have a
significantly larger accumulation mode compared to the other urban sites. This is likely
5.0
4.0
3.0
2.0
1.0
0.0
2 3 4 5 6 7 8100
2 3 4 5 6 7 81000
2
Vacuum Aerodynamic Diameter (nm)
6.0
5.0
4.0
3.0
2.0
1.0
0.04.0
3.0
2.0
1.0
0.0
dM/d
logD
va (µ
g/m
3 )
3.0
2.5
2.0
1.5
1.0
0.5
0.0
10.0
8.0
6.0
4.0
2.0
0.02 3 4 5 6 7 8
1002 3 4 5 6 7 8
10002
Vacuum Aerodynamic Diameter (nm)
6.0
5.0
4.0
3.0
2.0
1.0
0.0
3.0
2.5
2.0
1.5
1.0
0.5
0.0
2.5
2.0
1.5
1.0
0.5
0.0
Edinburgh
Manchester Winter
Vancouver
Manchester Summer
Jeju Island
Jungfraujoch
Sumas
Langley
D
C
B
A E
F
G
H
OrgSO4NO3NH4
OrgSO4NO3NH4
Urban
Urban
Urban
Urban
Rural
Semi Rural
Remote Alpine
Remote Marine
Figure 5.1: Mass size distributions of the organic, sulphate, nitrate and ammonium fractions of the aerosol particles measured by the AMS at various urban, rural and remote locations. Data are averaged over the entire sampling period at each of the locations as described in the text. Note that the different values of the y axis.
2004 PhD Thesis 109
M. Rami Alfarra
to be caused by condensation of volatile material on existing particles. The observed
difference in the lower size cut off of the measured organic distributions is more likely
due to the difference in the particle transmission efficiency of the aerodynamic lens that
was upgraded before the Pacific 2001 experiment [Allan, 2004]. The temporal
variations of the size distributions of the accumulation mode components suggest that
they are internally mixed and are indicative of a regional background mode [Allan et al.,
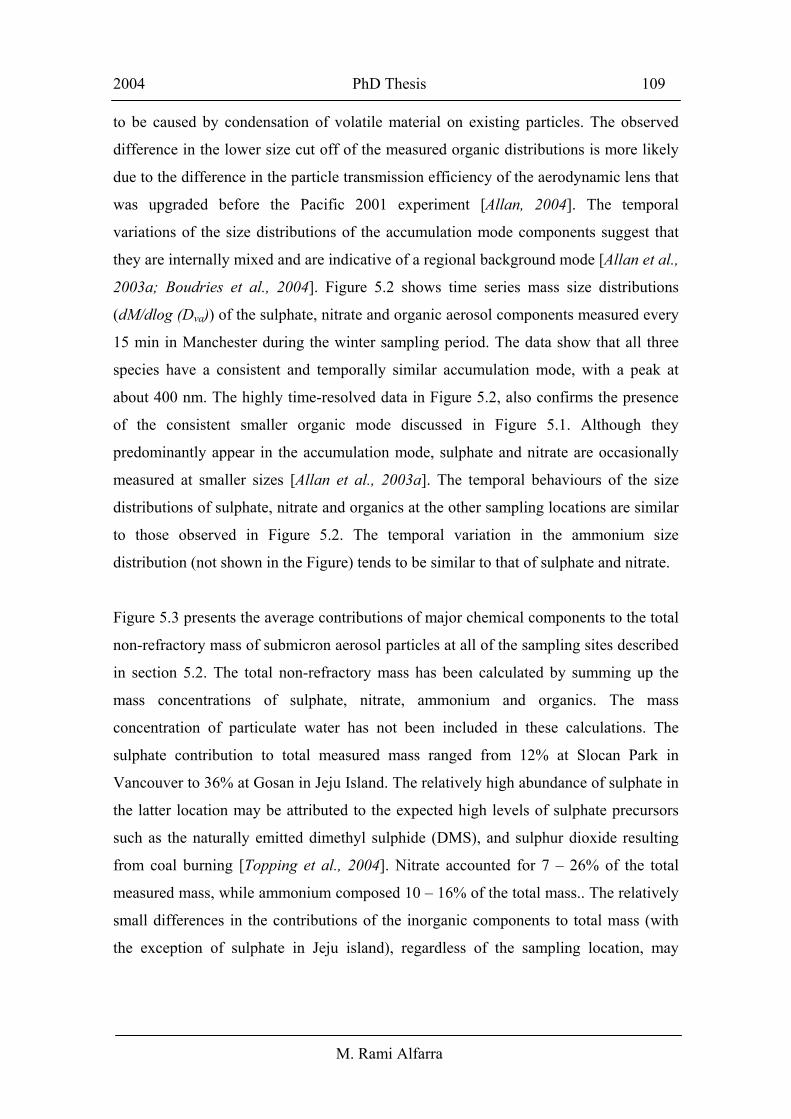
2003a; Boudries et al., 2004]. Figure 5.2 shows time series mass size distributions
(dM/dlog (Dva)) of the sulphate, nitrate and organic aerosol components measured every
15 min in Manchester during the winter sampling period. The data show that all three
species have a consistent and temporally similar accumulation mode, with a peak at
about 400 nm. The highly time-resolved data in Figure 5.2, also confirms the presence
of the consistent smaller organic mode discussed in Figure 5.1. Although they
predominantly appear in the accumulation mode, sulphate and nitrate are occasionally
measured at smaller sizes [Allan et al., 2003a]. The temporal behaviours of the size
distributions of sulphate, nitrate and organics at the other sampling locations are similar
to those observed in Figure 5.2. The temporal variation in the ammonium size
distribution (not shown in the Figure) tends to be similar to that of sulphate and nitrate.
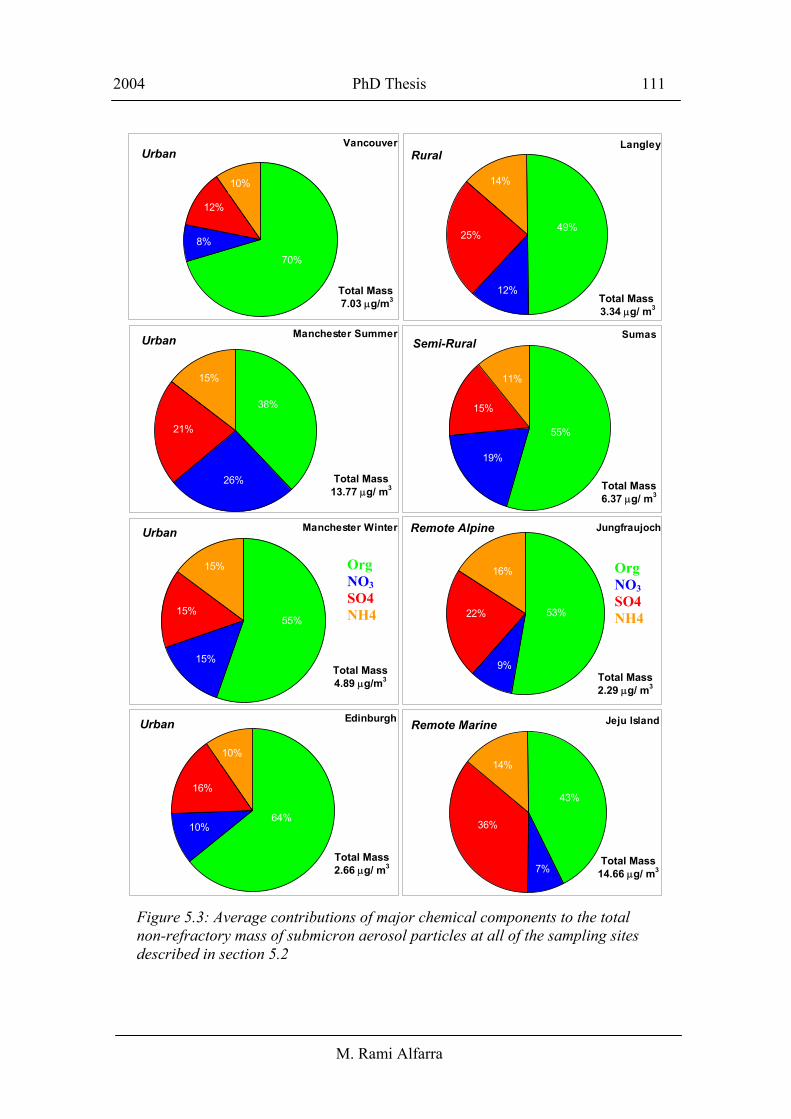
Figure 5.3 presents the average contributions of major chemical components to the total
non-refractory mass of submicron aerosol particles at all of the sampling sites described
in section 5.2. The total non-refractory mass has been calculated by summing up the
mass concentrations of sulphate, nitrate, ammonium and organics. The mass
concentration of particulate water has not been included in these calculations. The
sulphate contribution to total measured mass ranged from 12% at Slocan Park in
Vancouver to 36% at Gosan in Jeju Island. The relatively high abundance of sulphate in
the latter location may be attributed to the expected high levels of sulphate precursors
such as the naturally emitted dimethyl sulphide (DMS), and sulphur dioxide resulting
from coal burning [Topping et al., 2004]. Nitrate accounted for 7 – 26% of the total
measured mass, while ammonium composed 10 – 16% of the total mass.. The relatively
small differences in the contributions of the inorganic components to total mass (with
the exception of sulphate in Jeju island), regardless of the sampling location, may
2004 PhD Thesis 110
M. Rami Alfarra
indicate that these fractions of ambient particles are transported regionally, rather than
being locally emitted.
Figure 5.2: Time series of the mass size distributions of the nitrate, sulphate and organic aerosol components measured every 15 min in Manchester during the winter sampling period (see text).
2004 PhD Thesis 111
M. Rami Alfarra
Manchester Summer
21%
15%
38%
26%
Manchester Winter
15%
15%
15%
55%
Vancouver
8%
12%
10%
70%
Edinburgh
64%
10%
16%
10%
Total Mass 7.03 µg/m3
Total Mass 13.77 µg/ m3
Total Mass 4.89 µg/m3
Total Mass 2.66 µg/ m3
Langley
14%
25%
12%
49%
Sumas
19%
15%
55%
11%
Jungfraujoch
9%
22%
16%
53%
Jeju Island
7%
43%
14%
36%
Total Mass 2.29 µg/ m3
Total Mass 6.37 µg/ m3
Total Mass 3.34 µg/ m3
Total Mass 14.66 µg/ m3
Urban
Urban
Urban
Urban
Rural
Semi-Rural
Remote Alpine
Remote Marine
Org NO3 SO4 NH4
OrgNO3 SO4NH4
Figure 5.3: Average contributions of major chemical components to the total non-refractory mass of submicron aerosol particles at all of the sampling sites described in section 5.2
2004 PhD Thesis 112
M. Rami Alfarra
On the other hand, results reveal that the organic fraction is the most significant
contributor to the total mass measured by the AMS at all of the sampling locations,
accounting for 38 – 70% of the total mass. Organic material has been found to account
for 70% of the total mass measured at the Slocan Park urban site in Vancouver, which
represent an emissions-dominated regime. However, organics accounted for 53% of the
total mass measured at the Jungfraujoch high alpine research station, which is a remote
site away from local sources. These results illustrate the significance of the organic
fraction of ambient aerosols and the need for a better characterisation of its sources,
composition and processing.
5.4 Urban organic aerosols
As discussed in section 5.3, the organic fraction of ambient particulate shows a
consistent bimodal size distribution at all urban sites, where AMS measurements have
been made. The accumulation mass mode peaks at around 450 nm, while the peak of the
smaller mode occurs at approximately 150 nm. The sources and chemical composition
of those two modes are discussed in detail next.
5.4.1 Sources of urban organic aerosols
In order to determine the sources of the two modes observed in the organic mass size
distributions at the Slocan park site in Vancouver (as an example for urban locations),
the data was separated by fitting two log normal distributions using a Levenberg-
Marquardt non-linear least squares fit [Press, 1992]. The area under each fitted mode
represents its total organic mass loading. The small organic mode mass loading was
significant at the Slocan park urban site almost all of the time, while it was observed
only during some periods at the rural site of Langley; suggesting that this mode
originated from urban or fresh sources [Boudries et al., 2004]. The small organic mass
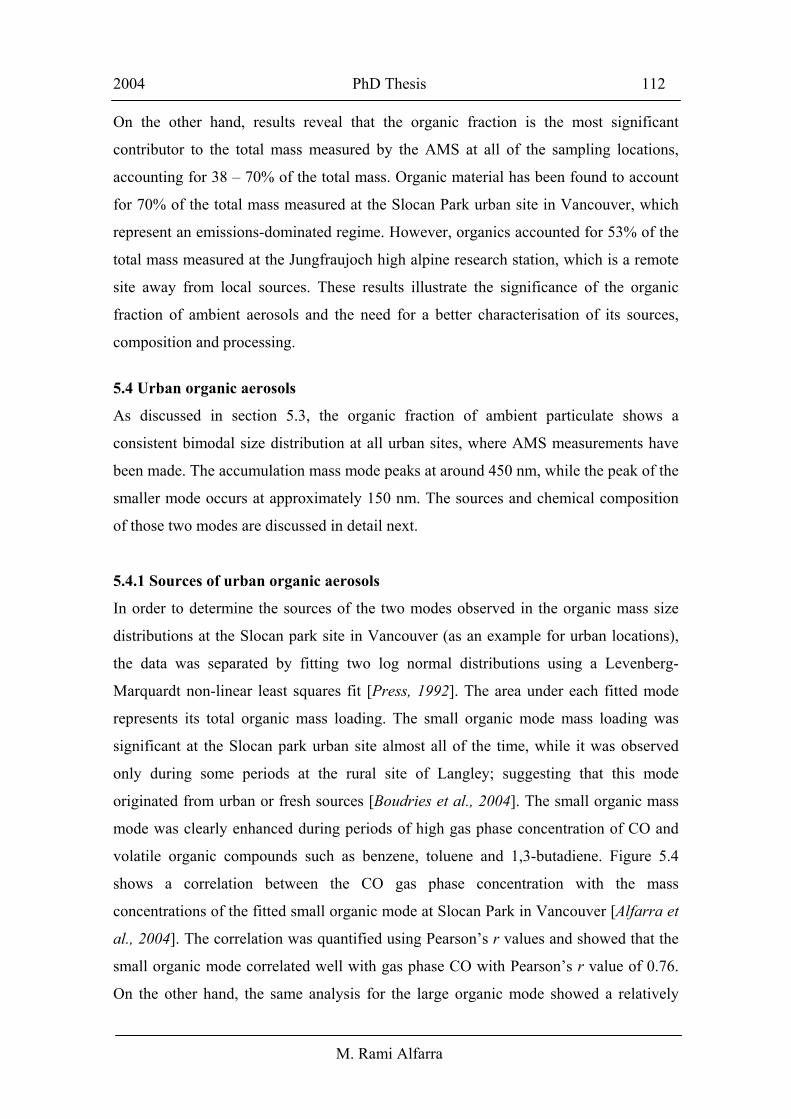
mode was clearly enhanced during periods of high gas phase concentration of CO and
volatile organic compounds such as benzene, toluene and 1,3-butadiene. Figure 5.4
shows a correlation between the CO gas phase concentration with the mass
concentrations of the fitted small organic mode at Slocan Park in Vancouver [Alfarra et
al., 2004]. The correlation was quantified using Pearson’s r values and showed that the
small organic mode correlated well with gas phase CO with Pearson’s r value of 0.76.
On the other hand, the same analysis for the large organic mode showed a relatively
2004 PhD Thesis 113
M. Rami Alfarra
weak correlation with gas phase CO with a Pearson’s r value of 0.58. The results also
showed that CO has a background gas phase concentration of 123 ppbv at a limit of
zero concentration of small organic particulate at this location. Similar correlations were
also calculated for benzene, 1,3-butadiene and toluene and resulted in Pearson’s r values
of 0.79, 0.71 and 0.69, respectively. These gas phase compounds, as well as gas phase
CO, are good markers of transport-related emissions and were themselves well
correlated within this experiment, with a Pearson’s r value of 0.75 for CO and 1,3-
butadiene. The major source of these trace gases in urban environments is from motor
vehicle exhaust. Light-duty vehicles were reported to contribute 63% of the total CO
emissions in the Lower Fraser Valley Airshed during the year 2000 [GVRD, 2002]. The
strong correlation, in Figure 5.4, suggests that combustion-related emissions (with
traffic likely representing a large fraction) are the main source of the small organic
mode at Slocan Park urban site. The weak correlation between gas phase CO and the
large organic mode indicate that other sources contribute to the latter.
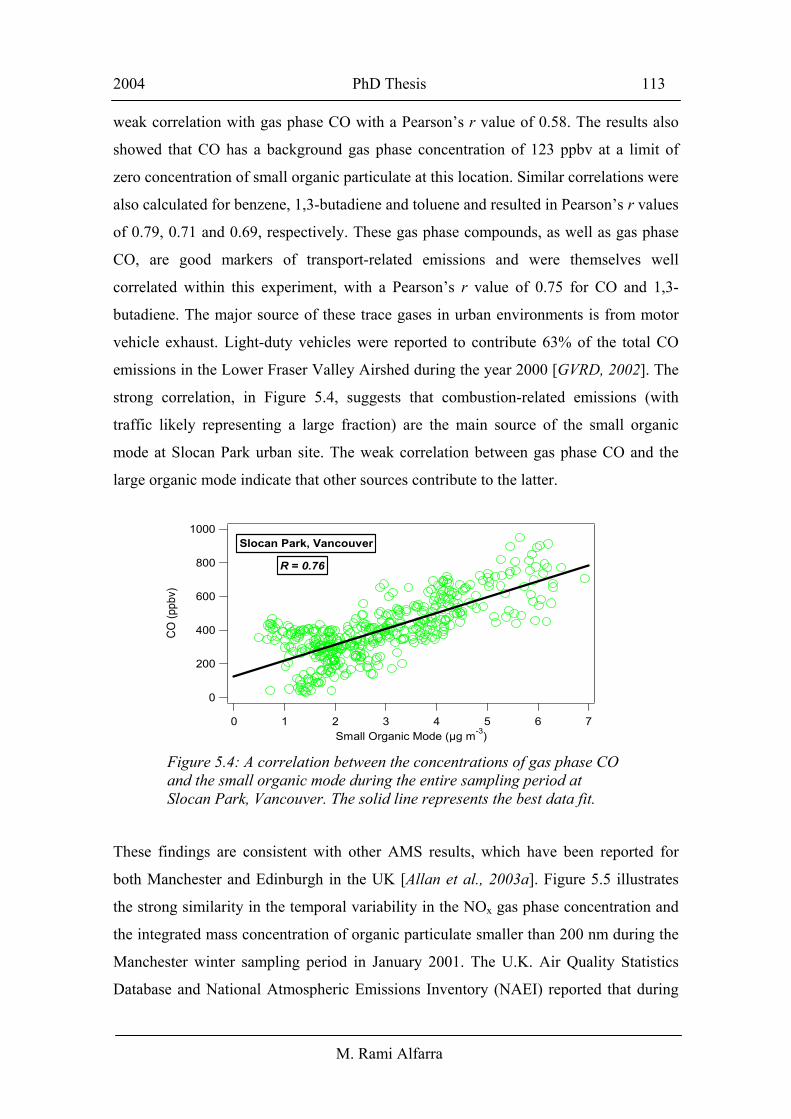
These findings are consistent with other AMS results, which have been reported for
both Manchester and Edinburgh in the UK [Allan et al., 2003a]. Figure 5.5 illustrates
the strong similarity in the temporal variability in the NOx gas phase concentration and
the integrated mass concentration of organic particulate smaller than 200 nm during the
Manchester winter sampling period in January 2001. The U.K. Air Quality Statistics
Database and National Atmospheric Emissions Inventory (NAEI) reported that during
1000
800
600
400
200
0
CO
(ppb
v)
76543210Small Organic Mode (µg m-3)
Slocan Park, Vancouver
R = 0.76
Figure 5.4: A correlation between the concentrations of gas phase CO and the small organic mode during the entire sampling period at Slocan Park, Vancouver. The solid line represents the best data fit.
2004 PhD Thesis 114
M. Rami Alfarra
1999, transport accounted for 44% and 73% of the NOx emissions in the UK and
Manchester, respectively.
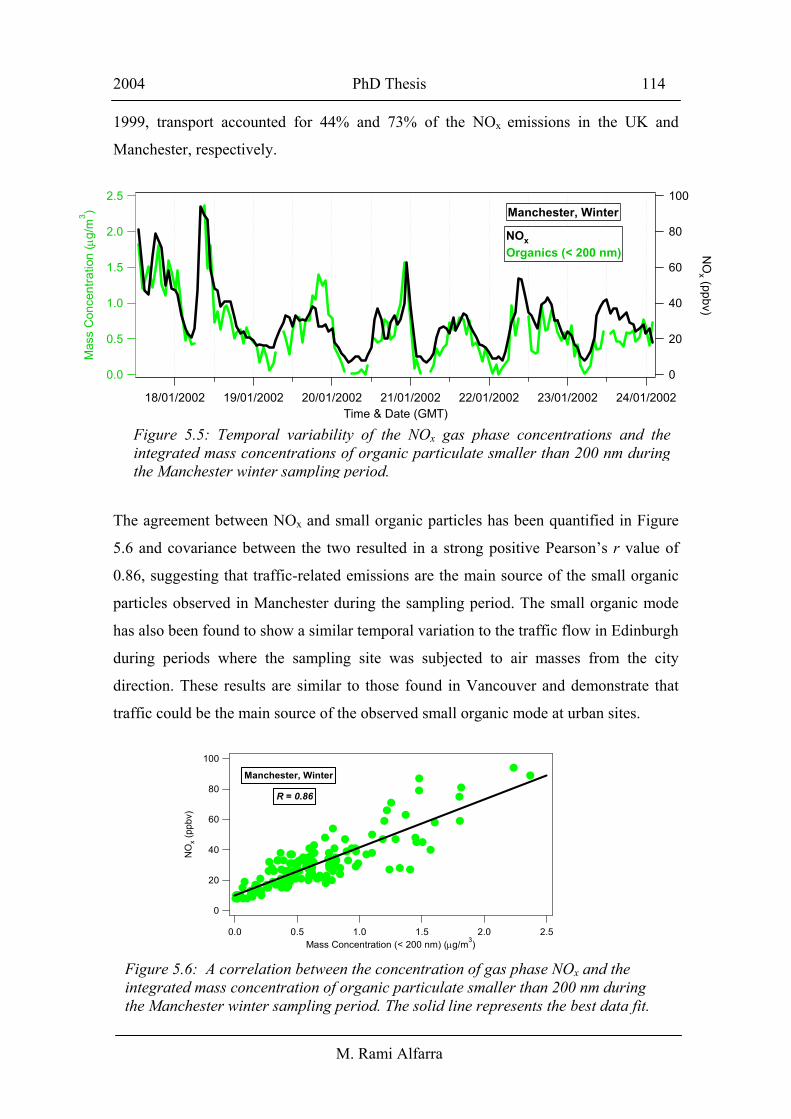
The agreement between NOx and small organic particles has been quantified in Figure
5.6 and covariance between the two resulted in a strong positive Pearson’s r value of
0.86, suggesting that traffic-related emissions are the main source of the small organic
particles observed in Manchester during the sampling period. The small organic mode
has also been found to show a similar temporal variation to the traffic flow in Edinburgh
during periods where the sampling site was subjected to air masses from the city
direction. These results are similar to those found in Vancouver and demonstrate that
traffic could be the main source of the observed small organic mode at urban sites.
Figure 5.5: Temporal variability of the NOx gas phase concentrations and theintegrated mass concentrations of organic particulate smaller than 200 nm duringthe Manchester winter sampling period.
2.5
2.0
1.5
1.0
0.5
0.0
Mas
s C
once
ntra
tion
(µg/
m3 )
18/01/2002 19/01/2002 20/01/2002 21/01/2002 22/01/2002 23/01/2002 24/01/2002Time & Date (GMT)
100
80
60
40
20
0
NO
x (ppbv)
NOxOrganics (< 200 nm)
Manchester, Winter
100
80
60
40
20
0
NO
x (pp
bv)
2.52.01.51.00.50.0Mass Concentration (< 200 nm) (µg/m3)
Manchester, Winter
R = 0.86
Figure 5.6: A correlation between the concentration of gas phase NOx and the integrated mass concentration of organic particulate smaller than 200 nm during the Manchester winter sampling period. The solid line represents the best data fit.
2004 PhD Thesis 115
M. Rami Alfarra
5.4.2 Chemical composition of urban organic particulate
The laboratory results discussed in chapter 4 (section 4.2) have shown that mass spectra
obtained using the AMS compare well to the NIST standard library of mass spectra for
a range of chemical compounds with the exception of highly oxidised organic
compounds such as oxo-, di- and poly-carboxylic acids and humic-like substances (see
section 5.6.3), where m/z 44 (CO2+) was found to be much more pronounced in the
AMS spectra. The enhanced m/z 44 signal was coupled with a very strong peak at m/z
18 indicative of H2O+, implying thermal breakdown of the carboxylic acid group on the
vaporiser. This phenomenon is reproducible and, coupled with the fact that m/z 44 is
generally small when sampling primary aerosol materials such as hydrocarbons, allows
us to use this peak as an indicator of highly oxidised organic compounds measured by
the AMS. It is important however to note that m/z 18 also receives large contributions
from gas phase water, sulphate and other species. To retrieve the total organic mass
loading, the contribution of water resulting from decarboxylation at m/z 18 is set equal
to m/z 44 based on laboratory results with pure compounds performed in Argon, where
the interferences to m/z 18 are eliminated [P. Silva, Utah State University, Personal
Communication]. As a result, there is no independent information about the mass
spectral signature of the observed organic in these experiments at m/z 18.
The m/z 43 is a characteristic fragment of both saturated hydrocarbon compounds
(C3H7+) and oxidised organic compounds such as aldehydes and ketones (CH2CHO+ or
CH3CO+). On the other hand m/z 57 is a typical fragment of saturated hydrocarbon
compounds (C4H9+) and receives a negligible contribution from oxidised organic
compounds. A correlation of the mass concentration of m/z 57 with the concentration of
the established primary gas phase marker CO at the urban site in Vancouver had a
Pearson’s r value of 0.74, while a similar correlation using m/z 44 at the same location
had a Pearson’s r value of 0.42. Similar correlations have been performed with the
Manchester winter data using NOx as a primary marker and resulted in Pearson’s r
values of 0.85 and 0.24 for m/z 57 and m/z 44, respectively. These correlations support
the selection of m/z 57 as a primary marker in the AMS data and may role out any
significant contribution of primary emissions to m/z 44.
2004 PhD Thesis 116
M. Rami Alfarra
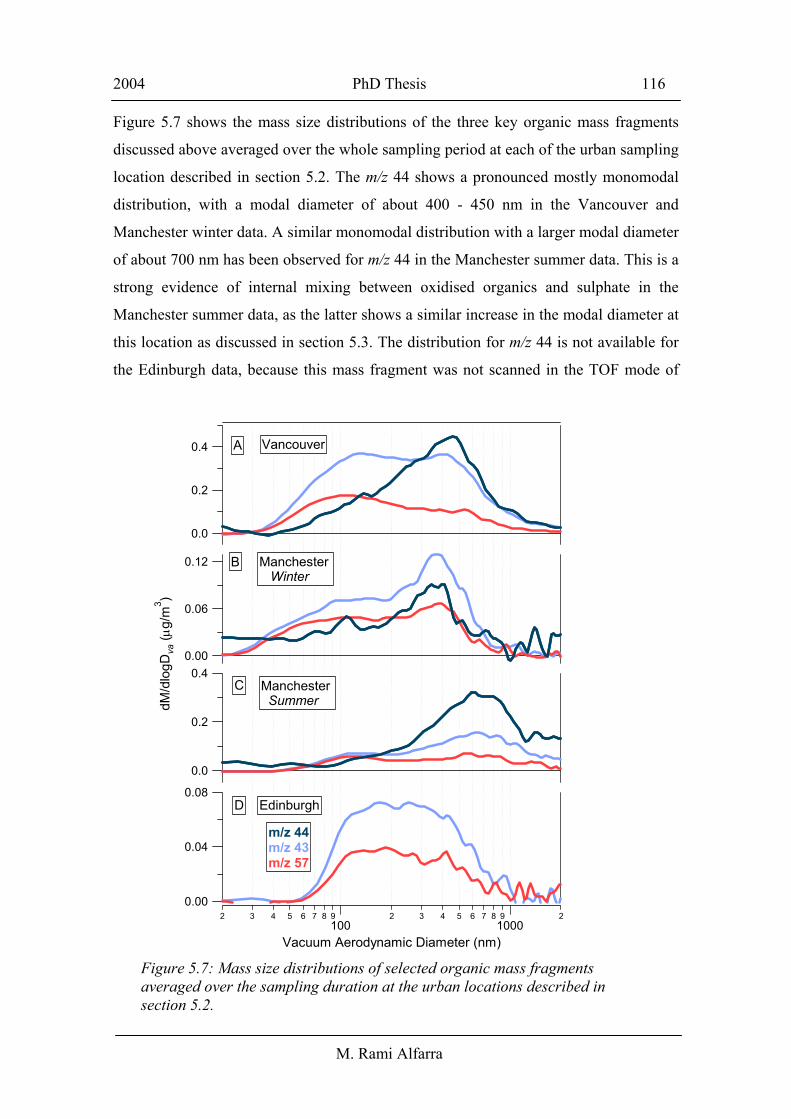
Figure 5.7 shows the mass size distributions of the three key organic mass fragments
discussed above averaged over the whole sampling period at each of the urban sampling
location described in section 5.2. The m/z 44 shows a pronounced mostly monomodal
distribution, with a modal diameter of about 400 - 450 nm in the Vancouver and
Manchester winter data. A similar monomodal distribution with a larger modal diameter
of about 700 nm has been observed for m/z 44 in the Manchester summer data. This is a
strong evidence of internal mixing between oxidised organics and sulphate in the
Manchester summer data, as the latter shows a similar increase in the modal diameter at
this location as discussed in section 5.3. The distribution for m/z 44 is not available for
the Edinburgh data, because this mass fragment was not scanned in the TOF mode of
Figure 5.7: Mass size distributions of selected organic mass fragments averaged over the sampling duration at the urban locations described in section 5.2.
0.08
0.04
0.002 3 4 5 6 7 8 9
1002 3 4 5 6 7 8 9
10002
Vacuum Aerodynamic Diameter (nm)
0.4
0.2
0.0
dM/d
logD
va (µ
g/m
3 )
0.12
0.06
0.00
0.4
0.2
0.0
m/z 44m/z 43m/z 57
Vancouver
Manchester Winter
Manchester Summer
Edinburgh
A
B
C
D
2004 PhD Thesis 117
M. Rami Alfarra
operation during this experiment. The domination of a monomodal distribution of m/z
44 in the urban sites implies that there is little contribution from highly oxidised organic
compounds in the small organic mode. In addition, the relative magnitudes of m/z 44 to
the other two fragments indicate the presence of more oxidised organic compounds in
the Manchester summer and Vancouver data relative to that of Manchester winter.
The other two mass fragments (m/z 43 and 57) show bimodal mass size distributions
similar to that observed for the total organic aerosol fraction shown in Figure 5.1. The
relative magnitudes of the small and large modes for m/z 43 and m/z 57 reflects the
contribution of different sources to these mass fragments, in particular the contribution
of oxidised organics to m/z 43 as discussed above. For example, in the Manchester
summer data the two modes of m/z 57 have similar peak magnitudes, while the
accumulation mode is larger than the small mode in the case of m/z 43 indicating that
oxidised species contribute more to m/z 43 than m/z 57 in the accumulation mode size
range.
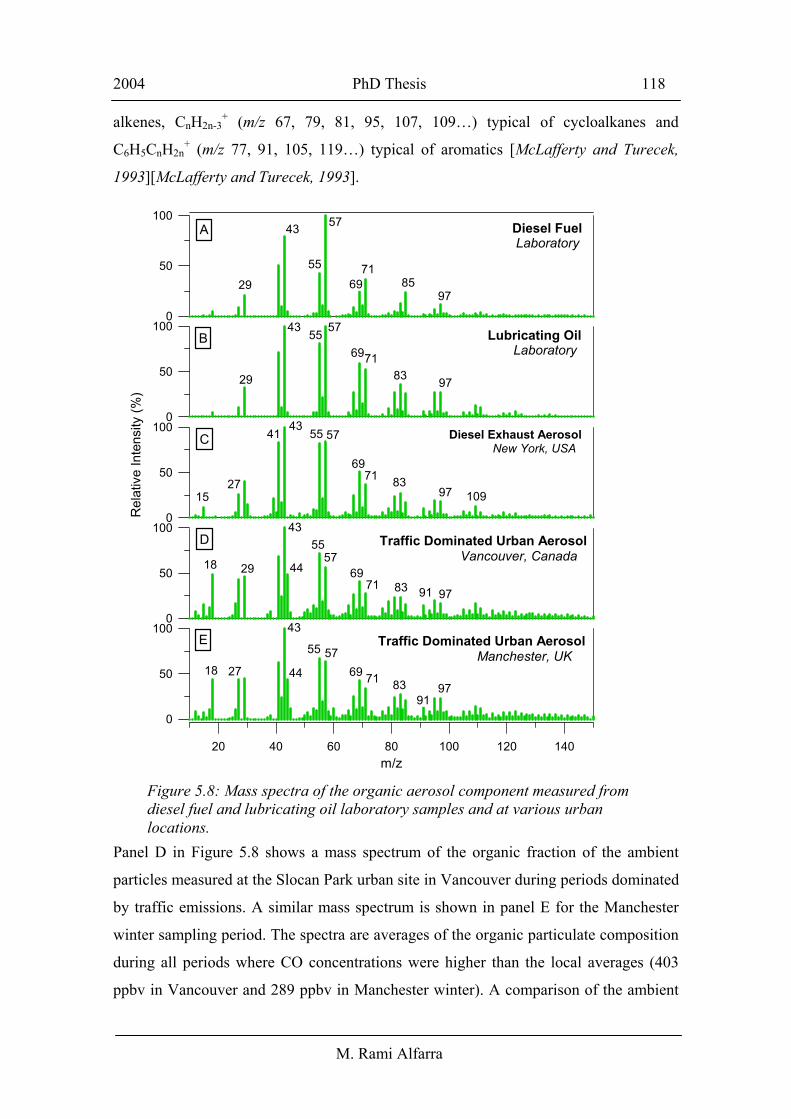
More information on the chemical composition of urban organic aerosols can be derived
from their mass spectral signatures. Panel C in Figure 5.8 shows a mass spectrum of
diesel bus exhaust aerosol obtained by Canagaratna et al., [2004] in a recent “vehicle
chasing” study using an AMS instrument identical to the one described here. The study
was designed to characterise both gaseous and particulate matter emissions from
individual in-use vehicles under real world driving conditions in New York City. The
diesel exhaust spectrum was compared to laboratory generated diesel fuel (panel A) and
lubricating oil (panel B) spectra and the study concluded that under most operating
conditions the organic carbon fraction of in-use diesel vehicle exhaust aerosol is
dominated by the recondensed vapor from the evaporated engine lubricating oil. These
findings were similar to those found by Tobias et al., [2001] and Sakurai et al., [2003],
which also concluded that the dominant organic components of fuel and lubricating oil
are n-alkanes, branched alkanes, cycloalkanes, and aromatics (including polyaromatic
hydrocarbons). All spectra were dominated by the ion series CnH2n+1+ (m/z 29, 43, 57,
71, 85…), which is typical of saturated normal and branched alkanes. Other important
ion series were also observed including CnH2n-1+ (m/z 27, 41, 55, 69,83…) typical of
2004 PhD Thesis 118
M. Rami Alfarra
alkenes, CnH2n-3+ (m/z 67, 79, 81, 95, 107, 109…) typical of cycloalkanes and
C6H5CnH2n+ (m/z 77, 91, 105, 119…) typical of aromatics [McLafferty and Turecek,
1993][McLafferty and Turecek, 1993].
Panel D in Figure 5.8 shows a mass spectrum of the organic fraction of the ambient
particles measured at the Slocan Park urban site in Vancouver during periods dominated
by traffic emissions. A similar mass spectrum is shown in panel E for the Manchester
winter sampling period. The spectra are averages of the organic particulate composition
during all periods where CO concentrations were higher than the local averages (403
ppbv in Vancouver and 289 ppbv in Manchester winter). A comparison of the ambient
Figure 5.8: Mass spectra of the organic aerosol component measured from diesel fuel and lubricating oil laboratory samples and at various urban locations.
100
50
0
14012010080604020m/z
100
50
0
Rel
ativ
e In
tens
ity (%
)
100
50
0
100
50
0100
50
0
Diesel Fuel Laboratory
Lubricating Oil Laboratory
Disel Exhaust Aerosol New York, USA
Traffic Dominated Urban Aerosol Vancouver, Canada
A
B
C
D
E Traffic Dominated Urban Aerosol Manchester, UK
18
18
15
27
27
29
29
29
43
43
43
43
43
44
44
41
55
55
55
55
55
57
57
57
57
57
71
71
71
71
7169
69
69
69
69 85
83
83
83
83
97
97
97
9791
9197
109
Diesel Exhaust Aerosol New York, USA
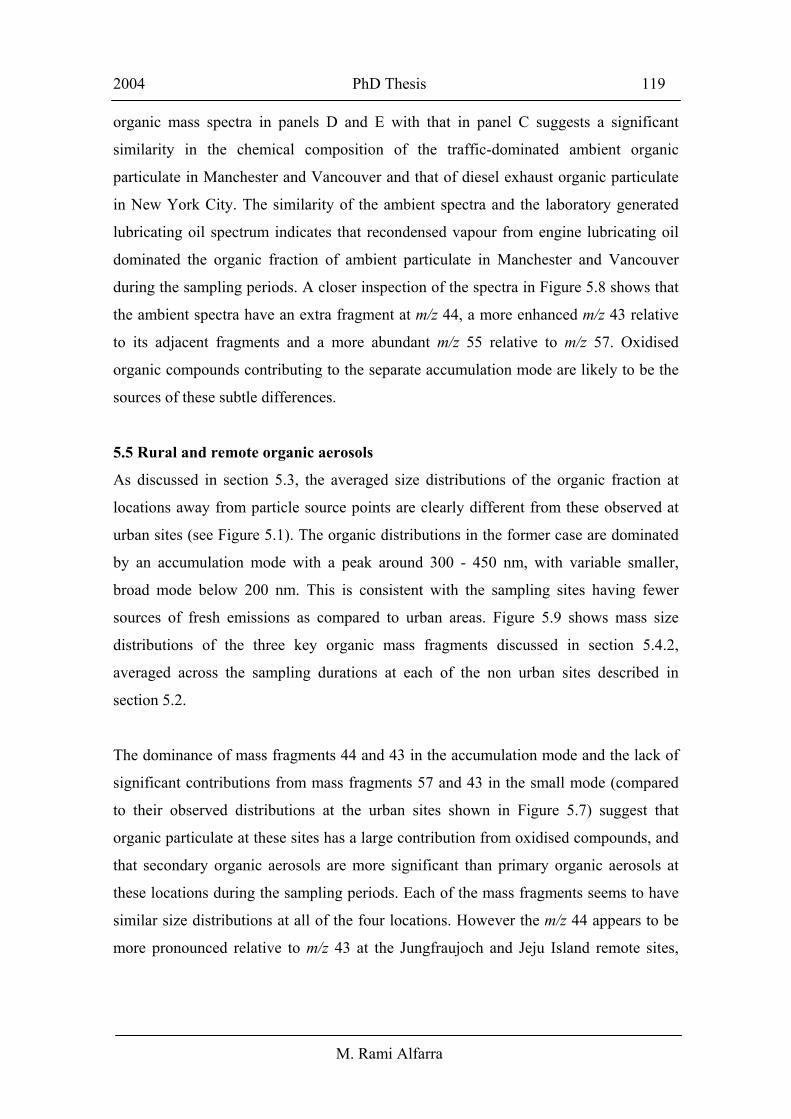
2004 PhD Thesis 119
M. Rami Alfarra
organic mass spectra in panels D and E with that in panel C suggests a significant
similarity in the chemical composition of the traffic-dominated ambient organic
particulate in Manchester and Vancouver and that of diesel exhaust organic particulate
in New York City. The similarity of the ambient spectra and the laboratory generated
lubricating oil spectrum indicates that recondensed vapour from engine lubricating oil
dominated the organic fraction of ambient particulate in Manchester and Vancouver
during the sampling periods. A closer inspection of the spectra in Figure 5.8 shows that
the ambient spectra have an extra fragment at m/z 44, a more enhanced m/z 43 relative
to its adjacent fragments and a more abundant m/z 55 relative to m/z 57. Oxidised
organic compounds contributing to the separate accumulation mode are likely to be the
sources of these subtle differences.
5.5 Rural and remote organic aerosols
As discussed in section 5.3, the averaged size distributions of the organic fraction at
locations away from particle source points are clearly different from these observed at
urban sites (see Figure 5.1). The organic distributions in the former case are dominated
by an accumulation mode with a peak around 300 - 450 nm, with variable smaller,
broad mode below 200 nm. This is consistent with the sampling sites having fewer
sources of fresh emissions as compared to urban areas. Figure 5.9 shows mass size
distributions of the three key organic mass fragments discussed in section 5.4.2,
averaged across the sampling durations at each of the non urban sites described in
section 5.2.
The dominance of mass fragments 44 and 43 in the accumulation mode and the lack of
significant contributions from mass fragments 57 and 43 in the small mode (compared
to their observed distributions at the urban sites shown in Figure 5.7) suggest that
organic particulate at these sites has a large contribution from oxidised compounds, and
that secondary organic aerosols are more significant than primary organic aerosols at
these locations during the sampling periods. Each of the mass fragments seems to have
similar size distributions at all of the four locations. However the m/z 44 appears to be
more pronounced relative to m/z 43 at the Jungfraujoch and Jeju Island remote sites,
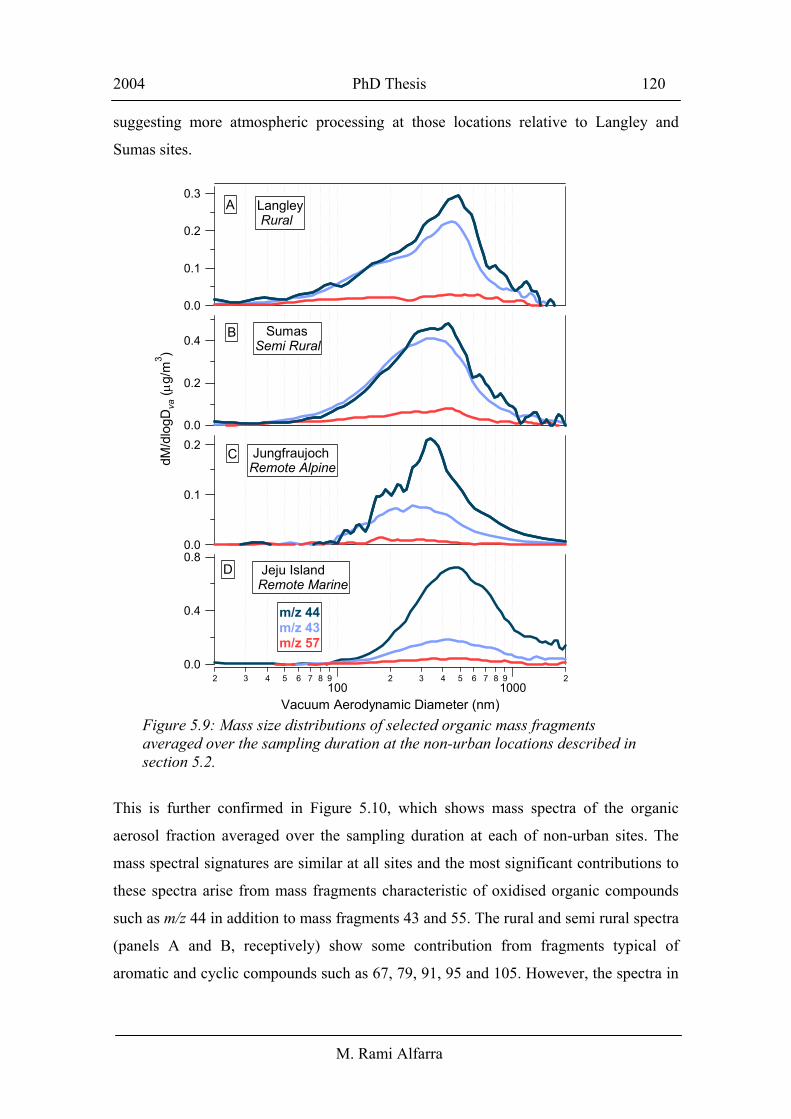
2004 PhD Thesis 120
M. Rami Alfarra
suggesting more atmospheric processing at those locations relative to Langley and
Sumas sites.
This is further confirmed in Figure 5.10, which shows mass spectra of the organic
aerosol fraction averaged over the sampling duration at each of non-urban sites. The
mass spectral signatures are similar at all sites and the most significant contributions to
these spectra arise from mass fragments characteristic of oxidised organic compounds
such as m/z 44 in addition to mass fragments 43 and 55. The rural and semi rural spectra
(panels A and B, receptively) show some contribution from fragments typical of
aromatic and cyclic compounds such as 67, 79, 91, 95 and 105. However, the spectra in
Figure 5.9: Mass size distributions of selected organic mass fragments averaged over the sampling duration at the non-urban locations described in section 5.2.
0.8
0.4
0.02 3 4 5 6 7 8 9
1002 3 4 5 6 7 8 9
10002
Vacuum Aerodynamic Diameter (nm)
0.2
0.1
0.0
dM/d
logD
va (µ
g/m
3 )
0.4
0.2
0.0
0.3
0.2
0.1
0.0
m/z 44m/z 43m/z 57
Langley Rural
SumasSemi Rural
JungfraujochRemote Alpine
Jeju Island Remote Marine
A
B
C
D
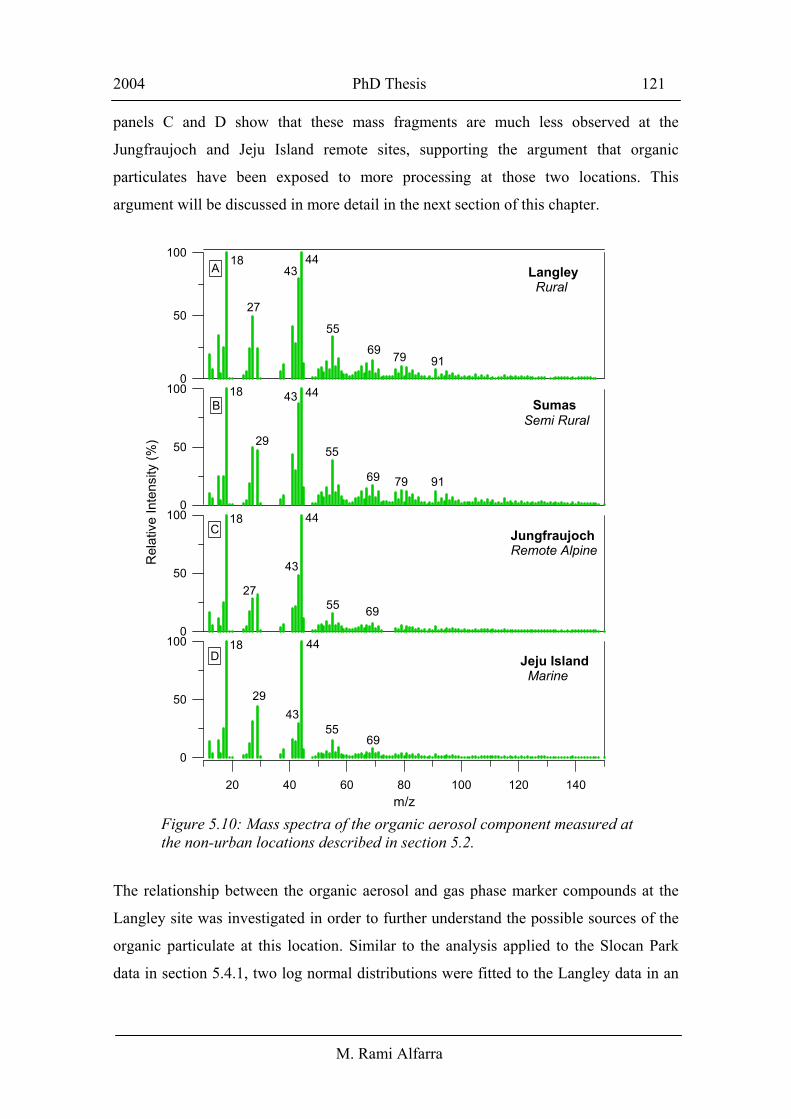
2004 PhD Thesis 121
M. Rami Alfarra
panels C and D show that these mass fragments are much less observed at the
Jungfraujoch and Jeju Island remote sites, supporting the argument that organic
particulates have been exposed to more processing at those two locations. This
argument will be discussed in more detail in the next section of this chapter.
The relationship between the organic aerosol and gas phase marker compounds at the
Langley site was investigated in order to further understand the possible sources of the
organic particulate at this location. Similar to the analysis applied to the Slocan Park
data in section 5.4.1, two log normal distributions were fitted to the Langley data in an
Figure 5.10: Mass spectra of the organic aerosol component measured at the non-urban locations described in section 5.2.
100
50
0
14012010080604020m/z
100
50
0
100
50
0
Rel
ativ
e In
tens
ity (%
)
100
50
0
Langley Rural
Sumas Semi Rural
JungfraujochRemote Alpine
Jeju Island Marine
18
18
18
18
27
27
29
29
43
43
43
4344
44
44
44
55
55
55
55
69
69
79 91
9179
69
69
A
B
C
D
2004 PhD Thesis 122
M. Rami Alfarra
attempt to understand the behaviour of the two organic modes at this rural location.
However, as the two modes were typically less distinct than at the Slocan Park urban
site, the fits converged less often and the fitted parameters had to be treated carefully.
Any fitted distributions that did not result in a turning point between the two peaks were
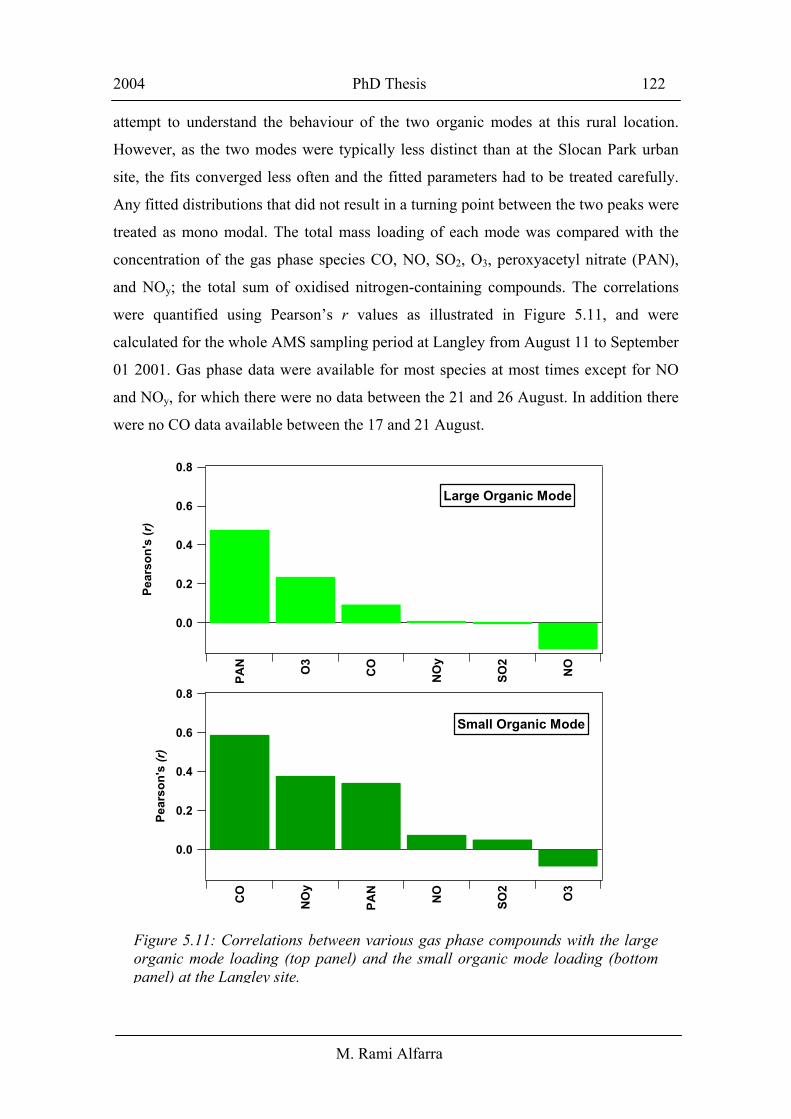
treated as mono modal. The total mass loading of each mode was compared with the
concentration of the gas phase species CO, NO, SO2, O3, peroxyacetyl nitrate (PAN),
and NOy; the total sum of oxidised nitrogen-containing compounds. The correlations
were quantified using Pearson’s r values as illustrated in Figure 5.11, and were
calculated for the whole AMS sampling period at Langley from August 11 to September
01 2001. Gas phase data were available for most species at most times except for NO
and NOy, for which there were no data between the 21 and 26 August. In addition there
were no CO data available between the 17 and 21 August.
0.8
0.6
0.4
0.2
0.0
Pear
son'
s (r
)
PAN O3
CO
NO
y
SO2
NO
Large Organic Mode
0.8
0.6
0.4
0.2
0.0
Pear
son'
s (r
)
CO
NO
y
PAN
NO
SO2
O3
Small Organic Mode
Figure 5.11: Correlations between various gas phase compounds with the largeorganic mode loading (top panel) and the small organic mode loading (bottompanel) at the Langley site.
2004 PhD Thesis 123
M. Rami Alfarra
The small organic mode had the strongest correlations with CO and NOy (which
includes NOx) indicating that a significant part of this mode originated from combustion
sources; similar to that found at the Slocan Park site. On the other hand, the large
accumulation organic mode had the strongest correlations with PAN and O3, which are
indicators of photochemical oxidation and production, respectively. The correlations in
Figure 5.11 combined with the size distributions in panel A of Figure 5.9 suggest that
the small organic mode was mainly observed when the Langley site was exposed to
recent combustion emissions, while a large fraction of the accumulation mode was a
result of secondary aerosol formation and/or aerosol photochemical processing. These
findings are in agreement with observations, which have been reported by a number of
researchers regarding the importance of polar organics in particles in rural and remote
regions. For example, infrared spectroscopy was used to illustrate the predominance of
polar organics in submicron particles in a relatively remote site in the Smoky
Mountains, Tennessee, USA [Blando et al., 1998]. In a study of long range transport of
air pollution in central Japan, dicarboxylic acids were shown to comprise as much as 30
– 50% of the total organic particulate matter and most of them were estimated to be
formed by oxidation of precursors in air [Satsumabayashi et al., 1989; Satsumabayashi
et al., 1990]. The chemical composition of organic particulate in rural and remote
regions is discussed in more detail in section 5.6.3.
5.6 Processing of organic aerosols
5.6.1 Comparison of ‘fresh’ and ‘processed’ organic aerosols
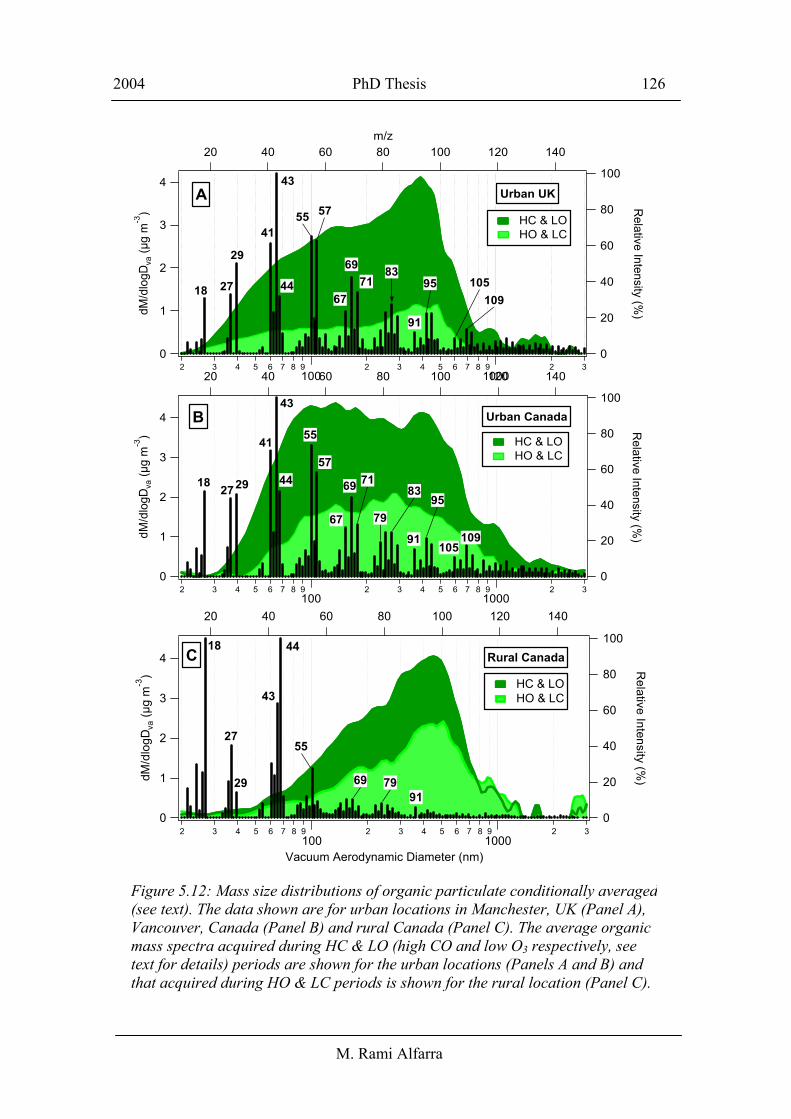
The graphs in Figure 5.12 classify organic particulate measured at urban locations in
Manchester (Panel A), Vancouver (Panel B) and at a rural location in Langley, Canada
(Panel C) as a function of the CO and O3 concentrations observed at these locations
during the same measurement periods. Each panel (A-C) shows two organic mass size
distributions averaged over conditionally selected periods. The selection criteria for the
first distribution in panels (A-C) are that CO concentrations are higher than the local
mean value and O3 concentrations are lower than the local mean value (hereafter
referred to as HC & LO). The second distribution in panels (A-C) has the converse
criteria of HO & LC applied. Table 5.2 shows the local mean concentrations of CO and
O3 at each site. The HC & LO periods indicate a higher than average influence of
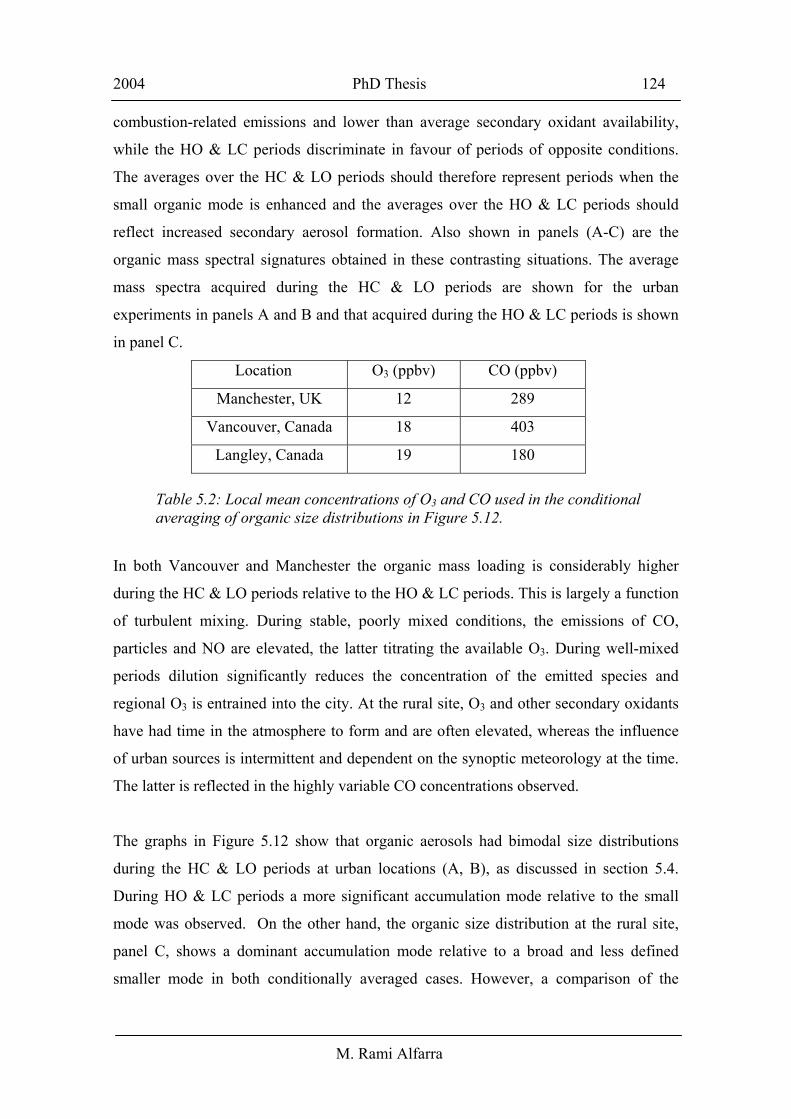
2004 PhD Thesis 124
M. Rami Alfarra
combustion-related emissions and lower than average secondary oxidant availability,
while the HO & LC periods discriminate in favour of periods of opposite conditions.
The averages over the HC & LO periods should therefore represent periods when the
small organic mode is enhanced and the averages over the HO & LC periods should
reflect increased secondary aerosol formation. Also shown in panels (A-C) are the
organic mass spectral signatures obtained in these contrasting situations. The average
mass spectra acquired during the HC & LO periods are shown for the urban
experiments in panels A and B and that acquired during the HO & LC periods is shown
in panel C.
Location O3 (ppbv) CO (ppbv)
Manchester, UK 12 289
Vancouver, Canada 18 403
Langley, Canada 19 180
In both Vancouver and Manchester the organic mass loading is considerably higher
during the HC & LO periods relative to the HO & LC periods. This is largely a function
of turbulent mixing. During stable, poorly mixed conditions, the emissions of CO,
particles and NO are elevated, the latter titrating the available O3. During well-mixed
periods dilution significantly reduces the concentration of the emitted species and
regional O3 is entrained into the city. At the rural site, O3 and other secondary oxidants
have had time in the atmosphere to form and are often elevated, whereas the influence
of urban sources is intermittent and dependent on the synoptic meteorology at the time.
The latter is reflected in the highly variable CO concentrations observed.
The graphs in Figure 5.12 show that organic aerosols had bimodal size distributions
during the HC & LO periods at urban locations (A, B), as discussed in section 5.4.
During HO & LC periods a more significant accumulation mode relative to the small
mode was observed. On the other hand, the organic size distribution at the rural site,
panel C, shows a dominant accumulation mode relative to a broad and less defined
smaller mode in both conditionally averaged cases. However, a comparison of the
Table 5.2: Local mean concentrations of O3 and CO used in the conditional averaging of organic size distributions in Figure 5.12.
2004 PhD Thesis 125
M. Rami Alfarra
organic distribution during HC & LO periods to that of HO & LC periods shows that
the former has a broader small organic mode suggesting more fresh emissions during
the HC & LO periods into a background of a large mass of accumulation mode oxidised
organic aerosol.
The organic mass spectra averaged during the HC & LO periods at both urban locations
seem to have almost the same fragments; indicating that the chemical composition of
the recently emitted organic particulate in Manchester and Vancouver is likely to be
very similar. Which, when compared with laboratory generated mass spectral signatures
(discussed in section 5.4.2), implies a mixture of saturated and un-saturated
hydrocarbons, cyclic compounds and some aromatics. The mass spectrum in panel C
shows the averaged chemical composition of organic particulate during HO & LC
periods at the rural site. The spectrum looks clearly different to those of the fresh urban
aerosols in graphs A and B. It is dominated by mass fragments that are typical of
oxidised organic compounds such as m/z 44, signatures of di- and poly- carboxylic
acids, in addition to mass fragments 43 and 55 which can be associated with other types
of oxidised organic compounds including aldehydes and ketones [McLafferty and
Turecek, 1993]. The hydrocarbon contribution to mass fragments 43 and 55 is likely to
be small in this spectrum as the signal at m/z 57 is almost negligible and the small
organic mode is negligibly small during the HO & LC periods. The spectrum also
contains very small contributions from mass fragments typical of cyclic compounds
such as m/z 67 and 79 in addition to aromatic fragments like m/z 91. The presence of
relatively high molecular weight fragments in the urban spectra represents another
significant difference between the rural and urban organic particulate, suggesting that
secondary organic aerosols or the processed primary organic compounds produce
shorter carbon chain fragments. The rate of this transformation will be enhanced during
periods of enhanced O3 concentrations when oxidant availability is high.
2004 PhD Thesis 126
M. Rami Alfarra
4
3
2
1
0
dM/d
logD
va (µ
g m
-3)
2 3 4 5 6 7 8 9100
2 3 4 5 6 7 8 91000
2 3
100
80
60
40
20
0
Relative Intensity (%
)
14012010080604020
HC & LO HO & LC
B Urban Canada
18 2729
41
43
55
57
69
67
71
79
83
91
95
105109
44
4
3
2
1
0
dM/d
logD
va (µ
g m
-3)
2 3 4 5 6 7 8 9100
2 3 4 5 6 7 8 91000
2 3
100
80
60
40
20
0
Relative Intensity (%
)14012010080604020
m/z
A HC & LO HO & LC
Urban UK
18 27
29
41
43
55 57
67
6971
83
91
95109
10544
4
3
2
1
0
dM/d
logD
va (µ
g m
-3)
2 3 4 5 6 7 8 9100
2 3 4 5 6 7 8 91000
2 3
Vacuum Aerodynamic Diameter (nm)
100
80
60
40
20
0
Relative Intensity (%
)
14012010080604020
HC & LO HO & LC
Rural CanadaC18
27
29
43
44
55
917969
Figure 5.12: Mass size distributions of organic particulate conditionally averaged(see text). The data shown are for urban locations in Manchester, UK (Panel A), Vancouver, Canada (Panel B) and rural Canada (Panel C). The average organic mass spectra acquired during HC & LO (high CO and low O3 respectively, see text for details) periods are shown for the urban locations (Panels A and B) and that acquired during HO & LC periods is shown for the rural location (Panel C).
2004 PhD Thesis 127
M. Rami Alfarra
5.6.2 Influence of photochemistry on the chemical signature and size distribution
of organic aerosols
A bimodal size distribution with a significant combustion-related small organic mode
composed of hydrocarbons and aromatics has been found to be typical of urban sites.
However, during the first few days of sampling at Slocan Park in Vancouver, the site
was exposed to a photochemical episode where the O3 level reached ~ 80 ppbv at times
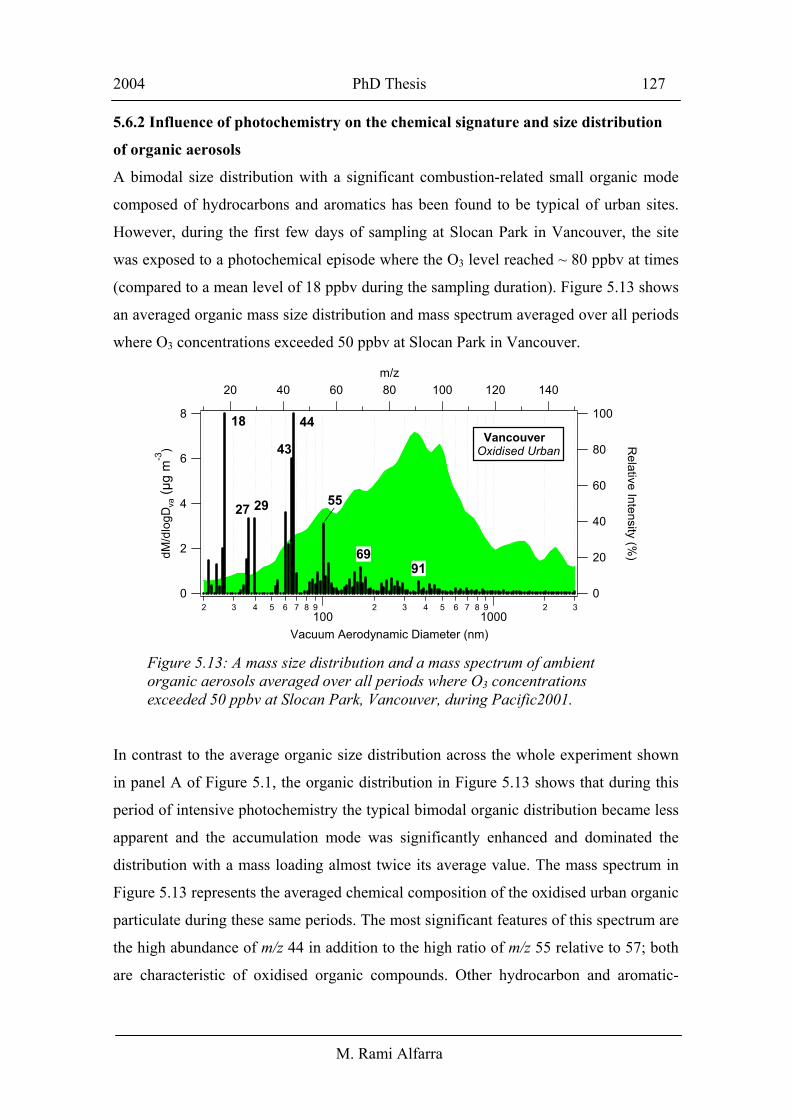
(compared to a mean level of 18 ppbv during the sampling duration). Figure 5.13 shows
an averaged organic mass size distribution and mass spectrum averaged over all periods
where O3 concentrations exceeded 50 ppbv at Slocan Park in Vancouver.
In contrast to the average organic size distribution across the whole experiment shown
in panel A of Figure 5.1, the organic distribution in Figure 5.13 shows that during this
period of intensive photochemistry the typical bimodal organic distribution became less
apparent and the accumulation mode was significantly enhanced and dominated the
distribution with a mass loading almost twice its average value. The mass spectrum in
Figure 5.13 represents the averaged chemical composition of the oxidised urban organic
particulate during these same periods. The most significant features of this spectrum are
the high abundance of m/z 44 in addition to the high ratio of m/z 55 relative to 57; both
are characteristic of oxidised organic compounds. Other hydrocarbon and aromatic-
8
6
4
2
0
dM/d
logD
va (µ
g m
-3)
2 3 4 5 6 7 8 9100
2 3 4 5 6 7 8 91000
2 3
Vacuum Aerodynamic Diameter (nm)
100
80
60
40
20
0
Relative Intensity (%
)
14012010080604020m/z
18 VancouverOxidised Urban
29
43
44
55
6991
27
Figure 5.13: A mass size distribution and a mass spectrum of ambient organic aerosols averaged over all periods where O3 concentrations exceeded 50 ppbv at Slocan Park, Vancouver, during Pacific2001.
2004 PhD Thesis 128
M. Rami Alfarra
related ion series can still be observed, as their combustion-related sources always exist
at this urban site. A similar mass spectrum has also been observed in the Manchester
summer data, where the averaged accumulation mode was larger in size than
Manchester winter, suggesting that photochemical activity was high in Manchester
during most of that sampling period.
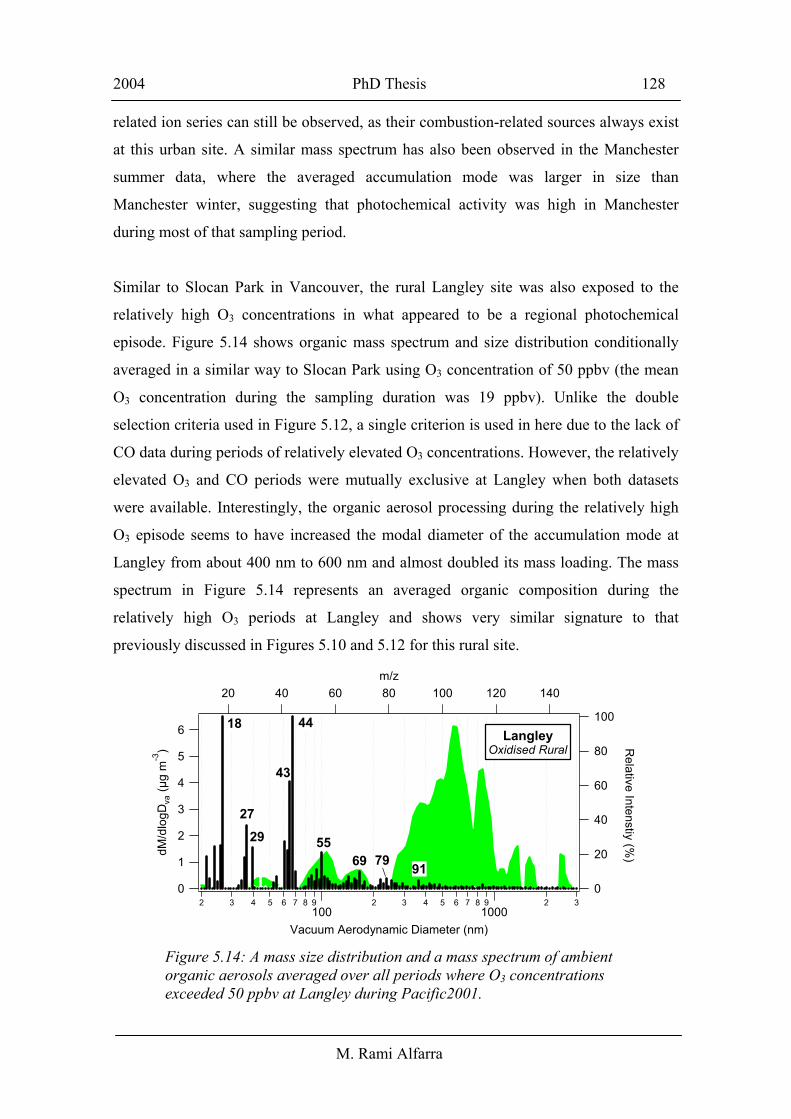
Similar to Slocan Park in Vancouver, the rural Langley site was also exposed to the
relatively high O3 concentrations in what appeared to be a regional photochemical
episode. Figure 5.14 shows organic mass spectrum and size distribution conditionally
averaged in a similar way to Slocan Park using O3 concentration of 50 ppbv (the mean
O3 concentration during the sampling duration was 19 ppbv). Unlike the double
selection criteria used in Figure 5.12, a single criterion is used in here due to the lack of
CO data during periods of relatively elevated O3 concentrations. However, the relatively
elevated O3 and CO periods were mutually exclusive at Langley when both datasets
were available. Interestingly, the organic aerosol processing during the relatively high
O3 episode seems to have increased the modal diameter of the accumulation mode at
Langley from about 400 nm to 600 nm and almost doubled its mass loading. The mass
spectrum in Figure 5.14 represents an averaged organic composition during the
relatively high O3 periods at Langley and shows very similar signature to that
previously discussed in Figures 5.10 and 5.12 for this rural site.
6
5
4
3
2
1
0
dM/d
logD
va (µ
g m
-3)
2 3 4 5 6 7 8 9100
2 3 4 5 6 7 8 91000
2 3
Vacuum Aerodynamic Diameter (nm)
100
80
60
40
20
0
Relative Intenstiy (%
)
14012010080604020m/z
18
2729
43
44
55
LangleyOxidised Rural
69 79 91
Figure 5.14: A mass size distribution and a mass spectrum of ambient organic aerosols averaged over all periods where O3 concentrations exceeded 50 ppbv at Langley during Pacific2001.
2004 PhD Thesis 129
M. Rami Alfarra
5.6.3 Chemical composition of processed organic aerosols
To date, only 10 – 15% of the organic mass have been resolved and identified on a
molecular level [Rogge et al., 1993; Puxbaum et al., 2000]. This has been mostly
attributed to the fact that high-molecular weight organic (i.e. > C40) and highly polar
compounds cannot be analysed with standard GC/MS methods. In addition, some
organic compounds are not easily extracted or their GC/MS signatures cannot be
confirmed by standards [Rogge et al., 1993; Saxena and Hildemann, 1996]. As a result,
more than 80% of the molecular composition of the ambient aerosol organic fraction
remains unknown. However, water-soluble macromolecular substances with spectral
properties of “humic-like substances” (HULIS) have recently been found to contribute
20 – 50% to the water-soluble fraction of organic aerosol at urban and rural sites in
Europe [Havers et al., 1998; Facchini et al., 1999a; Zappoli et al., 1999; Krivacsy et
al., 2000; Krivacsy et al., 2001b]. HULIS are composed of hundreds of different
molecules, which cannot be separated, and therefore cannot be individually identified
and quantified [Krivacsy et al., 2001b]. Limbeck et al., [2003] stated that the primary
sources of HULIS identified so far, such as biomass burning, are not adequate to
explain the observed HULIS levels in Europe, and showed that secondary aerosol
formation of atmospheric polymers occurs by heterogeneous reaction of isoprenoid (e.g.
isoprene) or terpenoid (e.g. α-pinene) emissions in the presence of a sulphuric acid
aerosol catalyst. In addition, recent smog chamber studies have reported the formation
of oligomers and polymers in secondary organic aerosol (SOA) produced from the
photooxidation of anthropogenic and biogenic precursors [Kalberer et al., 2004;
Tolocka et al., 2004a]. The AMS has recently been utilised to study the chemical
signatures of these SOA products in a reaction chamber and results are discussed in the
next chapter.
The presence and characterisation of HULIS in aerosol samples have been achieved
using a number of methods. Krivacsy et al., [2001] reported that in alkaline solutions,
these compounds are ionic and capillary electrophoresis can be a simple but effective
technique to indicate their presence in samples. Infrared spectroscopy (IR) has been
widely used for the characterisation of HULIS in atmospheric samples [Mukai and
Ambe, 1986; Havers et al., 1998; Limbeck et al., 2003], and indicated that carboxylic
2004 PhD Thesis 130
M. Rami Alfarra
groups (COOH), hydroxyl groups (OH) and carbonyl groups (C=O) are the main
functional groups of HULIS. Proton nuclear magnetic resonance spectroscopy (HNMR)
has been used in combination with ion exchange chromatography and total organic
carbon analysis for the speciation and quantification of the WSOC of aerosol and fog
samples [Decesari et al., 2000]. Results showed that the complex mixture of aerosol/fog
WSOC was separated into three main classes of compounds: 1) neutral and/or basic
compounds; 2) hydroxy-, mono-, and di-carboxylic acids; 3) polyacidic compounds.
Characterisation by HNMR spectroscopy showed that class 1 is mainly composed of
polyols or polyethers, class 2 is mainly composed of hydroxylated aliphatic acidic
compounds, while class 3 is composed of highly unsaturated polyacidic compounds of
predominantly aliphatic character, with a minor content of hydroxyl groups. The study
found that model structures, analogous to HULIS, consisting of an aromatic core
bearing substituted aliphatic chains (with –COOH, -CH2OH, -COCH3, or -CH3 terminal
groups) properly fit the HNMR features observed in the third class. Decesari et al.,
[2000] also reported that a commercially available standard of humic substance
(Suwannee River Fulvic acid Reference) exhibits a chromatographic behaviour similar
to that of class 3.
As a result of the demonstrated importance of HULIS, an AMS spectrum of a standard
fulvic acid reference was obtained using particles generated using the laboratory setup
described in section 4.1. Interestingly, the AMS mass spectrum of fulvic acid (panel A,
Figure 5.15) is dominated by m/z 44. As discussed in section 4.2, this mass fragment
arises from CO2+ and has been identified as the AMS signature of highly oxidised
compounds such as hydroxy- and di-carboxylic acids. There is also a significant
contribution from m/z 18 due to the associated H2O+ in the decarboxylation process.
Similar to dicarboxylic acids in section 4.2, the contribution of mass fragment 18 to the
fulvic acid mass spectrum has been calculated by subtracting the air beam contribution
to m/z 18 assuming the particles are dry. This is not possible to retrieve from ambient
data due to interferences from sulphate and gas phase and particulate water, and as a
result m/z 18 is set to equal m/z 44 as an estimation of the minimum contribution of m/z
18 to the organic mass.
2004 PhD Thesis 131
M. Rami Alfarra
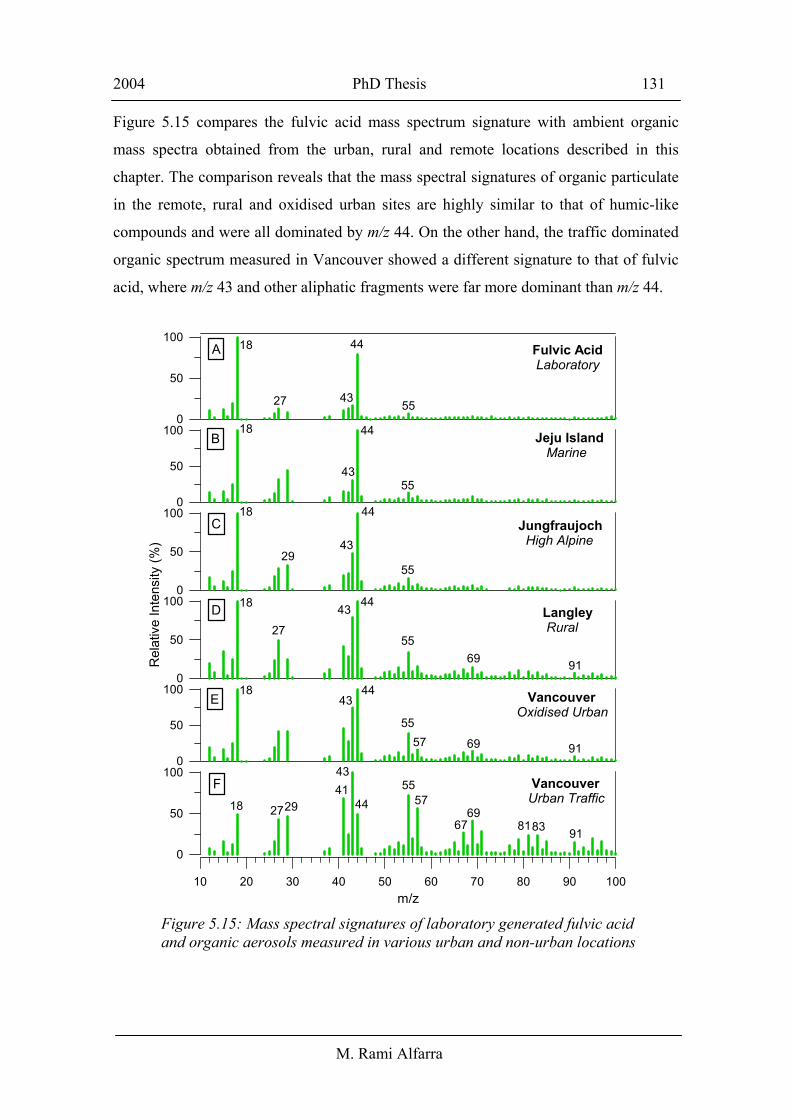
Figure 5.15 compares the fulvic acid mass spectrum signature with ambient organic
mass spectra obtained from the urban, rural and remote locations described in this
chapter. The comparison reveals that the mass spectral signatures of organic particulate
in the remote, rural and oxidised urban sites are highly similar to that of humic-like
compounds and were all dominated by m/z 44. On the other hand, the traffic dominated
organic spectrum measured in Vancouver showed a different signature to that of fulvic
acid, where m/z 43 and other aliphatic fragments were far more dominant than m/z 44.
100
50
0
100908070605040302010m/z
100
50
0
Rel
ativ
e In
tens
ity (%
)
100
50
0
100
50
0
100
50
0
100
50
0
Langley Rural
Vancouver Urban Traffic
Vancouver Oxidised Urban
Jeju Island Marine
Jungfraujoch High Alpine
Fulvic Acid Laboratory
18 2927
4143
4455
5769
67 8183 91
4443
5557
18
69
55
4443
44
43
44
44
43
43
55
55
55
69
91
91
18
18
18
18
27
27
29
A
B
C
D
E
F
Figure 5.15: Mass spectral signatures of laboratory generated fulvic acid and organic aerosols measured in various urban and non-urban locations
2004 PhD Thesis 132
M. Rami Alfarra
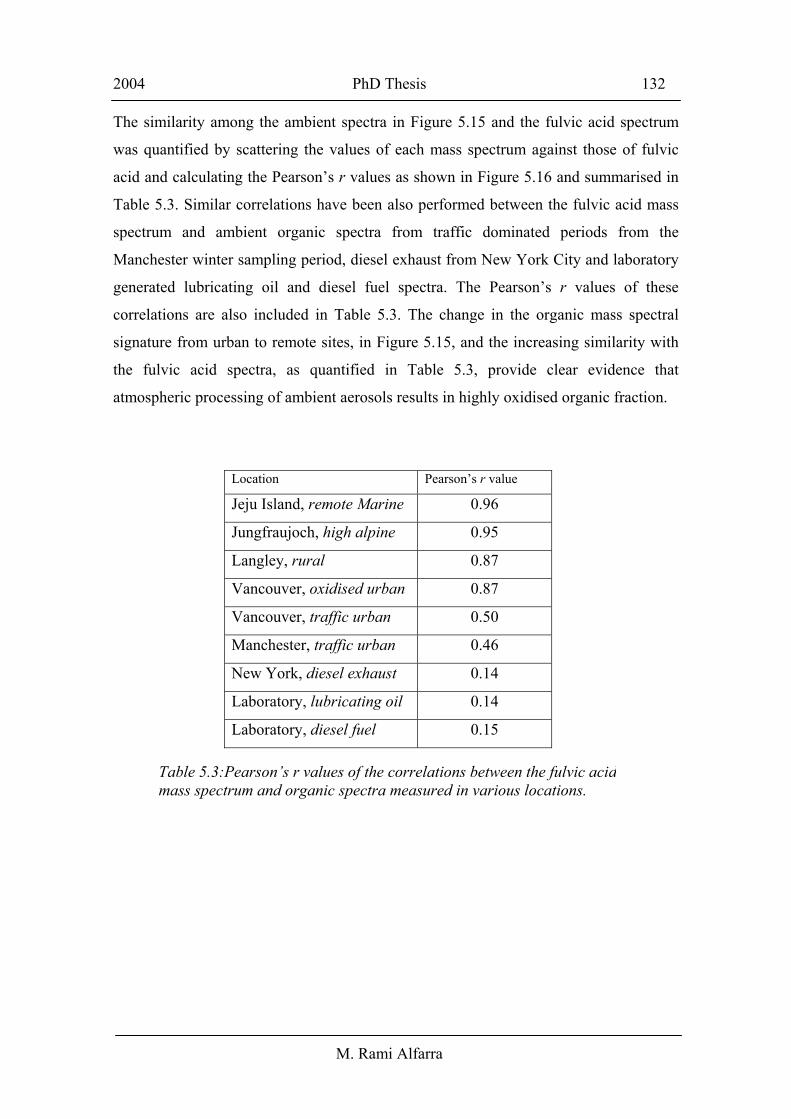
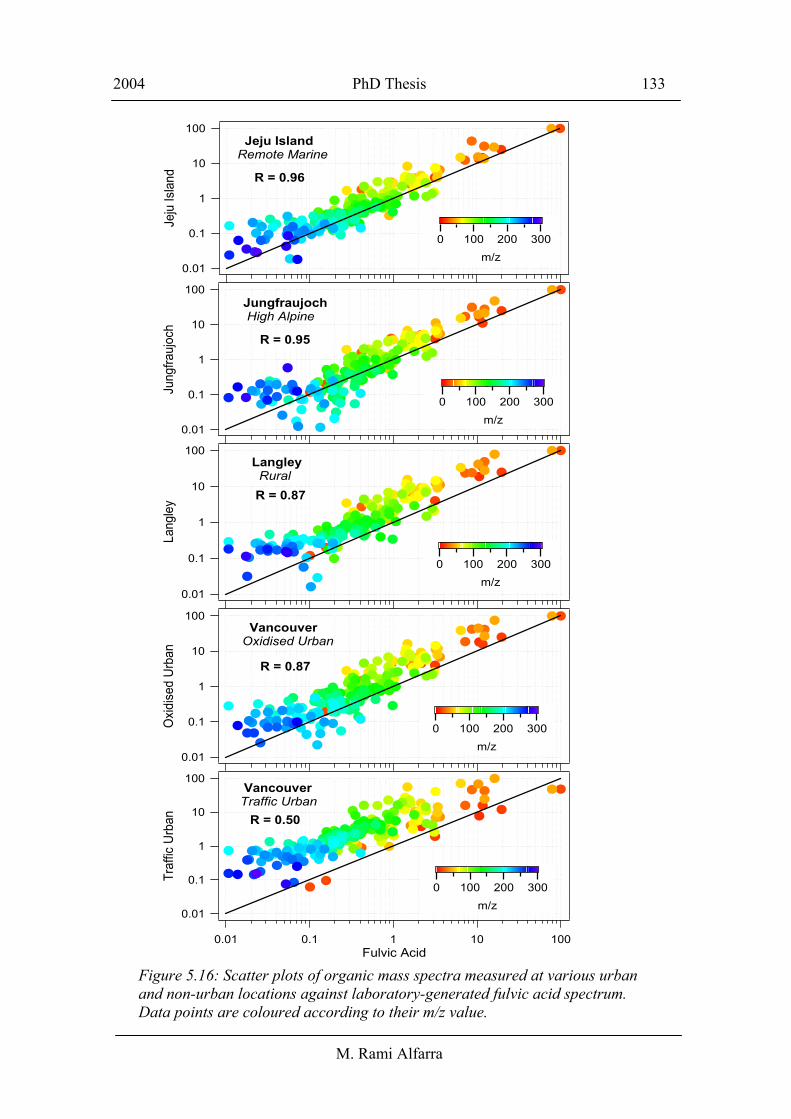
The similarity among the ambient spectra in Figure 5.15 and the fulvic acid spectrum
was quantified by scattering the values of each mass spectrum against those of fulvic
acid and calculating the Pearson’s r values as shown in Figure 5.16 and summarised in
Table 5.3. Similar correlations have been also performed between the fulvic acid mass
spectrum and ambient organic spectra from traffic dominated periods from the
Manchester winter sampling period, diesel exhaust from New York City and laboratory
generated lubricating oil and diesel fuel spectra. The Pearson’s r values of these
correlations are also included in Table 5.3. The change in the organic mass spectral
signature from urban to remote sites, in Figure 5.15, and the increasing similarity with
the fulvic acid spectra, as quantified in Table 5.3, provide clear evidence that
atmospheric processing of ambient aerosols results in highly oxidised organic fraction.
Location Pearson’s r value
Jeju Island, remote Marine 0.96
Jungfraujoch, high alpine 0.95
Langley, rural 0.87
Vancouver, oxidised urban 0.87
Vancouver, traffic urban 0.50
Manchester, traffic urban 0.46
New York, diesel exhaust 0.14
Laboratory, lubricating oil 0.14
Laboratory, diesel fuel 0.15
Table 5.3:Pearson’s r values of the correlations between the fulvic acidmass spectrum and organic spectra measured in various locations.
2004 PhD Thesis 133
M. Rami Alfarra
0.01
0.1
1
10
100
Jeju
Isla
nd R = 0.96
Jeju IslandRemote Marine
3002001000m/z
0.01
0.1
1
10
100
Jung
frauj
och
3002001000m/z
R = 0.95
Jungfraujoch High Alpine
0.01
0.1
1
10
100
Lang
ley R = 0.87
Langley Rural
3002001000m/z
0.01
0.1
1
10
100
Oxid
ised
Urba
n
R = 0.87
VancouverOxidised Urban
3002001000m/z
0.01
0.1
1
10
100
Traf
fic U
rban
0.01 0.1 1 10 100Fulvic Acid
R = 0.50
VancouverTraffic Urban
3002001000m/z
Figure 5.16: Scatter plots of organic mass spectra measured at various urban and non-urban locations against laboratory-generated fulvic acid spectrum. Data points are coloured according to their m/z value.
2004 PhD Thesis 134
M. Rami Alfarra
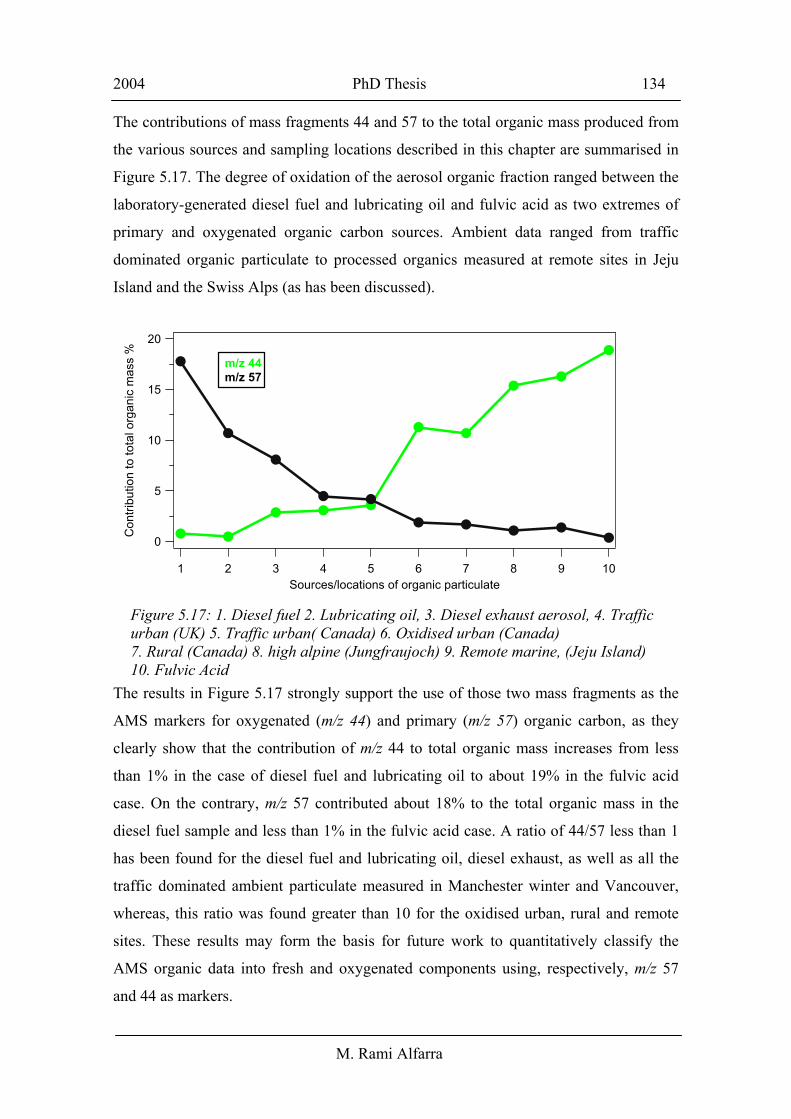
The contributions of mass fragments 44 and 57 to the total organic mass produced from
the various sources and sampling locations described in this chapter are summarised in
Figure 5.17. The degree of oxidation of the aerosol organic fraction ranged between the
laboratory-generated diesel fuel and lubricating oil and fulvic acid as two extremes of
primary and oxygenated organic carbon sources. Ambient data ranged from traffic
dominated organic particulate to processed organics measured at remote sites in Jeju
Island and the Swiss Alps (as has been discussed).
The results in Figure 5.17 strongly support the use of those two mass fragments as the
AMS markers for oxygenated (m/z 44) and primary (m/z 57) organic carbon, as they
clearly show that the contribution of m/z 44 to total organic mass increases from less
than 1% in the case of diesel fuel and lubricating oil to about 19% in the fulvic acid
case. On the contrary, m/z 57 contributed about 18% to the total organic mass in the
diesel fuel sample and less than 1% in the fulvic acid case. A ratio of 44/57 less than 1
has been found for the diesel fuel and lubricating oil, diesel exhaust, as well as all the
traffic dominated ambient particulate measured in Manchester winter and Vancouver,
whereas, this ratio was found greater than 10 for the oxidised urban, rural and remote
sites. These results may form the basis for future work to quantitatively classify the
AMS organic data into fresh and oxygenated components using, respectively, m/z 57
and 44 as markers.
20
15
10
5
0
Con
tribu
tion
to to
tal o
rgan
ic m
ass
%
10987654321Sources/locations of organic particulate
m/z 44 m/z 57
Figure 5.17: 1. Diesel fuel 2. Lubricating oil, 3. Diesel exhaust aerosol, 4. Traffic urban (UK) 5. Traffic urban( Canada) 6. Oxidised urban (Canada) 7. Rural (Canada) 8. high alpine (Jungfraujoch) 9. Remote marine, (Jeju Island) 10. Fulvic Acid
2004 PhD Thesis 135
M. Rami Alfarra
5.7 Summary
Chemical composition and mass size distribution results obtained using the Aerodyne
Aerosol Mass Spectrometers (AMS) at various locations representing urban and
regional settings around the world have been presented. A significant accumulation
mode with a peak around 400 – 500 nm was observed at all locations and was
composed of sulphate, organics, ammonium and nitrate. A significant organic mass
mode at about 100 – 200 nm was constantly observed at all urban sites and when more
freshly polluted air masses affected the other sites. The variability of the organic
particulate composition and size distribution as a function of location and
photochemical activity has been discussed. The small organic mode at the urban sites
was found to be highly correlated with gas phase NOx in Manchester and with CO, 1,3-
butadiene, benzene and toluene in Vancouver with Pearson’s r values of 0.86, 0.76,
0.71, 0.79 and 0.69, respectively. These correlation results suggest that combustion-
related emissions (likely dominated by traffic) are the main source of the small organic
mode at these sites. The chemical composition of organic aerosol at urban locations
appeared to be very similar to the composition of lubricating oil and diesel exhaust
aerosol, and contained a mixture of n-alkanes, branched alkanes, cycloalkanes, and
aromatics. These results indicate that the organic fraction of urban aerosols is mostly
dominated by the recondensed vapor from evaporated engine lubricating oil. These
findings are similar to conclusions made in other studies that under most operating
conditions the organic carbon fraction of in-use diesel vehicle exhaust aerosol is
dominated by the recondensed vapor from the evaporated engine lubricating oil [Tobias
et al., 2001; Sakurai et al., 2003]. Organics in the accumulation mode at the urban
locations appeared to be composed of compounds of highly oxidised nature. This mode
was significantly enhanced and dominated the organic mass size distribution during an
episode of intensive photochemistry at the start of the study at the Slocan Park urban
site in Vancouver.
In contrast to the urban sites, organic aerosols at all the other sites appeared to be
dominated by oxidised compounds with shorter carbon chains. The mass spectral
signatures at all of these locations were found to be very similar and the most significant
contributions to these spectra arise from mass fragments characteristic of oxidised
2004 PhD Thesis 136
M. Rami Alfarra
organic compounds such as m/z 44 in addition to mass fragments 43 and 55.
Correlations between the two organic modes and gas phase compounds at Langley
indicated that a significant part of the small mode originated from combustion sources,
while the large accumulation organic mode appeared to be the result of photochemical
processing. Processing of organic particulate during a relatively high O3 episode at
Langley seemed to have increased the modal diameter of the accumulation mode from
about 400 nm to 600 nm and almost doubled its mass loading. The mass spectral
signatures of processed organic aerosols at various locations were found to be similar to
that of fulvic acid. The latter is a model compound for humic-like substances; a group
of highly oxidised organic compounds that have recently been found to contribute 20 –
50% to the water-soluble fraction of organic aerosol at urban and rural sites in Europe.