CHAPTER e34 Atlas of Chest Imaging - Professional · CHAPTER e34 Atlas of Chest Imaging 34-1...
17
CHAPTER e34 Atlas of Chest Imaging 34-1 CHAPTER e34 Atlas of Chest Imaging Patricia Kritek John J. Reilly, Jr. This atlas of chest imaging is a collection of interesting chest radio- graphs and computed tomograms of the chest. The readings of the films are meant to be illustrative of specific, major findings. The associated text is not intended as a comprehensive assessment of the images. EXAMPLES OF NORMAL IMAGING Figure e34-1 Normal chest radiograph—review of anatomy. 1. Trachea. 2. Carina. 3. Right atrium. 4. Right hemidiaphragm. 5. Aortic knob. 6. Left hilum. 7. Left ventricle. 8. Left hemidiaphragm (with stomach bubble). 9. Retrosternal clear space. 10. Right ventricle. 11. Left hemidiaphragm (with stomach bubble). 12. Left upper lobe bronchus. Copyright © 2012 The McGraw-Hill Companies, Inc. All rights reserved.
Transcript of CHAPTER e34 Atlas of Chest Imaging - Professional · CHAPTER e34 Atlas of Chest Imaging 34-1...
CHA
PTER e34
Atlas of Chest Imaging
34-1
CHAPTER e34
Atlas of Chest Imaging Patricia Kritek John J. Reilly, Jr.
This atlas of chest imaging is a collection of interesting chest radio-graphs and computed tomograms of the chest. The readings of the films are meant to be illustrative of specific, major findings. The associated text is not intended as a comprehensive assessment of the images.
EXAMPLES OF NORMAL IMAGING
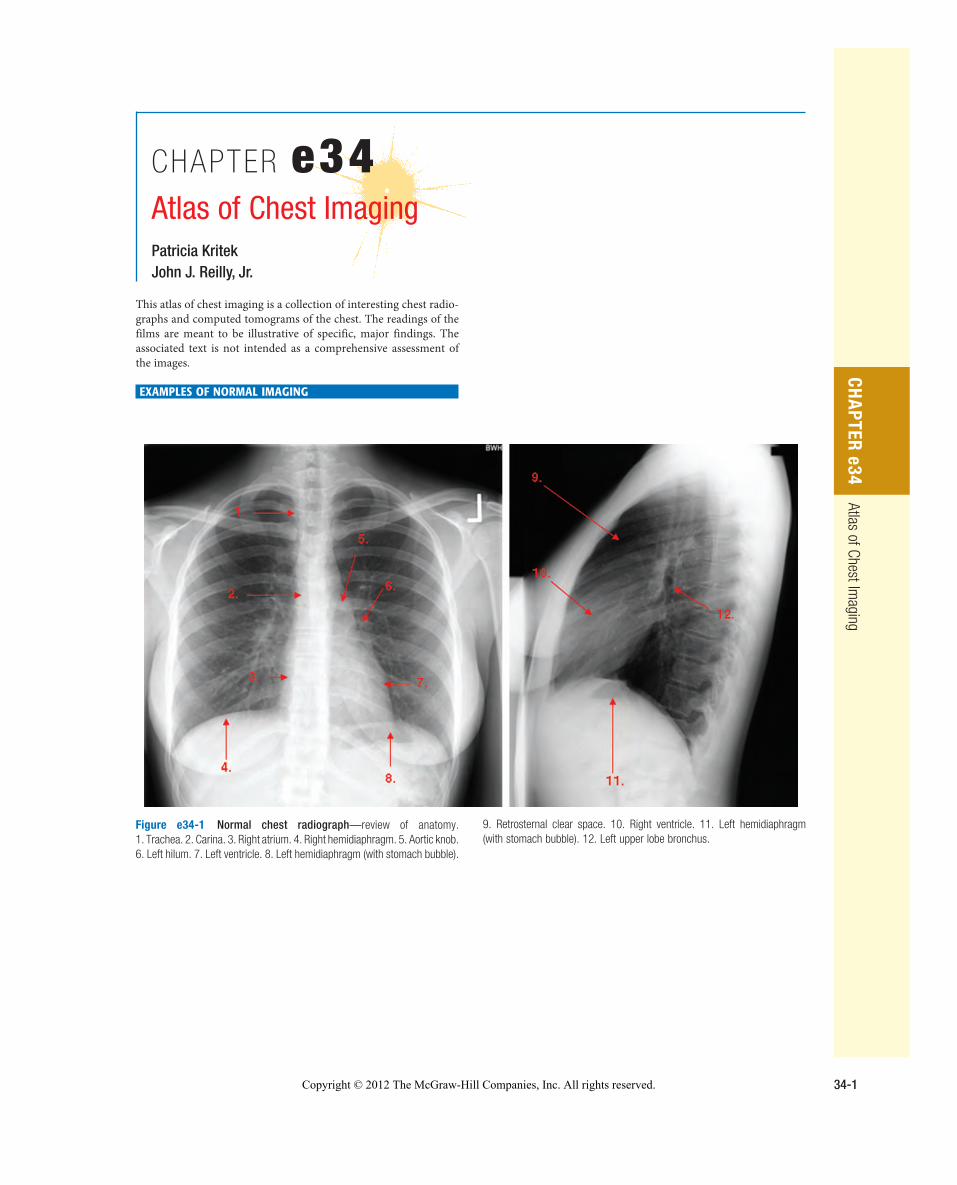
Figure e34-1 Normal chest radiograph —review of anatomy.1. Trachea. 2. Carina. 3. Right atrium. 4. Right hemidiaphragm. 5. Aortic knob. 6. Left hilum. 7. Left ventricle. 8. Left hemidiaphragm (with stomach bubble).
9. Retrosternal clear space. 10. Right ventricle. 11. Left hemidiaphragm (with stomach bubble). 12. Left upper lobe bronchus.
Copyright © 2012 The McGraw-Hill Companies, Inc. All rights reserved.
PART 11
Disorders of the Respiratory System
34-2
1.
3.2.
4.
8.
7.
6.
5.
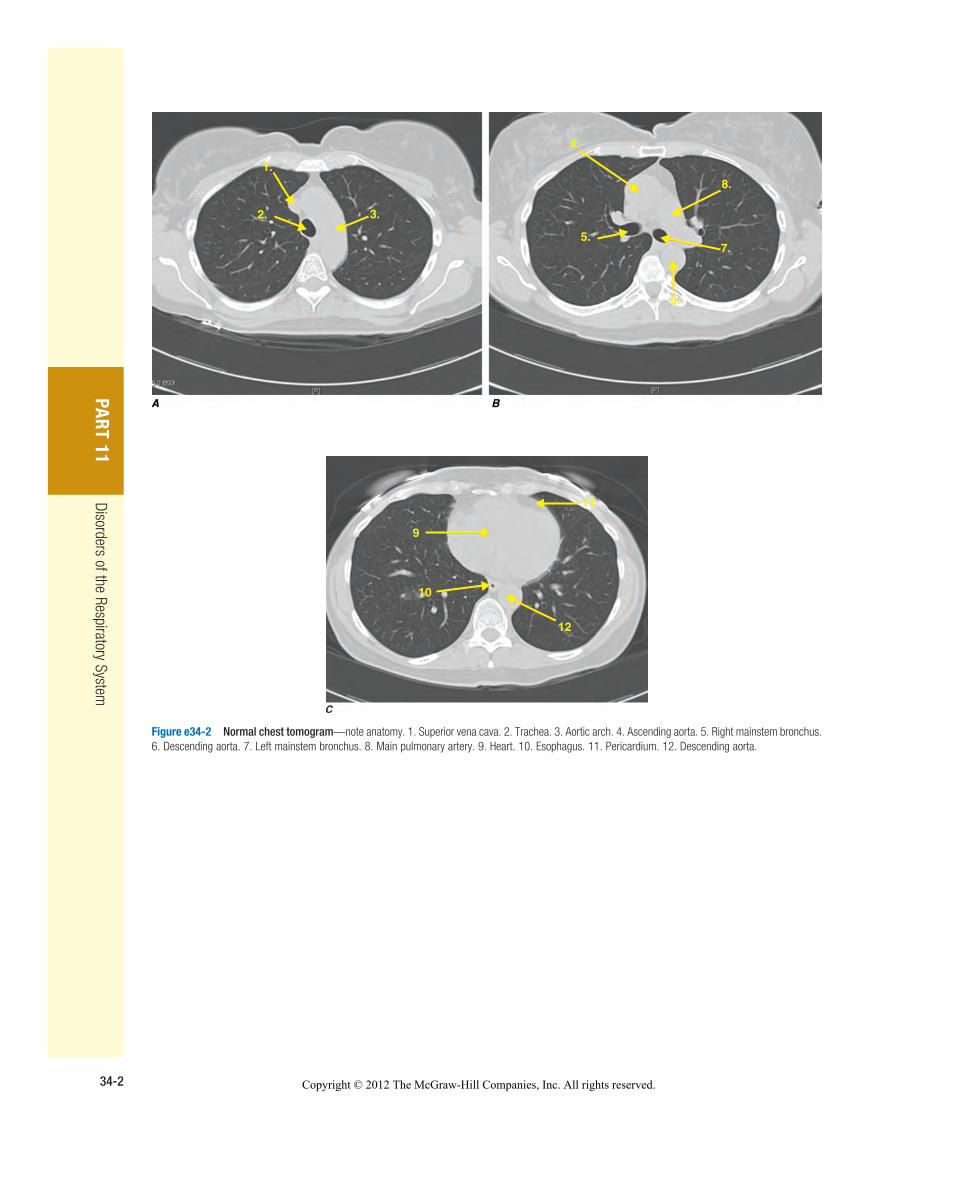
Figure e34-2 Normal chest tomogram —note anatomy. 1. Superior vena cava. 2. Trachea. 3. Aortic arch. 4. Ascending aorta. 5. Right mainstem bronchus. 6. Descending aorta. 7. Left mainstem bronchus. 8. Main pulmonary artery. 9. Heart. 10. Esophagus. 11. Pericardium. 12. Descending aorta.
9
10
11
12
Copyright © 2012 The McGraw-Hill Companies, Inc. All rights reserved.
CHA
PTER e34
Atlas of Chest Imaging
34-3
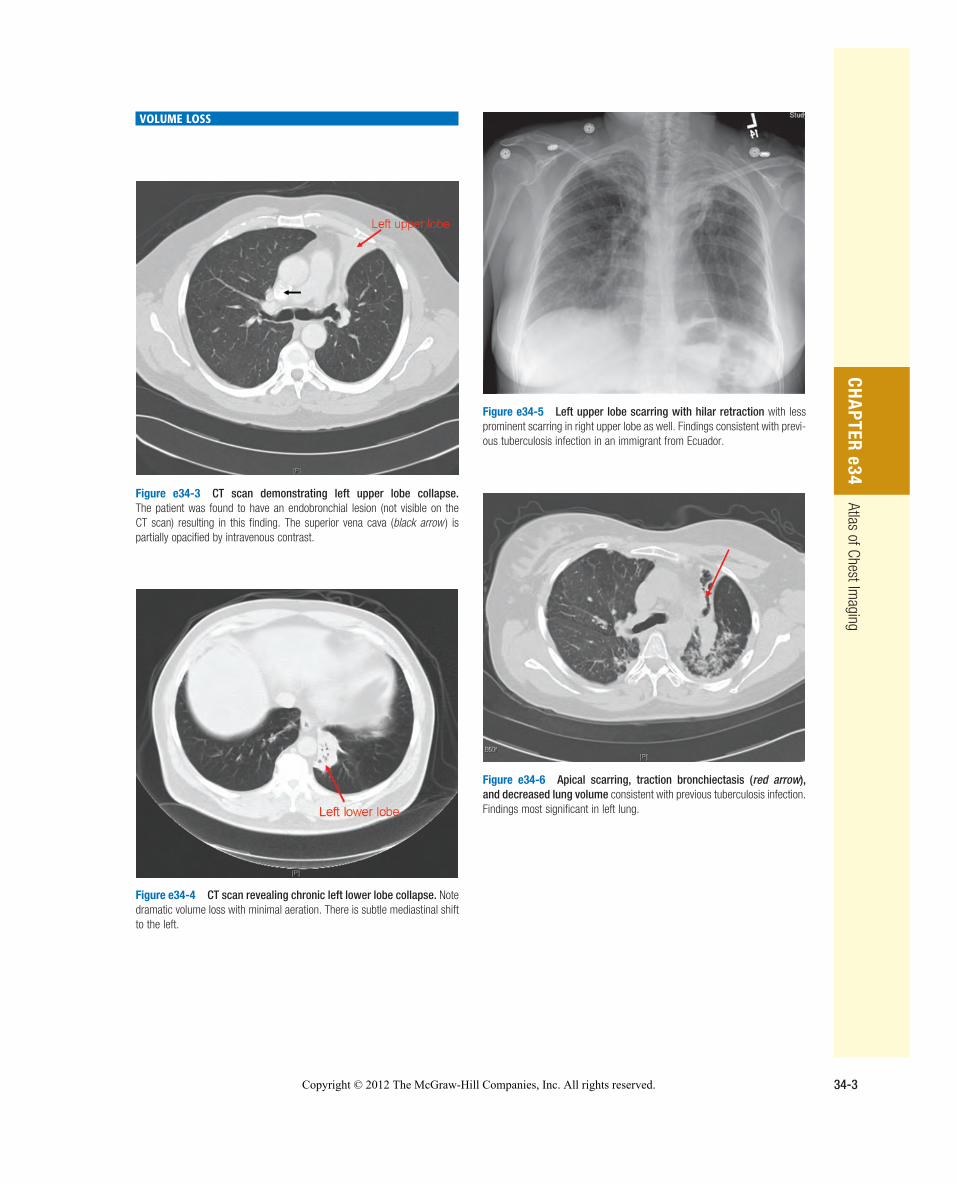
VOLUME LOSS
Figure e34-3 CT scan demonstrating left upper lobe collapse. The patient was found to have an endobronchial lesion (not visible on theCT scan) resulting in this finding. The superior vena cava ( black arrow ) is partially opacified by intravenous contrast.
Figure e34-4 CT scan revealing chronic left lower lobe collapse. Note dramatic volume loss with minimal aeration. There is subtle mediastinal shift to the left.
Figure e34-5 Left upper lobe scarring with hilar retraction with less prominent scarring in right upper lobe as well. Findings consistent with previ-ous tuberculosis infection in an immigrant from Ecuador.
Figure e34-6 Apical scarring, traction bronchiectasis ( red arrow ), and decreased lung volume consistent with previous tuberculosis infection. Findings most significant in left lung.
Copyright © 2012 The McGraw-Hill Companies, Inc. All rights reserved.
PART 11
Disorders of the Respiratory System
34-4
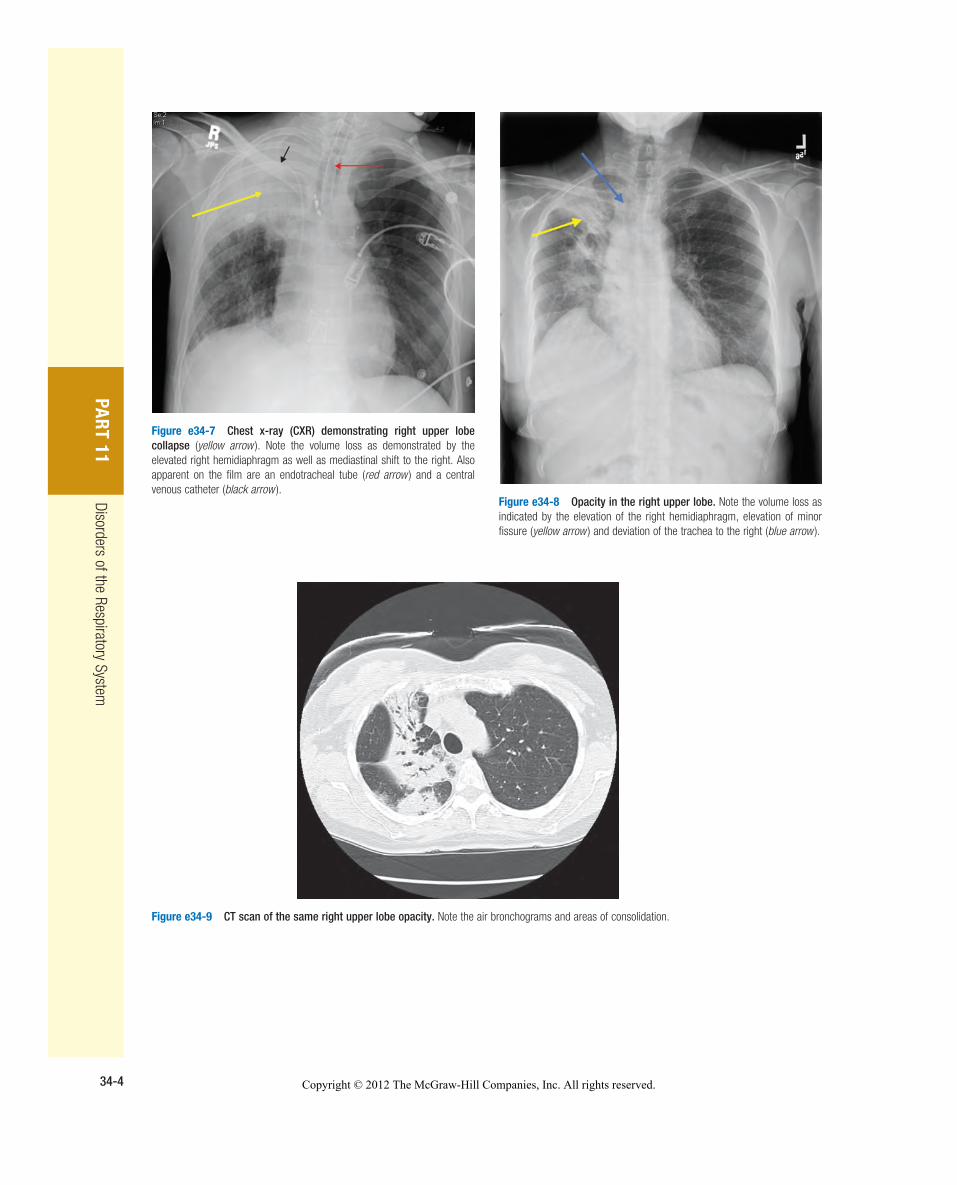
Figure e34-7 Chest x-ray (CXR) demonstrating right upper lobe collapse ( yellow arrow ). Note the volume loss as demonstrated by the elevated right hemidiaphragm as well as mediastinal shift to the right. Also apparent on the film are an endotracheal tube ( red arrow ) and a central venous catheter ( black arrow ).
Figure e34-8 Opacity in the right upper lobe. Note the volume loss as indicated by the elevation of the right hemidiaphragm, elevation of minor fissure ( yellow arrow ) and deviation of the trachea to the right ( blue arrow ).
Figure e34-9 CT scan of the same right upper lobe opacity. Note the air bronchograms and areas of consolidation.
Copyright © 2012 The McGraw-Hill Companies, Inc. All rights reserved.
CHA
PTER e34
Atlas of Chest Imaging
34-5
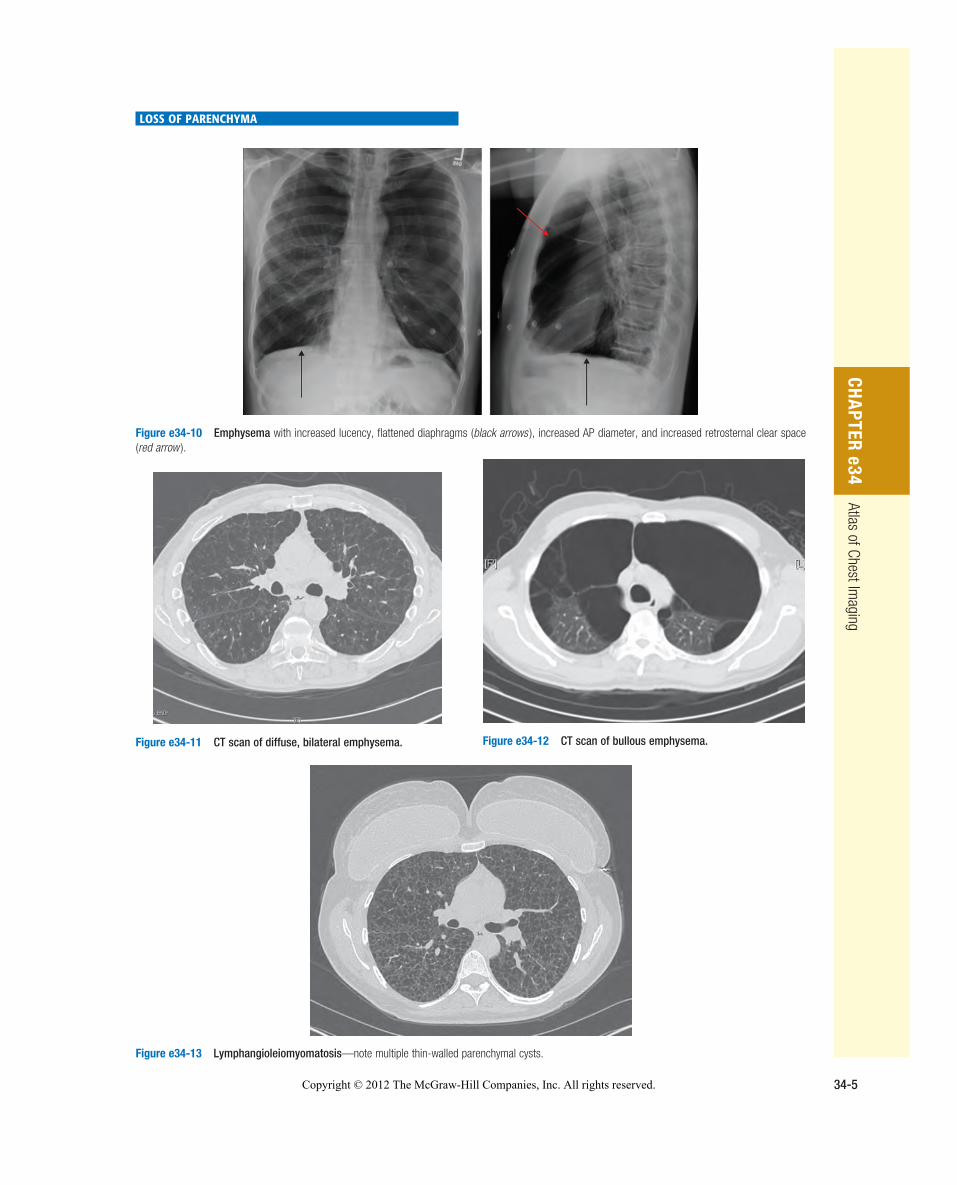
LOSS OF PARENCHYMA
Figure e34-10 Emphysema with increased lucency, flattened diaphragms ( black arrows ), increased AP diameter, and increased retrosternal clear space ( red arrow ).
Figure e34-11 CT scan of diffuse, bilateral emphysema. Figure e34-12 CT scan of bullous emphysema.
Figure e34-13 Lymphangioleiomyomatosis—note multiple thin-walled parenchymal cysts.
Copyright © 2012 The McGraw-Hill Companies, Inc. All rights reserved.
PART 11
Disorders of the Respiratory System
34-6
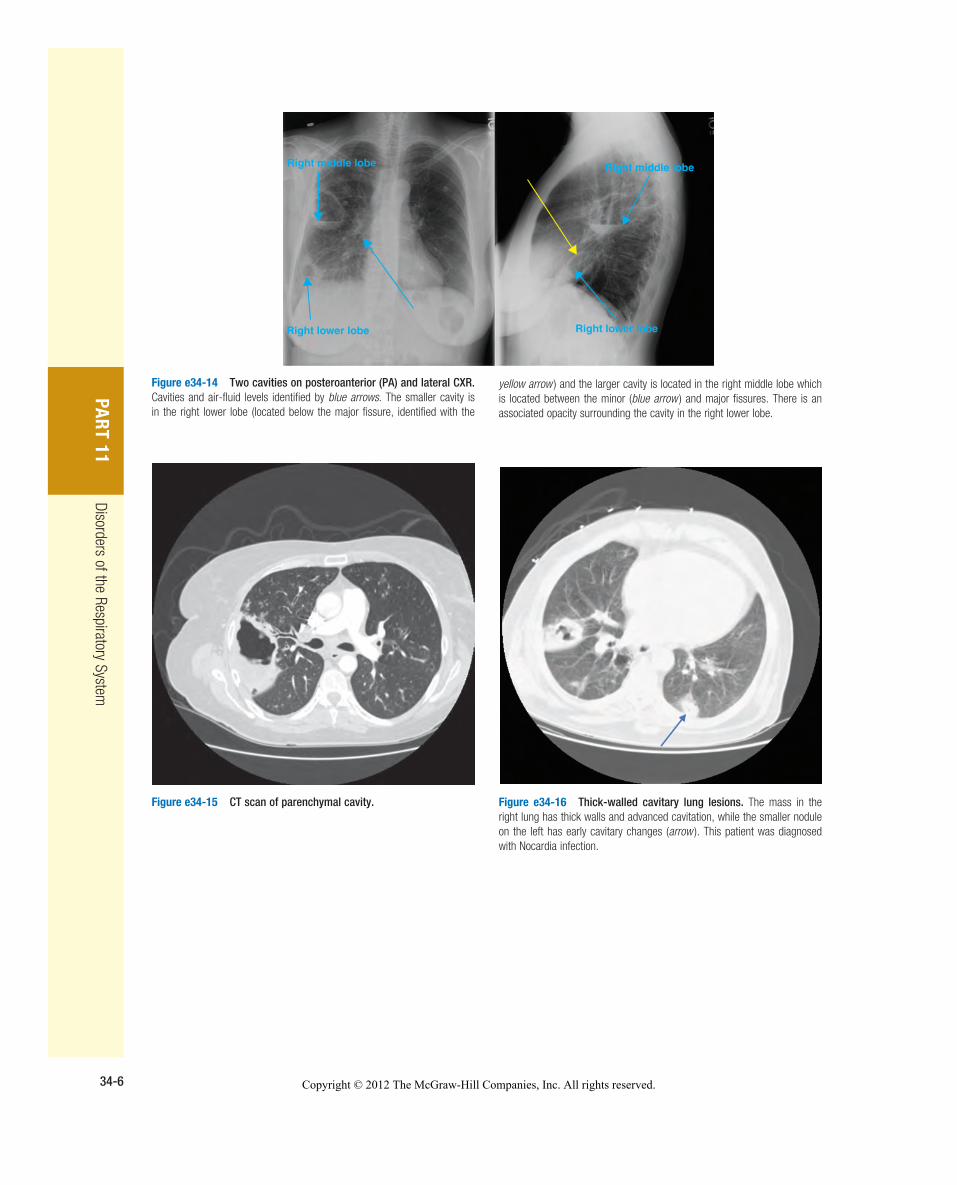
Right middle lobe Right middle lobe
Right lower lobe Right lower lobe
Figure e34-14 Two cavities on posteroanterior (PA) and lateral CXR. Cavities and air-fluid levels identified by blue arrows . The smaller cavity is in the right lower lobe (located below the major fissure, identified with the
yellow arrow ) and the larger cavity is located in the right middle lobe which is located between the minor ( blue arrow ) and major fissures. There is an associated opacity surrounding the cavity in the right lower lobe.
Figure e34-15 CT scan of parenchymal cavity. Figure e34-16 Thick-walled cavitary lung lesions. The mass in the right lung has thick walls and advanced cavitation, while the smaller nodule on the left has early cavitary changes ( arrow ). This patient was diagnosed with Nocardia infection.
Copyright © 2012 The McGraw-Hill Companies, Inc. All rights reserved.
CHA
PTER e34
Atlas of Chest Imaging
34-7
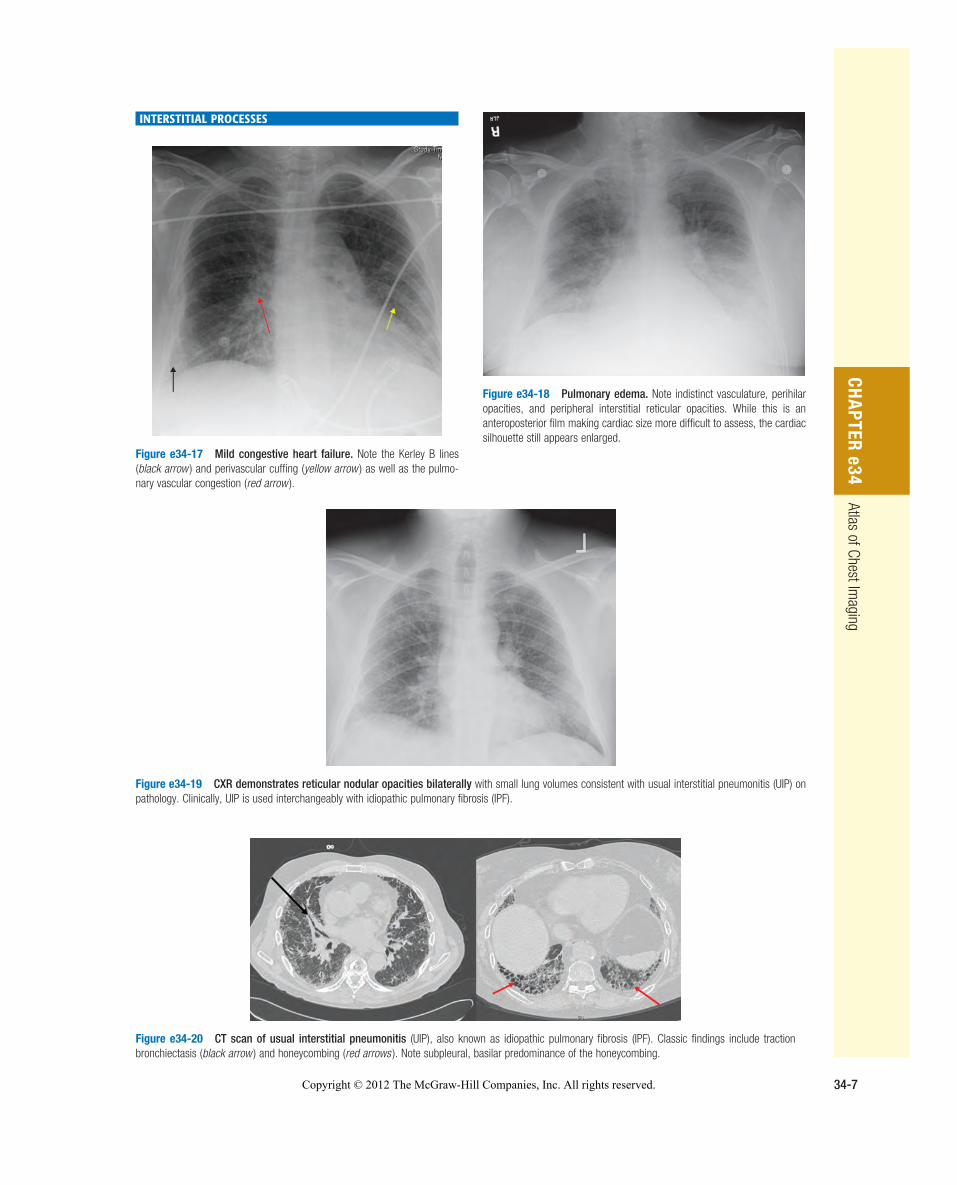
INTERSTITIAL PROCESSES
Figure e34-17 Mild congestive heart failure. Note the Kerley B lines ( black arrow ) and perivascular cuffing ( yellow arrow ) as well as the pulmo-nary vascular congestion ( red arrow ).
Figure e34-18 Pulmonary edema. Note indistinct vasculature, perihilar opacities, and peripheral interstitial reticular opacities. While this is an anteroposterior film making cardiac size more difficult to assess, the cardiac silhouette still appears enlarged.
Figure e34-19 CXR demonstrates reticular nodular opacities bilaterally with small lung volumes consistent with usual interstitial pneumonitis (UIP) on pathology. Clinically, UIP is used interchangeably with idiopathic pulmonary fibrosis (IPF).
Figure e34-20 CT scan of usual interstitial pneumonitis (UIP), also known as idiopathic pulmonary fibrosis (IPF). Classic findings include traction bronchiectasis ( black arrow ) and honeycombing ( red arrows ). Note subpleural, basilar predominance of the honeycombing.
Copyright © 2012 The McGraw-Hill Companies, Inc. All rights reserved.
PART 11
Disorders of the Respiratory System
34-8
A
B
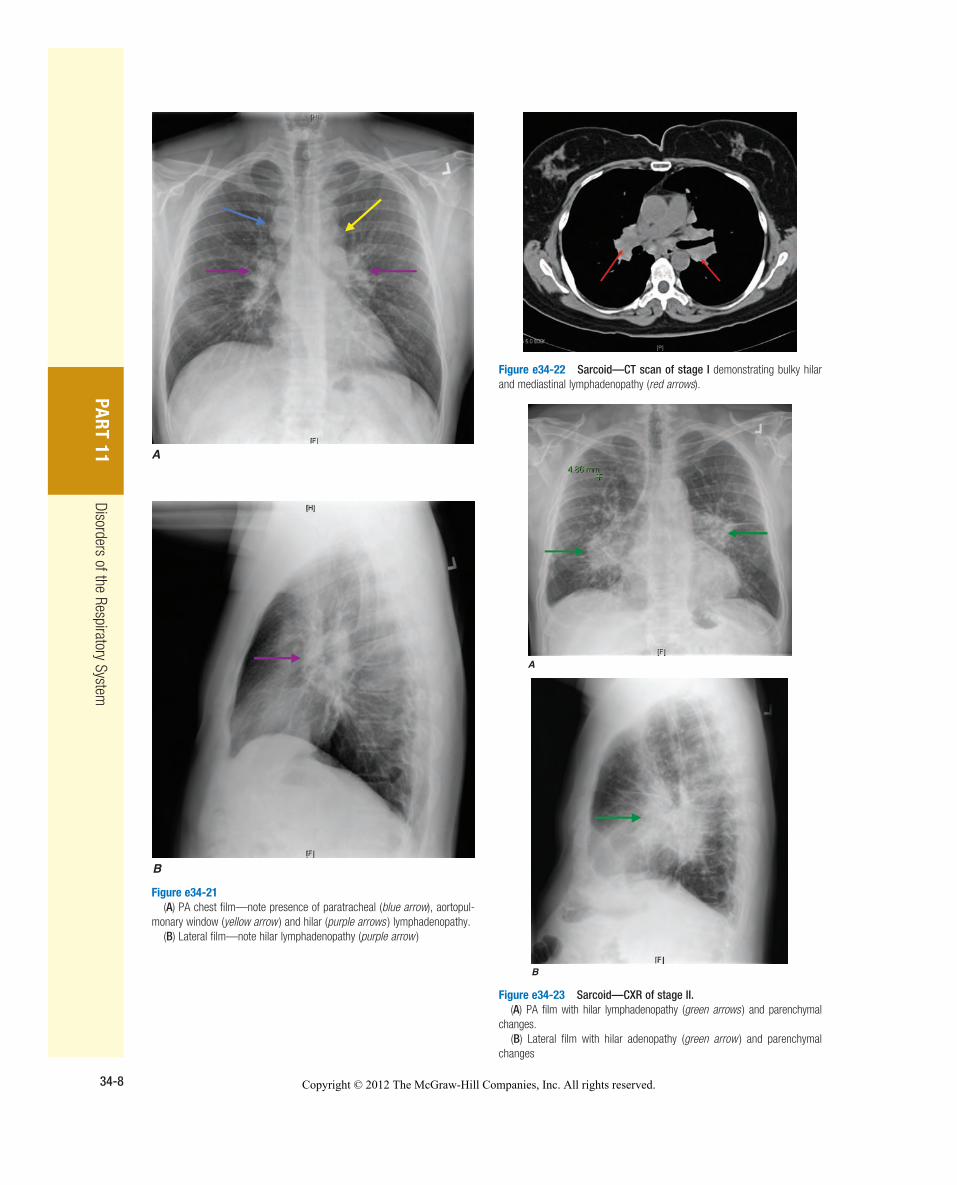
Figure e34-21 (A) PA chest film—note presence of paratracheal ( blue arrow ), aortopul-monary window ( yellow arrow ) and hilar ( purple arrows ) lymphadenopathy. (B) Lateral film—note hilar lymphadenopathy ( purple arrow )
Figure e34-22 Sarcoid—CT scan of stage I demonstrating bulky hilar and mediastinal lymphadenopathy ( red arrows ).
A
Figure e34-23 Sarcoid—CXR of stage II. (A) PA film with hilar lymphadenopathy ( green arrows ) and parenchymal changes. (B) Lateral film with hilar adenopathy ( green arrow ) and parenchymal changes
B
Copyright © 2012 The McGraw-Hill Companies, Inc. All rights reserved.
CHA
PTER e34
Atlas of Chest Imaging
34-9
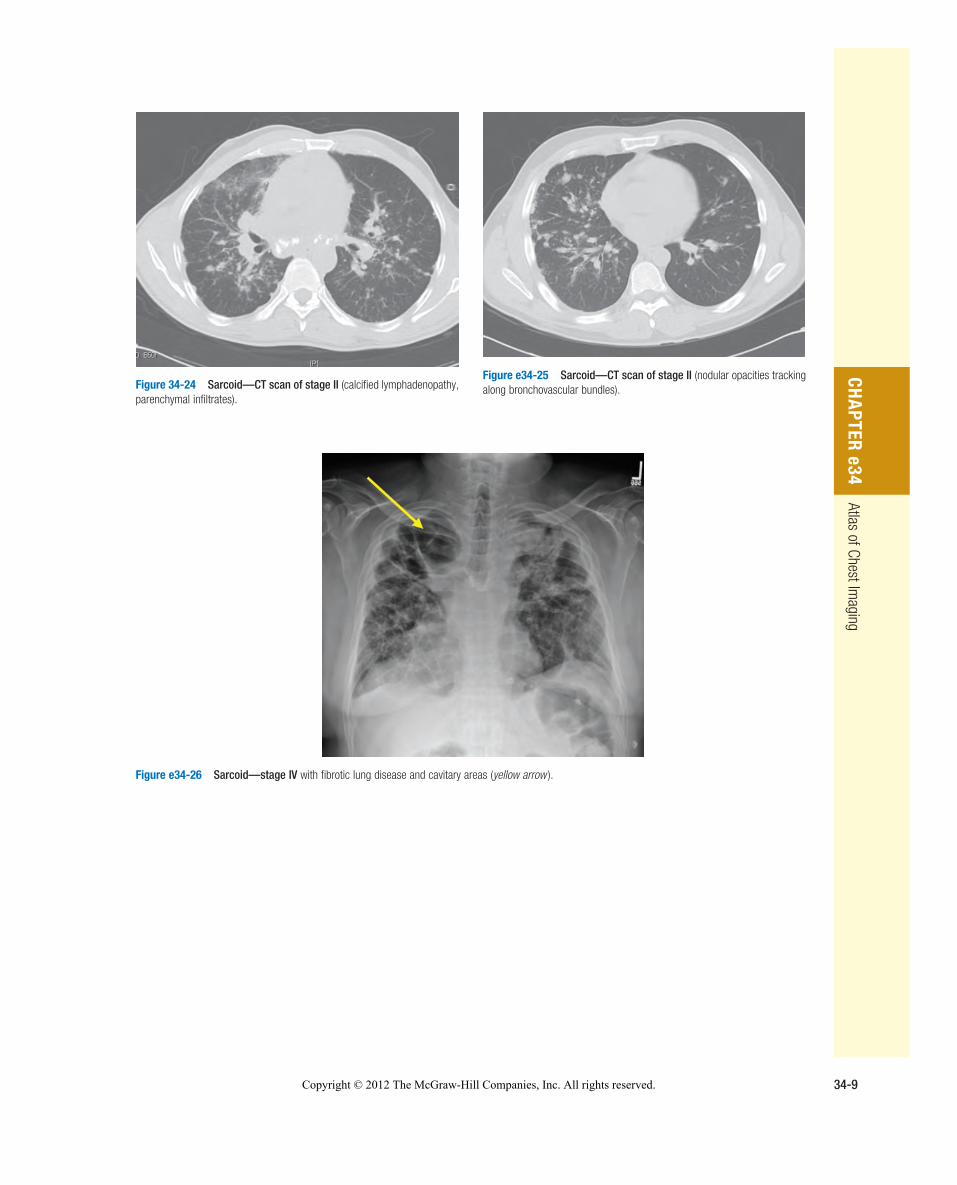
Figure 34-24 Sarcoid—CT scan of stage II (calcified lymphadenopathy, parenchymal infiltrates).
Figure e34-25 Sarcoid—CT scan of stage II (nodular opacities tracking along bronchovascular bundles).
Figure e34-26 Sarcoid—stage IV with fibrotic lung disease and cavitary areas ( yellow arrow ) .
Copyright © 2012 The McGraw-Hill Companies, Inc. All rights reserved.
PART 11
Disorders of the Respiratory System
34-10
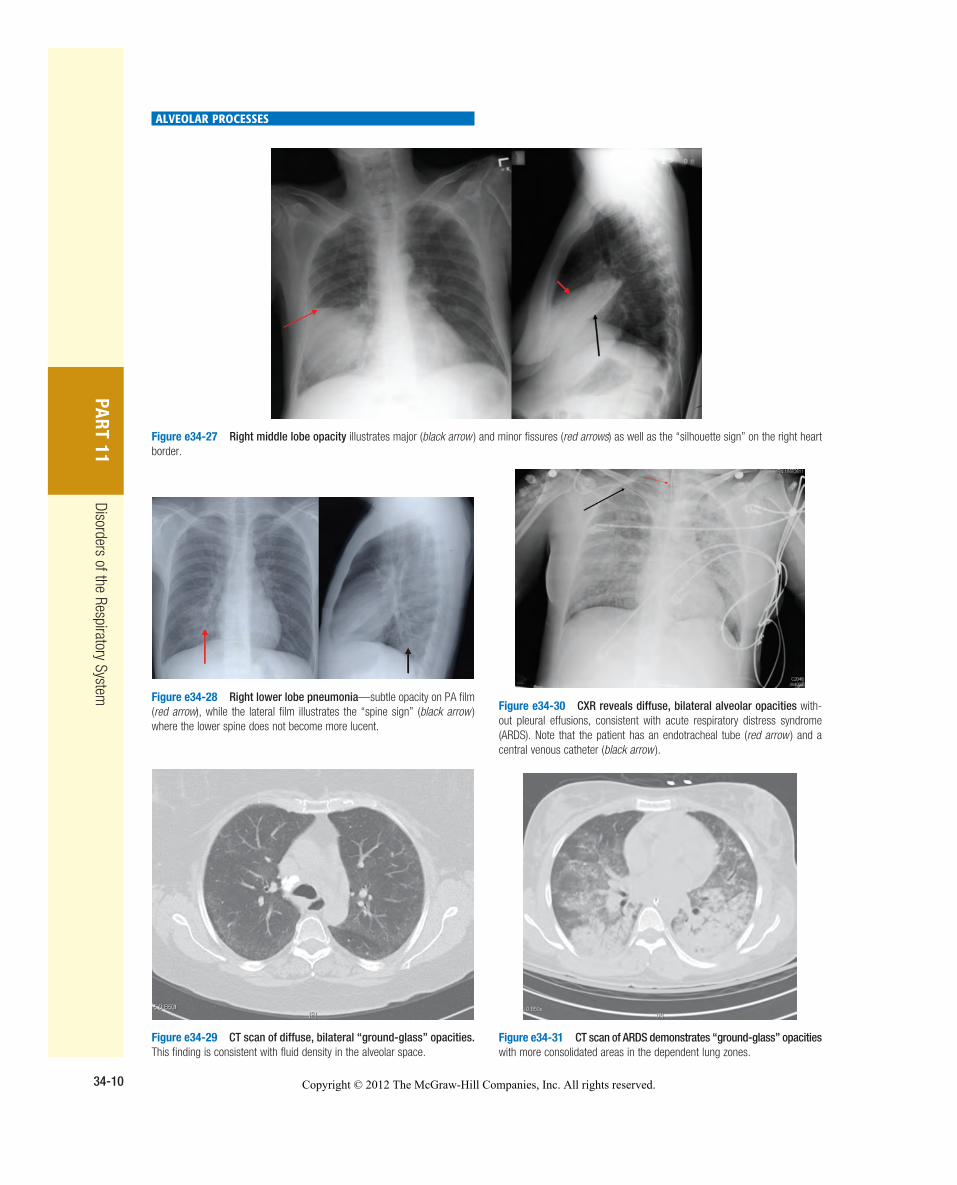
Figure e34-28 Right lower lobe pneumonia —subtle opacity on PA film ( red arrow ), while the lateral film illustrates the “spine sign” ( black arrow ) where the lower spine does not become more lucent.
Figure e34-29 CT scan of diffuse, bilateral “ground-glass” opacities. This finding is consistent with fluid density in the alveolar space.
Figure e34-30 CXR reveals diffuse, bilateral alveolar opacities with-out pleural effusions, consistent with acute respiratory distress syndrome (ARDS). Note that the patient has an endotracheal tube ( red arrow ) and a central venous catheter ( black arrow ).
Figure e34-31 CT scan of ARDS demonstrates “ground-glass” opacities with more consolidated areas in the dependent lung zones.
Figure e34-27 Right middle lobe opacity illustrates major ( black arrow ) and minor fissures ( red arrows ) as well as the “silhouette sign” on the right heart border.
ALVEOLAR PROCESSES
Copyright © 2012 The McGraw-Hill Companies, Inc. All rights reserved.
CHA
PTER e34
Atlas of Chest Imaging
34-11
AB
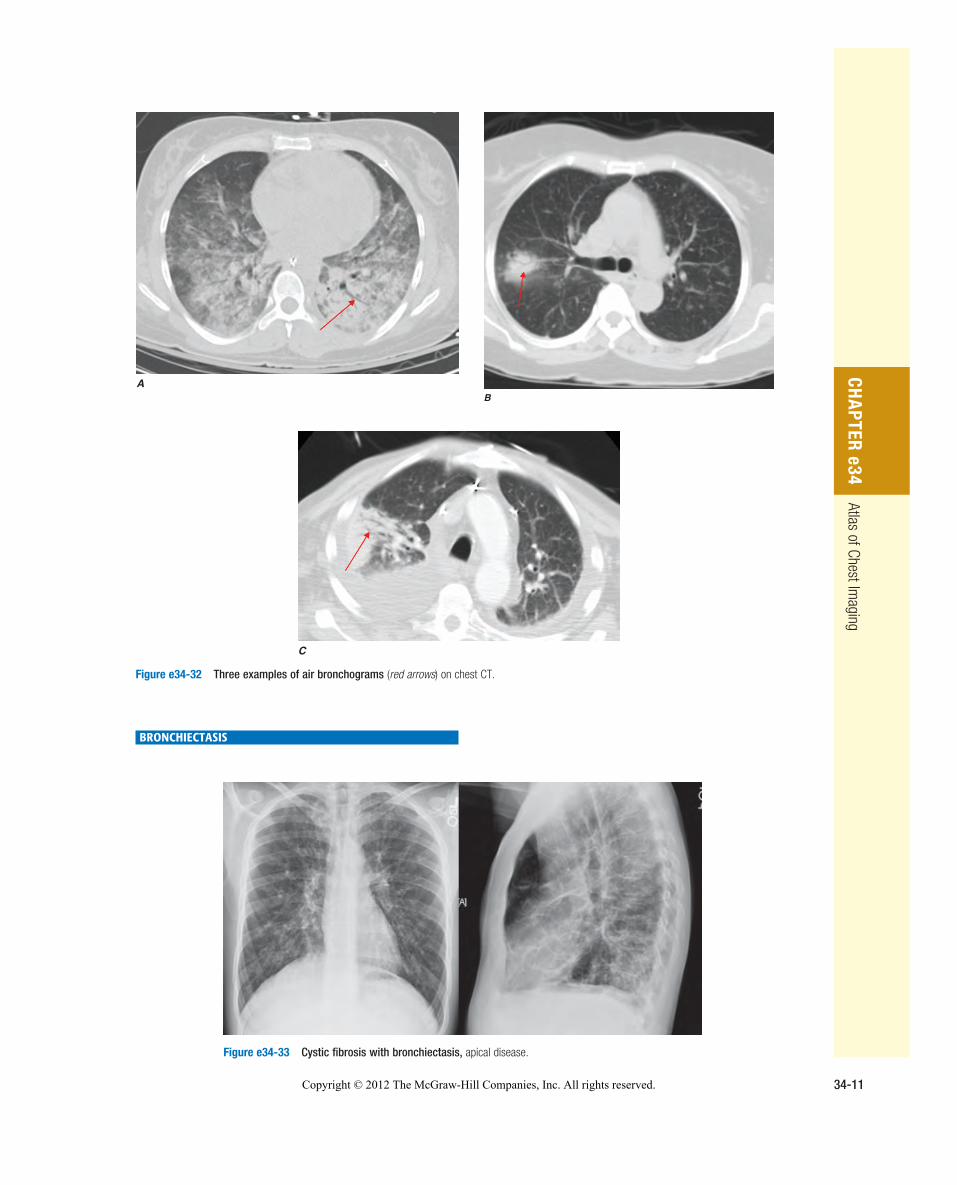
Figure e34-32 Three examples of air bronchograms ( red arrows ) on chest CT.
C
BRONCHIECTASIS
Figure e34-33 Cystic fibrosis with bronchiectasis, apical disease.
Copyright © 2012 The McGraw-Hill Companies, Inc. All rights reserved.
PART 11
Disorders of the Respiratory System
34-12
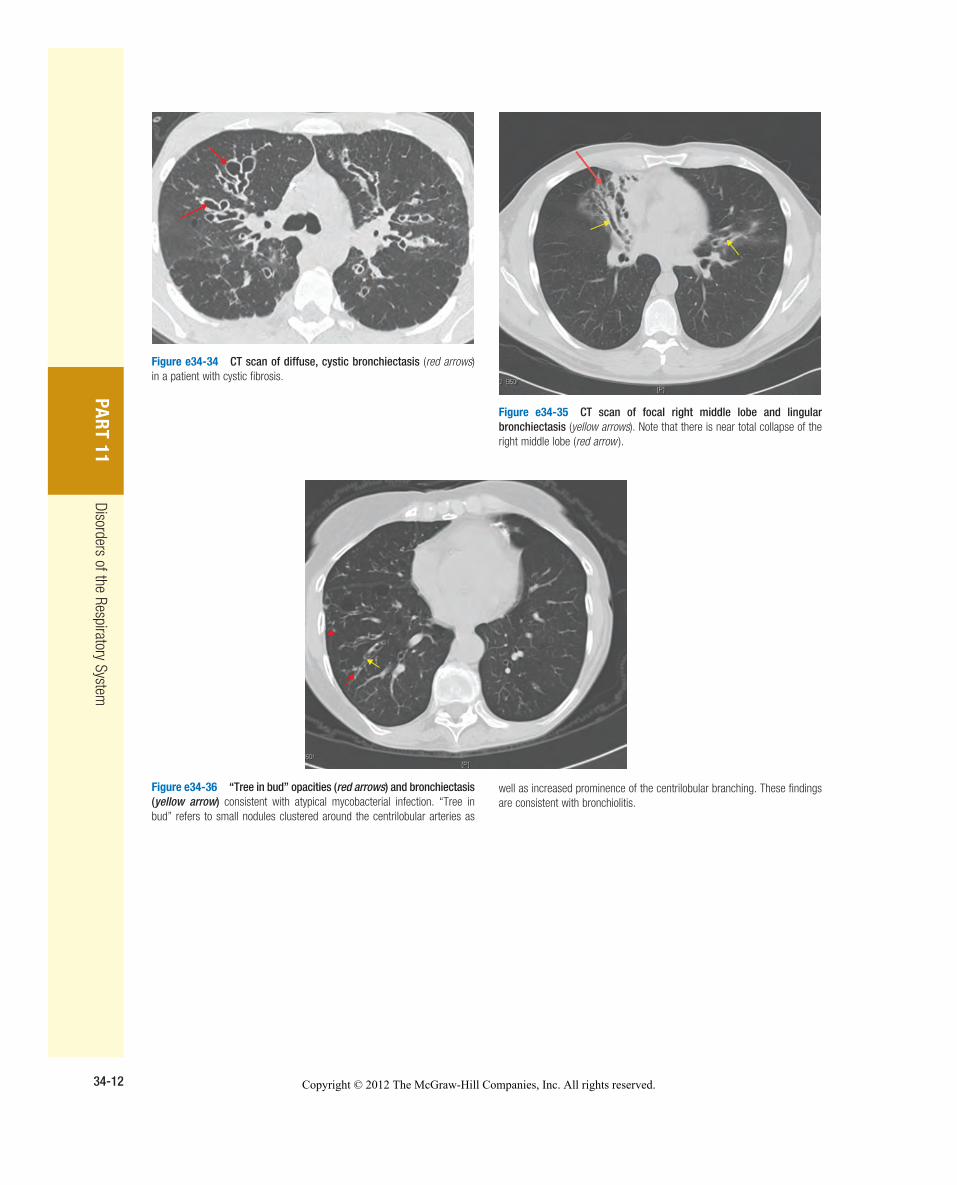
Figure e34-34 CT scan of diffuse, cystic bronchiectasis ( red arrows ) in a patient with cystic fibrosis.
Figure e34-35 CT scan of focal right middle lobe and lingular bronchiectasis ( yellow arrows ). Note that there is near total collapse of the right middle lobe ( red arrow ).
Figure e34-36 “Tree in bud” opacities ( red arrows ) and bronchiectasis ( yellow arrow ) consistent with atypical mycobacterial infection. “Tree in bud” refers to small nodules clustered around the centrilobular arteries as
well as increased prominence of the centrilobular branching. These findings are consistent with bronchiolitis.
Copyright © 2012 The McGraw-Hill Companies, Inc. All rights reserved.
CHA
PTER e34
Atlas of Chest Imaging
34-13
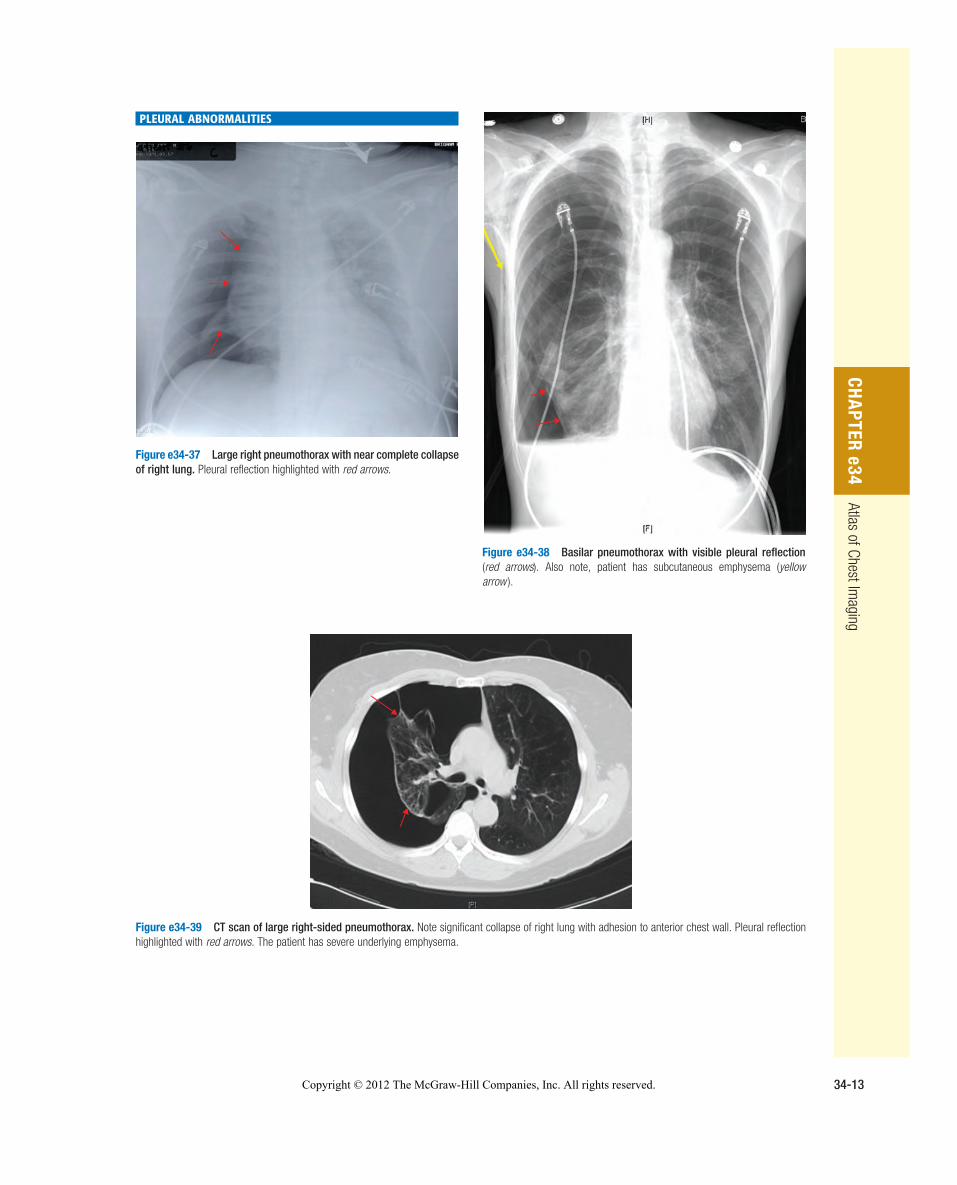
PLEURAL ABNORMALITIES
Figure e34-37 Large right pneumothorax with near complete collapse of right lung. Pleural reflection highlighted with red arrows .
Figure e34-38 Basilar pneumothorax with visible pleural reflection ( red arrows ). Also note, patient has subcutaneous emphysema ( yellow arrow ).
Figure e34-39 CT scan of large right-sided pneumothorax. Note significant collapse of right lung with adhesion to anterior chest wall. Pleural reflection highlighted with red arrows. The patient has severe underlying emphysema.
Copyright © 2012 The McGraw-Hill Companies, Inc. All rights reserved.
PART 11
Disorders of the Respiratory System
34-14
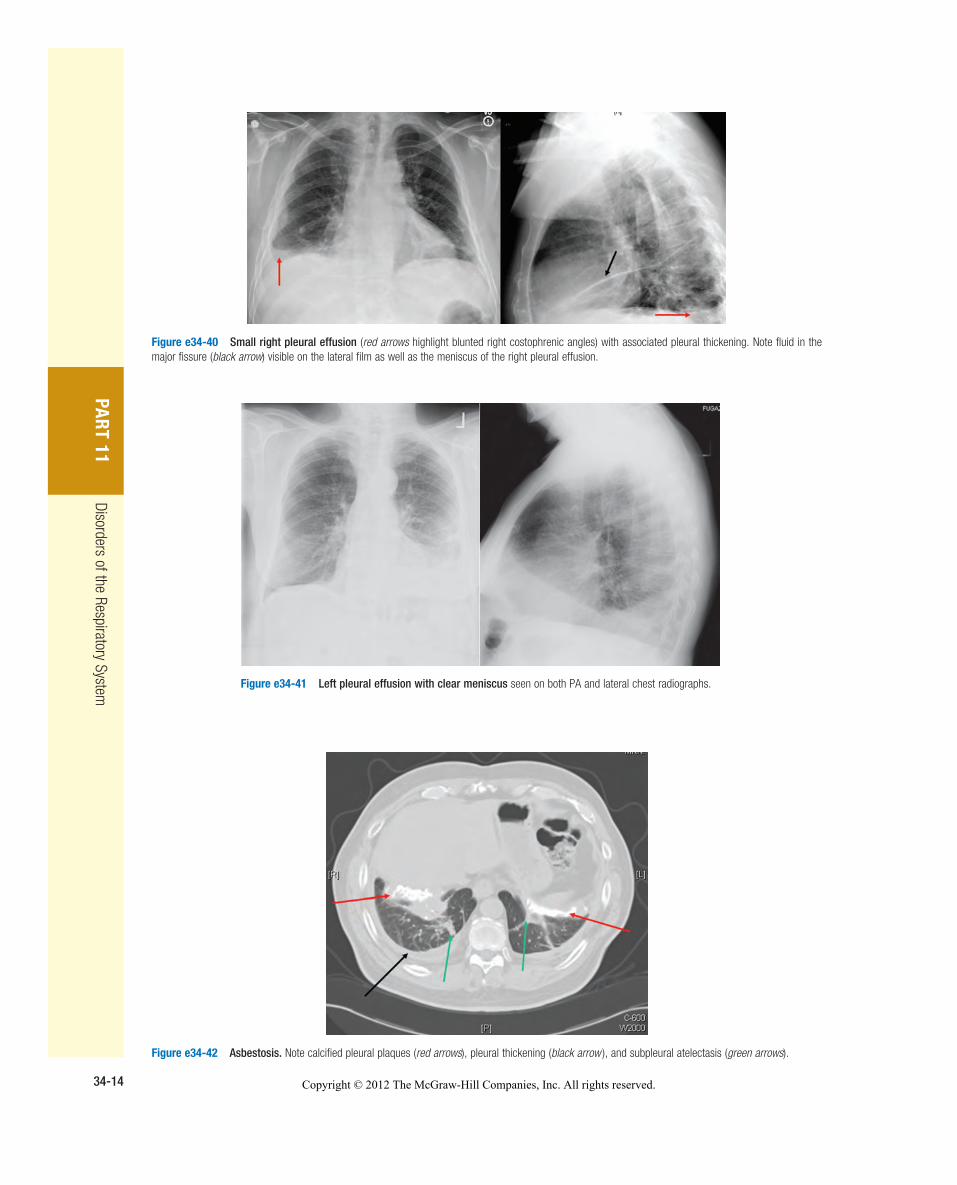
Figure e34-40 Small right pleural effusion ( red arrows highlight blunted right costophrenic angles) with associated pleural thickening. Note fluid in the major fissure ( black arrow ) visible on the lateral film as well as the meniscus of the right pleural effusion.
Figure e34-41 Left pleural effusion with clear meniscus seen on both PA and lateral chest radiographs.
Figure e34-42 Asbestosis. Note calcified pleural plaques ( red arrows ), pleural thickening ( black arrow ), and subpleural atelectasis ( green arrows ).
Copyright © 2012 The McGraw-Hill Companies, Inc. All rights reserved.
CHA
PTER e34
Atlas of Chest Imaging
34-15
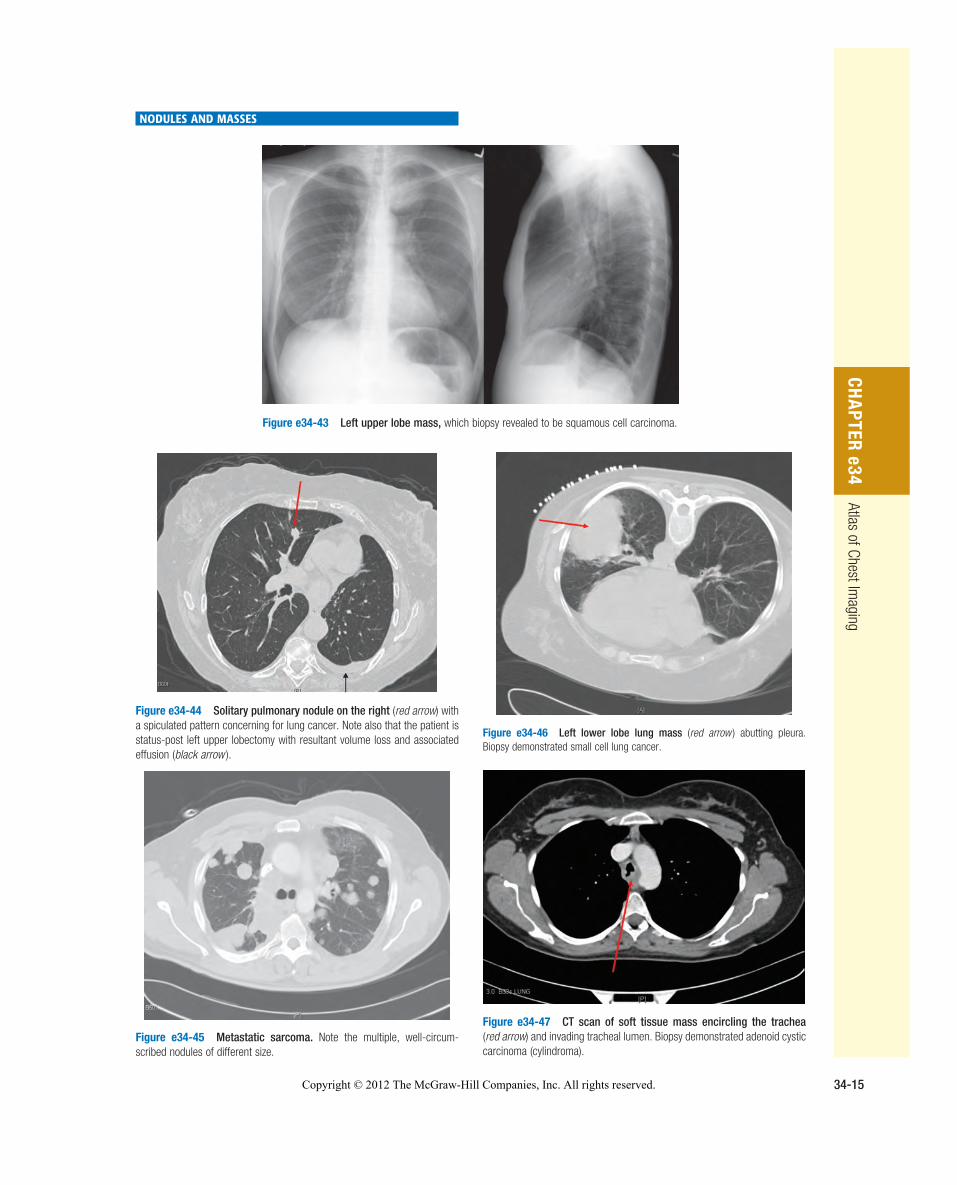
Figure e34-43 Left upper lobe mass, which biopsy revealed to be squamous cell carcinoma.
Figure e34-44 Solitary pulmonary nodule on the right ( red arrow ) with a spiculated pattern concerning for lung cancer. Note also that the patient is status-post left upper lobectomy with resultant volume loss and associated effusion ( black arrow ).
Figure e34-45 Metastatic sarcoma. Note the multiple, well-circum-scribed nodules of different size.
Figure e34-46 Left lower lobe lung mass ( red arrow ) abutting pleura. Biopsy demonstrated small cell lung cancer.
Figure e34-47 CT scan of soft tissue mass encircling the trachea ( red arrow ) and invading tracheal lumen. Biopsy demonstrated adenoid cystic carcinoma (cylindroma).
NODULES AND MASSES
Copyright © 2012 The McGraw-Hill Companies, Inc. All rights reserved.
PART 11
Disorders of the Respiratory System
34-16
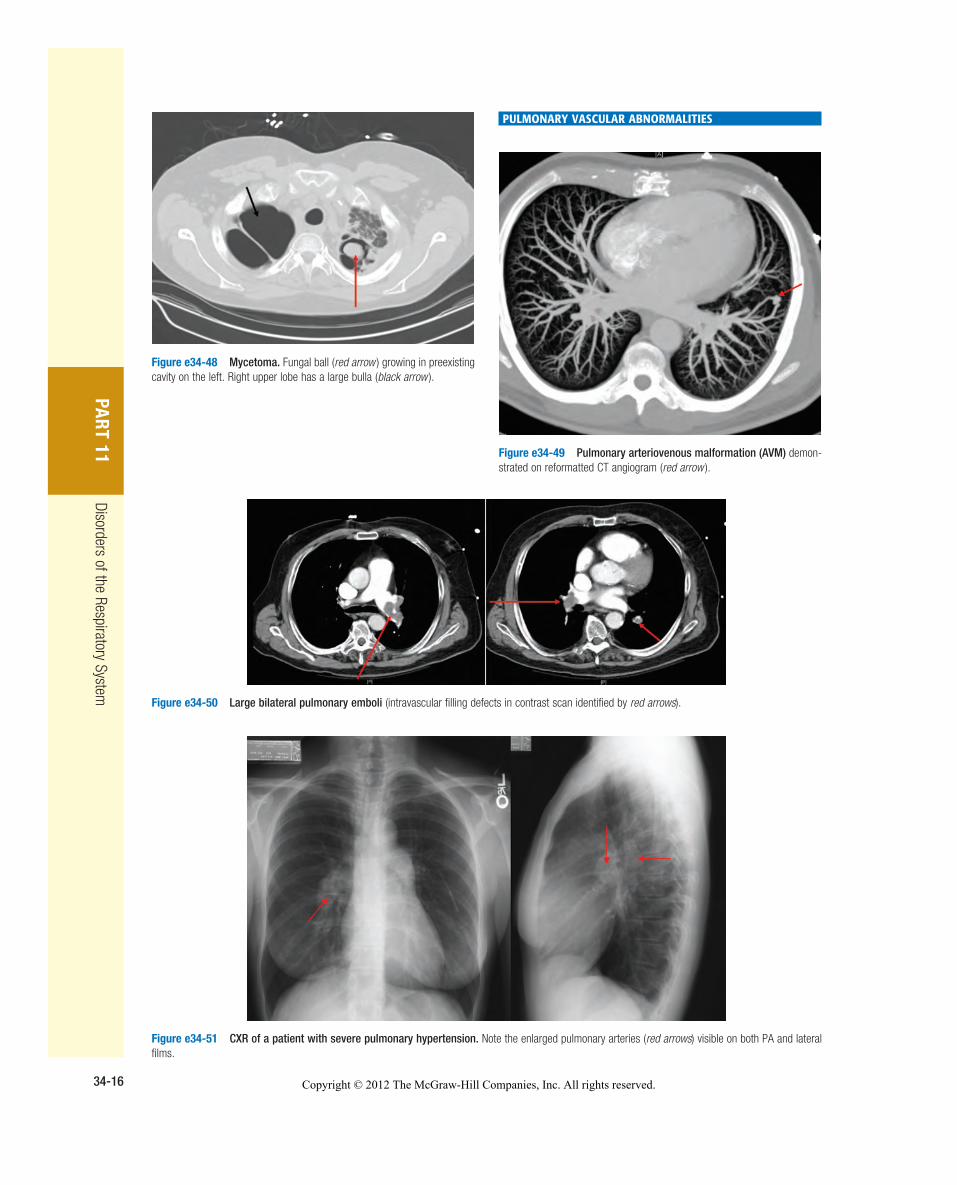
PULMONARY VASCULAR ABNORMALITIES
Figure e34-48 Mycetoma. Fungal ball ( red arrow ) growing in preexisting cavity on the left. Right upper lobe has a large bulla ( black arrow ).
Figure e34-49 Pulmonary arteriovenous malformation (AVM) demon-strated on reformatted CT angiogram ( red arrow ).
Figure e34-50 Large bilateral pulmonary emboli (intravascular filling defects in contrast scan identified by red arrows ).
Figure e34-51 CXR of a patient with severe pulmonary hypertension. Note the enlarged pulmonary arteries ( red arrows ) visible on both PA and lateral films.
Copyright © 2012 The McGraw-Hill Companies, Inc. All rights reserved.
CHA
PTER e34
Atlas of Chest Imaging
34-17
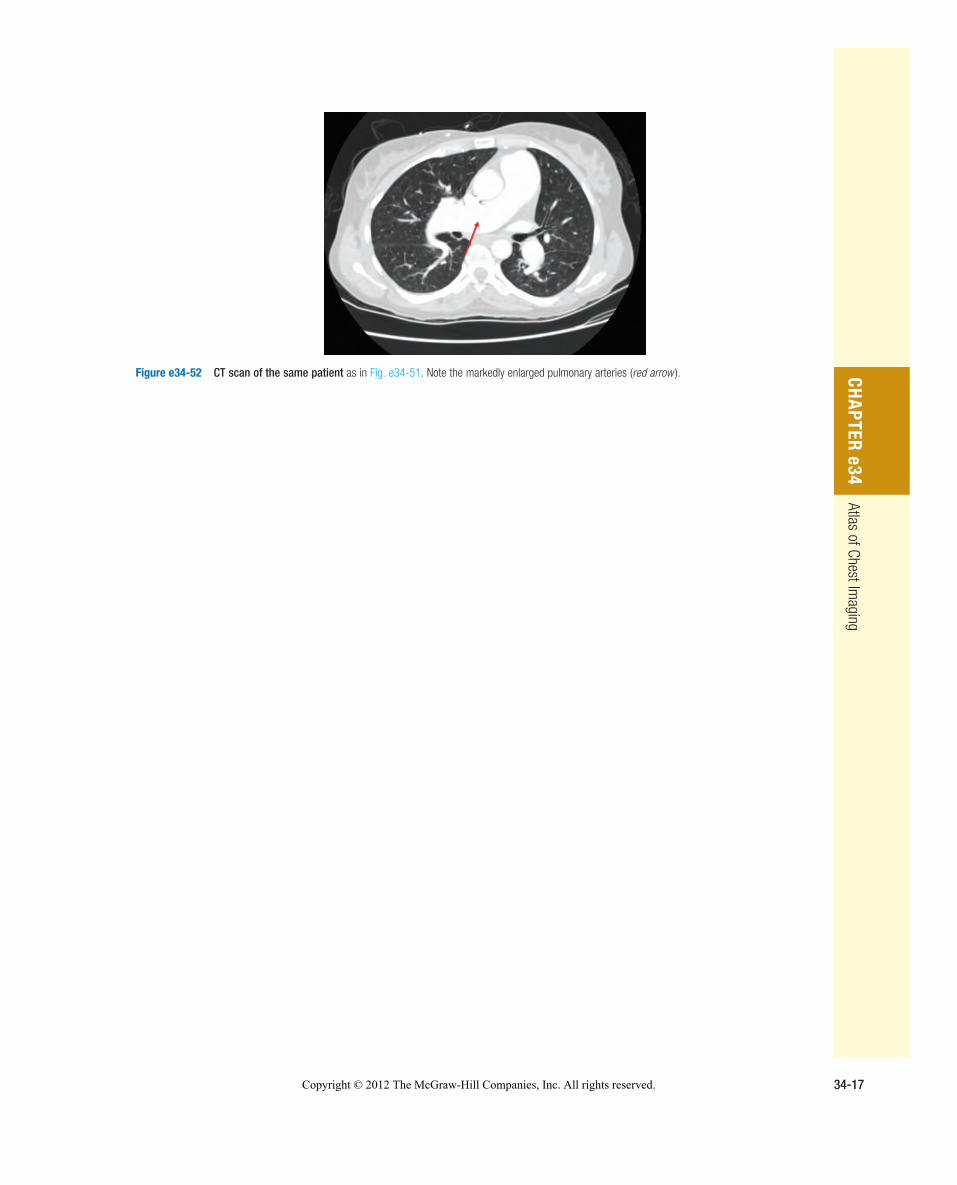
Figure e34-52 CT scan of the same patient as in Fig. e34-51. Note the markedly enlarged pulmonary arteries ( red arrow ).
Copyright © 2012 The McGraw-Hill Companies, Inc. All rights reserved.