Chapter 5: Probability Distributions: Discrete Probability Distributions
Upload
lenard-popeCategory
view
215download
1
Chapter
Discrete Probability Distributions
© 2010 Pearson Prentice Hall. All rights reserved
3

6-2© 2010 Pearson Prentice Hall. All rights reserved
Section 6.1 Probability Rules
6-3© 2010 Pearson Prentice Hall. All rights reserved

A random variable is a numerical measure of the outcome from a probability experiment, so its value is determined by chance. Random variables are denoted using letters such as X.
6-4© 2010 Pearson Prentice Hall. All rights reserved
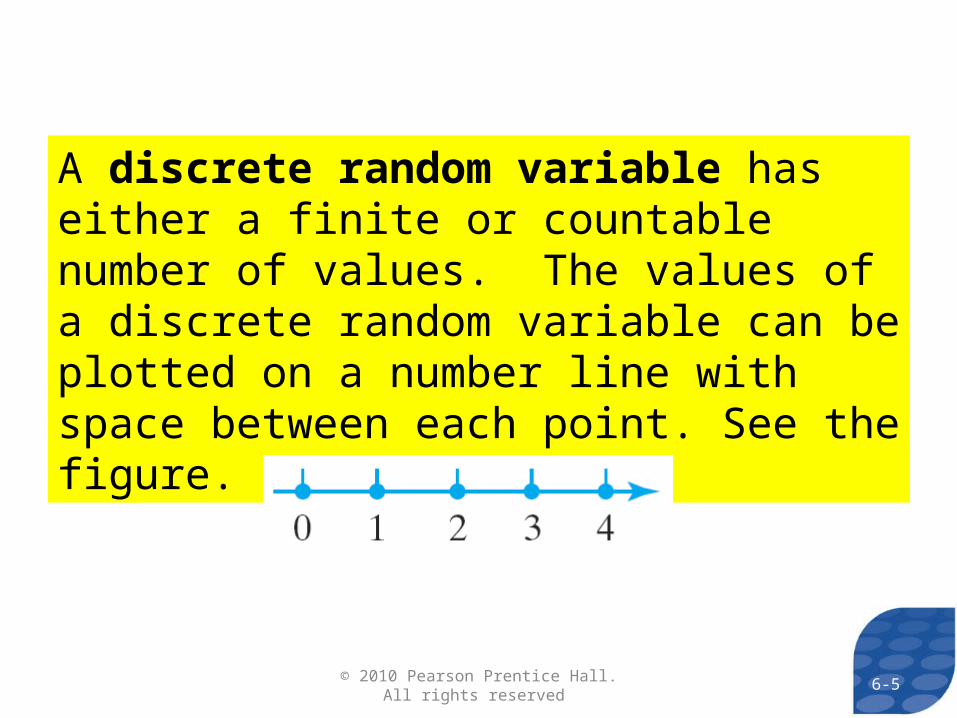
A discrete random variable has either a finite or countable number of values. The values of a discrete random variable can be plotted on a number line with space between each point. See the figure.
6-5© 2010 Pearson Prentice Hall. All rights reserved

A continuous random variable has infinitely many values. The values of a continuous random variable can be plotted on a line in an uninterrupted fashion. See the figure.
6-6© 2010 Pearson Prentice Hall. All rights reserved
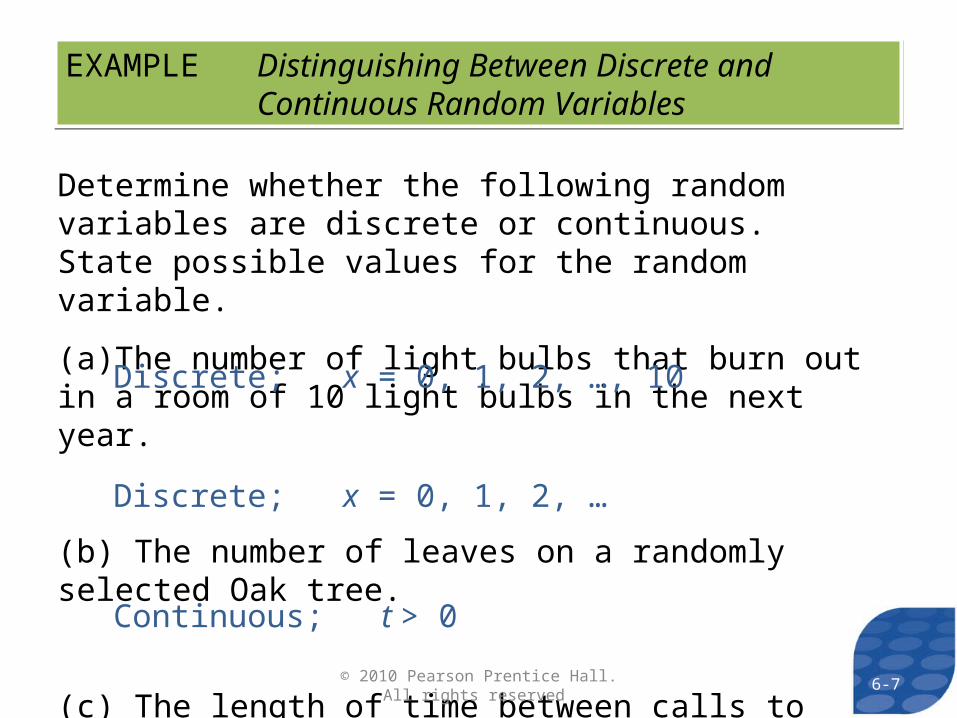
Determine whether the following random variables are discrete or continuous. State possible values for the random variable.
(a)The number of light bulbs that burn out in a room of 10 light bulbs in the next year.
(b) The number of leaves on a randomly selected Oak tree.
(c) The length of time between calls to 911.
EXAMPLE Distinguishing Between Discrete and Continuous Random Variables
EXAMPLE Distinguishing Between Discrete and Continuous Random Variables
Discrete; x = 0, 1, 2, …, 10
Discrete; x = 0, 1, 2, …
Continuous; t > 0
6-7© 2010 Pearson Prentice Hall. All rights reserved

6-8© 2010 Pearson Prentice Hall. All rights reserved

A probability distribution provides the possible values of the random variable X and their corresponding probabilities. A probability distribution can be in the form of a table, graph or mathematical formula.
6-9© 2010 Pearson Prentice Hall. All rights reserved

The table to the right shows the probability distribution for the random variable X, where X represents the number of DVDs a person rents from a video store during a single visit.
x P(x)0 0.061 0.582 0.223 0.104 0.035 0.01
EXAMPLE A Discrete Probability DistributionEXAMPLE A Discrete Probability Distribution
6-10© 2010 Pearson Prentice Hall. All rights reserved
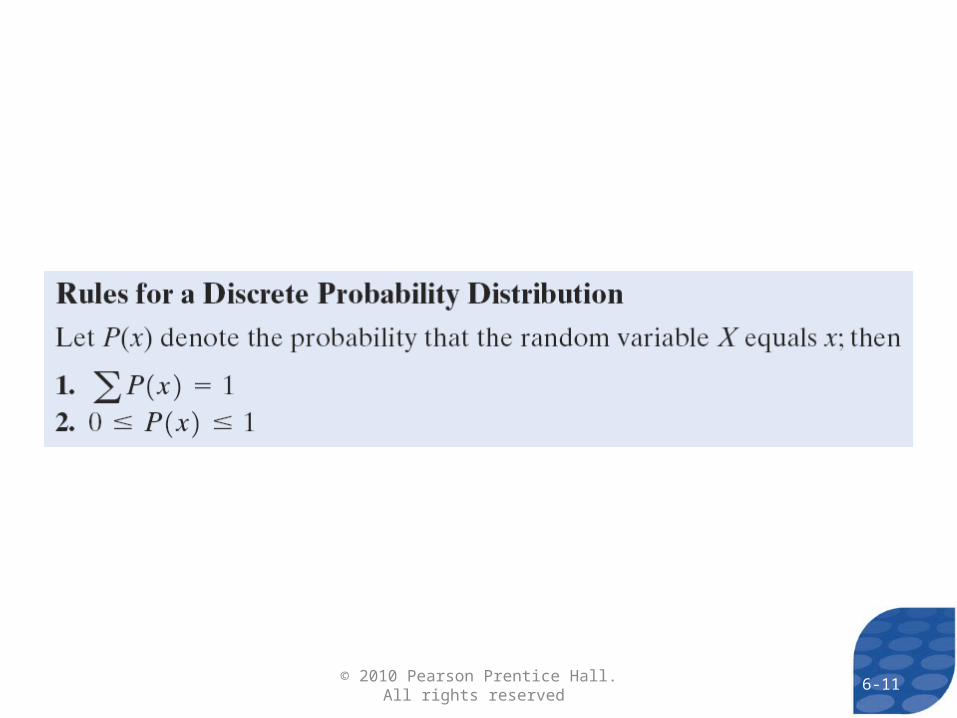
6-11© 2010 Pearson Prentice Hall. All rights reserved
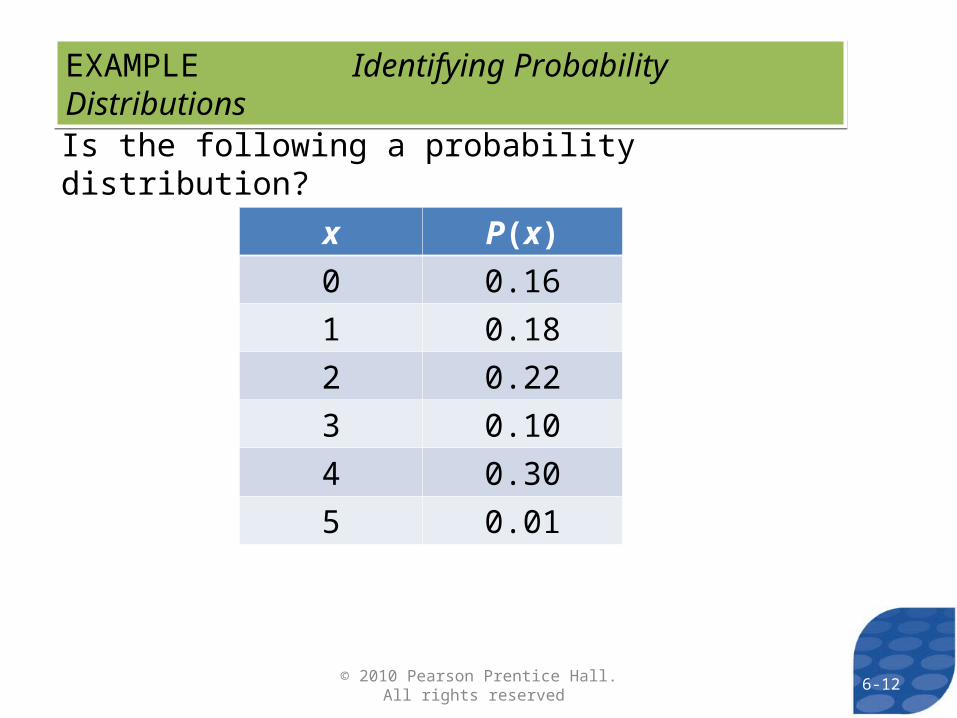
EXAMPLE Identifying Probability DistributionsEXAMPLE Identifying Probability Distributions
x P(x)0 0.161 0.182 0.223 0.104 0.305 0.01
Is the following a probability distribution?
6-12© 2010 Pearson Prentice Hall. All rights reserved

EXAMPLE Identifying Probability DistributionsEXAMPLE Identifying Probability Distributions
x P(x)0 0.161 0.182 0.223 0.104 0.305 -0.01
Is the following a probability distribution?
6-13© 2010 Pearson Prentice Hall. All rights reserved
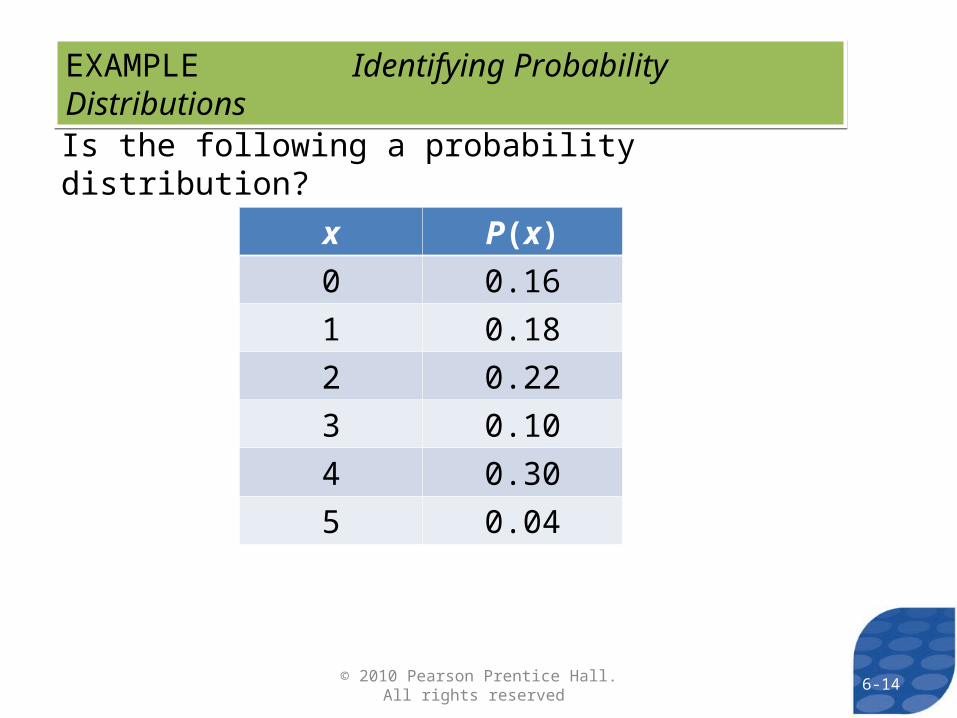
EXAMPLE Identifying Probability DistributionsEXAMPLE Identifying Probability Distributions
x P(x)0 0.161 0.182 0.223 0.104 0.305 0.04
Is the following a probability distribution?
6-14© 2010 Pearson Prentice Hall. All rights reserved
6-15© 2010 Pearson Prentice Hall. All rights reserved

A probability histogram is a histogram in which the horizontal axis corresponds to the value of the random variable and the vertical axis represents the probability of that value of the random variable.
6-16© 2010 Pearson Prentice Hall. All rights reserved
DVDs Rented at a Video Store
0
0.1
0.2
0.30.4
0.5
0.6
0.7
0 1 2 3 4 5
Number of DVDs Rented
Pro
ba
bili
ty
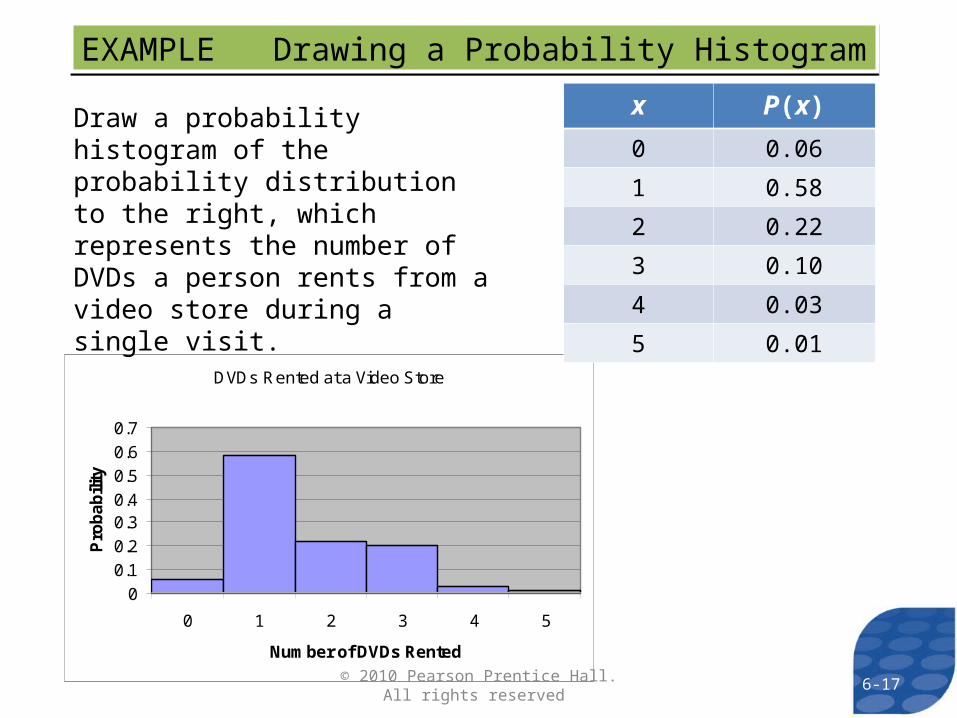
Draw a probability histogram of the probability distribution to the right, which represents the number of DVDs a person rents from a video store during a single visit.
EXAMPLE Drawing a Probability HistogramEXAMPLE Drawing a Probability Histogram
x P(x)
0 0.06
1 0.58
2 0.22
3 0.10
4 0.03
5 0.01
6-17© 2010 Pearson Prentice Hall. All rights reserved
6-18© 2010 Pearson Prentice Hall. All rights reserved

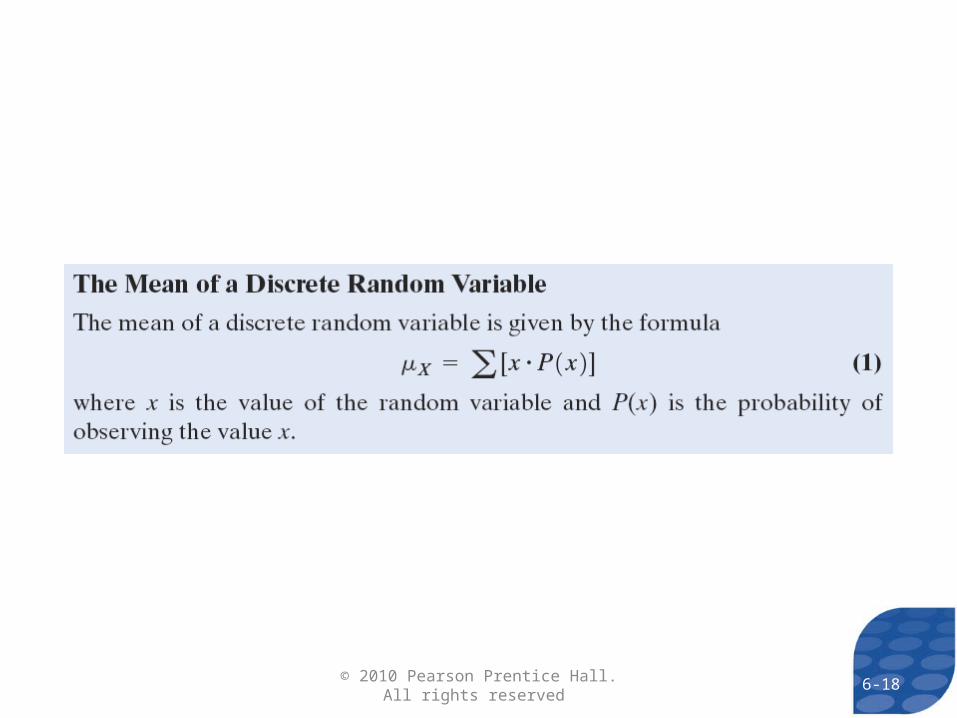
Compute the mean of the probability distribution to the right, which represents the number of DVDs a person rents from a video store during a single visit.
EXAMPLE Computing the Mean of a Discrete Random Variable
EXAMPLE Computing the Mean of a Discrete Random Variable
x P(x)
0 0.06
1 0.58
2 0.22
3 0.10
4 0.03
5 0.01
( )X x P x 0(0.06) 1(0.58) 2(0.22) 3(0.10) 4(0.03) 5(0.01) 1.49
6-19© 2010 Pearson Prentice Hall. All rights reserved
6-20© 2010 Pearson Prentice Hall. All rights reserved
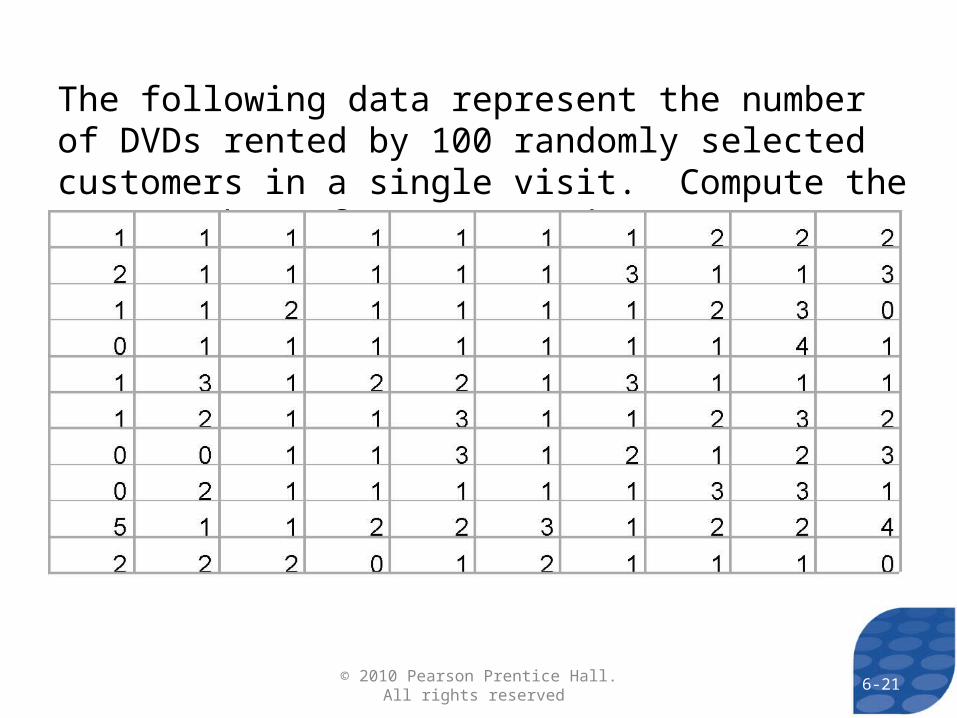
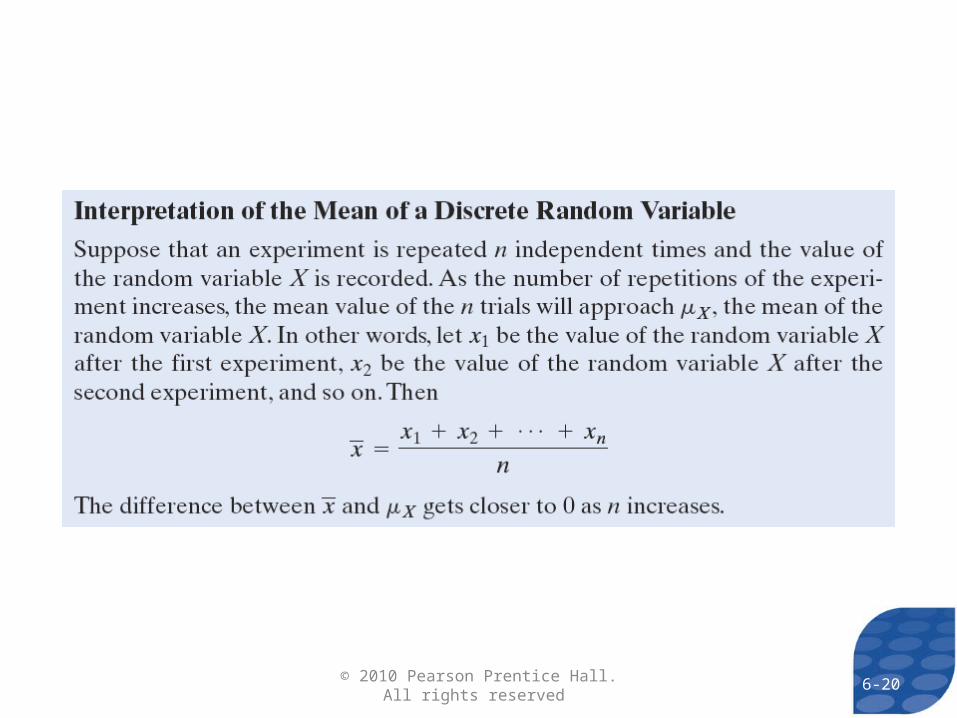
The following data represent the number of DVDs rented by 100 randomly selected customers in a single visit. Compute the mean number of DVDs rented.
6-21© 2010 Pearson Prentice Hall. All rights reserved
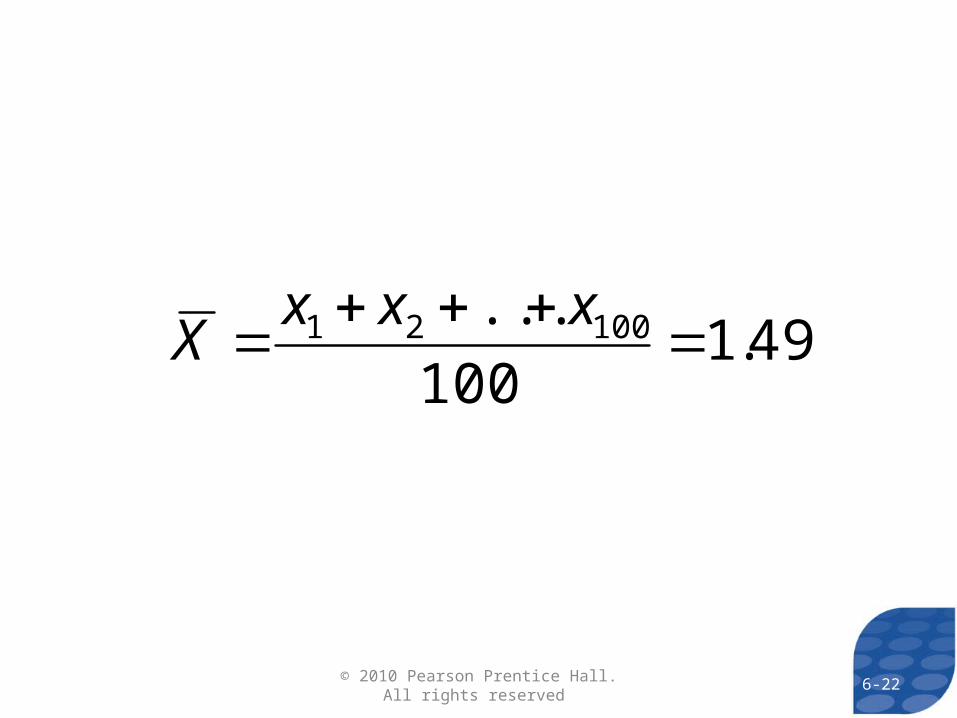
49.1100
... 10021
xxx
X
6-22© 2010 Pearson Prentice Hall. All rights reserved

As the number of trials of the experiment increases, the mean number of rentals approaches the mean of the probability distribution.
6-23© 2010 Pearson Prentice Hall. All rights reserved

6-24© 2010 Pearson Prentice Hall. All rights reserved
Because the mean of a random variable represents what we would expect to happen in the long run, it is also called the expected value, E(X), of the random variable.
6-25© 2010 Pearson Prentice Hall. All rights reserved
EXAMPLE Computing the Expected Value of a Discrete Random Variable
EXAMPLE Computing the Expected Value of a Discrete Random Variable
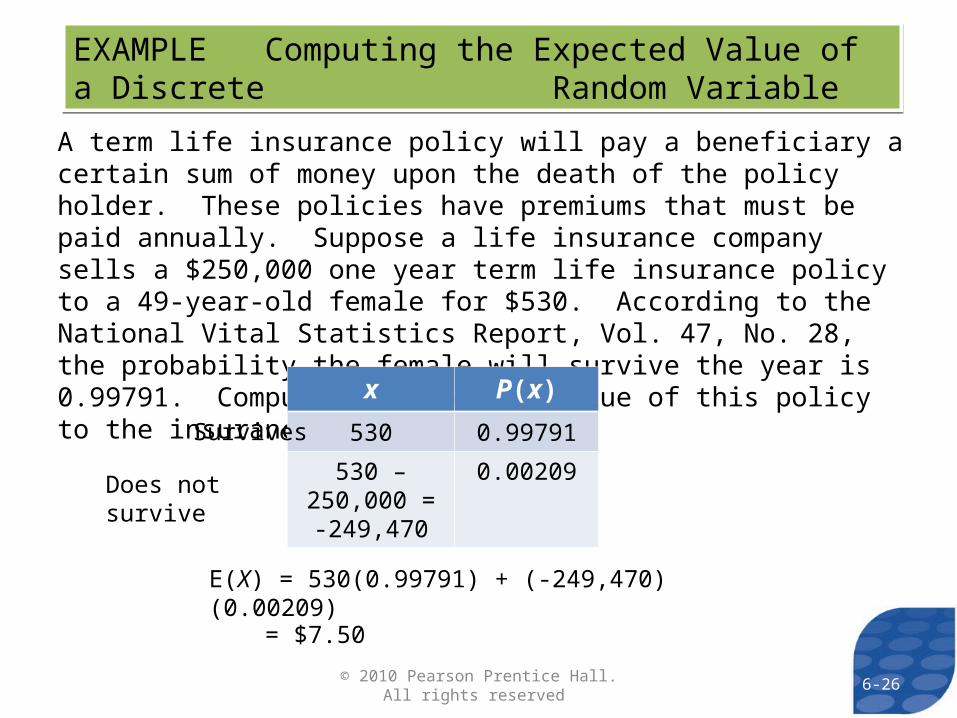
A term life insurance policy will pay a beneficiary a certain sum of money upon the death of the policy holder. These policies have premiums that must be paid annually. Suppose a life insurance company sells a $250,000 one year term life insurance policy to a 49-year-old female for $530. According to the National Vital Statistics Report, Vol. 47, No. 28, the probability the female will survive the year is 0.99791. Compute the expected value of this policy to the insurance company.
x P(x)
530 0.99791
530 – 250,000 = -249,470
0.00209
Survives
Does not survive
E(X) = 530(0.99791) + (-249,470)(0.00209)
= $7.50
6-26© 2010 Pearson Prentice Hall. All rights reserved
6-27© 2010 Pearson Prentice Hall. All rights reserved
6-28© 2010 Pearson Prentice Hall. All rights reserved

x P(x)0 0.06 -1.43 2.0449 0.1226941 0.58 -0.91 0.8281 0.4802982 0.22 -1.27 1.6129 0.3548383 0.1 -1.39 1.9321 0.193214 0.03 -1.46 2.1316 0.0639485 0.01 -1.48 2.1904 0.021904
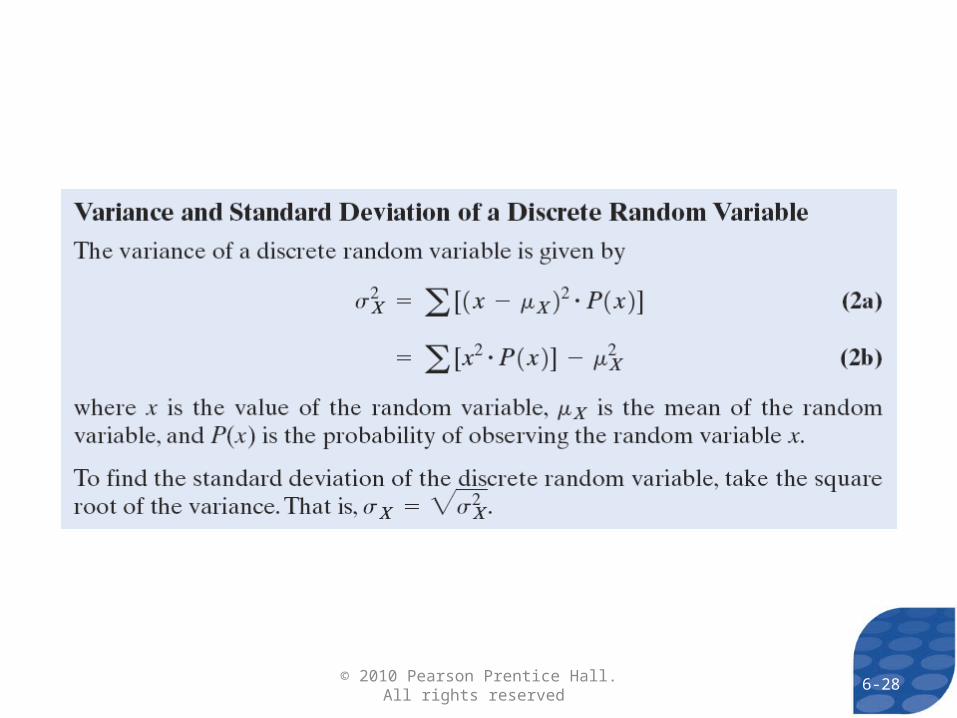
Compute the variance and standard deviation of the following probability distribution which represents the number of DVDs a person rents from a video store during a single visit.
EXAMPLE Computing the Variance and Standard Deviation of a Discrete Random Variable
EXAMPLE Computing the Variance and Standard Deviation of a Discrete Random Variable
x P(x)
0 0.06
1 0.58
2 0.22
3 0.10
4 0.03
5 0.01
Xx 2Xx
22 ( )
1.236892X Xx P x
2 ( )Xx P x
1.236892
1.11X
6-29© 2010 Pearson Prentice Hall. All rights reserved