Chapter 9: Design of Beams for Moment
30
Monday, June 27, 2011 Living Together: The Economics of Cohabitation Social & Demographic Trends Paul Taylor, Director Richard Fry, Senior Economist D’Vera Cohn, Senior Writer Wendy Wang, Research Associate Gabriel Velasco, Research Analyst Daniel Dockterman, Research Assistant FOR FURTHER INFORMATION CONTACT: Pew Social & Demographic Trends Tel (202) 419-4375 1615 L St, N.W., Suite 700 Washington, D.C. 20036 www.pewsocialtrends.org
Transcript of Chapter 9: Design of Beams for Moment

Monday, June 27, 2011
Living Together: The Economics of Cohabitation
Social &
Demographic
Trends
Paul Taylor, Director
Richard Fry, Senior Economist
D’Vera Cohn, Senior Writer
Wendy Wang, Research Associate
Gabriel Velasco, Research Analyst
Daniel Dockterman, Research Assistant
FOR FURTHER INFORMATION CONTACT:
Pew Social & Demographic Trends
Tel (202) 419-4375
1615 L St, N.W., Suite 700
Washington, D.C. 20036
www.pewsocialtrends.org
1
LIVING TOGETHER: THE ECONOMICS OF COHABITATION
www.pewsocialtrends.org
$90,067
$106,400
$101,160
$45,033
$46,540
$56,800
No partner
Cohabiter
Married
No partner
Cohabiter
Married
Not a college graduate
College graduate
Living Together: The Economics of Cohabitation
By Richard Fry and D’Vera Cohn
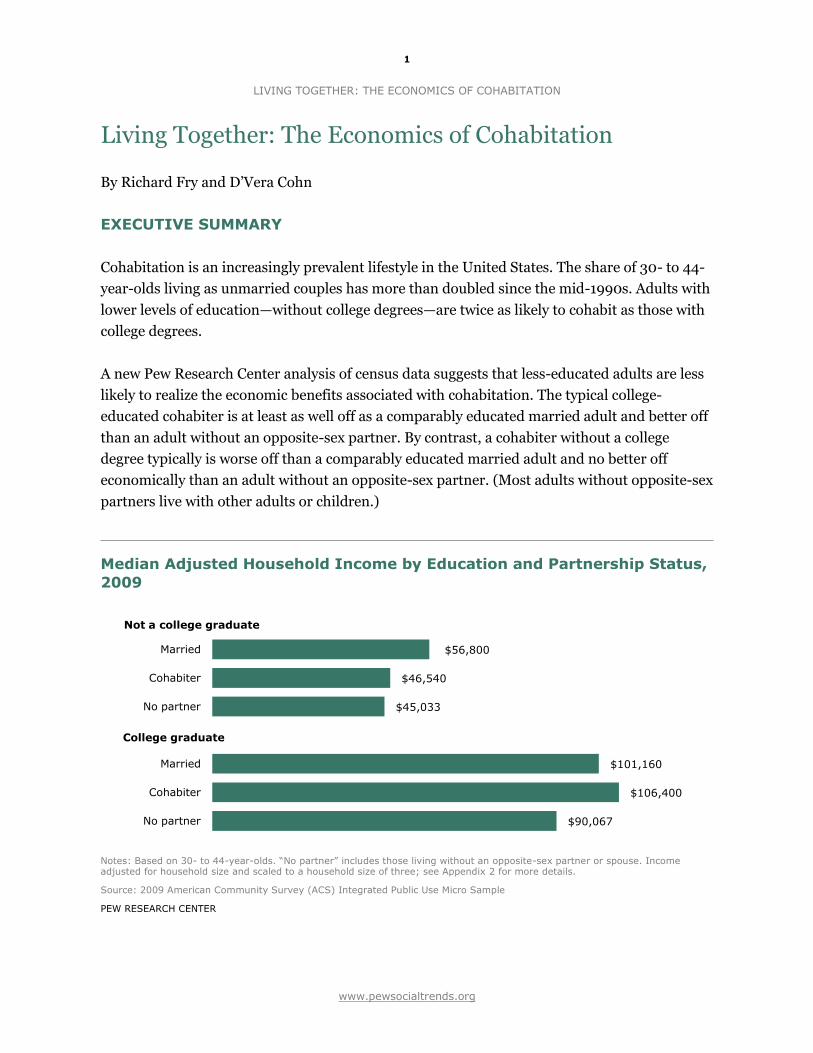
EXECUTIVE SUMMARY
Cohabitation is an increasingly prevalent lifestyle in the United States. The share of 30- to 44-
year-olds living as unmarried couples has more than doubled since the mid-1990s. Adults with
lower levels of education—without college degrees—are twice as likely to cohabit as those with
college degrees.
A new Pew Research Center analysis of census data suggests that less-educated adults are less
likely to realize the economic benefits associated with cohabitation. The typical college-
educated cohabiter is at least as well off as a comparably educated married adult and better off
than an adult without an opposite-sex partner. By contrast, a cohabiter without a college
degree typically is worse off than a comparably educated married adult and no better off
economically than an adult without an opposite-sex partner. (Most adults without opposite-sex
partners live with other adults or children.)
Median Adjusted Household Income by Education and Partnership Status,
2009
Notes: Based on 30- to 44-year-olds. “No partner” includes those living without an opposite-sex partner or spouse. Income adjusted for household size and scaled to a household size of three; see Appendix 2 for more details.
Source: 2009 American Community Survey (ACS) Integrated Public Use Micro Sample
PEW RESEARCH CENTER

2
LIVING TOGETHER: THE ECONOMICS OF COHABITATION
www.pewsocialtrends.org
Among the 30- to 44-year-old U.S. adults who are the focus of this report, 7% lived with an
opposite-sex partner in 2009, according to census data. The share is higher among adults
without a college education (8%) than among those with college degrees (4%).
The proportion of adults who ever have cohabited is much larger than the share currently
cohabiting, and it has grown to become a majority in recent decades, according to data from
the National Survey of Family Growth. Among women ages 19-44, for example, 58% had ever
lived with an opposite-sex unmarried partner in 2006-2008, up from 33% among a
comparable group in 1987 (National Center for Marriage and Family Research, 2010).
This report finds that greater economic well-being is associated with cohabitation for adults
with college degrees, but not for those without college degrees. The measurement used for
economic well-being is median household income, which in this analysis has been adjusted for
the size of the household and standardized to a household size of three.
Among college-educated adults, the median adjusted household income of cohabiters
($106,400 in 2009) slightly exceeded that of married adults ($101,160) and was significantly
higher than that of adults without opposite-sex partners ($90,067). However, among adults
without college degrees, the median adjusted household income of cohabiters ($46,540) was
well below that of married couples ($56,800) and was barely higher than that of adults without
opposite-sex partners ($45,033).
The Pew Research analysis finds that differences in employment rates and household living
arrangements of cohabiters with and without college degrees help explain gaps in their
comparative economic well-being. These differences include:
Among the college-educated, two-earner couples were more prevalent among
cohabiters (78%) than married adults (67%) in 2009. By working more, cohabiters
offset married adults’ higher median earnings.
Among those without college degrees, two-earner couples were slightly less prevalent
among cohabiters (55%) than married adults (59%) in 2009. In addition to being more
likely to work, these married adults have the advantage of higher median earnings.
Among the college-educated, a much higher share of married adults (81%) than
cohabiters (33%) lived in a household with children in 2009. In addition, among those
with children in the household, married adults tend to have more children. The greater
presence of children in married-couple households may help explain the lower share of
two-earner couples among married adults.

3
LIVING TOGETHER: THE ECONOMICS OF COHABITATION
www.pewsocialtrends.org
Among adults without college degrees, the majority of both married adults (85%) and
cohabiters (67%) have children in the household. The relatively large presence and
number of children in the households of cohabiters without college degrees may reduce
the extent to which both partners in such relationships can earn income.
Whatever their partnership status, adults in households with children have
significantly lower median household incomes than comparably educated adults in
households without children. Cohabiting adults without college degrees are much
more likely to be in a household with children than are college-educated cohabiters,
diminishing their potential economic gains from cohabitation.
The earnings of college-educated adults who live without opposite-sex partners
constitute the bulk of their household income (88%). A college-educated cohabiter’s
earnings typically make up 50% of the household income, suggesting that those who
move in with a partner obtain a net boost to their household incomes.
Among adults without college degrees, earnings of those who live without opposite-sex
partners constitute 43% of their household income. Earnings of cohabiters make up
42% of household income, suggesting that those who move in with a partner do not
obtain a net boost to their household incomes.
Among adults who live without opposite-sex partners, differing household composition
helps to explain why those with college degrees typically gain an economic boost from
cohabitation but those without college degrees do not. Most of these adults live with
others, such as their own parents, their children or roommates. The college-educated
without opposite-sex partners are more likely to live alone (44% to 20%). They are less
likely to live with other family members who may supply some of the household
income—income that may be lost in a transition to cohabitation.
A voluminous body of social science research shows that marriage is associated with a variety
of benefits for adults. In the words of one researcher: ―For well over a century, researchers
have known that married people are generally better off than their unmarried counterparts‖
(Nock, 2005). Yet in recent decades marriage rates have declined—particularly among less
educated adults—as cohabitation rates have increased.
It also would seem that cohabitation would be associated with greater economic well-being
than living without a partner because of the economies of scale achieved by combining two
households. Yet adults without college degrees who cohabit are no better off than those who
live without opposite-sex partners.

4
LIVING TOGETHER: THE ECONOMICS OF COHABITATION
www.pewsocialtrends.org
The findings in this report suggest that cohabitation plays a different role in the lives of adults
with and without college degrees. For the most educated, living as an unmarried couple
typically is an economically productive way to combine two incomes and is a step toward
marriage and childbearing. For adults without college degrees, cohabitation is more likely to be
a parallel household arrangement to marriage—complete with children—but at a lower
economic level than married adults enjoy.
This report uses U.S. Census Bureau data to analyze the economic and household
circumstances of opposite-sex cohabiters ages 30-44 as well as those of comparably educated
married adults and adults without opposite-sex partners. The age range was chosen because it
is a time of life when most adults have completed their education, gone to work and
established their own households.
About 400,000 adults ages 30-44 are partners in same-sex unmarried couples, according to
the 2009 American Community Survey, compared with 4.2 million who live with a partner of
the opposite sex. Same-sex couples have distinctive patterns of income, education and
household composition. They have higher median adjusted incomes ($99,204) than opposite-
sex cohabiters ($54,179), married couples ($70,711) or adults without partners ($53,399).
About half (48%) are college graduates, a notably higher share than for other adults. Less than
a third (31%) live with children, a lower share than opposite-sex cohabiters.
The analysis of cohabiting couples in this report is restricted to opposite-sex unmarried
partners. The analysis makes the assumption that these couples have the choice to marry or
cohabit, which is not the case for most same-sex couples. There also is a dearth of data on
marriage trends among same-sex couples, for whom the option to marry only recently became
available in a limited number of venues.
In this report, same-sex unmarried partners are included in the category of adults with no
partner. Although same-sex couples and adults with no partner differ in income, education and
household composition, combining them in the same category does not change the findings
about the relative economic conditions for adults in the three partnership status groups.
The first section examines the prevalence and growth of cohabitation, compared with marriage
or living without a partner, by educational attainment. The second section analyzes the
economic outcomes of adults by partnership status and educational attainment. The third
section examines adults’ labor market characteristics to understand the comparative patterns
of economic well-being. The fourth section looks at some differences in the types of

5
LIVING TOGETHER: THE ECONOMICS OF COHABITATION
www.pewsocialtrends.org
households in which these adults live—again, by partnership status and educational
attainment.

6
LIVING TOGETHER: THE ECONOMICS OF COHABITATION
www.pewsocialtrends.org
ABOUT THE REPORT
This report was researched and written by Richard Fry and D’Vera Cohn, senior economist and
senior writer, respectively, of the Social & Demographic Trends project of the Pew Research
Center. The report was edited by Paul Taylor, executive vice president of the Pew Research
Center and director of the Social & Demographic Trends project. Research associate Wendy
Wang assisted with charts and editing. Research analyst Gabriel Velasco helped with the
preparation of charts. The report was number-checked by Daniel Dockterman, Pew Research
Center research assistant. The report was copy-edited by Marcia Kramer. The Center
appreciates the comments of outside reviewers Wendy Manning of Bowling Green State
University and Adam Thomas of the Brookings Institution on an earlier draft.
The main data source for this report is the Census Bureau’s 2009 American Community
Survey, which supplied data about partnership status and other individual and household
characteristics for adults ages 30-44. The Census Bureau’s Current Population Survey is the
source of data about long-term trends in the prevalence of cohabitation. For more detail, see
the Appendix.
TERMINOLOGY
―College-educated‖ refers to persons who report that their highest education is at least a
bachelor’s degree. Persons whose highest education is an associate’s degree or ―some college
but no degree‖ are included with not college-educated adults in this report.
A ―two-earner‖ or ―dual-earner‖ couple refers to a relationship in which both partners were
employed at the time of interview.
―Living with children‖ refers to living with one or more own children (of any age or marital
status), that is, living with step-children and adopted children as well as biological children, as
well as living with any own children of their partner. Most are under 18.
The category of adults not living with a partner includes same-sex couples. Cohabiting couples consist only of opposite-sex couples.

7
LIVING TOGETHER: THE ECONOMICS OF COHABITATION
www.pewsocialtrends.org
58%
7%
35%
MarriedNo Partner
Cohabiter
I. PREVALENCE AND GROWTH OF COHABITATION
Cohabitation has become increasingly commonplace among all U.S. adults, and research
suggests that most women who marry for the first time cohabit first. However, there are
notable differences by educational attainment: Cohabitation is more prevalent among the less
educated and its rise in this group has been accompanied by a decline in marriage rates. This is
not the case for college-educated adults, whose marriage rates have held steady as cohabitation
has grown.
In 2009, there were 60.4 million U.S. adults ages 30 to 44, including about 4.2 million (7%)
living with an unmarried partner of the opposite sex. 1 The majority (58%) were married and
living with spouses. The remaining 35% did not live with an opposite-sex spouse or partner; a
significant share of this group (42%) had previously been married.
Comparing partnership status by educational
attainment, college-educated adults are more
likely to be married than their less-educated
counterparts (Fry and Cohn 2010). Adults
without college degrees are more likely to
cohabit.
Among adults ages 30-44 with college degrees
in 2009, 68% were married, 4% lived with an
opposite-sex unmarried partner and 28% lived
without an opposite-sex partner or spouse.
Among adults without college degrees, 54%
were married, 8% lived with an opposite-sex
unmarried partner and 38% lived without an
opposite-sex partner or spouse.
The rate of cohabitation has more than
doubled in this age group over the past 15
years. The 7% of adults ages 30-44 who cohabited in 2010 compared with 3% who did so in
1995, according to data from the Current Population Survey.
1 These 4.2 million people are members of unmarried-partner couples in households headed by unmarried partners. Cohabiting
partnerships that do not include the household head cannot be identified in the 2009 American Community Survey. As discussed
in the Appendix, cohabiting partnerships involving the household head account for about 80% of all cohabiters.
Partnership Status, 2009
Notes: Based on 30- to 44-year-olds. “No partner” includes those living without an opposite-sex partner or spouse.
Source: 2009 American Community Survey (ACS) Integrated Public Use Micro Sample
PEW RESEARCH CENTER
8
LIVING TOGETHER: THE ECONOMICS OF COHABITATION
www.pewsocialtrends.org
58
54
68
7
8
4
35
38
28
All
Not a college graduate
College graduate
Married Cohabiter No Partner
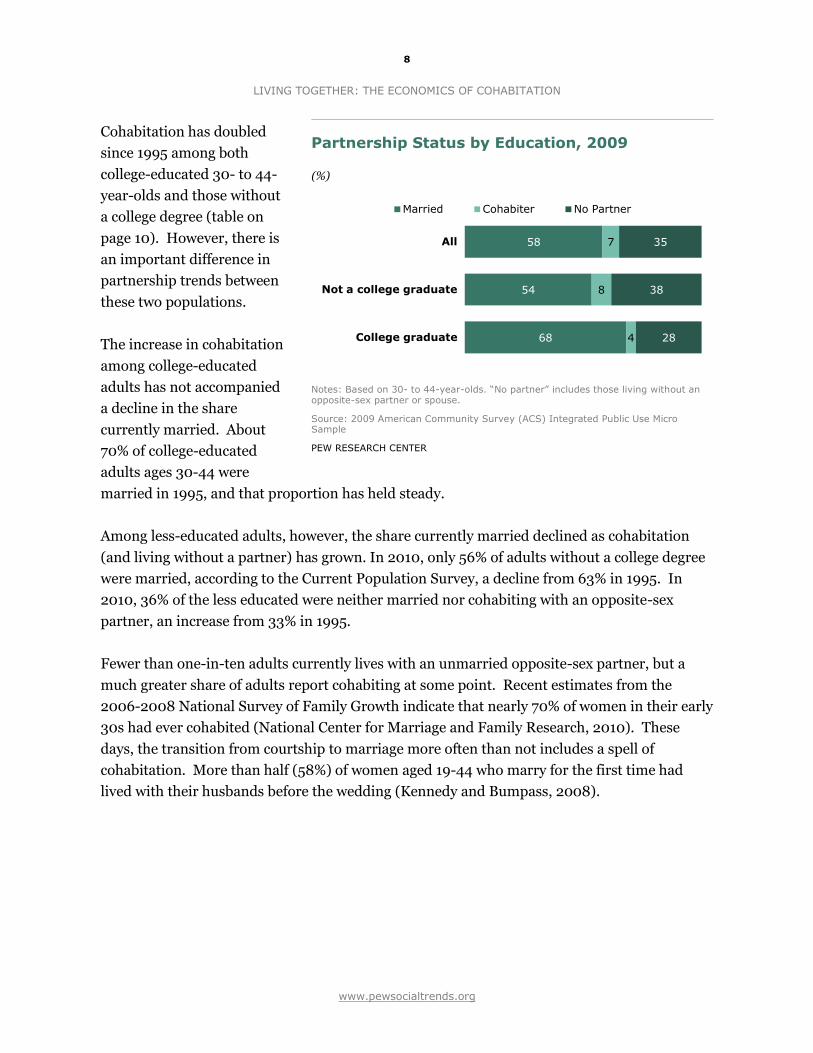
Cohabitation has doubled
since 1995 among both
college-educated 30- to 44-
year-olds and those without
a college degree (table on
page 10). However, there is
an important difference in
partnership trends between
these two populations.
The increase in cohabitation
among college-educated
adults has not accompanied
a decline in the share
currently married. About
70% of college-educated
adults ages 30-44 were
married in 1995, and that proportion has held steady.
Among less-educated adults, however, the share currently married declined as cohabitation
(and living without a partner) has grown. In 2010, only 56% of adults without a college degree
were married, according to the Current Population Survey, a decline from 63% in 1995. In
2010, 36% of the less educated were neither married nor cohabiting with an opposite-sex
partner, an increase from 33% in 1995.
Fewer than one-in-ten adults currently lives with an unmarried opposite-sex partner, but a
much greater share of adults report cohabiting at some point. Recent estimates from the
2006-2008 National Survey of Family Growth indicate that nearly 70% of women in their early
30s had ever cohabited (National Center for Marriage and Family Research, 2010). These
days, the transition from courtship to marriage more often than not includes a spell of
cohabitation. More than half (58%) of women aged 19-44 who marry for the first time had
lived with their husbands before the wedding (Kennedy and Bumpass, 2008).
Partnership Status by Education, 2009
(%)
Notes: Based on 30- to 44-year-olds. “No partner” includes those living without an opposite-sex partner or spouse.
Source: 2009 American Community Survey (ACS) Integrated Public Use Micro Sample
PEW RESEARCH CENTER

9
LIVING TOGETHER: THE ECONOMICS OF COHABITATION
www.pewsocialtrends.org
3 3 4 4 4 5 5 5 5 5 5 5 6 6 67
1995 1996 1997 1998 1999 2000 2001 2002 2003 2004 2005 2006 2007 2008 2009 2010
It is beyond the scope of this report to analyze by educational attainment the proportion of
adults who ever have cohabited or the share who married after cohabiting, but other research
suggests that there are important differences. As might be expected from current cohabitation
rates, women without college degrees also are most likely to have cohabited at some point in
their lives. Among women ages 19-44, 73% of those without a high school education have ever
cohabited, compared with about half of women with some college (52%) or a college degree
(47%) (National Center for Marriage and Family Research, 2010).
In addition, an analysis of data about first-time cohabiters, ages 15-44, from the National
Survey of Family Growth indicates that college-educated cohabiters are more likely to marry
within three years of moving in together than are less-educated cohabiters. More than 60% of
first-time college-educated cohabiters married within three years, compared with half of those
with a high school diploma and no college education (Goodwin, Mosher, and Chandra, 2010).
Survey findings by the Pew Research Center indicate that most, but not all, adults who cohabit
view it as a step toward marriage. In a 2010 Pew Research Center survey, nearly two-thirds
(64%) of respondents who ever have lived with an unmarried partner say they thought of it as a
step toward marriage. Among those currently living with a partner, 53% say so, compared with
67% of those who cohabited sometime in the past.
Prevalence of Cohabitation Has Doubled Since 1995
% among 30- to 44-year-olds
Notes: Tabulated among the civilian population residing in households. Includes those living with an opposite-sex partner.
Source: March Current Population Survey (CPS) Integrated Public Use Micro Samples.
PEW RESEARCH CENTER

10
LIVING TOGETHER: THE ECONOMICS OF COHABITATION
www.pewsocialtrends.org
There are no differences by education level on whether cohabitation is viewed as a step toward
marriage, but there are some differences by income level. The most affluent respondents (with
household incomes of at least $75,000) are more likely than the least affluent (with household
incomes of less than $30,000) to say they thought of cohabitation as a step toward marriage
(69% to 59%).
Public opinion research indicates that Americans have become more accepting of unmarried
couples than in the past but that a notable minority disapproves.2 The same 2010 Pew
Research Center Survey that interviewed current and past cohabiters also found that among
the general public, 43% of adults believe the increase in unmarried couples living together is
bad for society, while 9% believe it is good for society and 46% say it makes no difference.
2 Pew Research Center Social & Demographic Trends project, “The Decline of Marriage and Rise of New Families,” Nov. 18, 2010,
(http://pewsocialtrends.org/2010/11/18/the-decline-of-marriage-and-rise-of-new-families/).
Partnership Status by Education, 1995 to 2010
% among 30- to 44-year-olds
Not a college graduate College graduate
Year Married Cohabiter No Partner Total Married Cohabiter No Partner Total
2010 56 8 36 100 71 5 25 100
2009 58 7 35 100 72 4 24 100
2008 57 7 36 100 71 4 25 100
2007 59 7 34 100 73 3 24 100
2006 58 7 35 100 72 3 25 100
2005 59 6 35 100 72 4 25 100
2004 60 6 34 100 71 3 26 100
2003 60 6 34 100 71 3 25 100
2002 61 6 33 100 71 3 26 100
2001 62 6 32 100 70 3 27 100
2000 62 6 33 100 70 3 27 100
1999 61 5 34 100 70 3 27 100
1998 62 4 34 100 71 2 27 100
1997 62 4 34 100 72 2 26 100
1996 62 4 34 100 71 2 27 100
1995 63 4 33 100 72 2 26 100
Notes: Tabulated among the civilian population residing in households. “No partner” includes those living without an opposite-sex partner or spouse. Numbers may not add to total because of rounding.
Source: March Current Population Survey (CPS) Integrated Public Use Micro Samples
PEW RESEARCH CENTER

11
LIVING TOGETHER: THE ECONOMICS OF COHABITATION
www.pewsocialtrends.org
II. THE ECONOMICS OF COHABITATION
This section analyzes the economic well-being of 30- to 44-year-old adults, by partnership
status and educational attainment, using measures of median household income and poverty
rates to assess overall well-being.
By these measures, among the college-educated, cohabiters compare favorably with married
couples and are better off than adults without opposite-sex partners, while cohabiters without
a college degree are worse off than comparable married adults and barely surpass adults
without opposite-sex partners.
A recent Pew Research Center survey indicates that when unmarried partners decide to move
in together, some base their decisions in part on financial considerations. The survey asked
adults who ever lived with an unmarried partner whether household finances played a role in
their decision to move in together. Overall, 32% say finances did play a role, and 66% say they
did not. There are no notable differences between those with and without a college degree on
this question.
Economic Well-Being of 30- to 44-Year-Olds, by Education and Partnership
Status, 2009
Not a college graduate College graduate
Married Cohabiter No Partner Married Cohabiter No Partner
Median household income
$65,000 $50,000 $40,900 $110,000 $95,400 $69,000
Median adjusted household income
$56,800 $46,540 $45,033 $101,160 $106,400 $90,067
Poverty rate 9% 31% 22% 2% 9% 7%
Median wages as share of household income
40% 42% 43% 49% 50% 88%
Notes: Adjusted household incomes controls for household size. “No partner” includes those living without an opposite-sex partner or spouse.
Source: 2009 American Community Survey (ACS) Integrated Public Use Micro Sample
PEW RESEARCH CENTER
12
LIVING TOGETHER: THE ECONOMICS OF COHABITATION
www.pewsocialtrends.org
As shown in the table above, unadjusted median household income is higher for married
couples than for cohabiters or adults without partners, regardless of educational attainment.3
Cohabiters also have notably higher household income than do adults who do not live with an
opposite-sex partner.
These simple household income tabulations do not tell the full story of available economic
resources, however, because they do not account for the size of the household. A person living
alone can afford more on the same income than a married couple or a family of four. This
analysis adjusts for household size and produces a standardized result scaled to a three-person
household. The household size adjustment is not as simple as calculating the household
income per household member, which would not allow for economies of scale or the notion
that ―two can live more cheaply than one.‖ Instead, the analysis uses the standard equivalence
scale approach in order to compare households of different sizes on an equal basis. In
measuring household well-being, the analysis assumes that a two-person household requires
1.41 times the income of a one-person household to be equally well-off (see the Appendix for
further details).
When median adjusted household income is analyzed, the income rankings change
considerably for college graduates. The typical college-educated cohabiter has a higher
adjusted household income ($106,400 in 2009) than either the typical comparably educated
married adult ($101,160) or adult not living with a partner ($90,067).
Among adults without a college degree, however, marriage is associated with the highest
economic status. Cohabiters are not much better off in adjusted household income terms
($46,540 in 2009) than those who do not live with opposite-sex partners ($45,033).
The adjusted household income figures suggest the amount of available economic resources,
but the amount that each adult actually receives depends on how household members share
those resources. There is evidence that married and cohabiting couples tend to use different
money management systems, with married couples more likely to pool their money for joint
use (Hamplova and Le Bourdais, 2009; Kenney, 2006).
Another measure of economic well-being is poverty rates. Among the college-educated, 9% of
cohabiters lived in poverty in 2009, compared with 2% of married adults and 7% of adults
without opposite-sex partners. A notable 31% of cohabiters without college degrees lived in
3 Household income refers to the total money income of all household members, before taxes. It does not include non-cash
sources of income such as nutritional assistance, Medicare, Medicaid, public housing or employer-provided fringe benefits.

13
LIVING TOGETHER: THE ECONOMICS OF COHABITATION
www.pewsocialtrends.org
poverty in 2009, a higher share not only than married adults (9%) but also well above the 22%
rate for comparably educated adults without opposite-sex partners.
14
LIVING TOGETHER: THE ECONOMICS OF COHABITATION
www.pewsocialtrends.org
80
77
75
77
74
70
85
90
88
5
10
10
6
11
11
3
5
6
15
13
15
17
15
18
13
5
6
Married
Cohabiter
No Partner
Married
Cohabiter
No Partner
Married
Cohabiter
No Partner
Employed Unemployed Not in labor force
All
Not a college graduate
College graduate
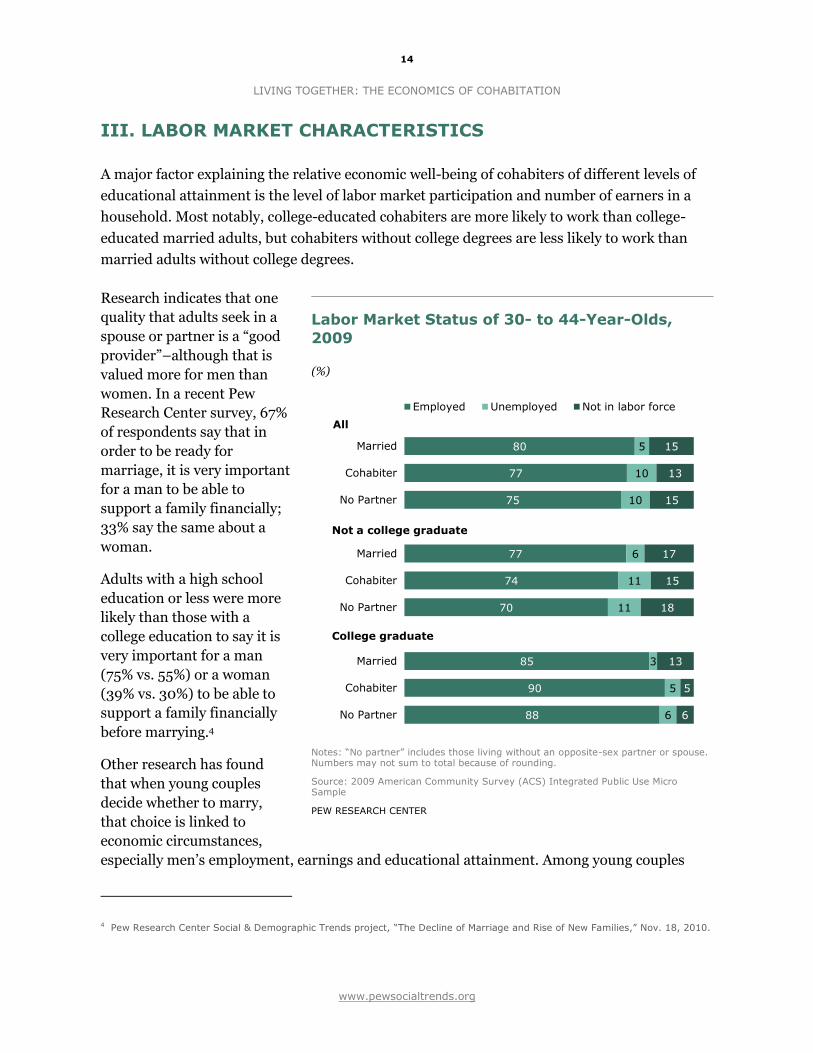
III. LABOR MARKET CHARACTERISTICS
A major factor explaining the relative economic well-being of cohabiters of different levels of
educational attainment is the level of labor market participation and number of earners in a
household. Most notably, college-educated cohabiters are more likely to work than college-
educated married adults, but cohabiters without college degrees are less likely to work than
married adults without college degrees.
Research indicates that one
quality that adults seek in a
spouse or partner is a ―good
provider‖–although that is
valued more for men than
women. In a recent Pew
Research Center survey, 67%
of respondents say that in
order to be ready for
marriage, it is very important
for a man to be able to
support a family financially;
33% say the same about a
woman.
Adults with a high school
education or less were more
likely than those with a
college education to say it is
very important for a man
(75% vs. 55%) or a woman
(39% vs. 30%) to be able to
support a family financially
before marrying.4
Other research has found
that when young couples
decide whether to marry,
that choice is linked to
economic circumstances,
especially men’s employment, earnings and educational attainment. Among young couples
4 Pew Research Center Social & Demographic Trends project, “The Decline of Marriage and Rise of New Families,” Nov. 18, 2010.
Labor Market Status of 30- to 44-Year-Olds,
2009
(%)
Notes: “No partner” includes those living without an opposite-sex partner or spouse. Numbers may not sum to total because of rounding.
Source: 2009 American Community Survey (ACS) Integrated Public Use Micro Sample
PEW RESEARCH CENTER
15
LIVING TOGETHER: THE ECONOMICS OF COHABITATION
www.pewsocialtrends.org
$50,000
$50,000
$60,000
$25,000
$26,000
$31,800
$30,000
$30,000
$40,000
No partner
Cohabiter
Married
No partner
Cohabiter
Married
No partner
Cohabiter
MarriedAll
Not a college graduate
College graduate
without college degrees, many believe that marriage is a sign of an adequate level of economic
achievement. (Smock et al., 2005)
Consistent with this, married adults overall tend to have greater success in the labor market—
measured by employment and wages—than their unmarried counterparts. Cohabiters are
more likely to have a job than are adults not living with a spouse or partner of the opposite sex.
Characteristics of Individuals
Among the college-educated, married adults (85%) were slightly less likely to be employed
than cohabiting adults (90%) or those without opposite-sex partners (88%). A notable 13% of
married college-educated adults were not in the labor force, perhaps because of child-raising
responsibilities.
Among adults without college degrees, 77% of married adults had jobs in 2009, compared with
a slightly lower 74% of cohabiting adults and 70% of adults without a partner. All categories of
adults—whether married, cohabiting or not living with an opposite-sex partner—had similar
rates of not participating in the labor force.
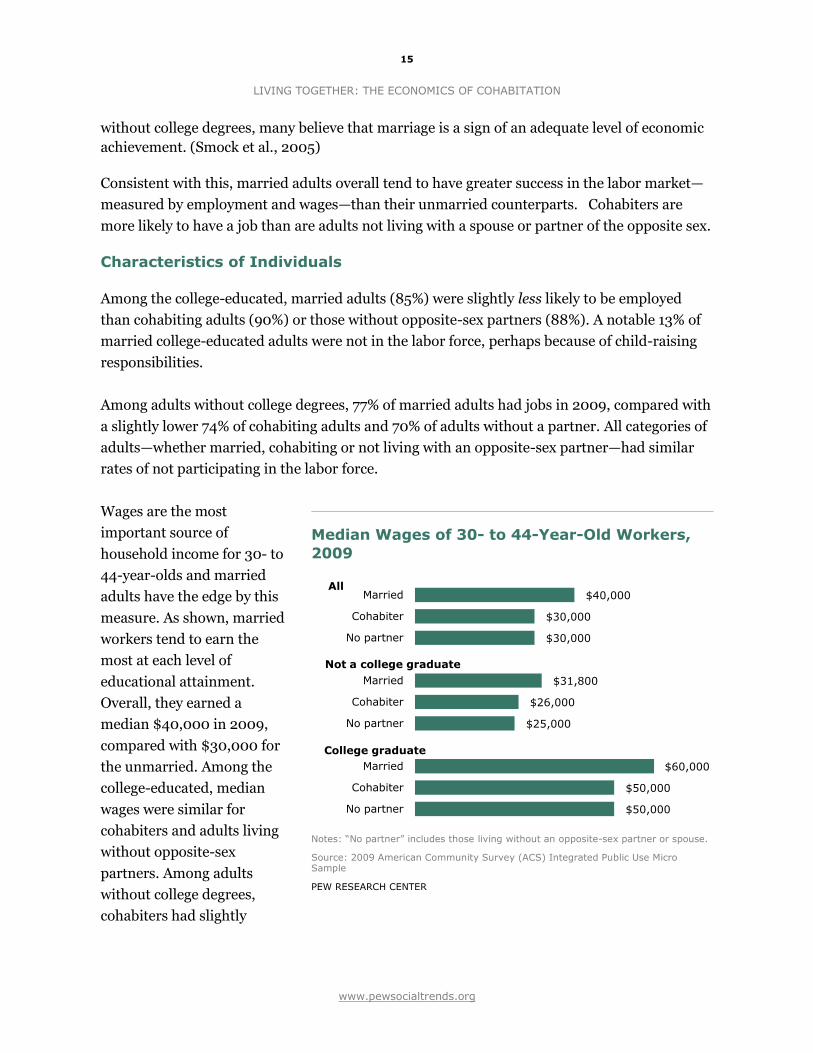
Wages are the most
important source of
household income for 30- to
44-year-olds and married
adults have the edge by this
measure. As shown, married
workers tend to earn the
most at each level of
educational attainment.
Overall, they earned a
median $40,000 in 2009,
compared with $30,000 for
the unmarried. Among the
college-educated, median
wages were similar for
cohabiters and adults living
without opposite-sex
partners. Among adults
without college degrees,
cohabiters had slightly
Median Wages of 30- to 44-Year-Old Workers,
2009
Notes: “No partner” includes those living without an opposite-sex partner or spouse.
Source: 2009 American Community Survey (ACS) Integrated Public Use Micro Sample
PEW RESEARCH CENTER
16
LIVING TOGETHER: THE ECONOMICS OF COHABITATION
www.pewsocialtrends.org
78
67
55
59
Cohabiter
Married
Cohabiter
Married
Not a college graduate
College graduate
higher median wages than adults living without opposite-sex partners.
The reason for the wage disparity between married and unmarried adults is the subject of a
large body of research. In part, the higher pay of married people reflects the reality that adults
want to marry others who are economically successful, and the economically successful are
more likely to marry. But being married may also have causal impacts on earnings in that
marriage may make people, particularly men, more productive (Nock, 2005).
As shown, among adults ages 30 to 44, the greater employment rate of college-educated
cohabiters helps offset their lower earnings relative to the earnings of married adults. In the
instance of cohabiters without college degrees, they are less likely to be employed, and when
they are, they tend to be paid less than married adults without college degrees.
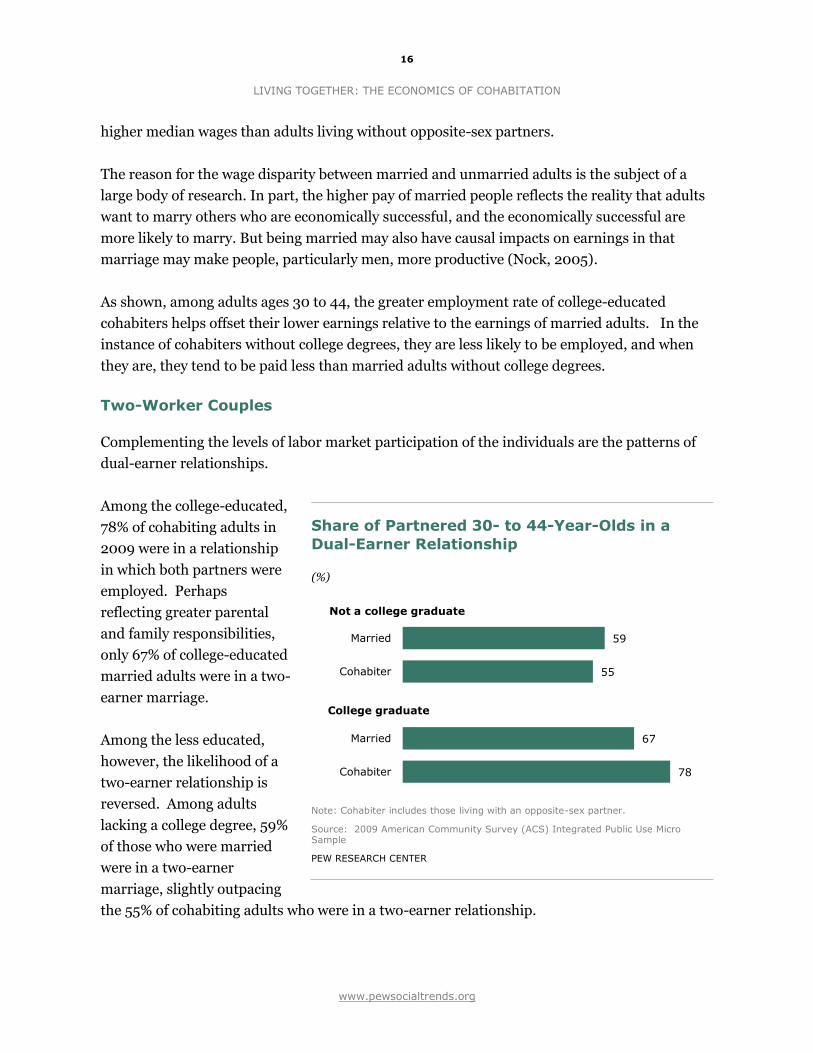
Two-Worker Couples
Complementing the levels of labor market participation of the individuals are the patterns of
dual-earner relationships.
Among the college-educated,
78% of cohabiting adults in
2009 were in a relationship
in which both partners were
employed. Perhaps
reflecting greater parental
and family responsibilities,
only 67% of college-educated
married adults were in a two-
earner marriage.
Among the less educated,
however, the likelihood of a
two-earner relationship is
reversed. Among adults
lacking a college degree, 59%
of those who were married
were in a two-earner
marriage, slightly outpacing
the 55% of cohabiting adults who were in a two-earner relationship.
Share of Partnered 30- to 44-Year-Olds in a
Dual-Earner Relationship
(%)
Note: Cohabiter includes those living with an opposite-sex partner.
Source: 2009 American Community Survey (ACS) Integrated Public Use Micro Sample
PEW RESEARCH CENTER

17
LIVING TOGETHER: THE ECONOMICS OF COHABITATION
www.pewsocialtrends.org
Another notable pattern is that married adults were more likely than cohabiting adults to have
a large difference between their earnings and their partners’ earnings. Among college-educated
married adults, most—62%—had earnings differences of more than $30,000 with their
partner, compared with 47% of comparable cohabiting adults. For adults without college
degrees, the share of married adults with similarly large income differences was 41% and the
share of cohabiting adults was 25%.
In some cases, this could indicate that one spouse has pulled back from the job market,
perhaps to devote time to child care. This helps counter the wage advantage for married adults
compared with cohabiters.

18
LIVING TOGETHER: THE ECONOMICS OF COHABITATION
www.pewsocialtrends.org
IV. THE HOUSEHOLDS AND DEMOGRAPHICS OF 30- TO 44-
YEAR-OLDS
The economic well-being of adults ages 30 to 44 is influenced not just by their own labor
market characteristics and those of any partners, but also by the nature of their households.
The measure of economic well-being used in this analysis already takes account of differences
in the size of the household, but the makeup of the household matters as well. The presence of
children and other family members has important consequences for the amount of effort
adults devote to the labor market and the number of earners in the household.
Married adults of all education levels are the most likely to have one or more children in the
household. In 2009 married adults were about equally likely to have one or more children in
the household, whether the adults were college-educated (81%) or not (85%).
There are sharp differences by educational attainment, however, in the share of cohabiting
couples with children in the household. Only a third of college-educated cohabiters live with at
least one child, compared with two-thirds of less-educated cohabiting adults.
Household Characteristics of 30- to 44-Year-Olds, by Education and
Partnership Status, 2009
Not a college graduate College graduate
Married Cohabiter No Partner Married Cohabiter No Partner
Previously married 21% 43% 45% 11% 32% 34%
Living in household with child(ren)
85% 67% 35% 81% 33% 20%
Living alone 0 0 20% 0 0 44%
Mean family size 4.1 1.8 2.7 3.7 1.4 1.9
Mean number of own children
1.9 0.7 0.7 1.7 0.3 0.3
Mean number of other family members (excluding children)
1.2 0.1 1.0 1.1 0.0 0.5
Living with parent(s) 3% 1% 27% 2% 1% 17%
Note: “No partner” includes those living without an opposite-sex partner or spouse.
Source: 2009 American Community Survey (ACS) Integrated Public Use Micro Sample
PEW RESEARCH CENTER

19
LIVING TOGETHER: THE ECONOMICS OF COHABITATION
www.pewsocialtrends.org
Cohabiters without college degrees are more likely to live with one or more children for at least
two reasons. First, they are more likely than college-educated cohabiters to have been married
in the past. Among cohabiters without college degrees, 43% had been married in the past;
among those with college degrees, 32% had been.
Second, there are notable differences in the child-bearing patterns of college-educated and less
educated women. Less-educated women tend to bear children at younger ages, are more likely
to have children while unmarried and are less likely to end their child-bearing years without
having had children.
For example, among 30- to 44-year-old women who gave birth in the past year, fewer than
one-in-ten of college-educated women was unmarried, according to data from the 2008
American Community Survey. The shares were notably higher—ranging from 21% to 34%—for
women with some college education, a high school diploma or no high school diploma. Births
to unmarried women include births to women who are cohabiting; they accounted for 2.2% of
births to college-educated women ages 30 to 44 and 6% to 7% of births to women in that age
group without college degrees (Dye, 2010).
The presence of children in a household tends to have large economic ramifications. The table
below reports the median adjusted household income of adults not residing with a child in the
household versus residing in a household in which the adult is either a parent or the partner of
a parent. Regardless of education or partnership status, adults living with children are much
less well-off than comparably educated adults who are not living with children. For example,
consider college-educated cohabiting adults. Those with no children in the household have a
median adjusted household income of $120,637. If one or both of the partners is a parent of a
child in the household, their median adjusted household income is $78,808, about 35% lower
than for a similar adult who is neither a parent nor the partner of a parent in the household.

20
LIVING TOGETHER: THE ECONOMICS OF COHABITATION
www.pewsocialtrends.org
The presence of children detracts from economic well-being because children require time and
care; they likely lead to a reduction in hours devoted to paid work on the part of the parent or
the partner of the parent. They also increase household size, but the measure of median
adjusted household income accounts for differences in household size.
Thus, a basic reason that cohabitation seems to economically benefit college-educated adults
but yields much lower economic dividends for less-educated adults is due to household
composition. Among the college-educated, cohabitation is much less likely to involve living
with children, and, perhaps as a result, these cohabiters are likely to be members of dual-
earner couples. Cohabitation among the less-educated two-thirds of the time involves
parenthood on the part of at least one of the cohabiters, and children tend to reduce measured
economic well-being.
Another important household composition difference involves the household members of
adults not living with a spouse or partner. Again, the nature of the household varies along
educational lines. Among college-educated adults without a spouse or partner, 44% live alone.
Economic Outcomes of 30- to 44-Year-Olds, by Education and Partnership
Status and Presence of Children, 2009
Not a college graduate College graduate
Married Cohabiter No
Partner Married Cohabiter No
Partner
Household without Children
Median adjusted household income
$77,526 $65,891 $55,426 $133,600 $120,637 $100,466
Poverty rate 5% 23% 16% 1% 7% 6%
Median wages as share of household income
43% 44% 36% 50% 50% 88%
Household with Children
Median adjusted household income
$54,000 $39,751 $29,639 $95,263 $78,808 $60,000
Poverty rate 10% 35% 33% 2% 12% 10%
Median wages as share of household income
40% 41% 64% 49% 51% 90%
Notes: Adjusted household income controls for household size. “No partner” includes those living without an opposite-sex partner or spouse.
Source: 2009 American Community Survey (ACS) Integrated Public Use Micro Sample
PEW RESEARCH CENTER

21
LIVING TOGETHER: THE ECONOMICS OF COHABITATION
www.pewsocialtrends.org
The typical college-educated adult without a spouse or partner earns most of the household
income—88% in the typical household, as shown in the table on page 11.
By contrast, only 20% of less-educated adults lacking a spouse or partner live alone. Less-
educated adults lacking a spouse or partner tend to live in bigger families (2.7 family members
versus 1.9 family members), a difference only partly explained by their larger average number
of children (0.7 children versus 0.3 children). Less-educated adults without a spouse or
partner are more likely to live with at least one of their parents. In part because they often live
with other adult family members, less-educated adults without a spouse or partner are not the
only source of household income. The typical less-educated adult with no spouse or partner
earns only 43% of the household income, half the share earned by the typical college-educated
adult with no spouse or partner.
Given that less-educated adults without a spouse or partner often reside with other adult
family members, cohabitation offers less of a potential economic windfall to them. By moving
in with a partner, they may have the benefit of that partner’s income. But by moving out of a
household with other family members, they lose the economic resources those other family
members contribute. Cohabitation does not necessarily produce net additional earners for the
households of less educated adults as it does for college-educated adults without a spouse or
partner.
22
LIVING TOGETHER: THE ECONOMICS OF COHABITATION
www.pewsocialtrends.org
REFERENCES
Casper, Lynne M., and Philip N. Cohen. 2000. ―How Does POSSLQ Measure Up? Historical
Estimates of Cohabitation,‖ Demography, vol. 37, no. 2, May.
Dye, Jane Lawler. 2010. Fertility of American Women: 2008. November. Current Population
Report P20-563. Washington, DC: U.S. Census Bureau.
Goodwin, P.Y., W.D. Mosher, and A. Chandra. 2010. ―Marriage and Cohabitation in the United
States: A Statistical Portrait Based on Cycle 6 (2002) of the National Survey of Family
Growth.‖ February. Vital and Health Statistics, vol. 23, no. 28. Hyattsville, MD:
National Center for Health Statistics.
Fry, Richard, and D’Vera Cohn. 2010. Women, Men and the New Economics of Marriage.
January. Washington, DC: Pew Research Center.
Garner, Thesia, Javier Ruiz-Castillo, and Mercedes Sastre. 2003. ―The Influence of
Demographics and Household-Specific Price Indices on Consumption-Based Inequality
and Welfare: A Comparison of Spain and the United States,‖ Southern Economic
Journal, vol. 70, no. 1: 22-48.
Hamplova, Dana, and Celine Le Bourdais. 2009. ―One pot or two pot strategies? Income
pooling in married and unmarried households in comparative perspective,‖ Journal of
Comparative Family Studies, vol. 40, June.
Kennedy, Sheela, and Larry Bumpass. 2008. ―Cohabitation and Children’s Living
Arrangements: New Estimates from the United States,‖ Demographic Research, vol.
19, no. 47, September.
Kenney, Catherine T. 2006. ―The Power of the Purse: Allocative Systems and Inequality in
Couple Households,‖ Gender and Society, vol. 20, no. 3, June.
Kreider, Rose M. 2010. Increase in Opposite-sex Cohabiting Couples from 2009 to 2010 in the
Annual Social and Economic Supplement (ASEC) to the Current Population Survey.
September. Housing and Household Economic Statistics Division Working Paper.
Washington, DC: U.S. Census Bureau.

23
LIVING TOGETHER: THE ECONOMICS OF COHABITATION
www.pewsocialtrends.org
National Center for Family & Marriage Research. 2010. Trends in Cohabitation: Twenty Years
of Change, 1987-2008. October. NCFMR FP-10-07.
Nock, Steven L. 2005. ―Marriage as a Public Issue,‖ The Future of Children, vol. 15, no. 2, Fall.
Short, Kathleen, Thesia Garner, David Johnson, and Patricia Doyle. Experimental Poverty
Measures: 1990 to 1997, U.S. Census Bureau, Current Population Reports, Consumer
Income, P60-205, Washington, DC: U.S. Government Printing Office (1999).
Simmons, Tavia, and Martin O’Connell. 2003. Married-Couple and Unmarried-Partner
Households: 2000. U.S. Census Bureau, Census 2000 Special Report CENSR-5.
Smock, Pamela J., Wendy D. Manning and Meredith Porter. 2005. ―Everything’s There Except
Money‖: How Money Shapes Decisions to Marry Among Cohabitors,‖ Journal of
Marriage and Family, vol. 67, August.
Thomas, Adam, and Isabel Sawhill. 2005. ―For Love and Money? The Impact of Family
Structure on Family Income,‖ The Future of Children, vol. 15, no. 2, Fall.

24
LIVING TOGETHER: THE ECONOMICS OF COHABITATION
www.pewsocialtrends.org
APPENDIX 1: TABLES
Economic Outcomes of 30- to 44-Year-Olds,
by Partnership Status, 2009
Married Cohabiter No Partner
Median household income $79,800 $56,200 $47,800
Median adjusted household income $70,711 $54,179 $54,000
Poverty rate 7% 27% 18%
Notes: Adjusted household incomes controls for household size. “No partner” includes those living without an opposite-sex partner or spouse.
Source: 2009 American Community Survey (ACS) Integrated Public Use Micro Sample
PEW RESEARCH CENTER
Select Characteristics of 30- to 44-Year-Olds, by Partnership Status, 2009
Opposite- Sex
Cohabiter
Same-Sex Cohabiter
Married All Male Female No Partner
Median adjusted household income
$70,711 $54,179 $99,204 $115,000 $86,957 $53,399
Poverty rate 7% 27% 16% 14% 17% 18%
Living in household with child(ren)
83% 60% 31% 17% 45% 32%
College graduate 37% 19% 48% 47% 49% 25%
Notes: Adjusted household income controls for household size. “Married” includes only male-female couples.
Source: 2009 American Community Survey (ACS) Integrated Public Use Micro Sample
PEW RESEARCH CENTER
25
LIVING TOGETHER: THE ECONOMICS OF COHABITATION
www.pewsocialtrends.org
APPENDIX 2: DATA SOURCES
The detailed snapshot of adults ages 30-44 by their partnership status utilizes the U.S. Census
Bureau’s 2009 American Community Survey (ACS). The ACS is a 1% sample of all U.S.
households and features a very large sample of the population. The University of Minnesota
Population Center’s Integrated Public Use Microsample (IPUMS) version of the 2009 ACS was
analyzed (documentation available at http://usa.ipums.org/usa/index.shtml ). The ACS does
not have a direct question as to whether a respondent has an unmarried partner. Cohabiting
adults must instead be identified on the basis of a respondent’s relationship to the household
head. A respondent may identify as the ―unmarried partner of the head.‖ In the ACS one can
thus identify ―unmarried partners of the head‖ and their corresponding cohabiting household
heads. Some cohabiting adults are thus not identifiable in the ACS. One of the cohabiters
must be the head of the household in order to be properly assigned ―cohabitation status.‖ As
discussed below, other Census Bureau data reveal that about 80% of cohabiting adults are
either the unmarried partner of the head or a cohabiting head of the household.
A primary purpose of this analysis is to compare the economic well-being of cohabiting adults
ages 30-44 with their married counterparts. In this data source, marriage applies only to
spouses of the opposite sex and to have a straightforward comparison of married to cohabiting
persons, ―cohabitation‖ is defined herein as opposite-sex cohabitation. Although fewer than
one-in-ten adults is in an opposite-sex cohabiting relationship at a moment in time, the large
size of the ACS results in the analysis being based on 35,929 opposite-sex cohabiting 30- to-
44-year-olds.
In the ACS, income and poverty measures are available only for persons residing in
households, so this analysis excludes all others, including those residing in group quarters. It
should be noted that the poverty measure utilizes the University of Minnesota Population
Center’s Integrated Public Use Micro Sample (IPUMS) version of the 2009 American
Community Survey. Although the IPUMS poverty variable defines poverty on the basis of
detailed family income and family structure information for each adult, it is not identical to the
poverty variable on the original Census PUMS file. See http://usa.ipums.org/usa-
action/variables/POVERTY for details.
The analysis is restricted to adults at least 30 years old because many younger adults are still in
the process of completing their education. By age 30, most persons have finished their formal
education. We imposed an upper age limit of 44 because partnership status may have different
implications among older adults than adults in their family-forming years. After a certain age,
26
LIVING TOGETHER: THE ECONOMICS OF COHABITATION
www.pewsocialtrends.org
most children no longer reside with their parent(s). Although 44 is admittedly arbitrary, the
ages of 30-44 correspond to the key family-forming and child-rearing years of adulthood.
Although the analysis is restricted to 30-to-44 year-olds, this does not imply that a 30- to 44-
year-old’s spouse or cohabiting partner also must be in that age group. Many people partner
with
persons older or younger
than themselves. That the
partner need not be 30-44
explains why the partner’s
characteristics do not
always match precisely the
characteristics of partnered
30- to 44-year-olds. As an
example, 80% of married
30- to 44-year-old adults
were employed in 2009. If
the 30- to 44-year-olds
were all married to each
other, then 80% of the
spouses of 30- to 44-year-
olds would have been
employed. The actual share
is slightly different: 79% of
the spouses of married 30-
to 44-year-olds had jobs
because some of the
married 30- to 44-year-olds
have spouses outside the
30-44 age range.
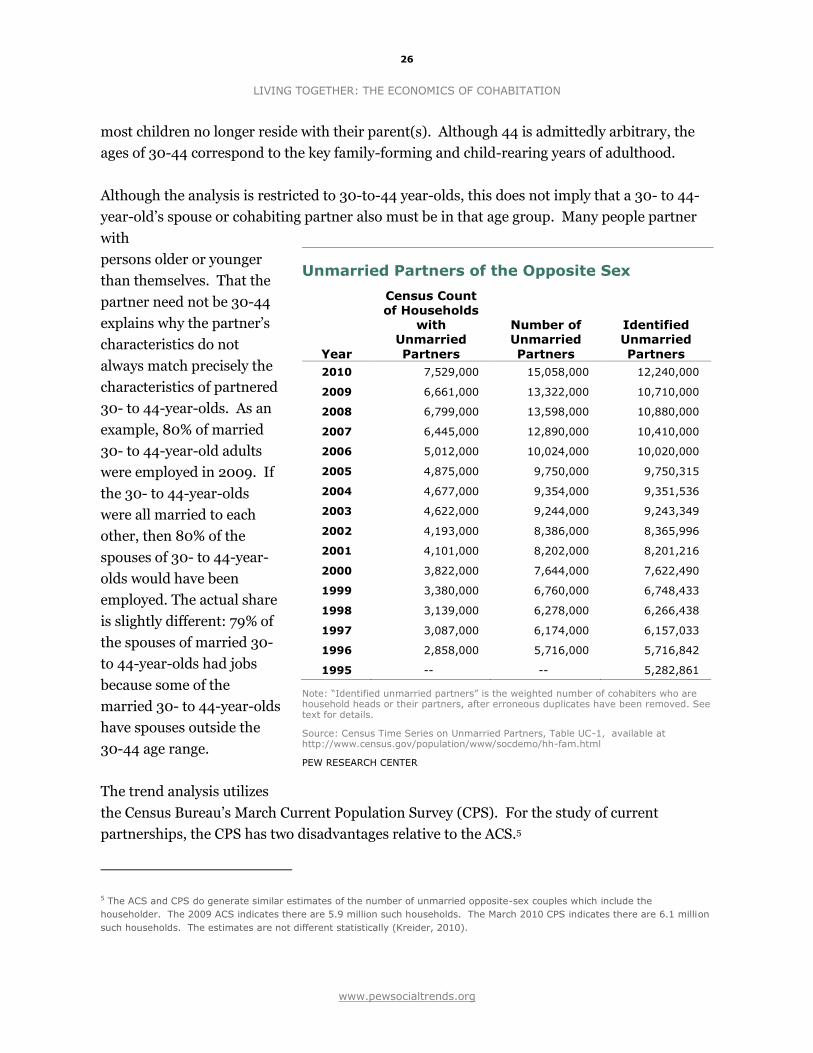
The trend analysis utilizes
the Census Bureau’s March Current Population Survey (CPS). For the study of current
partnerships, the CPS has two disadvantages relative to the ACS.5
5 The ACS and CPS do generate similar estimates of the number of unmarried opposite-sex couples which include the
householder. The 2009 ACS indicates there are 5.9 million such households. The March 2010 CPS indicates there are 6.1 million
such households. The estimates are not different statistically (Kreider, 2010).
Unmarried Partners of the Opposite Sex
Year
Census Count of Households
with Unmarried
Partners
Number of Unmarried
Partners
Identified Unmarried
Partners
2010 7,529,000 15,058,000 12,240,000
2009 6,661,000 13,322,000 10,710,000
2008 6,799,000 13,598,000 10,880,000
2007 6,445,000 12,890,000 10,410,000
2006 5,012,000 10,024,000 10,020,000
2005 4,875,000 9,750,000 9,750,315
2004 4,677,000 9,354,000 9,351,536
2003 4,622,000 9,244,000 9,243,349
2002 4,193,000 8,386,000 8,365,996
2001 4,101,000 8,202,000 8,201,216
2000 3,822,000 7,644,000 7,622,490
1999 3,380,000 6,760,000 6,748,433
1998 3,139,000 6,278,000 6,266,438
1997 3,087,000 6,174,000 6,157,033
1996 2,858,000 5,716,000 5,716,842
1995 -- -- 5,282,861
Note: “Identified unmarried partners” is the weighted number of cohabiters who are household heads or their partners, after erroneous duplicates have been removed. See text for details.
Source: Census Time Series on Unmarried Partners, Table UC-1, available at http://www.census.gov/population/www/socdemo/hh-fam.html
PEW RESEARCH CENTER

27
LIVING TOGETHER: THE ECONOMICS OF COHABITATION
www.pewsocialtrends.org
First, the CPS is a much smaller sample. For example, the March 2009 CPS has about
208,000 person records, about 1/15th the size of the 2009 ACS.
Second, the Census Bureau does not edit the CPS in the same fashion as the ACS. Until 2007,
the CPS did not have a direct question on whether a person had a partner in the household.
Beginning in 1995, an individual could identify oneself as the unmarried partner of the
household head. However, in some households in the CPS several persons identify themselves
as the unmarried partner of the head. Furthermore, in some households in which a person
claims to be the unmarried partner of the head, the head of the household reports being
married and living with a spouse. In this analysis we ignored these anomalies by identifying as
cohabiting individuals only those persons who were the unmarried partners of the head of the
household (and the head reported being unmarried); who lived in households with only one
person claiming to be the unmarried partner of the head.
The table on page 26 reports the official U.S. Census Bureau tally of the number of cohabiting
persons of all ages from the March Current Population Survey. It also reports the weighted
number of cohabiting persons using the above procedures to identify cohabiters. In every year
until 2007 we identify nearly 100% of cohabiting persons.
There is a break in the Census Bureau series at 2007. Beginning in 2007, cohabiters are
identified using a direct question on cohabitation so all cohabiting relationships are identified,
not just those involving the head of the household. Comparing our estimates in column 4 with
the census count in column 3 reveals that cohabiting relationships involving the head of the
household account for about 80% of all cohabiters. The analysis in the text uses the consistent
time series reported in column 4 so that we have a consistent set of cohabiting persons across
the years.
Tabulations from the March 2010 CPS indicate that the qualitative conclusions on economic
well-being and cohabitation are robust to the manner in which cohabiters are identified. The
first row of the table below identifies cohabiting persons on the basis of the more narrow
unmarried partner of the household head. Cohabiters not involving the household head are
enumerated with persons not residing with a spouse or partner. This mimics the identification
procedure utilized for the American Community Survey, and college-educated cohabiters have
a higher median adjusted household income than their married counterparts. The second row
uses the more inclusive direct CPS question on cohabitation, and cohabiters in relationships
not involving the household head are tallied as cohabiters rather than persons not residing
with a spouse or partner. Cohabiters in relationships not involving the household head in
2010 tended to have lower adjusted household income than cohabiters involving the
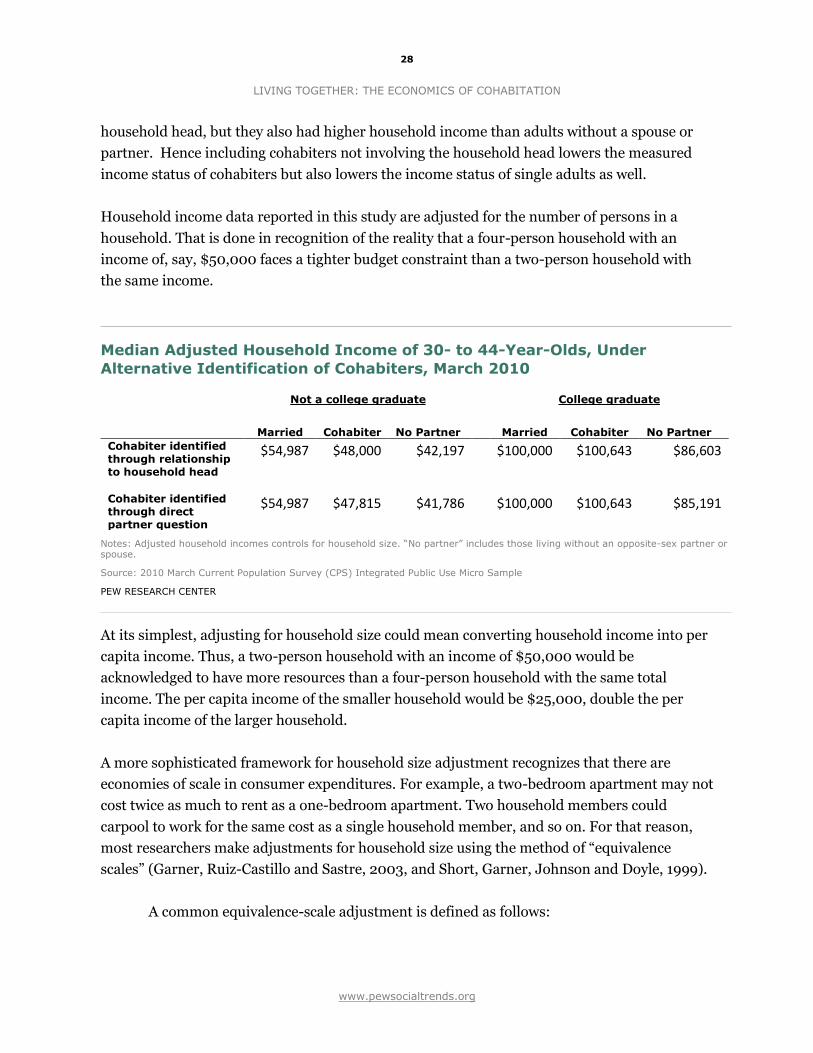
28
LIVING TOGETHER: THE ECONOMICS OF COHABITATION
www.pewsocialtrends.org
household head, but they also had higher household income than adults without a spouse or
partner. Hence including cohabiters not involving the household head lowers the measured
income status of cohabiters but also lowers the income status of single adults as well.
Household income data reported in this study are adjusted for the number of persons in a
household. That is done in recognition of the reality that a four-person household with an
income of, say, $50,000 faces a tighter budget constraint than a two-person household with
the same income.
At its simplest, adjusting for household size could mean converting household income into per
capita income. Thus, a two-person household with an income of $50,000 would be
acknowledged to have more resources than a four-person household with the same total
income. The per capita income of the smaller household would be $25,000, double the per
capita income of the larger household.
A more sophisticated framework for household size adjustment recognizes that there are
economies of scale in consumer expenditures. For example, a two-bedroom apartment may not
cost twice as much to rent as a one-bedroom apartment. Two household members could
carpool to work for the same cost as a single household member, and so on. For that reason,
most researchers make adjustments for household size using the method of ―equivalence
scales‖ (Garner, Ruiz-Castillo and Sastre, 2003, and Short, Garner, Johnson and Doyle, 1999).
A common equivalence-scale adjustment is defined as follows:
Median Adjusted Household Income of 30- to 44-Year-Olds, Under
Alternative Identification of Cohabiters, March 2010
Not a college graduate College graduate
Married Cohabiter No Partner Married Cohabiter No Partner
Cohabiter identified through relationship to household head
$54,987 $48,000 $42,197 $100,000 $100,643 $86,603
Cohabiter identified through direct partner question
$54,987 $47,815 $41,786 $100,000 $100,643 $85,191
Notes: Adjusted household incomes controls for household size. “No partner” includes those living without an opposite-sex partner or spouse.
Source: 2010 March Current Population Survey (CPS) Integrated Public Use Micro Sample
PEW RESEARCH CENTER

29
LIVING TOGETHER: THE ECONOMICS OF COHABITATION
www.pewsocialtrends.org
Adjusted household income = Household income / (Household size)0.5
By this method, we are effectively assuming that a two-person household needs 1.41 times the
income of a one-person household to be as equally well-off. Similarly, a four-person
household requires twice the income of a one-person household to have equal resources.
Once household incomes have been converted to a ―uniform‖ household size, they can be
scaled to reflect any household size. The income data reported in this study are computed for
three-person households.