Chapter 9 Cortically-Coupled Computer Vision · Chapter 9 Cortically-Coupled Computer Vision Paul...
16
Chapter 9 Cortically-Coupled Computer Vision Paul Sajda, Eric Pohlmeyer, Jun Wang, Barbara Hanna, Lucas C. Parra, and Shih-Fu Chang Abstract We have developed EEG-based BCI systems which couple human vi- sion and computer vision for speeding the search of large images and image/video databases. We term these types of BCI systems “cortically-coupled computer vi- sion” (C3Vision). C3Vision exploits (1) the ability of the human visual system to get the “gist” of a scene with brief (10’s–100’s of ms) and rapid serial (10 Hz) image presentations and (2) our ability to decode from the EEG whether, based on the gist, the scene is relevant, informative and/or grabs the user’s attention. In this chapter we describe two system architectures for C3Vision that we have developed. The sys- tems are designed to leverage the relative advantages, in both speed and recognition capabilities, of human and computer, with brain signals serving as the medium of communication of the user’s intentions and cognitive state. P. Sajda ( ) · E. Pohlmeyer Department of Biomedical Engineering, Columbia University, New York, NY, USA e-mail: [email protected] E. Pohlmeyer e-mail: [email protected] J. Wang · S.-F. Chang Department of Electrical Engineering, Columbia University, New York, NY, USA J. Wang e-mail: [email protected] S.-F. Chang e-mail: [email protected] B. Hanna Neuromatters, LLC, New York, NY, USA e-mail: [email protected] L.C. Parra City College of New York, New York, NY, USA e-mail: [email protected] D.S. Tan, A. Nijholt (eds.), Brain-Computer Interfaces, Human-Computer Interaction Series, DOI 10.1007/978-1-84996-272-8_9, © Springer-Verlag London Limited 2010 133
Transcript of Chapter 9 Cortically-Coupled Computer Vision · Chapter 9 Cortically-Coupled Computer Vision Paul...
Chapter 9Cortically-Coupled Computer Vision
Paul Sajda, Eric Pohlmeyer, Jun Wang,Barbara Hanna, Lucas C. Parra,and Shih-Fu Chang
Abstract We have developed EEG-based BCI systems which couple human vi-sion and computer vision for speeding the search of large images and image/videodatabases. We term these types of BCI systems “cortically-coupled computer vi-sion” (C3Vision). C3Vision exploits (1) the ability of the human visual system toget the “gist” of a scene with brief (10’s–100’s of ms) and rapid serial (10 Hz) imagepresentations and (2) our ability to decode from the EEG whether, based on the gist,the scene is relevant, informative and/or grabs the user’s attention. In this chapterwe describe two system architectures for C3Vision that we have developed. The sys-tems are designed to leverage the relative advantages, in both speed and recognitioncapabilities, of human and computer, with brain signals serving as the medium ofcommunication of the user’s intentions and cognitive state.
P. Sajda (�) · E. PohlmeyerDepartment of Biomedical Engineering, Columbia University, New York, NY, USAe-mail: [email protected]
E. Pohlmeyere-mail: [email protected]
J. Wang · S.-F. ChangDepartment of Electrical Engineering, Columbia University, New York, NY, USA
J. Wange-mail: [email protected]
S.-F. Change-mail: [email protected]
B. HannaNeuromatters, LLC, New York, NY, USAe-mail: [email protected]
L.C. ParraCity College of New York, New York, NY, USAe-mail: [email protected]
D.S. Tan, A. Nijholt (eds.), Brain-Computer Interfaces,Human-Computer Interaction Series,DOI 10.1007/978-1-84996-272-8_9, © Springer-Verlag London Limited 2010
133
134 P. Sajda et al.
9.1 Introduction
Today we are faced with more information on a daily basis than ever before. Con-stantly evolving digital recording devices that can capture large amounts of spatialand/or temporal data, ever increasing digital storage capacities and multitudes ofmultimedia applications are just a few factors that create this “information tsunami”.Searching for something of interest, making rapid decisions and being attentive torelevant information are becoming increasingly complex tasks.
Various technologies, driven by diverse fields of research, have been developedto assist us in consuming information. Yet the fact is that the human capacity to an-alyze information and make inferences about our surrounding environment remainsunsurpassed. For example, our ability to recognize objects is extraordinarily robust,and with trillions of neuronal connections, our brain can react extremely fast to anexternal stimulus: we respond to the information we receive in the “blink of an eye”(Gladwell 2005), before we are even aware of it.
Recently we, as well as others, have been investigating the application of braincomputer interfaces (BCI) for dealing with issues in image search, retrieval andtriage (Gerson et al. 2006; Parra et al. 2008; Kapoor et al. 2008; Bigdely-Shamlo etal. 2008). Our group has developed an approach which we term cortically coupledcomputer vision (C3Vision) where the goal is to synergistically couple computervision with human vision, via on-line real-time decoding of EEG while users’ viewimages as a rapid serial visual presentation (RSVP) (Gerson et al. 2006). As wellas being a method for maximizing throughput, the use of RSVP is motivated by ourability to make very rapid and accurate decisions. The ability of the human visualsystem to do this has sometimes been characterized as getting the “gist” of a scene(Oliva 2005) in a few hundred milliseconds. The C3Vision approach exploits ourability to decode EEG signals that are related to detection and recognition in rapidlyshown images (Thorpe et al. 1996; Keysers et al. 2001; Gerson et al. 2006). One ofthe key signals we exploit in our system is the P300. The P300 is an evoked responsein the EEG which reflects perceptual “orienting” or shift of attention which can bedriven by the content of the sensory input stream (Linden 2005).
In this chapter we review our work in C3Vision, focusing on two architectures wehave developed. The first architecture is tailored to a visual search problem, wherea user must find targets in an extremely large image (on the order of 30 K × 30 Kpixels). For this case computer vision serves as a pre-processor to select potentialareas of interest, creating chips (or regions of interest—ROIs) of these areas whichare subsequently presented to the user via RSVP while the user’s EEG is decodedto generate an “interest score” used to rank or prioritize the ROIs (see Fig. 9.1A).Given this first step “triage”, the user can proceed to search the large image withthe added capability of jumping to locations in the scene which grabbed his/her’sattention during the RSVP EEG decoding phase. In Section 9.3 we describe thissystem and demonstrate results for remote sensing.
The second architecture, presented in Section 9.4, addresses an image retrievalapplication, using EEG decoded during RSVP presentation to generate an interest
9 Cortically-Coupled Computer Vision 135
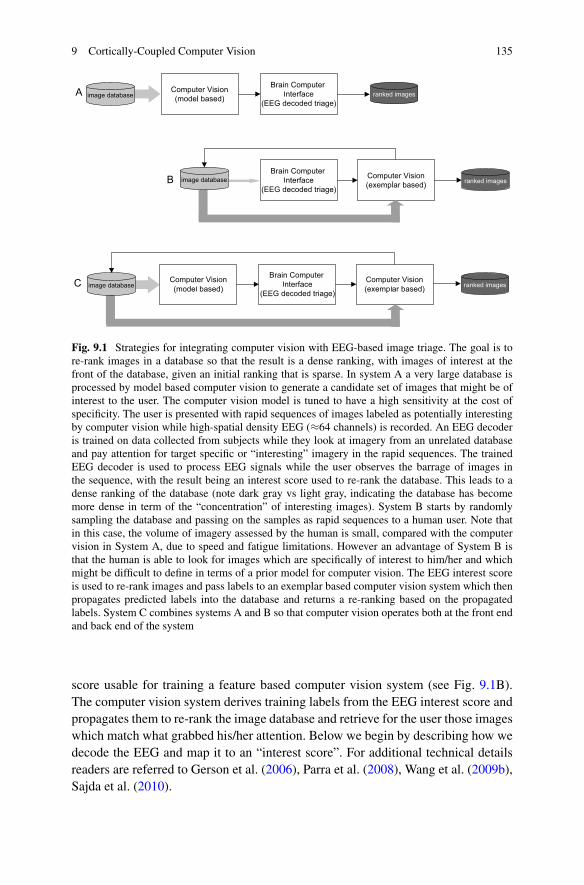
Fig. 9.1 Strategies for integrating computer vision with EEG-based image triage. The goal is tore-rank images in a database so that the result is a dense ranking, with images of interest at thefront of the database, given an initial ranking that is sparse. In system A a very large database isprocessed by model based computer vision to generate a candidate set of images that might be ofinterest to the user. The computer vision model is tuned to have a high sensitivity at the cost ofspecificity. The user is presented with rapid sequences of images labeled as potentially interestingby computer vision while high-spatial density EEG (≈64 channels) is recorded. An EEG decoderis trained on data collected from subjects while they look at imagery from an unrelated databaseand pay attention for target specific or “interesting” imagery in the rapid sequences. The trainedEEG decoder is used to process EEG signals while the user observes the barrage of images inthe sequence, with the result being an interest score used to re-rank the database. This leads to adense ranking of the database (note dark gray vs light gray, indicating the database has becomemore dense in term of the “concentration” of interesting images). System B starts by randomlysampling the database and passing on the samples as rapid sequences to a human user. Note thatin this case, the volume of imagery assessed by the human is small, compared with the computervision in System A, due to speed and fatigue limitations. However an advantage of System B isthat the human is able to look for images which are specifically of interest to him/her and whichmight be difficult to define in terms of a prior model for computer vision. The EEG interest scoreis used to re-rank images and pass labels to an exemplar based computer vision system which thenpropagates predicted labels into the database and returns a re-ranking based on the propagatedlabels. System C combines systems A and B so that computer vision operates both at the front endand back end of the system
score usable for training a feature based computer vision system (see Fig. 9.1B).The computer vision system derives training labels from the EEG interest score andpropagates them to re-rank the image database and retrieve for the user those imageswhich match what grabbed his/her attention. Below we begin by describing how wedecode the EEG and map it to an “interest score”. For additional technical detailsreaders are referred to Gerson et al. (2006), Parra et al. (2008), Wang et al. (2009b),Sajda et al. (2010).
136 P. Sajda et al.
9.2 The EEG Interest Score
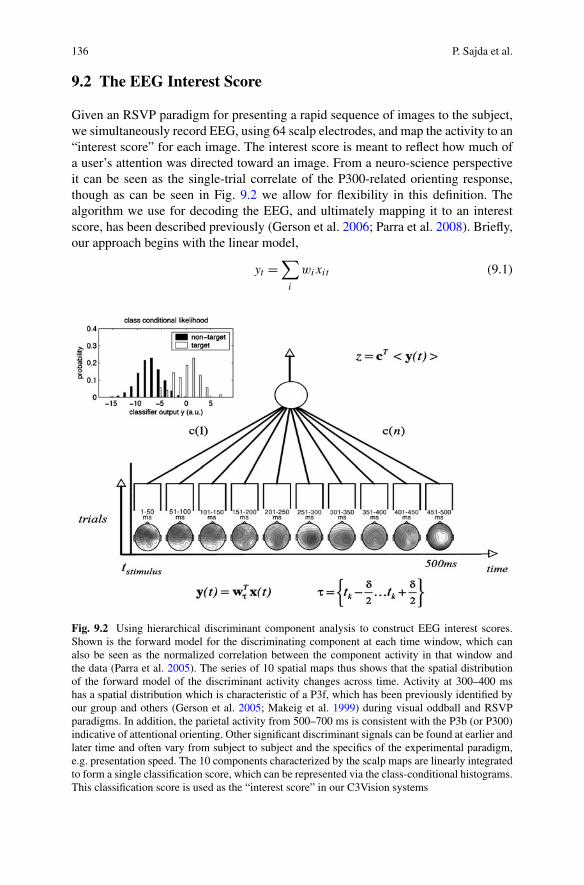
Given an RSVP paradigm for presenting a rapid sequence of images to the subject,we simultaneously record EEG, using 64 scalp electrodes, and map the activity to an“interest score” for each image. The interest score is meant to reflect how much ofa user’s attention was directed toward an image. From a neuro-science perspectiveit can be seen as the single-trial correlate of the P300-related orienting response,though as can be seen in Fig. 9.2 we allow for flexibility in this definition. Thealgorithm we use for decoding the EEG, and ultimately mapping it to an interestscore, has been described previously (Gerson et al. 2006; Parra et al. 2008). Briefly,our approach begins with the linear model,
yt =∑
i
wixit (9.1)
Fig. 9.2 Using hierarchical discriminant component analysis to construct EEG interest scores.Shown is the forward model for the discriminating component at each time window, which canalso be seen as the normalized correlation between the component activity in that window andthe data (Parra et al. 2005). The series of 10 spatial maps thus shows that the spatial distributionof the forward model of the discriminant activity changes across time. Activity at 300–400 mshas a spatial distribution which is characteristic of a P3f, which has been previously identified byour group and others (Gerson et al. 2005; Makeig et al. 1999) during visual oddball and RSVPparadigms. In addition, the parietal activity from 500–700 ms is consistent with the P3b (or P300)indicative of attentional orienting. Other significant discriminant signals can be found at earlier andlater time and often vary from subject to subject and the specifics of the experimental paradigm,e.g. presentation speed. The 10 components characterized by the scalp maps are linearly integratedto form a single classification score, which can be represented via the class-conditional histograms.This classification score is used as the “interest score” in our C3Vision systems
9 Cortically-Coupled Computer Vision 137
where xit represents the electrical potential measured at time t for electrode i on thescalp surface, while wi represents the spatial weights which will be learned basedon a set of training data. The goal is to combine voltages in the electrodes linearlysuch that the sum y is maximally different between two conditions—e.g. “target ofinterest” vs “distractor”. We also assume that this maximally discriminant activityis not constant but changes its spatial distribution within the second that follows thepresentation of an image—i.e. we assume a stationarity time T of approximately100 ms. Thus we find distinct optimal weight vectors, wki for each 100 ms windowfollowing the presentation of the image (index k labels the time window):
ykt =∑
i
wkixit , t = T ,2T , . . . , (k − 1)T , kT . (9.2)
These different ykt are then combined in an average over time to provide theoptimal discriminant activity over the entire second of data, with the result beingour “interest score”, yIS for the image
yIS =∑
t
∑
k
vkytk. (9.3)
For on-line implementation purposes we use the method of Fisher Linear Dis-criminants to train coefficients wik within each time window of time. The coeffi-cients vk are learned using penalized logistic regression after all exemplars havebeen observed. Because of the two step process of first combining activity in space,and then again in time, we have termed this algorithm “Hierarchical DiscriminantComponent Analysis”. Figure 9.2 plots the spatial filters that are learned for eachtime window and shows the subsequent hierarchical integration which enables us toconstruct interest scores, based on the classifier output. Note in the figure that thescores distribute as a function of whether the image was a target of interest or not.
9.3 C3Vision for Remote Sensing
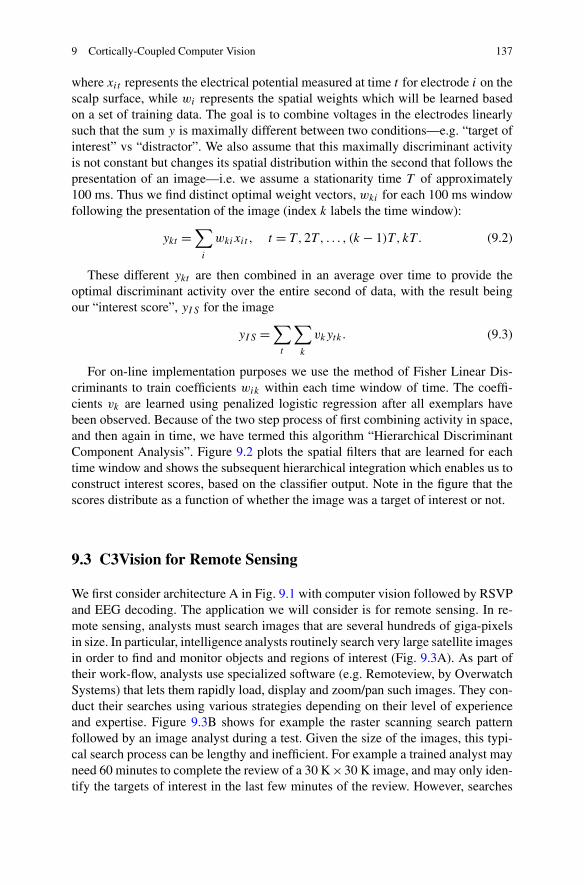
We first consider architecture A in Fig. 9.1 with computer vision followed by RSVPand EEG decoding. The application we will consider is for remote sensing. In re-mote sensing, analysts must search images that are several hundreds of giga-pixelsin size. In particular, intelligence analysts routinely search very large satellite imagesin order to find and monitor objects and regions of interest (Fig. 9.3A). As part oftheir work-flow, analysts use specialized software (e.g. Remoteview, by OverwatchSystems) that lets them rapidly load, display and zoom/pan such images. They con-duct their searches using various strategies depending on their level of experienceand expertise. Figure 9.3B shows for example the raster scanning search patternfollowed by an image analyst during a test. Given the size of the images, this typi-cal search process can be lengthy and inefficient. For example a trained analyst mayneed 60 minutes to complete the review of a 30 K×30 K image, and may only iden-tify the targets of interest in the last few minutes of the review. However, searches
138 P. Sajda et al.
Fig. 9.3 A. Satellite image to be searched. B. Traditional search approach shows a smooth andcontinuous path. C. Search in which areas are prioritized by EEG triage. Shaded areas in B & Crepresent regions analyzed by the analyst
could be significantly enhanced and accelerated with means to prioritize the search,and help analysts focus their attention on regions with high target probability.
Leveraging the high sensitivity of computer vision with the high specificity ofhuman visual recognition, we have developed a C3Vision Remote Sensing System,based on the architecture of Fig. 9.1A. In this system potential target regions areautomatically identified by computer vision and image chips centered on potentialtargets are generated and then presented as RSVP to the user. Centering the imagechips on potential targets improves the detection performance during the triage, astargets are better foveated when presented to the analysts at a rapid pace. The EEGscores computed during the RSVP are used to prioritize which regions of the imageshould be searched first, leading to search patterns like those shown in Fig. 9.3C.
Using C3Vision in this way improves on the analysts’ typical work-flow by of-fering a first pass in which they can very rapidly review thousands of image chipsextracted from the large satellite image and identify those that will be of most in-terest to them, as shown in Fig. 9.4. They can then move to a more in-depth secondpass during which they can review high priority areas first, thus accelerating andmanaging their search more efficiently.
This architecture combines three major components: 1. computer vision basedautomated region selection and target detection; 2. real-time recording and decodingof EEG signals and 3. the interface used to exploit the prioritized image analysts.

9 Cortically-Coupled Computer Vision 139
Fig. 9.4 Analyst work-flow with the C3Vision architecture. Potential target regions are automat-ically identified, and image chips constructed with potential targets centered on those regions.Image chips are triaged using rapid image presentation and classification of neural activity. Theresults are then reviewed by order of priority in existing specialized software with the help of adedicated visualization interface
While there is a vast body of computer vision research on object/region detec-tion, the C3Vision architecture itself is agnostic to the choice of a particular method.Such a choice is best guided by the task for which the system is used. The scenariopresented here involves targets classes that are known a priori, enabling the useof a model based approach. In particular, we have implemented and tested a frame-work that extracts low-level features specific to aerial object classes. The frameworkthen infers object classes with a grammar-based reasoning engine that uses domainknowledge and the relationship between object features (see Sajda et al. 2010 formore details). As the image size is typically large and the target detection needsonly to be within a few pixels, target detection is only performed on a subsample ofimage pixels, for example a uniform grid with user specified density. The detectionframework associates a confidence score with each pixel in the subsample. Imagechips are generated based on those detections with a score exceeding a predefined,task-based threshold.
140 P. Sajda et al.
The image chips are then presented to the analyst as RSVP, using a pace of 5to 10 Hz (i.e. 200–100 ms per image). While they are presented, EEG signals arerecorded using a 64 electrode EEG recording system (ActiveTwo, Biosemi, Ger-many) in a standard 10–20 montage and at a 2048 Hz sampling rate. Image chipsare presented in blocks, typically 100 image chips long. Since detection perfor-mance can degrade when target occurrences are too seldom or too frequent, eachblock is constructed to satisfy a certain target prevalence. In particular, for eachblock, a number of image chips are randomly drawn from the computer visionlist, based on expected true and false positive rates, and additional chips are drawnfrom a pool of “distractors” in order to achieve the desired block size and preva-lence.
As the EEG stream is acquired, a classifier based on the hierarchical discriminantcomponent analysis, described above, assigns an EEG interest score to each imagechip in real time. The EEG classifier is trained at the beginning of a presentationsession, with 20 to 30 blocks each containing two known but randomly placed (inthe sequence) targets. The content of the training sequences can be related to thecontent of the test sequences to better familiarize the user to the paradigm and tar-gets. However, from a neuro-physiological perspective, training is not dependent onthe choice of imagery, since the classifier is in fact tuned to P300 events. To fur-ther help users modulate their responses and obtain better training, feedback can begiven at the end of each block, for example by providing a visual indication of howthe classifier can re-order the target images within a block based on the EEG interestscores.
The list of prioritized chips is reviewed for validation via a dedicated visualiza-tion interface that interacts directly with the analysts’ dedicated software. Analystsvalidate target locations by clicking on corresponding x, y coordinates, which canthen be saved in analyst specific products such as shape files. The visualization in-terface controls the software’s viewport, forcing it to show areas centered on the x, y
coordinates of the original large image corresponding to the centers of the chips bydescending order of EEG interest. Those “jumps” can be triggered by user inputs(e.g. pressing a next button) or be automatically paced. Analysts experimenting withthe system have provided positive feedback on both approaches, reporting that thelatter helps them rapidly focus their decisions, while the former gives them greatercontrol over the review process.
The architecture has been tested in the course of four semi-operational tests, in-volving a minimum of 4 image analysts each and imagery from a variety of sen-sors: EO-gray-scale cameras, EO-color cameras and SAR. Here we show the resultsof tests where each analyst had to perform three search tasks: 1. look for POLs(Petroleum Oil Lubricant storage); 2. look for airfields in a SAR image; 3. look forbuildings in a large EO gray-scale image. For each search task, the times at whichimage analysts had clicked on a target pixel location was recorded for both baselineand image assisted searches. As a result, several metrics were computed to comparebaseline and assisted searches: area throughput at matched sensitivity, i.e. the num-ber of pixels searched per unit time while keeping the baseline and assisted numberof targets found the same, detection rate, i.e. the number of targets found over time,

9 Cortically-Coupled Computer Vision 141
Table 9.1 Throughput comparison between baseline search and C3Vision for the remote sensingapplication
Task 1(POLs—MSI)
Task 2(Airfields—SAR)
Task 3(Buildings—EO)
Avg throughput improvement 3.21 11.01 3.16
Standard deviation 0.42 3.48 0.52
Fig. 9.5 Average number of target detections as a function of time across subjects and for eachtask. Dashed lines are for baseline and solid lines are using C3Vision
and sensitivity. For each task, the system was shown to improve on the baseline areathroughput by at least 300% on average (see Table 9.1), as well as on the baselinedetection rates (see Fig. 9.5). At the same time, the overall sensitivity and numberof false positives were kept the same or moderately improved upon, highlighting thecapacity of the system to drastically accelerate search without degrading detectionperformance.
142 P. Sajda et al.
9.4 C3Vision for Image Retrieval
Due to explosive growth of visual content on the Web, such as personal photographsand video, there is an emerging need for efficient and accurate systems to rapidly an-alyze visual information. One of the ultimate goals for automated computer vision ormedia content analysis is to detect and recognize objects, scenes, people, and eventsin images or videos. A common framework used in such efforts is to learn objectmodels from a pool of training data, which may have been wholly or partly anno-tated over pre-defined object classes. Such a learning framework has been shown tobe powerful. However, it is limited in its scalability to large-scale applications. Oneof the main barriers is the dependence on the manual annotation process, which islaborious and time consuming. To overcome this, efforts have been reported usinginteractive annotation with relevance feedback and active learning in order to reducethe required manual input.
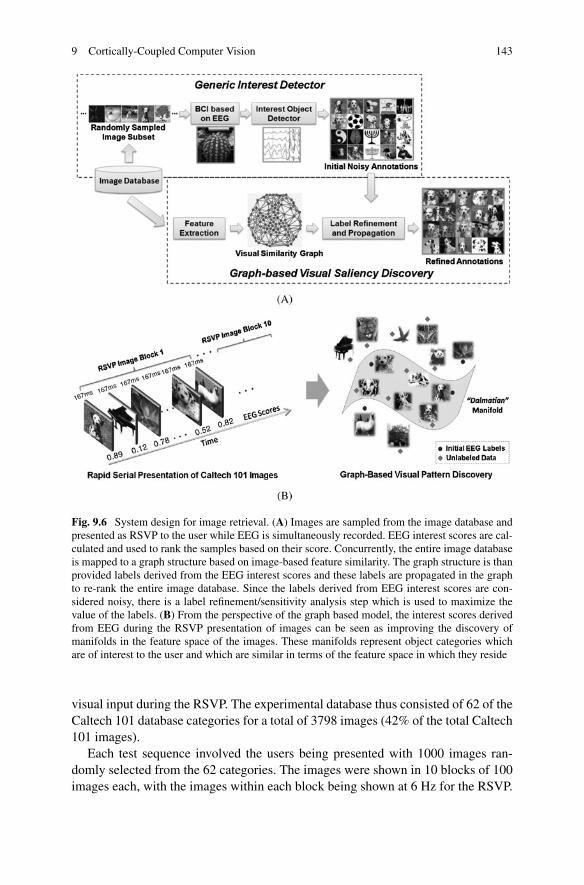
We consider a C3Vision system for image retrieval using the architecture shownin Fig. 9.1B (and more specifically in Fig. 9.6A). In this architecture, neural signalsmeasured via EEG are used to detect generic objects of interest (OOI) presentedin a series of images, while computer vision exploits the EEG labels within thecontext of a graph-based visual pattern mining algorithm. For the EEG-based OOIdetection, only a relatively small subset of images (on the order of few hundred) isfirst randomly sampled from a larger image database and presented as visual stimulito the subject. From this window into the larger image collection, the EEG interestdetector can identify a small set of highly ranked images to be used as a group of‘pseudo positive’ labels for the pattern discovery module. This module then refinesand propagates the labels throughout the entire database of images, returning a largerset of images related to those to which the subject showed the greatest interest. Inthis way, subject participation is minimized, yielding just sufficient information forthe neural state decoder and the pattern mining module to effectively infer objectsthat have attracted a users attention and generate labels for all the images in thecollection. Thus, while subjects are only required to review a small subset of thedatabase (avoiding long EEG recording sessions and fatigue), they can still obtainaccess to a large number of images that interest them.
The imagery used to test the image retrieval architecture was taken from the Cal-tech 101 database. This database is a well known set of images that are commonlyused to evaluate object detection and recognition algorithms (Fei-Fei et al. 2004).It is composed of 101 different image categories, with all the images having beentaken from the web. As the categories have large intra class variation and represent adiverse set of image types, while still only consisting of images that have been well-defined, it provides a good testbed for the image retrieval architecture. The Caltechimages do vary considerably in both resolution in scale, however. To control for anysuch fluctuations in image size impacting the subjects’ visual responses and fixationcapabilities during the RSVP, we selected a subset of categories from the Caltech101 database to serve as the experimental database. These categories all containedimages of similar scale and resolutions, and the images could easily be re-scaled toa consistent size (with negligible distortion) to provide the desired uniformity in the
9 Cortically-Coupled Computer Vision 143
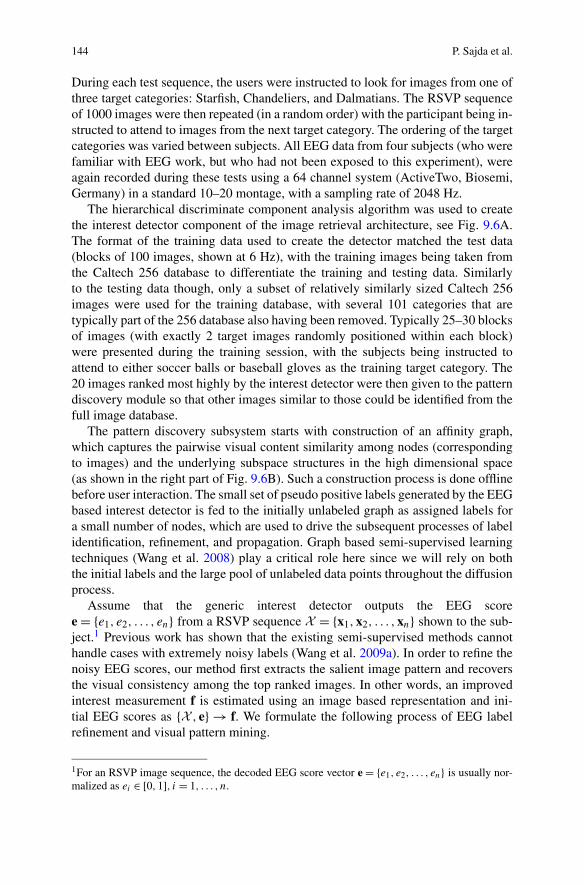
Fig. 9.6 System design for image retrieval. (A) Images are sampled from the image database andpresented as RSVP to the user while EEG is simultaneously recorded. EEG interest scores are cal-culated and used to rank the samples based on their score. Concurrently, the entire image databaseis mapped to a graph structure based on image-based feature similarity. The graph structure is thanprovided labels derived from the EEG interest scores and these labels are propagated in the graphto re-rank the entire image database. Since the labels derived from EEG interest scores are con-sidered noisy, there is a label refinement/sensitivity analysis step which is used to maximize thevalue of the labels. (B) From the perspective of the graph based model, the interest scores derivedfrom EEG during the RSVP presentation of images can be seen as improving the discovery ofmanifolds in the feature space of the images. These manifolds represent object categories whichare of interest to the user and which are similar in terms of the feature space in which they reside
visual input during the RSVP. The experimental database thus consisted of 62 of theCaltech 101 database categories for a total of 3798 images (42% of the total Caltech101 images).
Each test sequence involved the users being presented with 1000 images ran-domly selected from the 62 categories. The images were shown in 10 blocks of 100images each, with the images within each block being shown at 6 Hz for the RSVP.
144 P. Sajda et al.
During each test sequence, the users were instructed to look for images from one ofthree target categories: Starfish, Chandeliers, and Dalmatians. The RSVP sequenceof 1000 images were then repeated (in a random order) with the participant being in-structed to attend to images from the next target category. The ordering of the targetcategories was varied between subjects. All EEG data from four subjects (who werefamiliar with EEG work, but who had not been exposed to this experiment), wereagain recorded during these tests using a 64 channel system (ActiveTwo, Biosemi,Germany) in a standard 10–20 montage, with a sampling rate of 2048 Hz.
The hierarchical discriminate component analysis algorithm was used to createthe interest detector component of the image retrieval architecture, see Fig. 9.6A.The format of the training data used to create the detector matched the test data(blocks of 100 images, shown at 6 Hz), with the training images being taken fromthe Caltech 256 database to differentiate the training and testing data. Similarlyto the testing data though, only a subset of relatively similarly sized Caltech 256images were used for the training database, with several 101 categories that aretypically part of the 256 database also having been removed. Typically 25–30 blocksof images (with exactly 2 target images randomly positioned within each block)were presented during the training session, with the subjects being instructed toattend to either soccer balls or baseball gloves as the training target category. The20 images ranked most highly by the interest detector were then given to the patterndiscovery module so that other images similar to those could be identified from thefull image database.
The pattern discovery subsystem starts with construction of an affinity graph,which captures the pairwise visual content similarity among nodes (correspondingto images) and the underlying subspace structures in the high dimensional space(as shown in the right part of Fig. 9.6B). Such a construction process is done offlinebefore user interaction. The small set of pseudo positive labels generated by the EEGbased interest detector is fed to the initially unlabeled graph as assigned labels fora small number of nodes, which are used to drive the subsequent processes of labelidentification, refinement, and propagation. Graph based semi-supervised learningtechniques (Wang et al. 2008) play a critical role here since we will rely on boththe initial labels and the large pool of unlabeled data points throughout the diffusionprocess.
Assume that the generic interest detector outputs the EEG scoree = {e1, e2, . . . , en} from a RSVP sequence X = {x1,x2, . . . ,xn} shown to the sub-ject.1 Previous work has shown that the existing semi-supervised methods cannothandle cases with extremely noisy labels (Wang et al. 2009a). In order to refine thenoisy EEG scores, our method first extracts the salient image pattern and recoversthe visual consistency among the top ranked images. In other words, an improvedinterest measurement f is estimated using an image based representation and ini-tial EEG scores as {X , e} → f. We formulate the following process of EEG labelrefinement and visual pattern mining.
1For an RSVP image sequence, the decoded EEG score vector e = {e1, e2, . . . , en} is usually nor-malized as ei ∈ [0,1], i = 1, . . . , n.

9 Cortically-Coupled Computer Vision 145
1. Convert the image representation to a visual similarity graph X → G ={V,E,W }, where vertices V are the image samples X and the edges E withweights W measure the pairwise similarity of images.
2. Transfer the interest scores to pseudo EEG labels e = {e1, e2, . . . , en} → y ={y1, y2, . . . , yn}. In other words, a binarization function g(·) is applied to convertEEG scores to EEG labels as y = g(e), where yi ∈ {1,0} and yi = 1 for ei > ε,otherwise yi = 0. The value ε is called interest level for discretizing the EEGscores.2
3. Apply the bivariate regularization framework to define the following risk func-tion
Eγ (f,y) = Q(f,y) + γ VG (f) (9.4)
which imposes the tradeoff between the smoothness measurement VG (f) of func-tion f and empirical error Q(f,y). Specifically, the function smoothness is evalu-ated over the undirected graph G .
4. Alternatively minimize the above risk function with respect to f and y to finallyachieve the optimal f∗
f∗ = arg minf,y
Eγ (f,y). (9.5)
Finally, the propagated label predictions over the entire graph can be used to gen-erate annotations for every single image in the collection, or to re-rank the imagesbased on the detection scores. The top ranked results, as shown in Fig. 9.7B, are ex-pected to be more accurate (in terms of both precision and recall) than the baselineof using EEG based detection alone.
The Caltech 101 image search experiments clearly demonstrated how theC3Vision architecture was able to improve on image identification over chance oreven just using EEG detection alone (Wang et al. 2009b). The results were quanti-fied in terms of their average precision (AP), a metric commonly used in informationretrieval, and which approximates the area under the precision recall curve (Wanget al. 2009b). For example, the full system achieved 69.1% AP for one subjectsearching for Dalmatians, as compared to 33.73% when using EEG interest detec-tion alone, and 1.76% for chance. The precision recall curves for this particularcase are shown in Fig. 9.7A, with Fig. 9.7B illustrating how the density of targetimages was increased using the full architecture (bottom panel) versus simply usingthe EEG scoring (top panel). Overall, the combined EEG-pattern discovery moduleshowed significant improvement in eight of the twelve trials (4 subjects searchingfor 3 target categories), with AP’s in those cases ranging between 25–69% (mean:42.5%). By comparison, chance levels were 1.76% (Dalmatian), 2.26% (Starfish),5.11% (Chandelier/Menorah), and the average APs for the EEG detection alone was15.7%. Furthermore, even in cases where the EEG detection was below 10% AP, thelabel refinement process was still able to significantly improve the image annotationaccuracy.
2In practice, the value of ε is set dynamically to achieve a fixed-number l of EEG positive labels,i.e.
∑i yi = l.

146 P. Sajda et al.
Fig. 9.7 Results for image retrieval for the object class “Dalmatian” in the Caltech 101 database.(A) Precision-recall curves for random sampling, retrieval using the EEG interest score alone andthe results using EEG + the computer vision based transductive graph (i.e. C3Vision). Note thatthe C3Vision case results in a >5× increase in recall while maintaining a 100% precision, over theEEG score ranking alone. (B) Top 20 images for one subject, showing (a) ranking by interest scoresfrom EEG detector; (b) ranking by scores after label refinement in transductive graph. Adaptedfrom Wang et al. (2009b)
9.5 Conclusions
The C3Vision framework we describe has potentially many applications in mul-timedia search and image retrieval. However there are several technical challengesthat remain. The results we have described have investigated essentially feedforwardone-pass processing, namely there is no feedback between the computer vision sys-tem and human (or vice versa). However more recent work by our group has shownthat feedback can be used to improve the precision of retrieval, though this comes atthe cost of also changing the prevalence of objects of interest in the sample and thusthe potential magnitude of the neural target related signal (e.g. P300). More gen-erally, the issue of feedback brings up the interesting problem of co-learning. Thehuman subject, the computer vision system and the EEG decoder can all potentially
9 Cortically-Coupled Computer Vision 147
adapt in a feedback loop and we are currently investigating co-learning strategieswhich will improve convergence to high precision recall.
Our approach in developing C3Vision has been to leverage the complementarystrengths of rapid, general-purpose scene analysis by humans and the ability of com-puters to process vast amounts of information. Unique to our approach is that wecreate an interface between the two vision systems via real-time EEG-based com-munication channel. A current challenge in BCI system design is that state-of-the-art decoding enables relatively low bit rates—40–60 bits per minute—far belowwhat other communication mediums might offer. For BCI’s which focus on assist-ing those with neurological disease and disability, particularly those that look toassist people that are “locked-in”, such a low bandwidth channel is better than nochannel at all and thus can substantially improve quality of life. However if BCIsystems are going to make an impact in applications in which users are essentiallyneurologically healthy individuals, then the low bit rate channel of EEG must be ex-ploited with some ingenuity. For example, in our BCI applications, we are lookingat ways in which the bits that we can obtain via the EEG channel are very diffi-cult to measure from other channels, for example by monitoring behavior via eye-tracking and/or button/keyboard responses. Future work will continue to investigateapproaches that exploit this low bandwidth channel in ways that give us access toinformation about otherwise latent cognitive states of the user.
Acknowledgements This research was funded by DARPA (contract NBCHC080029). Theviews, opinions, and/or findings contained in this document are those of the authors and shouldnot be interpreted as representing the official views or policies, either expressed or implied, of theDefense Advanced Research Projects Agency or the Department of Defense. Aerial images areprovided by DigiGlobe.
References
Bigdely-Shamlo N, Vankov A, Ramirez RR, Makeig S (2008) Brain activity-based image classi-fication from rapid serial visual presentation. IEEE Trans Neural Syst Rehabil Eng 16(5):432–441. DOI 10.1109/TNSRE.2008.2003381
Fei-Fei L, Fergus R, Perona R (2004) Learning generative visual models from few training exam-ples: An incremental Bayesian approach tested on 101 object categories. In: IEEE CVPR 2004,Workshop on Generative-Model Based Vision
Gerson A, Parra L, Sajda P (2005) Cortical origins of response time variability during rapid dis-crimination of visual objects. Neuroimage 28(2):342–353
Gerson AD, Parra LC, Sajda P (2006) Cortically-coupled computer vision for rapid image search.IEEE Trans Neural Syst Rehabil Eng 14:174–179
Gladwell M (2005) Blink: The Power of Thinking Without Thinking. Little, Brown and Company:Time Warner Book Group, New York
Kapoor A, Shenoy P, Tan D (2008) Combining brain computer interfaces with vision for objectcategorization. In: Proc IEEE Conference on Computer Vision and Pattern Recognition CVPR2008, pp 1–8. DOI 10.1109/CVPR.2008.4587618
Keysers C, Xiao DK, Foldiak P, Perrett D (2001) The speed of sight. J Cogn Neurosci 13(1):90–101
Linden D (2005) The P300: Where in the brain is it produced and what does it tell us? Neurosci-entist 11(6):563–576

148 P. Sajda et al.
Makeig S, Westerfield M, Jung TP, Covington J, Townsend J, Sejnowski T, Courchesne E (1999)Independent components of the late positive response complex in a visual spatial attention task.J Neurosci 19:2665–2680
Oliva A (2005) Gist of the scene. In: Encyclopedia of Neurobiology of Attention. Elsevier, SanDiego, CA, pp 251–256
Parra L, Christoforou C, Gerson A, Dyrholm M, Luo A, Wagner M, Philiastides M, Sajda P (2008)Spatiotemporal linear decoding of brain state: Application to performance augmentation inhigh-throughput tasks. IEEE Signal Process Mag 25(1):95–115
Parra LC, Spence CD, Gerson AD, Sajda P (2005) Recipes for the linear analysis of EEG. Neu-roimage 28(2):326–341
Sajda P, Parra L, Christoforou C, Hanna B, Bahlmann C, Wang J, Pohlmeyer E, Dmochowski J,Chang SF (2010) In a blink of an eye and a switch of a transistor: Cortically-coupled computervision. Proceedings of the IEEE 98(3):462–478
Thorpe S, Fize D, Marlot C (1996) Speed of processing in the human visual system. Nature381:520–522
Wang J, Jebara T, Chang SF (2008) Graph transduction via alternating minimization. In: Interna-tional Conference on Machine Learning (ICML)
Wang J, Jaing YG, Chang SF (2009a) Label diagnosis through self tuning for web image search.In: IEEE Computer Society Conference on Computer Vision and Pattern Recognition (CVPR),Miami Beach, Florida, USA
Wang J, Pohlmeyer E, Hanna B, Jiang YG, Sajda P, Chang SF (2009b) Brain state decoding forrapid image retrieval. In: ACM MultiMedia, Beijing, China, pp 945–954