Chapter 9
65
Chapter 9 Development
-
Upload
tarik-hoffman -
Category
Documents
-
view
18 -
download
0
description
Chapter 9. Development. Let’s Go On a Vacation!. Where would you like to go on vacation? Pick a less-developed destination and discuss that makes it an attractive destination. Make a list of the amenities you would like it to have. Hmm…now ask yourselves:. - PowerPoint PPT Presentation
Transcript of Chapter 9

Chapter 9Development

Let’s Go On a Vacation! Where would you like to go on vacation? Pick a less-developed destination and discuss
that makes it an attractive destination. Make a list of the amenities you would like it
to have.

Hmm…now ask yourselves: Are the people who live in this place year-round
fortunate to live at such a desirable destination? What do the local ppl depend on for income? Does
tourism play a role? What do the ppl in this country who do not live in a
tourist area do for work? Can any of these ppl come to our country on a
vacation? Why not? Is that fair?

Modern Examples Phuket What we see here is vastly different from the
post-tsunami Most victims=
Poor resident:

Key Issue 1: Why Does Development Vary Among Countries?
MDC = relatively developed or developed LDC = developing. 3 factors:
1. Economic2. Social3. Demographic
HDI = development is a function of all 3 1 econ (GDP) + 2 social (literacy, education) + 1
demographic (life expect) = HDI. U.S = 10th

Human Development Index, 2005
Fig. 9-1: Developed by the United Nations, the HDI combines several measures of development: life expectancy at birth, adjusted GDP per capita, and knowledge (schooling and literacy).
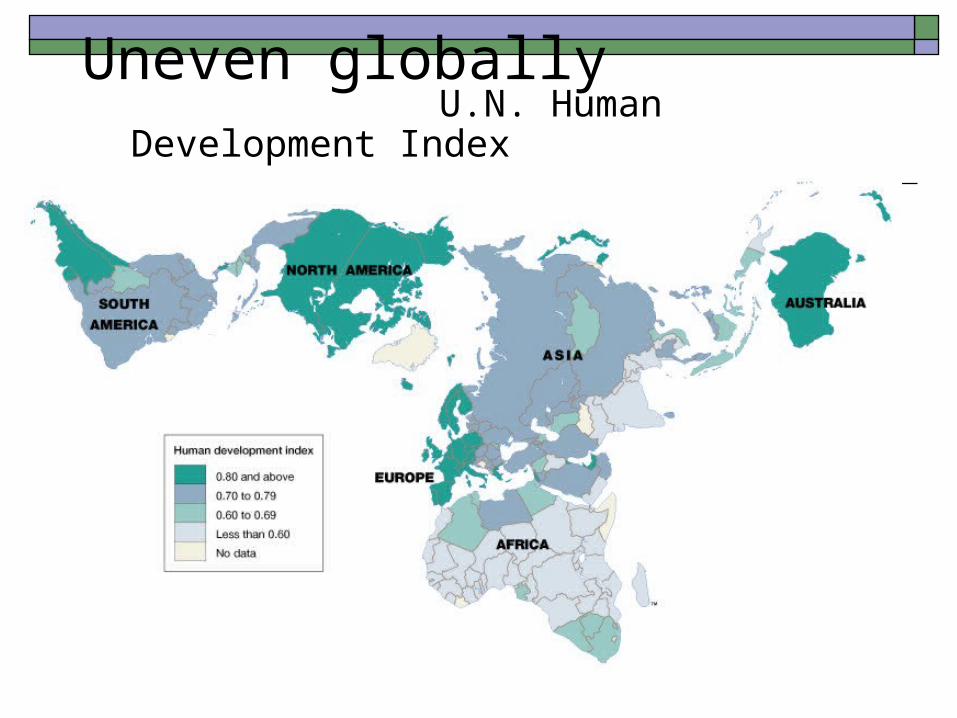
Uneven globally U.N. Human Development Index ( life expectancy, education, income)

Uneven Globally
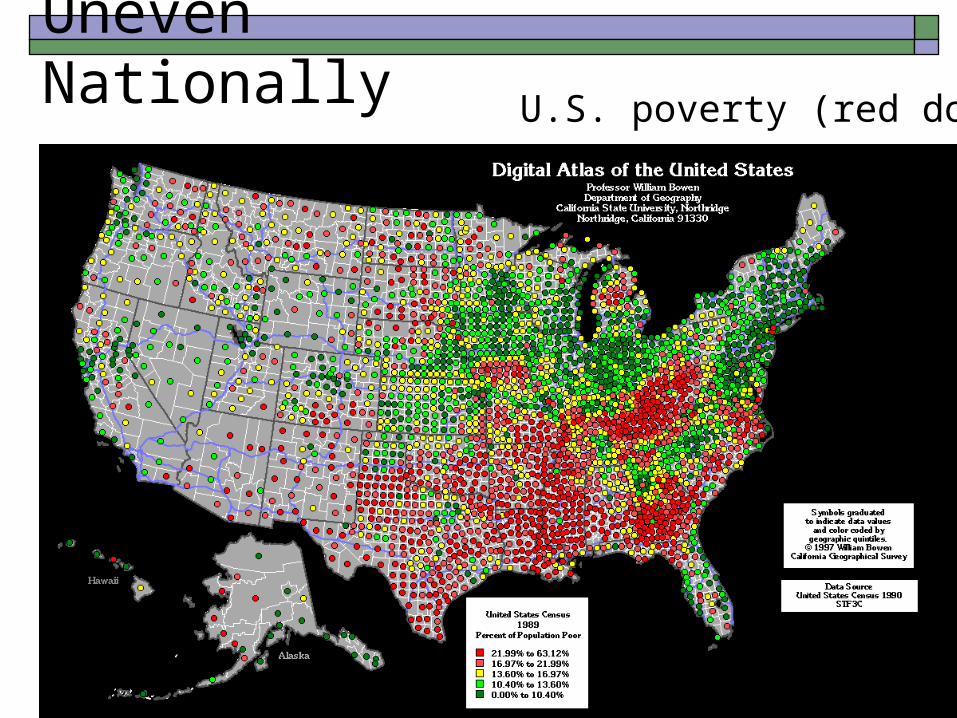
Uneven Nationally
U.S. poverty (red dots)

Uneven Regionally

YouTube Video Best/Worst Place to Be A Mother

GDP Gross domestic product (GDP): value of the total output of
goods & svc produced in a country, normally in a yr. GDP per CAPITA is typically the GDP divided among the
population, but in countries w/guest workers that gets muddled. Basically the amt of money each citizen gets in that country, on avg.
Goods + Services / population Per capita GDP = average wealth, not the distrib of wealth.
Ex. U.S. GDP = $12trillion, pop is 300mil = GDP per capita of $40K

Annual GDP per capita, 2005
Fig. 9-2: Annual gross domestic product (GDP) per capita averages over $20,000 in most developed countries but under $5000 in most less developed countries.

Gross National Income (GNI) & GNI PPP Another economic factor Dollar value of all goods & svc in a country, plus the
dollar value of exports minus imports. Measure a country’s collective wealth, NOT personal
income. Indicates a realtive std of living Goods + Services + (Exports – Imports) Gross Nat’l Income Purchasing Power Parity (GNIPPP)
estimate that takes into acct diff. in prices between countries. Loaf of bread US = $1, cost equiv in China is 44 cents.

1. Economic Indicators GDP & GDP per capita used in HDI depending on
country (sometimes hard to figure in LDCs) 4 others useful: Econ’c structure, worker product’y,
access to raw materials, avail’y of consmr goods Avg MDC = $27K, $15/hr Most LDC’s = $4,000, $2/hr but increasing Doesn’t mean poor or wealthy – 1/8 of U.S.
population classifies as in poverty.
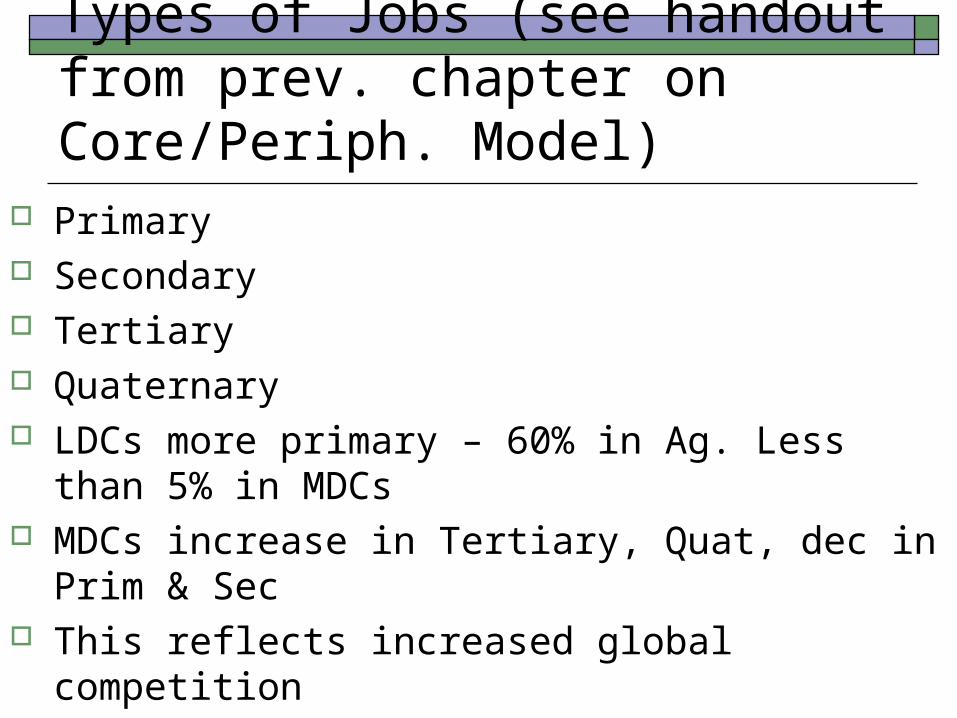
Types of Jobs (see handout from prev. chapter on Core/Periph. Model)
Primary Secondary Tertiary Quaternary LDCs more primary – 60% in Ag. Less than 5% in
MDCs MDCs increase in Tertiary, Quat, dec in Prim &
Sec This reflects increased global competition

New International Division of Labor

Best Jobs projected in U.S. by Growth – CNN Money1. Telecommunications Network Engineer 53%2. Systems Engineer 45%3. Personal Financial Advisor41%4. Veterinarian35%5. Senior Financial Analyst 34%6. Business Analyst, IT29% 7. Software Development Director 28%8. Physical Therapist 27%9. Physician Assistant 27%10. Computer/Network Security Consultant 27%
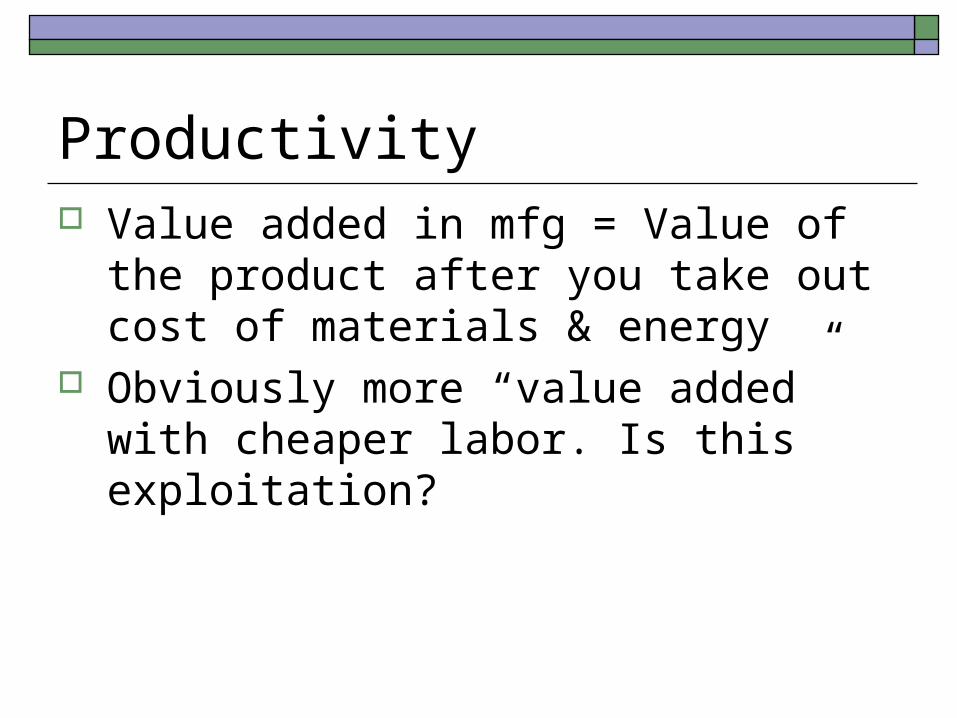
Productivity Value added in mfg = Value of the product
after you take out cost of materials & energy Obviously more “value added” with cheaper
labor. Is this exploitation?

Raw Materials He who holds the valuable stuff we need, holds the $
$$$!!! Oil = huge.. Gas prices right now reflect this Country with more material = better chance of
developing but not a sure thing Others without can still do well (Japan, Singapore,
Switzerland) Changes in science = changes in demand & profit..
Look at coal & iron demands - lowered

From the Financial Nut online…why gas prices so high
Again, 71% of the $3.00+ per gallon we are currently paying is determined by crude oil costs. This is key to understanding why gas prices are so high now

Why is Crude Oil Going Up? That’s the real question! Because if we can answer that question, we will be able
to see why retail gas prices (71% of which are directly influenced by crude oil costs) are gradually climbing.
GROWING WORLD ECONOMYExpansion economically again. As a result, energy needs increase in order to output more products and services. Additionally, we are seeing true growth in China, India, and Brazil (NIC ALERT!!!) Oil is a necessary component in economic growth. For these reasons, an increasing demand in crude oil exists, and that tends to drive prices up.
WEAK US DOLLAROil is purchased around the world in US dollars. If you’re from Japan, you must by US dollars with your Yen before you can purchase a barrel of crude oil. In other words, no matter where you come from, before you can buy oil, you must exchange your currency for the US dollar. Exchange rates will make it cheaper for some to buy oil. Because of this, investors are buying into oil… drives price up.

The Big Question to Discuss… With the mass amount of scientific
developments with corn/ethanol and electric/solar options, why do you think these options aren’t being rigorously explored in the U.S. (and many other countries)?
Support your theories!

Consumer Goods – we like our “stuff” in the U.S. Telephone Land Lines per Population

Cellular Phones per Population
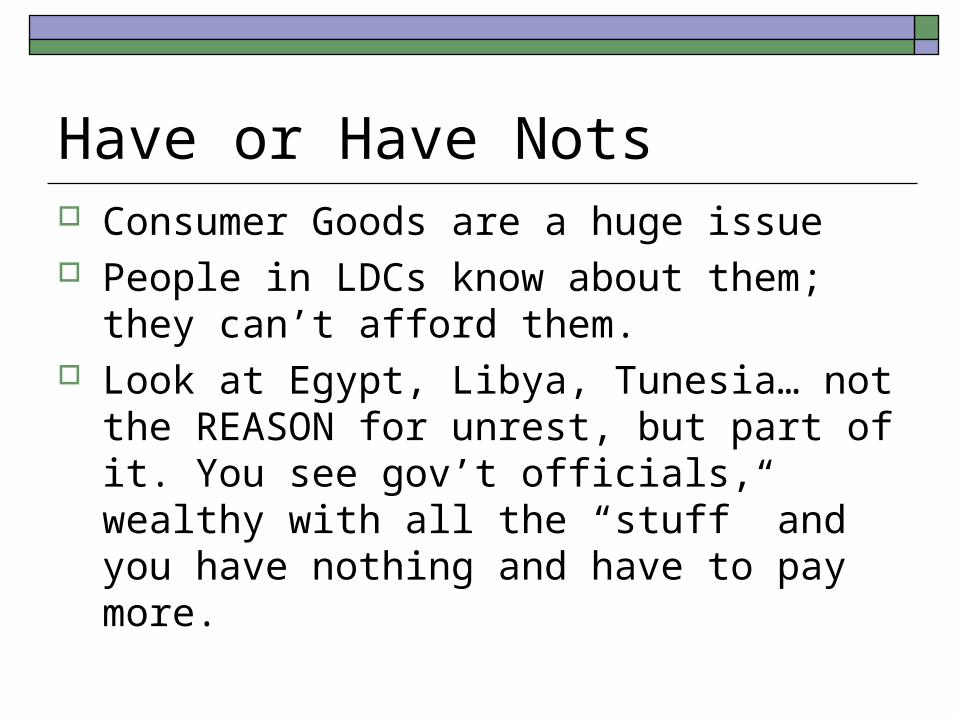
Have or Have Nots Consumer Goods are a huge issue People in LDCs know about them; they can’t
afford them. Look at Egypt, Libya, Tunesia… not the
REASON for unrest, but part of it. You see gov’t officials, wealthy with all the “stuff” and you have nothing and have to pay more.

Why not the U.S.? – Another BIG question Why do you suppose the U.S. hasn’t seen an
uprising like in N. Africa & the Middle East?

Social Indicators of Development Higher the level of Dev’t, greater the quantity &
quality of education. Quality measured by 1. Student/teacher ratio & 2.
literacy rate Avg = 10 yrs MDCs, Only a few in LDCs S/T ratio twice as high in LDC’s But does that mean BETTER education? NPR Recording – falling behind?

Primary Student-Teacher Ratios
Fig. 9-6: Students per teacher, primary school level. Primary school teachers have much larger class sizes in LDCs than in MDCs, partly because of the large numbers of young people in the population.

Health & Welfare German Healthcare (VIDEO) Govt pays 70% or more in EUR, private pay
less than 30% Private ind’l pay 55% in U.S. (employers
pay), which more closely reflects an LDC than an MDC.
U.S. is #2 on Heathcare spending (Medicaid, Medicare, etc..)

Health Care Expenditures per GDP

Private Health Care Expenditures

The Healthcare crisis they talk about.. In 2007, the U.S. spent $2.26 trillion on
health care, $7,439 per person, up from $2.1 trillion, or $7,026 per capita, the previous year – Medicare/Medicaid resources.
Remember supply & demand? The more the demand…
Warren Buffett

Calories per capita

Demographic Indicators of Dev’t Life expectancy Infant Mortality Rate Natural Increase Rate Crude Birth Rate
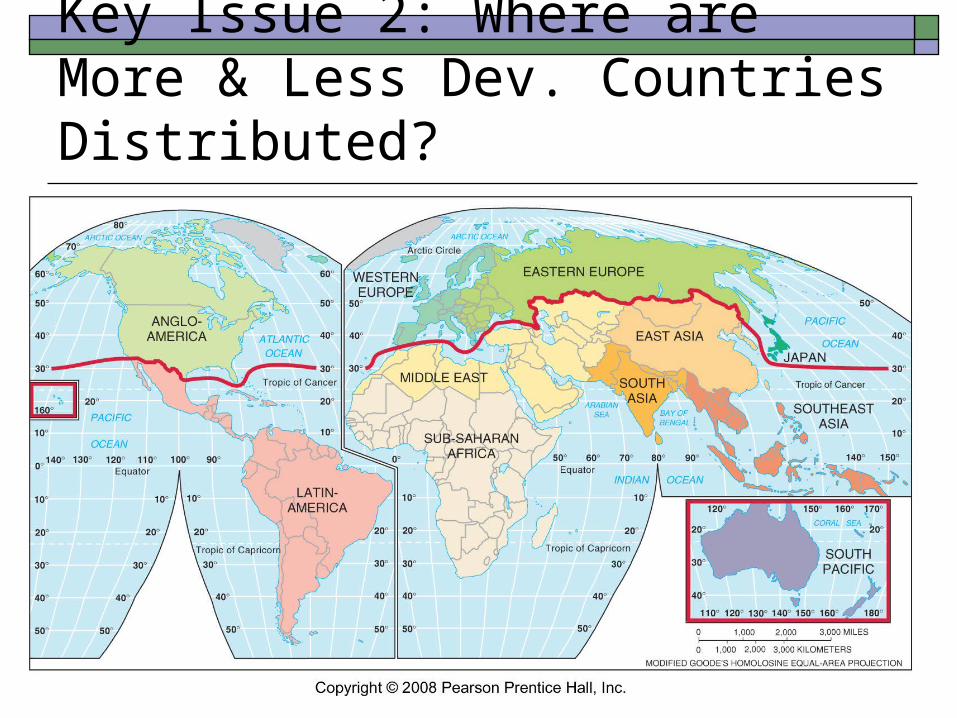
Key Issue 2: Where are More & Less Dev. Countries Distributed?

More & Less Developed Regions
More developed regions Anglo-America – Western Europe Eastern Europe – Japan South Pacific
Less developed regions Latin America – East Asia Southeast Asia – Middle East South Asia – Sub-Saharan
Africa

This key issue.. Do brief summaries of the regions on the
sheets provided, i.e. Anglo-America: Homogeneous Maj. Eng-speaking Rich in raw material Less mfg. survived w/high-tech, agriculture

Key Issue 3: Where does level of Dev’t Vary by Gender? Men and women are different: Video: Friends Not a single country with true equality (UN) Agree or disagree? Video on equality

QUESTION to consider… What is an economic indicator of gender
inequality? What is social indicator of gender ineq? What is a demographic indicator?

How to measure – 2 ways GDI – Gender-Related Dev’t index GEM – Gender Empowerment Measure GDI first – 3 indicators Gender Differences are:
Economic – Reasons? Social – education & literacy . Video: Nakzia -
Afghanistan Demographic – life expectancy. Gender gap
GREATER in MDCs!! Why these disparities?

GEM – 2 indicators Economic: Professional & tech jobs are important
measure – greatest advancement opp’y Where is highest level?
Political: % of country’s administrative & managerial jobs – influencing decision making. % in public office Highest?

MDCs MUCH better for women! Women in MDCs – 2/3 of income on avg. Avg 1 in 5 in political office End Women’s Suffrage

Gender-Related Development Index (GDI), 2005
Fig. 9-13: The GDI combines four measures of development, reduced by the degree of disparity between males and females.

Female-Male Income Differences

Male & Female Literacy Rates

Gender Empowerment Fewer women hold positions of power in both
MDCs and LDCs GEM calculated – 2 economic (income & prof.
jobs) + 2 political power (managerial jobs & elected jobs).
Complete equality = 1.0. Highest are MDCs Why do women have a tough time in politics? 15% of reps in Senate & House of Rep are
women

GEM

Key Issue 4: Why do LDCs face obstacles to development? What evidence is there that LDCs are
developmentally IMPROVING? What evidence is there that they are NOT? 1/5 of the world’s ppl in MDC’s consume 5/6
of the goods.

Key Issue 4: Why do LDCs face obstacles to development?

Shocking statistics Americans spend more per yr on cosmetics ($8bil)
than the cost of schools for the 2 bil in the world in need of them ($6Bil)
EUR spend more on ice cream ($11Bil) than the cost of having a working toilet to the 2 billion who don’t have one ($9 bil)
LDCs must develop more rapidly 2 obstacles: 1 – adopting policies to promote dev’t
and 2 – finding $$ to pay for dev’t.

Dev’t thru Self-Sufficiency – 2 ways 1. Balanced Growth Approach (KNOW THIS!) –
country should spread investment equally across all sectors of economy in all regions. = between city and country Reduces povertyNurses businessesLimit import of goodsHigh tariffs on imported goodsFixing quotas on imported goodsRequire licenses to restrict # of legal importersGov’t subsidies if needed

Problems w/Self-Sufficiency Two major: 1. Inefficiency – protects inefficient
industries. Long waiting lists, little incentive to improve quality (cell phones), little incentive to lower production costs, reduce prices or increase production.
2. Large Bureaucracy: complex system = abuse/corruption.

Dev’t Thru International Trade 2. Rostow’s Development Model – 5 stages, this
is what MOST switched to.1. Traditional society – not yet started. High ag, high $
in “nonproductive” – military, religion
2. Preconditions for takeoff – elite initiates. Invest in tech & infrastructure – water/transportation, stimulates productivity
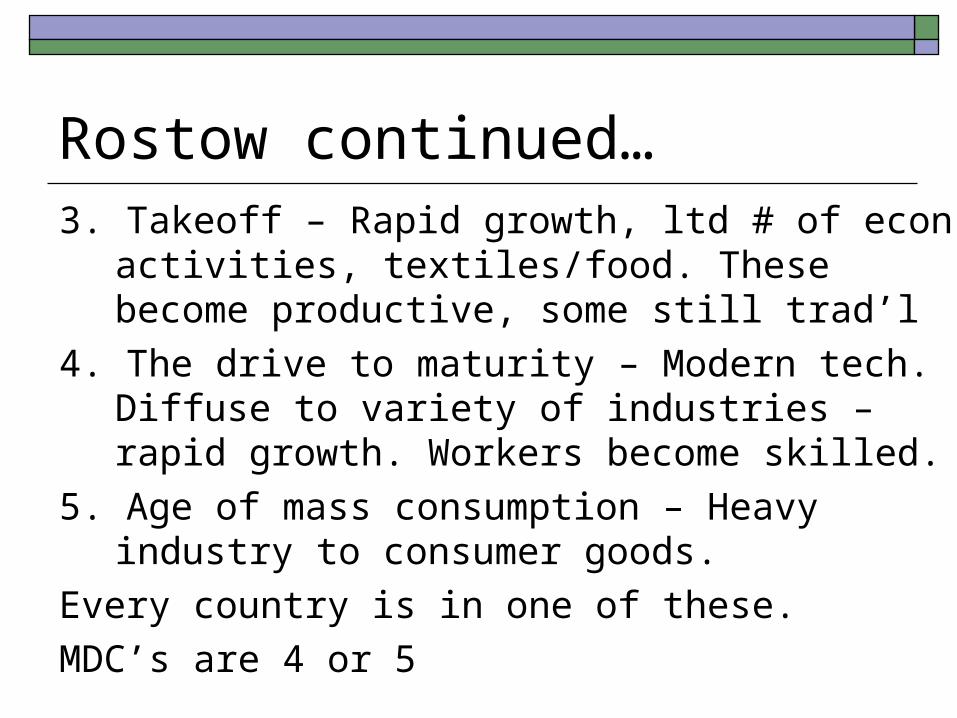
Rostow continued…3. Takeoff – Rapid growth, ltd # of econ activities,
textiles/food. These become productive, some still trad’l
4. The drive to maturity – Modern tech. Diffuse to variety of industries – rapid growth. Workers become skilled.
5. Age of mass consumption – Heavy industry to consumer goods.
Every country is in one of these.
MDC’s are 4 or 5

Rostow’s Model Based on 2 things1. Developed countries of W. EUR & Anglo-
Am joined by others in S & E EUR & JAP. If they can do it, why can’t others?
2. Many LDCs contain the raw materials we Loooooooooooove in MDCs! In past, colonizers took them.
N. Geographic: Blood Diamonds

Examples of Int’l Trade Approach While most LDCs went self-sufficiency, 2
groups chose intern’l trade – both in Asia 4 Asian Dragons – what are they?
Lack natural resources here Petroleum-Rich Arabian Peninsula. S. Arabia,
Kuwait, Bahrain, Oman, U.A.E. Rich in nat. resources Conflict here is cultural
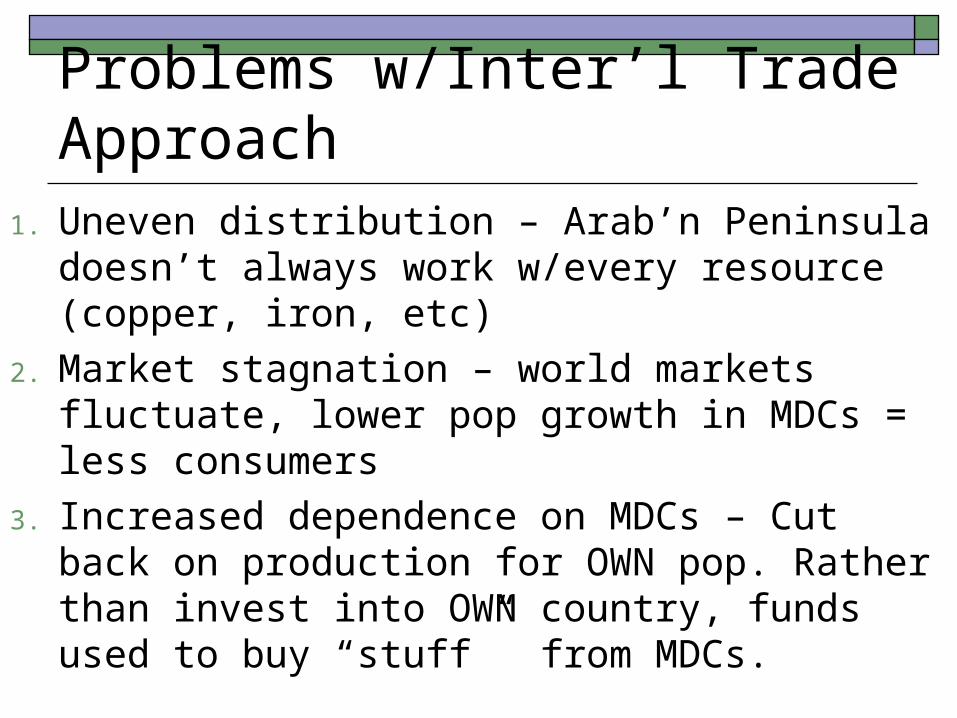
Problems w/Inter’l Trade Approach1. Uneven distribution – Arab’n Peninsula doesn’t
always work w/every resource (copper, iron, etc)
2. Market stagnation – world markets fluctuate, lower pop growth in MDCs = less consumers
3. Increased dependence on MDCs – Cut back on production for OWN pop. Rather than invest into OWN country, funds used to buy “stuff” from MDCs.

Examples of Int’l Trade success India China Look at all the NICs! Brazil, Mexico, etc.

World Trade Organization WTO - rep 97% of world trade Est 1995. Reduce barriers to int’l trade in 2 ways:
1. Negotiation reduction or elim of trade restrictions on manuf’d goods.
2. Enforcing agreements. Watch violations – rules on charges, enforces sanctions.
Critics Lots of protesting

Transnational Corp’s Foreign Direct Investment (FDI) – investment
made by a foreign co. into the econ’y of another.
Rapid growth 20th C. , what caused decline? Transnational Corp: invests & operates in
other countries other than the one it’s HQ’d in. McD’s, Automotive, Sony

Financing Dev’t LDCs borrow $ to build infrastructure –
transportation, roads, water, etc. Inter’l Monetary Fund & World Bank are the 2
biggest lenders. Created post WWII World Band = Intern’l Bank for Reconstruction &
Dev’t (IBRD) and Intern’l Development Assoc (IDA)
IBRD - $400BIL since 1945 – mostly to?
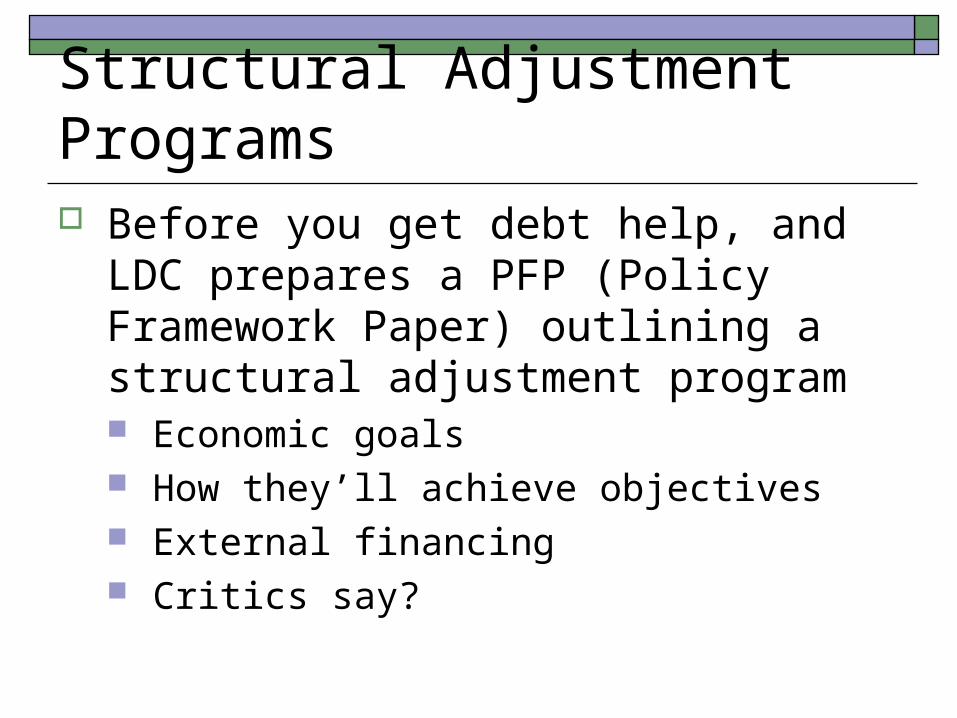
Structural Adjustment Programs Before you get debt help, and LDC prepares a
PFP (Policy Framework Paper) outlining a structural adjustment program Economic goals How they’ll achieve objectives External financing Critics say?

Fair Trade Products are made & traded according to stds
that protect workers & small businesses in LDCs Set by Fairtrade Labeling Organisations Int’l
(FLO) – non profit TransFair USA verifies this. Accessories, jewelry, coffee (controversial) Ten Thousand Villages -= largest fair trade in N.
Am - handicrafts

Standards & Critics Higher prices – but comparable to better
made products Critics – only a small % goes to workers Fair trade was meant to help since inter’l
trade doesn’t protect from poor conditions, etc.