CHAPTER 9 MUSCLESclasspages.warnerpacific.edu/bdupriest/BIO 221/Chapter 9 Muscles.pdfDuring the...
75
CHAPTER 9 MUSCLES
Transcript of CHAPTER 9 MUSCLESclasspages.warnerpacific.edu/bdupriest/BIO 221/Chapter 9 Muscles.pdfDuring the...

CHAPTER 9
MUSCLES

MUSCLE TISSUE TYPES

SPECIAL CHARACTERISTICS OF
MUSCLE
FUNCTIONS OF MUSCLE

The ability of muscle to be stretched is…
1) Excitability
2) Contractility
3) Extensibility
4) Elasticity
SKELETAL MUSCLE:
GROSS ANATOMY

Copyright © 2010 Pearson Education, Inc.
Figure 9.1 Connective tissue sheaths of skeletal muscle: epimysium, perimysium, and endomysium.
Bone
Perimysium
Endomysium
(between individual
muscle fibers)
Muscle fiber
Fascicle
(wrapped by perimysium)
Epimysium
Tendon
Epimysium
Muscle fiber
in middle of
a fascicle Blood vessel
Perimysium
Endomysium
Fascicle (a)
(b)

The connective tissue sheath around a
single muscle fiber is…
1) Endomysium
2) Epimysium
3) Perimysium

SKELETAL MUSCLE:
GROSS ANATOMY – ATTACHMENTS

SKELETAL MUSCLE:
MICROSCOPIC ANATOMY

Copyright © 2010 Pearson Education, Inc.
Figure 9.2a Microscopic anatomy of a skeletal muscle fiber.
Nuclei
Fiber
(a) Photomicrograph of portions of two isolated muscle
fibers (700x). Notice the obvious striations (alternating
dark and light bands).
Dark A band
Light I band
Copyright © 2010 Pearson Education, Inc.
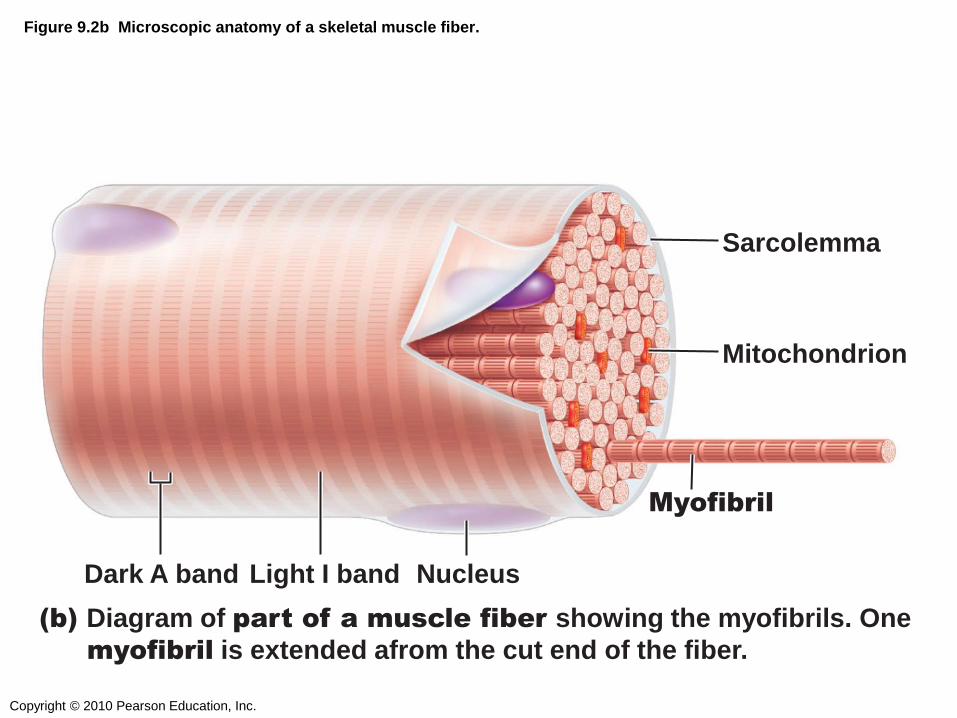
Nucleus Light I band Dark A band
Sarcolemma
Mitochondrion
(b) Diagram of part of a muscle fiber showing the myofibrils. One
myofibril is extended afrom the cut end of the fiber.
Myofibril
Figure 9.2b Microscopic anatomy of a skeletal muscle fiber.
Copyright © 2010 Pearson Education, Inc.
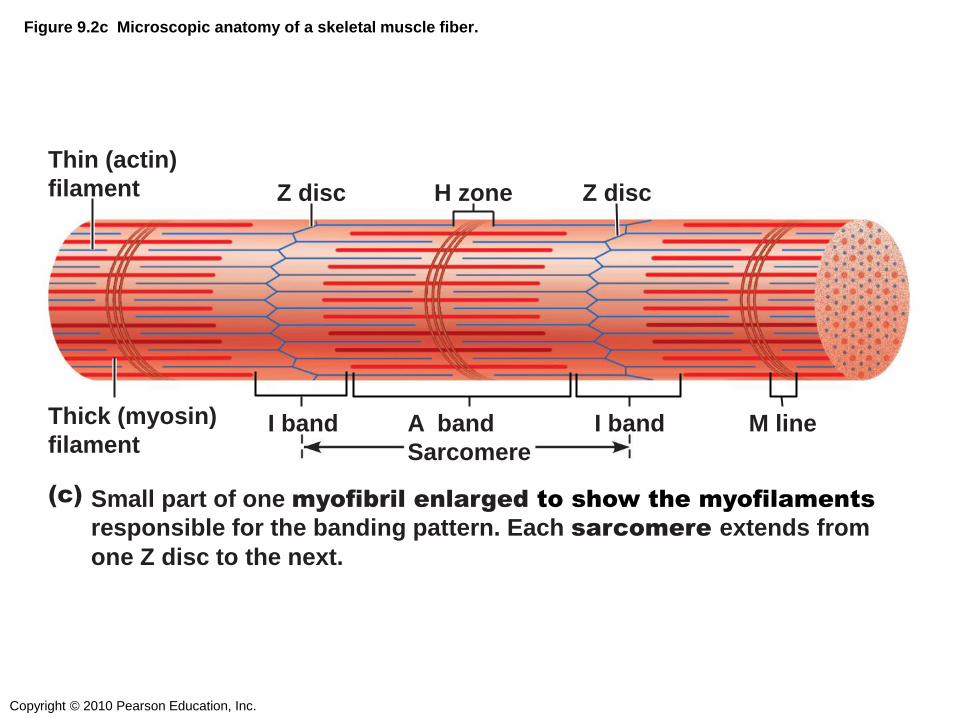
Figure 9.2c Microscopic anatomy of a skeletal muscle fiber.
I band I band A band
Sarcomere
H zone
Thin (actin)
filament
Thick (myosin)
filament
Z disc Z disc
M line
(c) Small part of one myofibril enlarged to show the myofilaments
responsible for the banding pattern. Each sarcomere extends from
one Z disc to the next.

The functional contractile unit of a
muscle is the…
1) Fascicle
2) Muscle fiber
3) Sarcomere
4) Epimysium

Copyright © 2010 Pearson Education, Inc.
Figure 9.2d Microscopic anatomy of a skeletal muscle fiber.
Z disc Z disc M line
Sarcomere
Thin (actin) filament
Thick (myosin) filament
Elastic (titin) filaments
(d) Enlargement of one sarcomere (sectioned lengthwise). Notice the
myosin heads on the thick filaments.

Copyright © 2010 Pearson Education, Inc.
Figure 9.2e Microscopic anatomy of a skeletal muscle fiber.
I band
thin
filaments
only
Actin
filament
Myosin
filament
H zone
thick
filaments
only
M line
thick filaments
linked by
accessory
proteins
Outer edge
of A band
thick and thin
filaments overlap
(e) Cross-sectional view of a sarcomere cut through in different locations.
Copyright © 2010 Pearson Education, Inc.
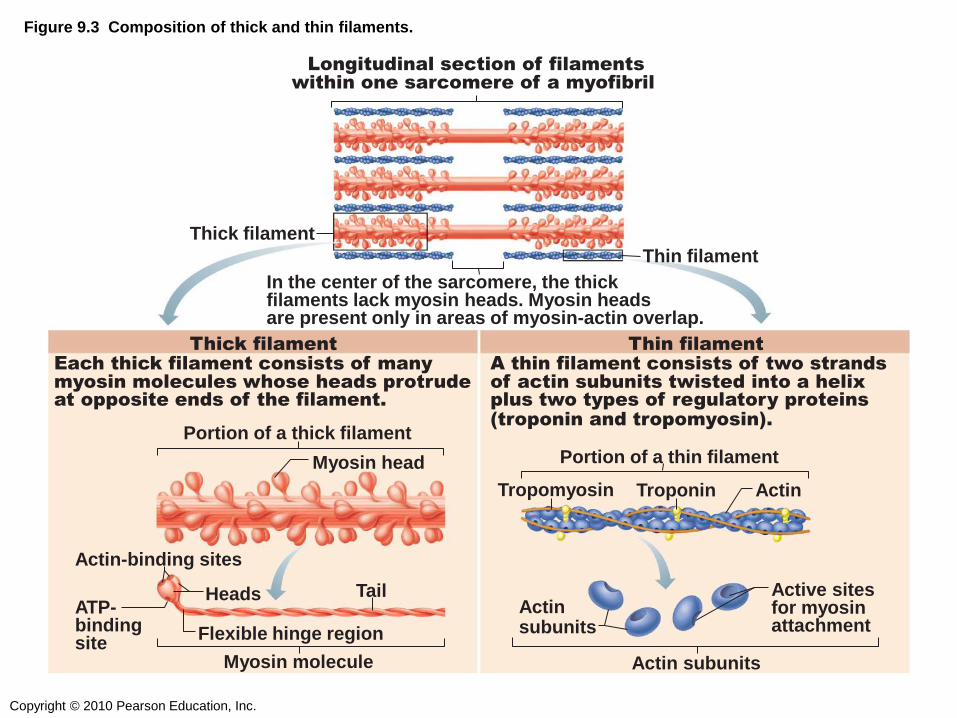
Figure 9.3 Composition of thick and thin filaments.
Flexible hinge region
Tail
Tropomyosin Troponin Actin
Myosin head
ATP- binding site
Heads Active sites for myosin attachment
Actin subunits
Actin-binding sites
Thick filament Each thick filament consists of many
myosin molecules whose heads protrude at opposite ends of the filament.
Thin filament A thin filament consists of two strands
of actin subunits twisted into a helix plus two types of regulatory proteins
(troponin and tropomyosin).
Thin filament
Thick filament
In the center of the sarcomere, the thick filaments lack myosin heads. Myosin heads are present only in areas of myosin-actin overlap.
Longitudinal section of filaments
within one sarcomere of a myofibril
Portion of a thick filament
Portion of a thin filament
Myosin molecule Actin subunits

Copyright © 2010 Pearson Education, Inc.
Figure 9.4 Transmission electron micrograph of part of a sarcomere clearly showing the myosin heads forming cross
bridges that generate the contractile force.
Thin filament (actin) Thick filament (myosin) Myosin heads
SKELETAL MUSCLE:
SLIDING FILAMENT MODEL OF
MUSCLE CONTRACTION
Copyright © 2010 Pearson Education, Inc.
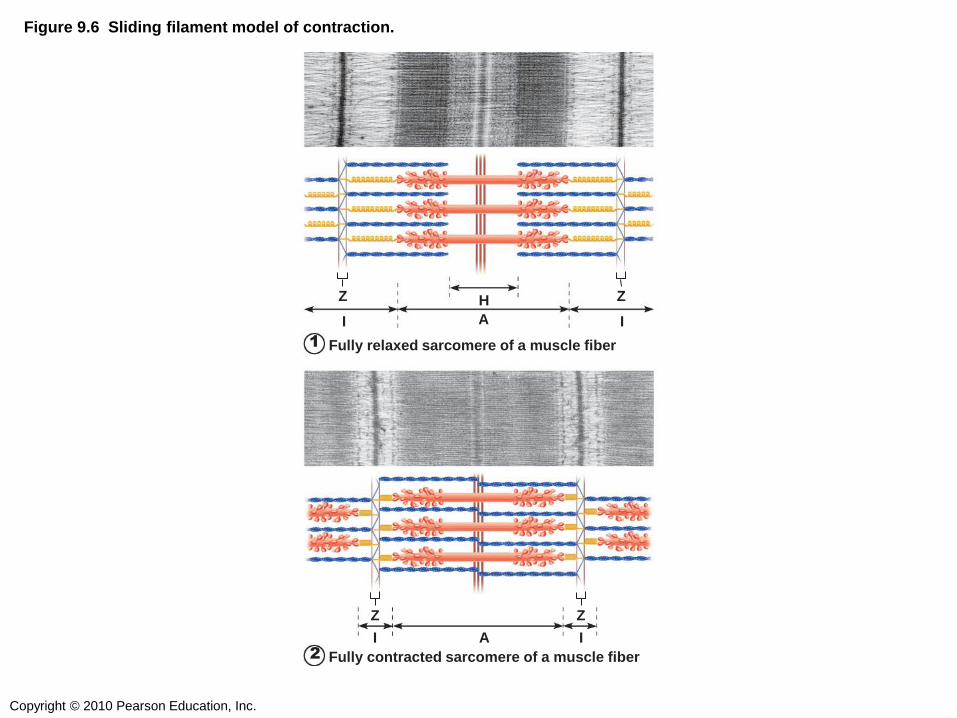
Figure 9.6 Sliding filament model of contraction.
I
Fully relaxed sarcomere of a muscle fiber
Fully contracted sarcomere of a muscle fiber
I A
Z Z H
I I A
Z Z
1
2

Copyright © 2010 Pearson Education, Inc.
Figure 9.12 Cross Bridge Cycle
Actin
Cross bridge formation.
Cocking of myosin head. The power (working)
stroke.
Cross bridge
detachment.
Ca2+
1
2
3
4
Myosin head
Thick filament
Thin filament
ADP
Myosin
P i
ADP
P i ATP
hydrolysis
ADP
P i
ATP
ATP

Copyright © 2010 Pearson Education, Inc.
Figure 9.5 Relationship of the sarcoplasmic reticulum and T tubules to myofibrils of skeletal muscle.
Myofibril
Myofibrils
Triad:
Tubules of the SR
Sarcolemma
Sarcolemma
Mitochondria
I band I band A band
H zone Z disc Z disc
Part of a skeletal
muscle fiber (cell)
• T tubule • Terminal
cisternae
of the SR (2)
M line

Contraction of a sarcomere occurs because
Of sliding of ______ past ______.
1) Actin / myosin
2) Myosin / actin
3) Tropomyosin / myosin
4) Tropomyosin / actin
Before a cross-bridge cycle can occur, calcium
ions must bind to…
1) actin
2) Myosin
3) Tropomyosin
4) Troponin
Once troponin binds calcium, it moves,
exposing ______ binding sites on ______.
1) Actin / myosin
2) Myosin / actin
3) Tropomyosin / actin
4) Tropomyosin / myosin

SKELETAL MUSCLE:
PHYSIOLOGY OF MUSCLE FIBERS
Or: How does the calcium get released?

Copyright © 2010 Pearson Education, Inc.
Figure 9.8 Events at the Neuromuscular Junction (1 of 4)
Nucleus
Action potential (AP)
Myelinated axon of motor neuron
Axon terminal of neuromuscular junction
Sarcolemma of the muscle fiber
Copyright © 2010 Pearson Education, Inc.
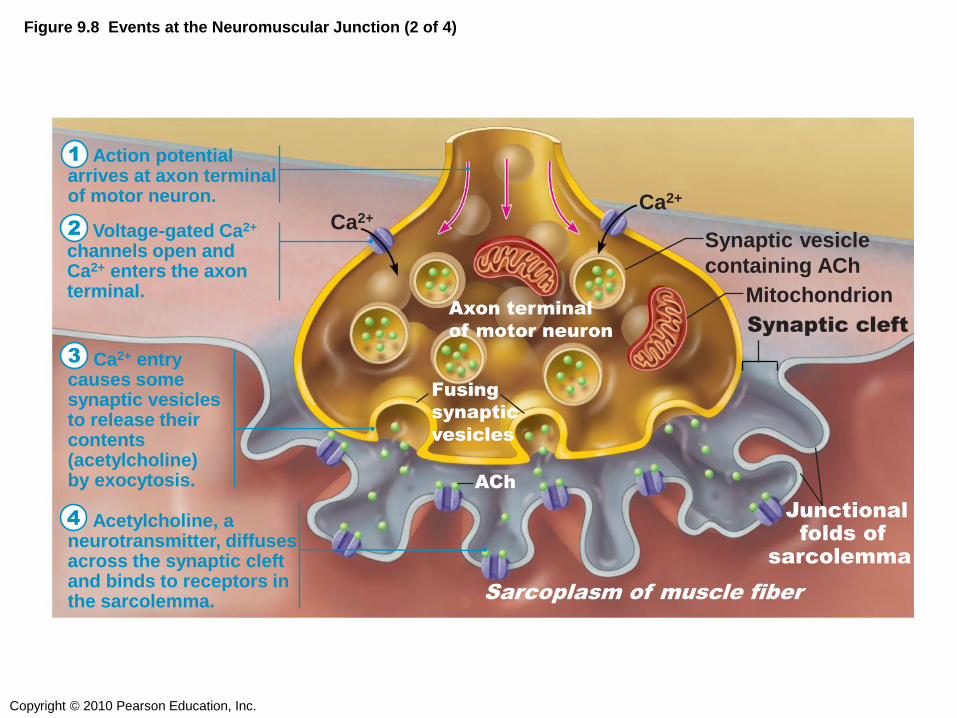
Action potential arrives at axon terminal of motor neuron.
Voltage-gated Ca2+ channels open and Ca2+ enters the axon terminal.
Ca2+ entry causes some synaptic vesicles to release their contents (acetylcholine) by exocytosis.
Acetylcholine, a neurotransmitter, diffuses across the synaptic cleft and binds to receptors in the sarcolemma.
Figure 9.8 Events at the Neuromuscular Junction (2 of 4)
Ca2+
Axon terminal
of motor neuron
Synaptic vesicle
containing ACh
Mitochondrion
Synaptic cleft
Junctional
folds of
sarcolemma
Fusing
synaptic
vesicles
ACh
Sarcoplasm of muscle fiber
Ca2+
1
2
3
4

Copyright © 2010 Pearson Education, Inc.
Figure 9.9 Summary of events in the generation and propagation of an action potential in a skeletal muscle fiber.
Na+ K+
Axon terminal
Synaptic
cleft
ACh–
ACh
1 Local depolarization:
generation of the end
plate potential on the
sarcolemma
Na+
Na+
Open Na+
Channel
Closed Na+
Channel
Closed K+
Channel
Open K+
Channel
K+
K+ K+
2 Generation and propagation of
the action potential (AP)
3 Repolarization Sarcoplasm of muscle fiber
Na+
The electrical signal from a neuron is carried
to a muscle by the neurotransmitter called…
1) Epinephrine
2) Calcium
3) Acetylcholine
4) Action potential
Copyright © 2010 Pearson Education, Inc.
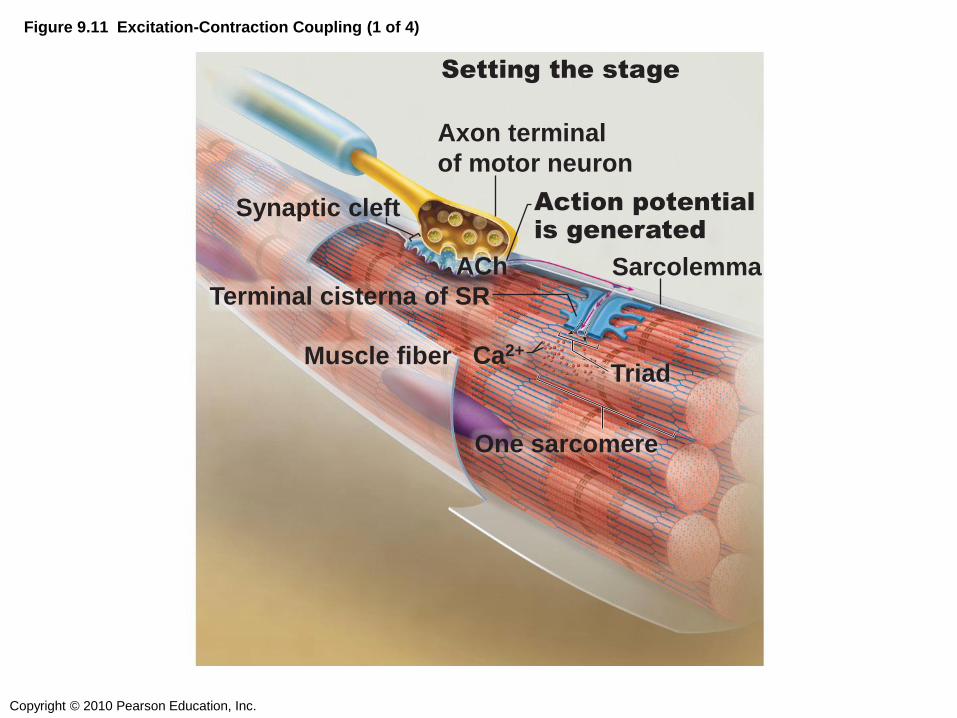
Figure 9.11 Excitation-Contraction Coupling (1 of 4)
Axon terminal
of motor neuron
Muscle fiber Triad
One sarcomere
Synaptic cleft
Setting the stage
Sarcolemma
Action potential is generated
Terminal cisterna of SR
ACh
Ca2+

Copyright © 2010 Pearson Education, Inc.
Figure 9.11 Excitation-Contraction Coupling (3 of 4)
Calcium
ions are
released.
Steps in
E-C Coupling:
Terminal
cisterna
of SR
Voltage-sensitive tubule protein
T tubule
Ca2+
release channel
Ca2+
Sarcolemma
Action potential is
propagated along the
sarcolemma and down
the T tubules.
1
2

Copyright © 2010 Pearson Education, Inc.
Figure 9.11 Excitation-Contraction Coupling (4 of 4)
Calcium binds to
troponin and removes
the blocking action of
tropomyosin.
Contraction begins
Troponin Tropomyosin
blocking active sites
Myosin
Actin
Active sites exposed and
ready for myosin binding
Ca2+
Myosin
cross
bridge
The aftermath
3
4
The depolarization of the membrane reaches
the sarcoplasmic reticulum via…
1) T-tubules
2) Voltage-sensitive tubule proteins
3) SR calcium-release channels
4) All of the above

SKELETAL MUSCLE:
CONTRACTION
Copyright © 2010 Pearson Education, Inc.
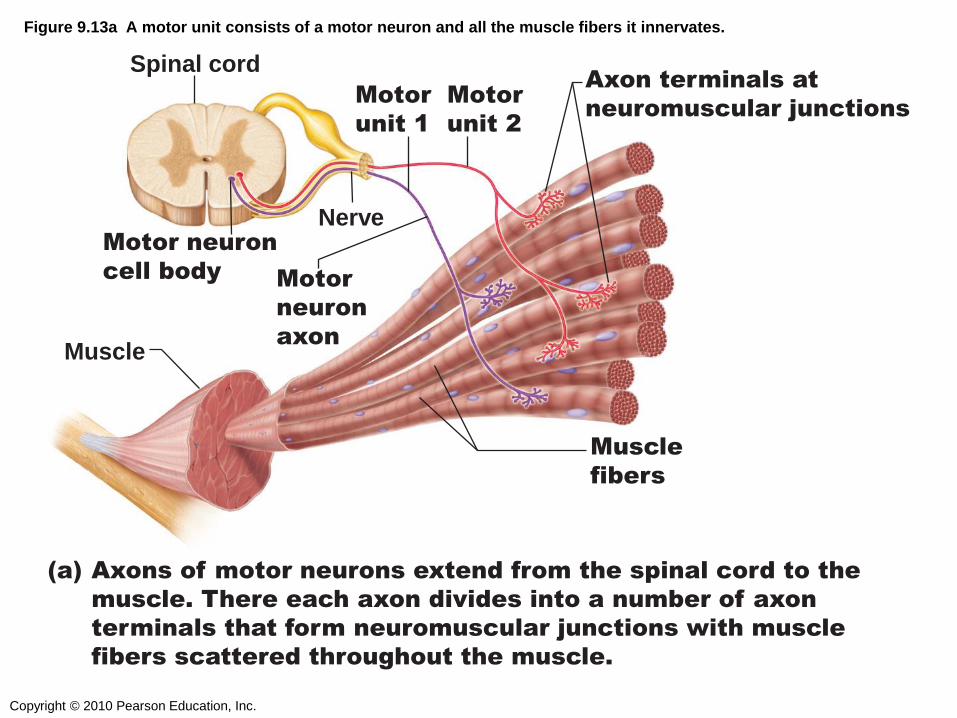
Figure 9.13a A motor unit consists of a motor neuron and all the muscle fibers it innervates.
Spinal cord
Motor neuron
cell body
Muscle
Nerve
Motor
unit 1
Motor
unit 2
Muscle
fibers
Motor
neuron
axon
Axon terminals at
neuromuscular junctions
(a) Axons of motor neurons extend from the spinal cord to the
muscle. There each axon divides into a number of axon
terminals that form neuromuscular junctions with muscle
fibers scattered throughout the muscle.

Copyright © 2010 Pearson Education, Inc.
Figure 9.13b A motor unit consists of a motor neuron and all the muscle fibers it innervates.
Branching axon
to motor unit
Muscle
fibers
Axon terminals
at neuromuscular
junctions
(b) Branching axon terminals form
neuromuscular junctions, one per
muscle fiber (photomicrograph 330x).
Copyright © 2010 Pearson Education, Inc.
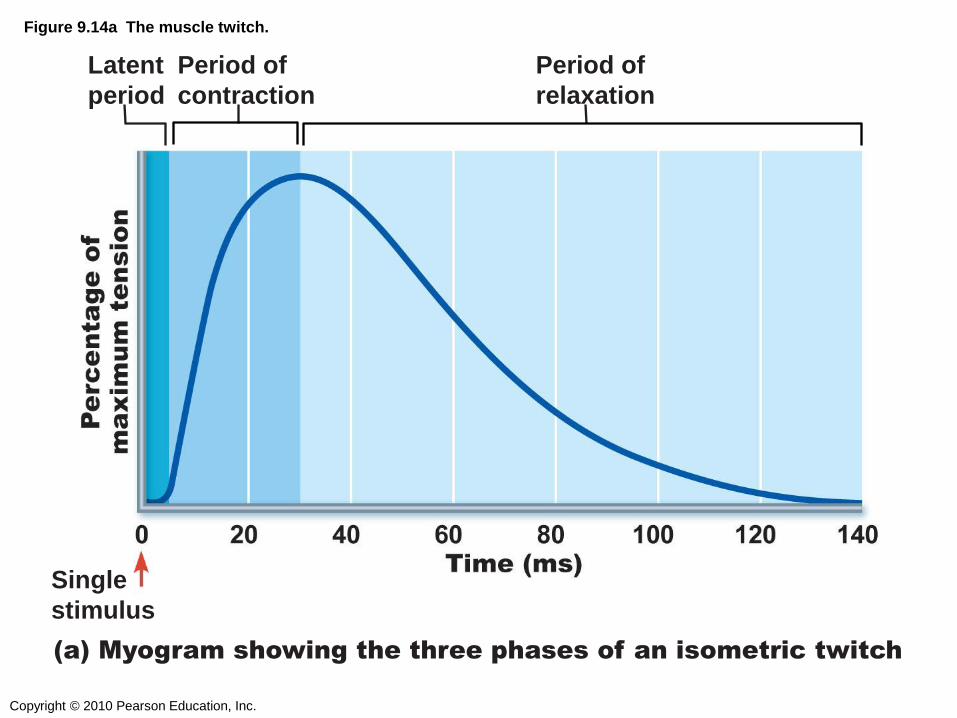
Figure 9.14a The muscle twitch.
Latent
period
Single
stimulus
Period of
contraction
Period of
relaxation
(a) Myogram showing the three phases of an isometric twitch
Copyright © 2010 Pearson Education, Inc.
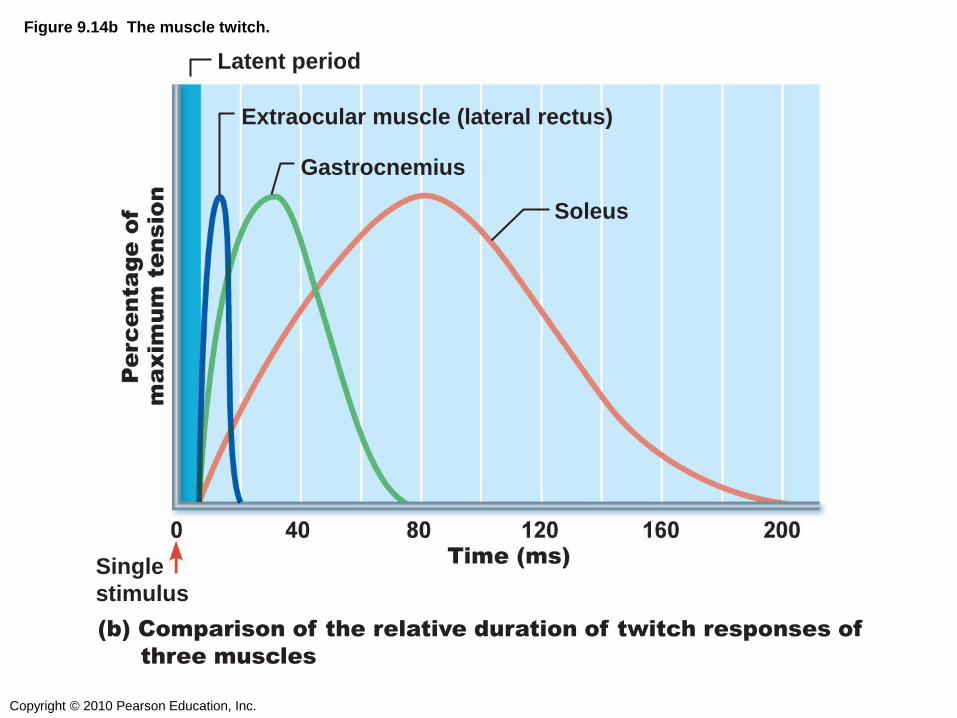
Figure 9.14b The muscle twitch.
Latent period
Extraocular muscle (lateral rectus)
Gastrocnemius
Soleus
Single
stimulus
(b) Comparison of the relative duration of twitch responses of
three muscles

During the period of relaxation, what is
happening in the muscle fiber on a molecular
level?
1) The membrane is depolarizing
2) Ca2+ is being released from the SR
3) Ca2+ is being taken up into the SR
4) The cross-bridge cycle is beginning

Copyright © 2010 Pearson Education, Inc.
Figure 9.15a Muscle response to changes in stimulation frequency.
Contraction
Relaxation
Stimulus
Single stimulus single twitch
(a) A single stimulus is delivered. The muscle
contracts and relaxes
Copyright © 2010 Pearson Education, Inc.
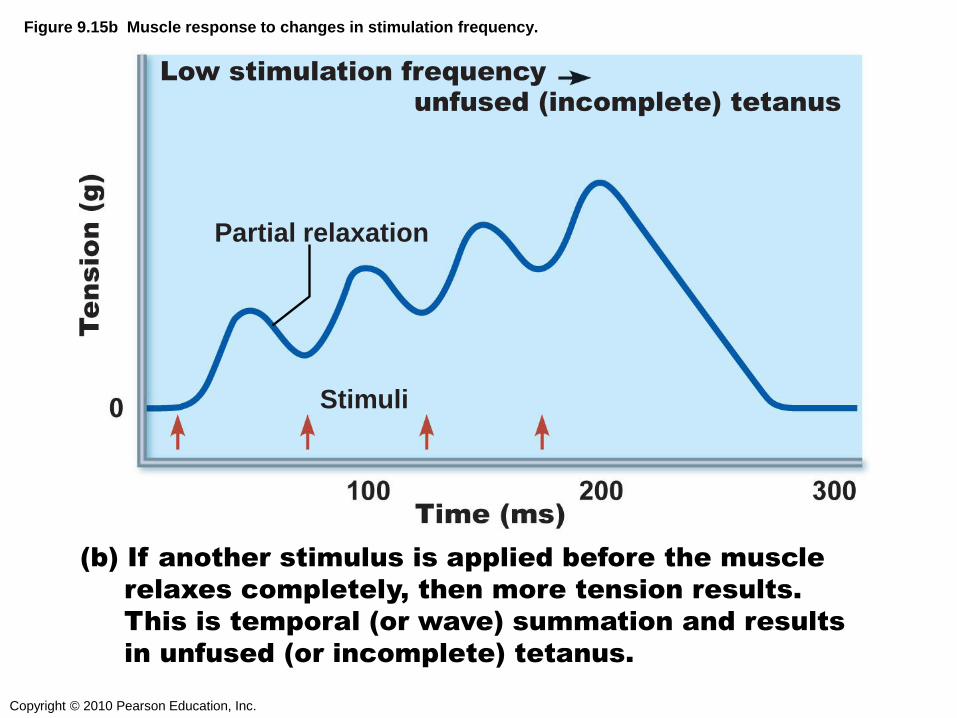
Figure 9.15b Muscle response to changes in stimulation frequency.
Stimuli
Partial relaxation
Low stimulation frequency unfused (incomplete) tetanus
(b) If another stimulus is applied before the muscle
relaxes completely, then more tension results.
This is temporal (or wave) summation and results
in unfused (or incomplete) tetanus.

Copyright © 2010 Pearson Education, Inc.
Figure 9.15c Muscle response to changes in stimulation frequency.
Stimuli
High stimulation frequency fused (complete) tetanus
(c) At higher stimulus frequencies, there is no relaxation
at all between stimuli. This is fused (complete) tetanus.

Copyright © 2010 Pearson Education, Inc.
Stimulus strength
Proportion of motor units excited
Strength of muscle contraction
Maximal contraction
Maximal
stimulus
Threshold
stimulus
Figure 9.16 Relationship between stimulus intensity (graph at top) and muscle tension (tracing below).

Copyright © 2010 Pearson Education, Inc.
Figure 9.17 The size principle of recruitment.
Motor
unit 1
Recruited
(small
fibers)
Motor
unit 2
recruited
(medium
fibers)
Motor
unit 3
recruited
(large
fibers)

Copyright © 2010 Pearson Education, Inc.
Figure 9.18a Isotonic (concentric) and isometric contractions (1 of 2).
(a) Concentric isotonic contraction
On stimulation, muscle develops enough tension (force) to lift
the load (weight). Once the resistance is overcome, the muscle
shortens, and the tension remains constant for the rest of the
contraction.
3 kg
3 kg
Muscle
contracts
(isotonic
contraction)
Tendon
Tendon

Copyright © 2010 Pearson Education, Inc.
Figure 9.18b Isotonic (concentric) and isometric contractions (1 of 2).
(b) Isometric contraction
Muscle is attached to a weight that exceeds the muscle’s peak
tension-developing capabilities. When stimulated, the tension
increases to the muscle’s peak tension-developing capability,
but the muscle does not shorten.
6 kg 6 kg
Muscle
contracts
(isometric
contraction)
When you perform a bicep curl with a bar bell
weight, your biceps brachii is doing a(n)…
1) Concentric isotonic contraction
2) Isometric contraction
3) All of the above

SKELETAL MUSCLE:
METABOLISM

Copyright © 2010 Pearson Education, Inc.
Figure 9.19a Pathways for regenerating ATP during muscle activity.
Coupled reaction of creatine
phosphate (CP) and ADP
Energy source: CP
(a) Direct phosphorylation
Oxygen use: None Products: 1 ATP per CP, creatine Duration of energy provision:
15 seconds
Creatine
kinase
ADP CP
Creatine ATP

Copyright © 2010 Pearson Education, Inc.
Figure 9.19b Pathways for regenerating ATP during muscle activity.
Energy source: glucose
Glycolysis and lactic acid formation
(b) Anaerobic pathway
Oxygen use: None Products: 2 ATP per glucose, lactic acid Duration of energy provision:
60 seconds, or slightly more
Glucose (from
glycogen breakdown or
delivered from blood)
Glycolysis
in cytosol
Pyruvic acid
Released
to blood
net gain
2
Lactic acid
O2
O2 ATP

Copyright © 2010 Pearson Education, Inc.
Figure 9.19c Pathways for regenerating ATP during muscle activity.
Energy source: glucose; pyruvic acid;
free fatty acids from adipose tissue; amino acids from protein catabolism
(c) Aerobic pathway
Aerobic cellular respiration
Oxygen use: Required Products: 32 ATP per glucose, CO2, H2O Duration of energy provision: Hours
Glucose (from
glycogen breakdown or
delivered from blood)
32
O2
O2
H2O
CO2
Pyruvic acid Fatty
acids
Amino
acids
Aerobic respiration in mitochondria
Aerobic respiration
in mitochondria
ATP
net gain per
glucose
Copyright © 2010 Pearson Education, Inc.
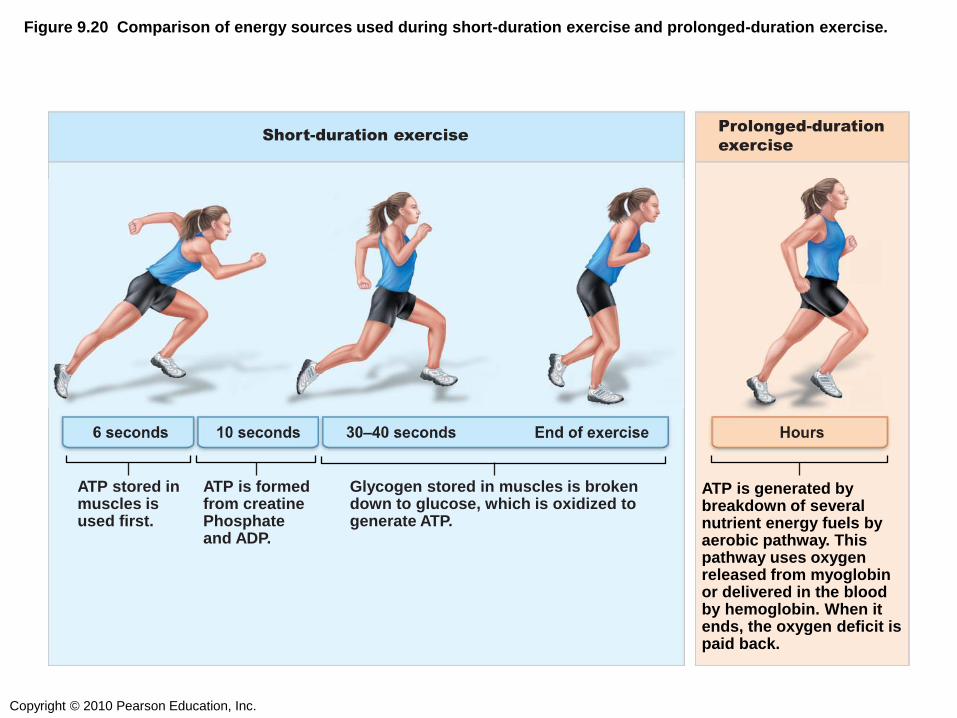
Figure 9.20 Comparison of energy sources used during short-duration exercise and prolonged-duration exercise.
Short-duration exercise Prolonged-duration
exercise
ATP stored in muscles is used first.
ATP is formed from creatine Phosphate and ADP.
Glycogen stored in muscles is broken down to glucose, which is oxidized to generate ATP.
ATP is generated by breakdown of several nutrient energy fuels by aerobic pathway. This pathway uses oxygen released from myoglobin or delivered in the blood by hemoglobin. When it ends, the oxygen deficit is paid back.

The end result of all three types of muscle
metabolism is…
1) Recharging creatine phosphate
2) Burning fat
3) ATP hydrolysis
4) ATP synthesis

SKELETAL MUSCLE:
FORCE OF CONTRACTION
Copyright © 2010 Pearson Education, Inc.
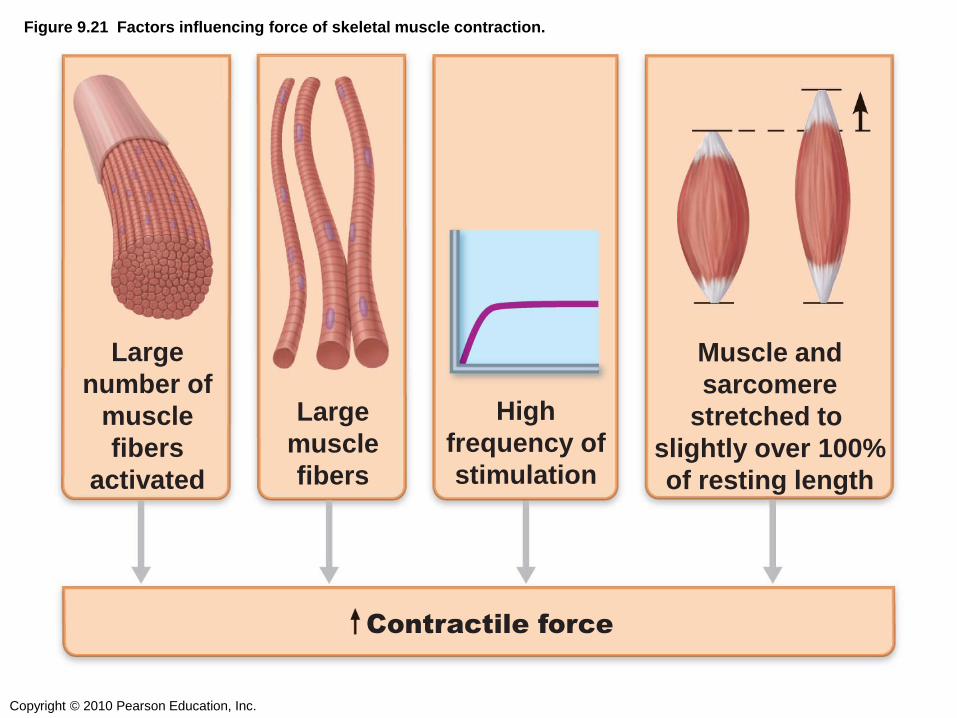
Figure 9.21 Factors influencing force of skeletal muscle contraction.
Large
number of
muscle
fibers
activated
Contractile force
High
frequency of
stimulation
Large
muscle
fibers
Muscle and
sarcomere
stretched to
slightly over 100%
of resting length

Copyright © 2010 Pearson Education, Inc.
Sarcomeres
greatly
shortened
Sarcomeres at
resting length
Sarcomeres excessively
stretched
170%
Optimal sarcomere
operating length
(80%–120% of
resting length)
100% 75%
Figure 9.22 Length-tension relationships of sarcomeres in skeletal muscles.

SKELETAL MUSCLE:
VELOCITY & DURATION
OF CONTRACTION

Copyright © 2010 Pearson Education, Inc.
Figure 9.24 Cross section of the three types of fibers in skeletal muscle.
FO
FG
SO
Copyright © 2010 Pearson Education, Inc.
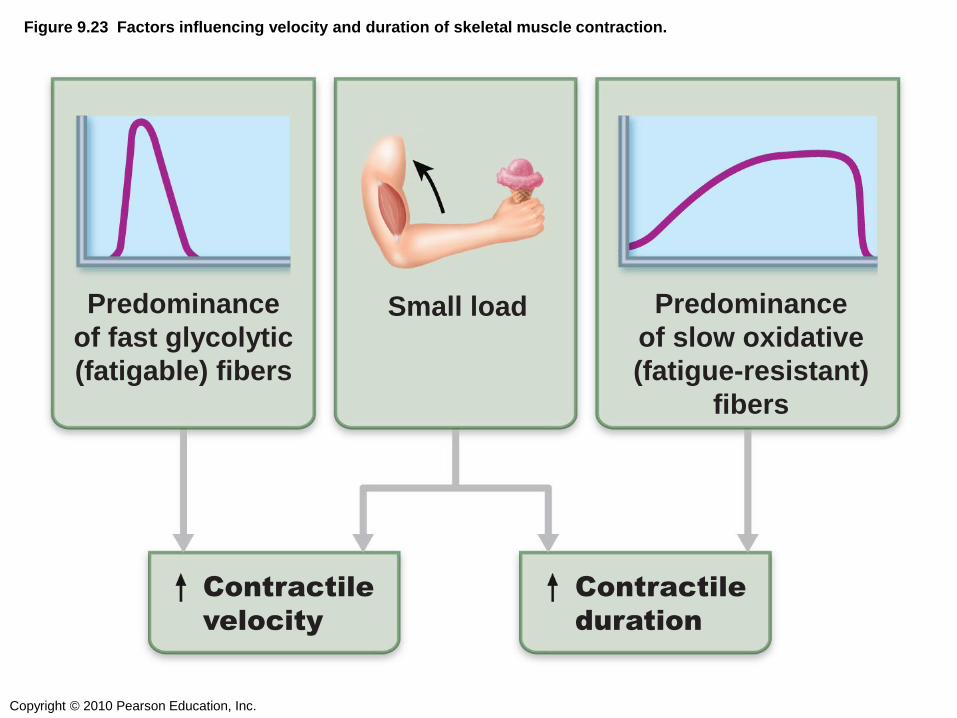
Figure 9.23 Factors influencing velocity and duration of skeletal muscle contraction.
Predominance
of fast glycolytic
(fatigable) fibers
Predominance
of slow oxidative
(fatigue-resistant)
fibers
Small load
Contractile
velocity
Contractile
duration

Copyright © 2010 Pearson Education, Inc.
Stimulus
Intermediate load
Light load
Heavy load
(a) The greater the load, the less the muscle
shortens and the shorter the duration of
contraction
(b) The greater the load, the
slower the contraction
Figure 9.25 Influence of load on contraction duration and velocity.

Copyright © 2010 Pearson Education, Inc.
Stimulus
Intermediate load
Light load
Heavy load
(a)The greater the load, the less the muscle
shortens and the shorter the duration of
contraction
Figure 9.25a Influence of load on contraction duration and velocity.
Copyright © 2010 Pearson Education, Inc.
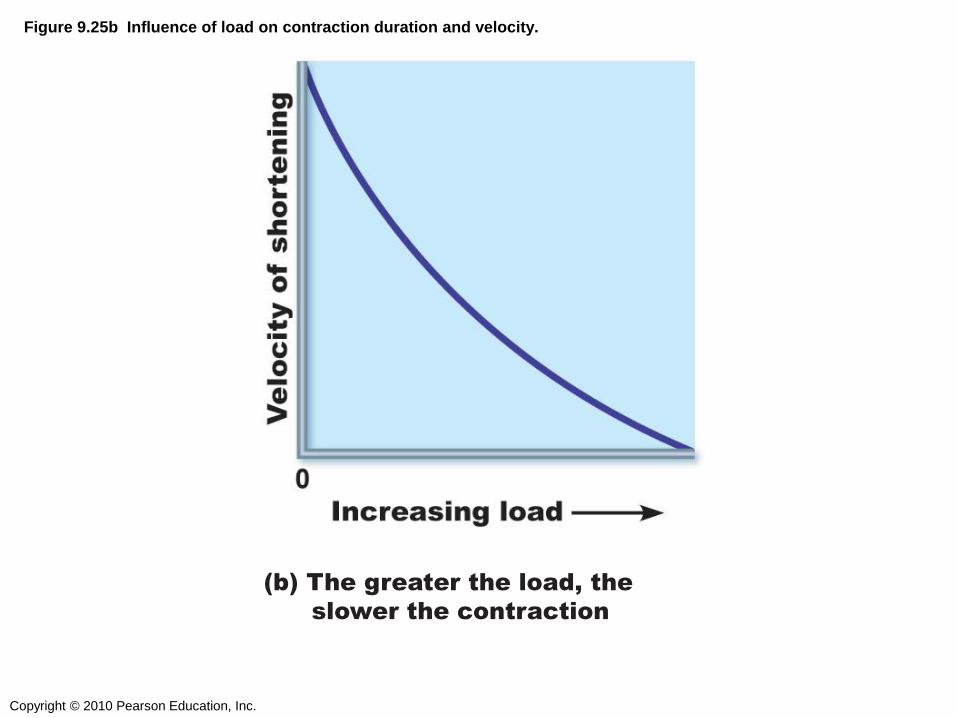
(b) The greater the load, the
slower the contraction
Figure 9.25b Influence of load on contraction duration and velocity.

SKELETAL MUSCLE:
EFFECT OF EXERCISE

SMOOTH MUSCLE:
MICROSCOPIC STRUCTURE

Copyright © 2010 Pearson Education, Inc.
Figure 9.26b Arrangement of smooth muscle in the walls of hollow organs.
Small intestine
(b) Cross section of the
intestine showing the
smooth muscle layers
(one circular and the other
longitudinal) running at right
angles to each other.
Mucosa
Longitudinal layer of
smooth muscle (shows
smooth muscle fibers in
cross section)
Circular layer of smooth
muscle (shows longitudinal
views of smooth muscle fibers)

Copyright © 2010 Pearson Education, Inc.
Figure 9.27 Innervation of smooth muscle.
Smooth
muscle
cell
Varicosities release
their neurotransmitters
into a wide synaptic
cleft (a diffuse junction).
Synaptic
vesicles
Mitochondrion
Autonomic
nerve fibers
innervate
most smooth
muscle fibers.
Varicosities

Copyright © 2010 Pearson Education, Inc.
Figure 9.28 Intermediate filaments and dense bodies of smooth muscle fibers harness the pull generated by myosin
cross bridges.
Intermediate
filament
Dense bodies Nucleus
Caveolae
(a) Relaxed smooth muscle fiber (note that adjacent fibers are connected by gap junctions)
(b) Contracted smooth muscle fiber
Dense bodies Nucleus
Gap junctions

In smooth muscle, instead of neurotransmitters
being released from axon terminals, they are
released from…
1) Caveolae
2) Varicosities
3) Gap junctions
4) All of the above

SMOOTH MUSCLE:
CONTRACTION

Copyright © 2010 Pearson Education, Inc.
Figure 9.29 Sequence of events in excitation-contraction coupling of smooth muscle.
Activated myosin forms cross
bridges with actin of the thin
filaments and shortening begins.
1
2
3
4
5
ATP
P i
P i
Extracellular fluid (ECF)
ADP
Ca2+
Ca2+
Ca2+
Plasma membrane
Sarcoplasmic
reticulum
Inactive calmodulin
Inactive kinase
Inactive
myosin molecule
Activated (phosphorylated)
myosin molecule
Activated kinase
Activated calmodulin
Cytoplasm
Calcium ions (Ca2+)
enter the cytosol from
the ECF via voltage-
dependent or voltage-
independent Ca2+
channels, or from
the scant SR.
Ca2+ binds to and
activates calmodulin.
Activated calmodulin
activates the myosin
light chain kinase
enzymes.
The activated kinase enzymes
catalyze transfer of phosphate
to myosin, activating the myosin
ATPases.
Thin
filament
Thick
filament

True or false: in smooth muscle, calcium ions
bind to tropomyosin to allow myosin to bind
to actin.
1) True
2) False

Copyright © 2010 Pearson Education, Inc.
Figure 9.30 Formation of a multinucleate skeletal muscle fiber by fusion of myoblasts.
Embryonic
mesoderm cells
Embryonic
mesoderm cells
undergo cell
division (to
increase number)
and enlarge.
Several
myoblasts
fuse together
to form a
myotube.
Myotube
matures into
skeletal muscle
fiber.
Myoblasts
Myotube
(immature
multinucleate
muscle fiber)
Satellite cell
Mature
Skeletal
muscle
fiber 1 2 3

Copyright © 2010 Pearson Education, Inc.
A Closer Look 9.1 Athletes Looking Good and Doing Better with Anabolic Steroids?
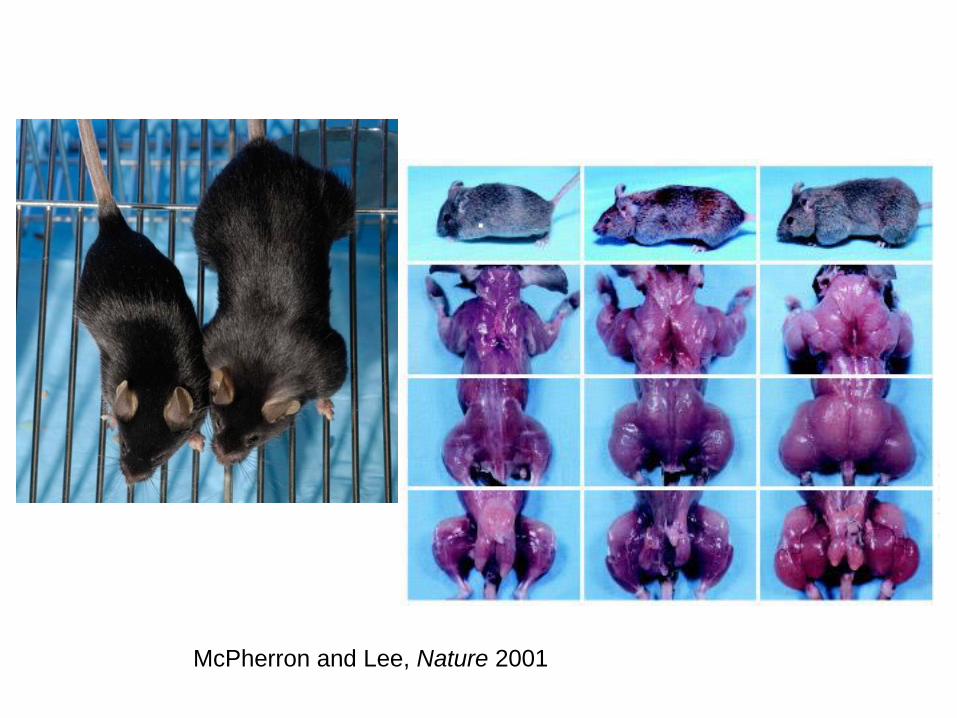
McPherron and Lee, Nature 2001