Chapter 8: SINUSODIAL FUNCTIONS · PDF fileChapter 8 Math 3201 4 Worksheet 8.1 Section 1:...
41
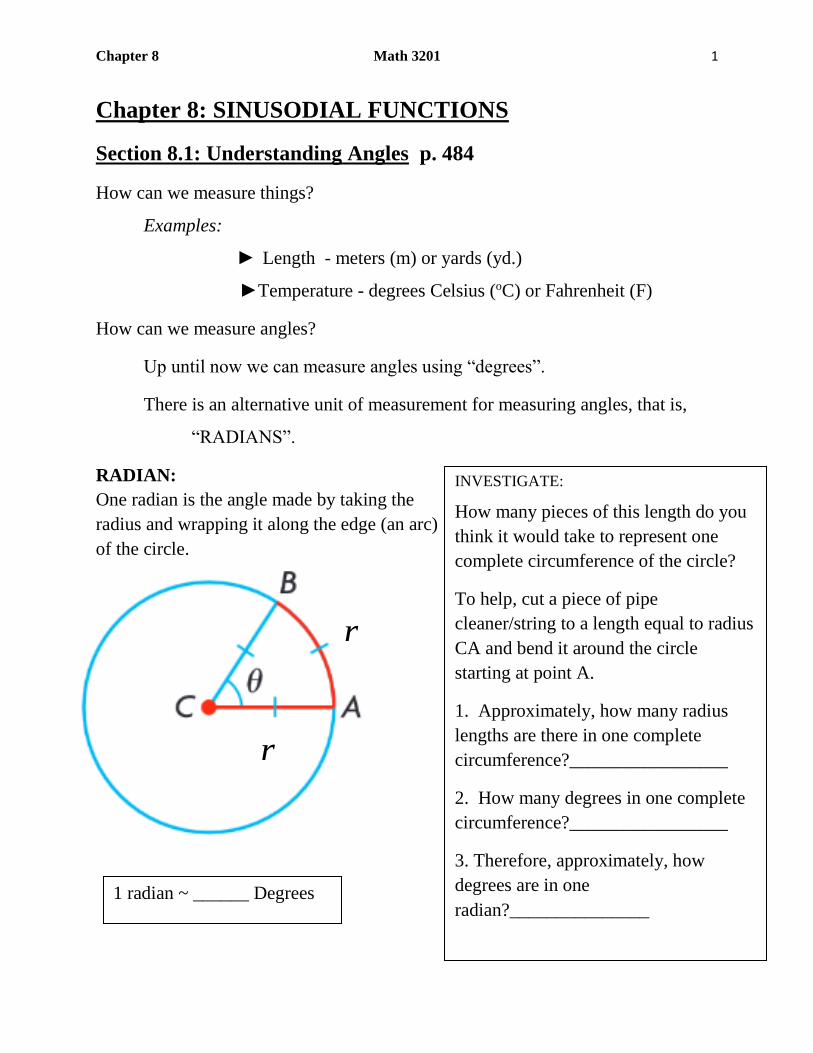
Chapter 8 Math 3201 1 Chapter 8: SINUSODIAL FUNCTIONS Section 8.1: Understanding Angles p. 484 How can we measure things? Examples: ► Length - meters (m) or yards (yd.) ►Temperature - degrees Celsius ( o C) or Fahrenheit (F) How can we measure angles? Up until now we can measure angles using “degrees”. There is an alternative unit of measurement for measuring angles, that is, “RADIANS”. RADIAN: One radian is the angle made by taking the radius and wrapping it along the edge (an arc) of the circle. INVESTIGATE: How many pieces of this length do you think it would take to represent one complete circumference of the circle? To help, cut a piece of pipe cleaner/string to a length equal to radius CA and bend it around the circle starting at point A. 1. Approximately, how many radius lengths are there in one complete circumference?_________________ 2. How many degrees in one complete circumference?_________________ 3. Therefore, approximately, how degrees are in one radian?_______________ 1 radian ~ ______ Degrees r r
Transcript of Chapter 8: SINUSODIAL FUNCTIONS · PDF fileChapter 8 Math 3201 4 Worksheet 8.1 Section 1:...
Chapter 8 Math 3201 1
Chapter 8: SINUSODIAL FUNCTIONS
Section 8.1: Understanding Angles p. 484
How can we measure things?
Examples:
► Length - meters (m) or yards (yd.)
►Temperature - degrees Celsius (oC) or Fahrenheit (F)
How can we measure angles?
Up until now we can measure angles using “degrees”.
There is an alternative unit of measurement for measuring angles, that is,
“RADIANS”.
RADIAN:
One radian is the angle made by taking the
radius and wrapping it along the edge (an arc)
of the circle.
INVESTIGATE:
How many pieces of this length do you
think it would take to represent one
complete circumference of the circle?
To help, cut a piece of pipe
cleaner/string to a length equal to radius
CA and bend it around the circle
starting at point A.
1. Approximately, how many radius
lengths are there in one complete
circumference?_________________
2. How many degrees in one complete
circumference?_________________
3. Therefore, approximately, how
degrees are in one
radian?_______________ 1 radian ~ ______ Degrees
r
r
Chapter 8 Math 3201 2
NOTE:1. The size of the radius of a circle has NO effect on the size of 1 radian.
2. The advantage of radians is that it is directly related to the radius of the
circle. This means that the units of the x and y axis is consistent and the
graph of the sine curve will have its true shape, without vertical
exaggeration.
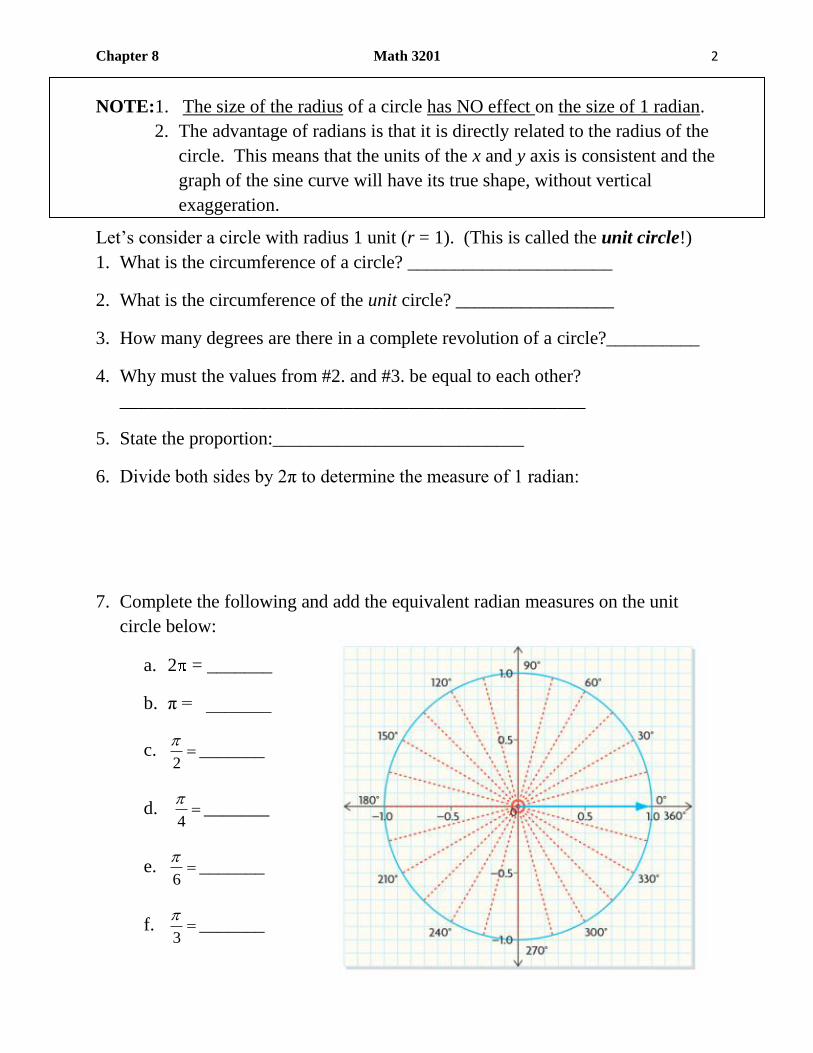
Let’s consider a circle with radius 1 unit (r = 1). (This is called the unit circle!)
1. What is the circumference of a circle? ______________________
2. What is the circumference of the unit circle? _________________
3. How many degrees are there in a complete revolution of a circle?__________
4. Why must the values from #2. and #3. be equal to each other?
__________________________________________________
5. State the proportion:___________________________
6. Divide both sides by 2π to determine the measure of 1 radian:
7. Complete the following and add the equivalent radian measures on the unit
circle below:
a. 2 = _______
b. π = _______
c. 2
_______
d. 4
_______
e. 6
_______
f. 3
_______
Chapter 8 Math 3201 3
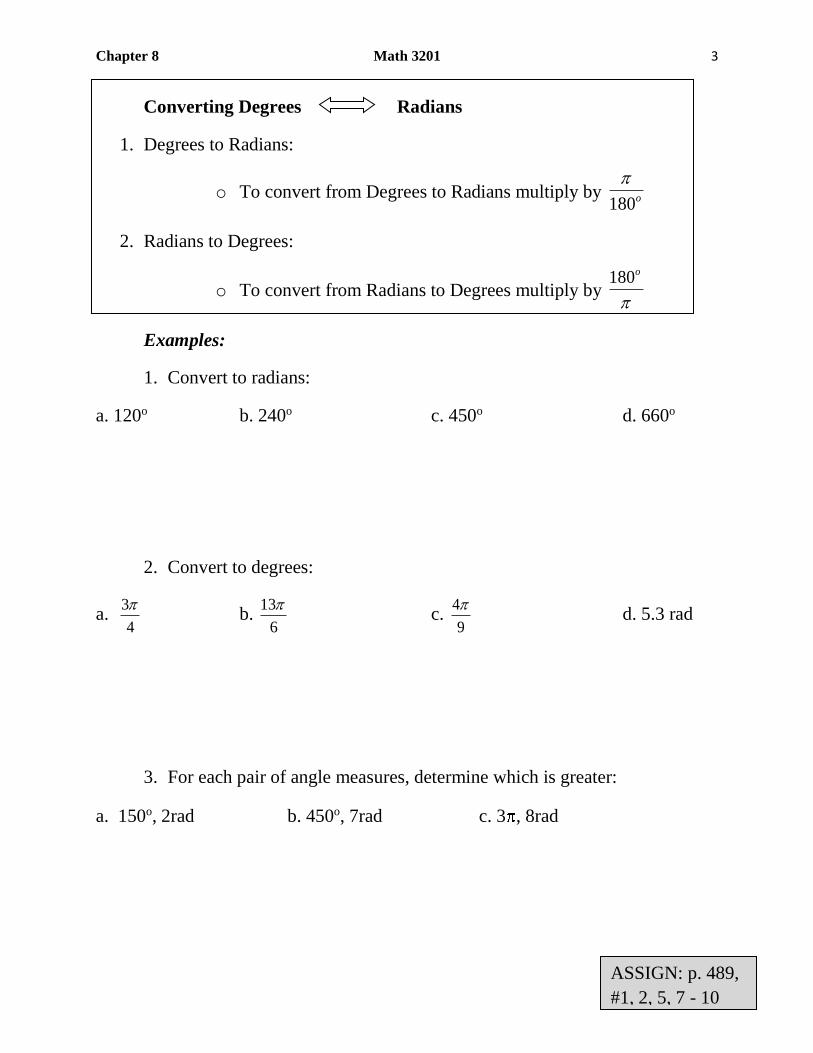
Converting Degrees Radians
1. Degrees to Radians:
o To convert from Degrees to Radians multiply by 180o
2. Radians to Degrees:
o To convert from Radians to Degrees multiply by 180o
Examples:
1. Convert to radians:
a. 120o b. 240o c. 450o d. 660o
2. Convert to degrees:
a. 3
4
b.
13
6
c.
4
9
d. 5.3 rad
3. For each pair of angle measures, determine which is greater:
a. 150o, 2rad b. 450o, 7rad c. 3 , 8rad
ASSIGN: p. 489,
#1, 2, 5, 7 - 10
Chapter 8 Math 3201 4
Worksheet 8.1
Section 1: Selected Response
1. What is the best estimate for 136° in radians?
A) 2.4 B) 0.7 C) 2.8 D) 3.1
2. What is 120° expressed in exact radians?
A) 3𝜋
2 B)
3𝜋
4 C)
3𝜋
8 D)
2𝜋
3
3. What is the best estimate for 0.1 radians in degrees?
A) 0.5° B) 1° C) 3° D) 6°
4. What is 5𝜋
8 expressed in degrees?
A) 112.5° B) 288° C) 900° D) 1440°
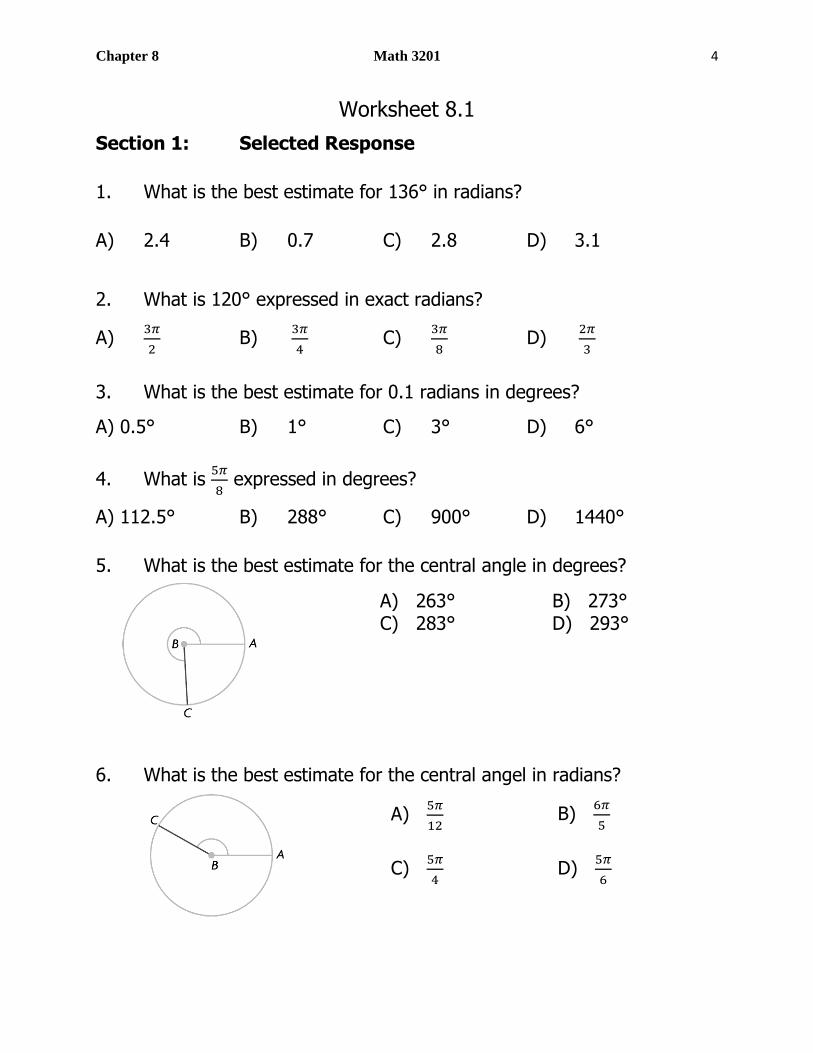
5. What is the best estimate for the central angle in degrees?
6. What is the best estimate for the central angel in radians?
A) 263° B) 273° C) 283° D) 293°
A) 5𝜋
12 B)
6𝜋
5
C) 5𝜋
4 D)
5𝜋
6
Chapter 8 Math 3201 5
7. Imagine that it is now 2 p.m. What time will it be when the minute
hand has rotated through 300°?
A) 2:40 B) 2:50 C) 3:00 D) 3:10
8. Imagine that it is now 2 p.m. What time will it be when the minute
hand has rotated through 7𝜋
4 radians?
Section 2: Constructed Response
Answer all of the following showing all work.
9. Eddie is facing west. What direction will he be facing if he rotates
235° to his right?
10. For the following pair of angle measures, determine which is greater
75° or 1
2𝜋 ?
ANSWERS
1. A 2. D 3. D 4. A 5. B 6. D 7. B 8. B 9. SE 10. 1
2𝜋
A) 2:20 B) 2:52
C) 3:15 D) 3:45

Chapter 8 Math 3201 6
Section 8.2: Exploring Graphs of Periodic Functions p. 491
Terms to Know:
Periodic
Function
A function whose graph repeats
in regular intervals or cycles.
Midline /
Sinusodial
Axis
The horizontal line halfway
between the maximum and
minimum values of a periodic
function.
Amplitude The distance from the midline to
either the maximum or minimum
value of a periodic function; the
amplitude is always expressed as
a positive number.
Period The length of the interval of the
domain to complete one cycle.
Sinusodial
Function
Any periodic function whose
graph has the same shape as that
of y = sinx.

Chapter 8 Math 3201 7
“Five Key Points”
x y
Section 8.2 “Exploration” Sine Graph
1. Complete the table of values below for the function siny
(DEGREE MODE)
0° 30° 60° 90° 120° 150° 180° 210° 240° 270° 300° 360°
y
390° 420° 450° 480° 510° 540° 570° 600° 630° 660° 690° 720°
y
2. Sketch the graph of siny on the graph below:
3. Complete the tables below by using the graph. If you wanted to quickly graph
the sine curve, which five points would allow you to easily graph the entire curve?
siny
Period
Sinusoidal Axis
(midline)
Amplitude
Domain
Range
Local Maximums
Local Minimums
x-intercepts
y-intercepts
x90 ° 180 ° 270 ° 360 ° 450 ° 540 ° 630 ° 720 °
y
- 2
- 1
1
2

Chapter 8 Math 3201 8
“Five Key Points”
x y
Section 8.2 “Exploration” Cosine Graph
1. Complete the table of values below for the function cosy
(DEGREE MODE)
0° 30° 60° 90° 120° 150° 180° 210° 240° 270° 300° 360°
y
390° 420° 450° 480° 510° 540° 570° 600° 630° 660° 690° 720°
y
2. Sketch the graph of cosy on the graph below:
3. Complete the tables below by using the graph. If you wanted to quickly graph
the cosine curve, which five points would allow you to easily graph the entire curve?
cosy
Period
Sinusoidal Axis
(midline)
Amplitude
Domain
Range
Local Maximums
Local Minimums
x-intercepts
y-intercepts
x90 ° 180 ° 270 ° 360 ° 450 ° 540 ° 630 ° 720 °
y
- 2
- 1
1
2
Chapter 8 Math 3201 9
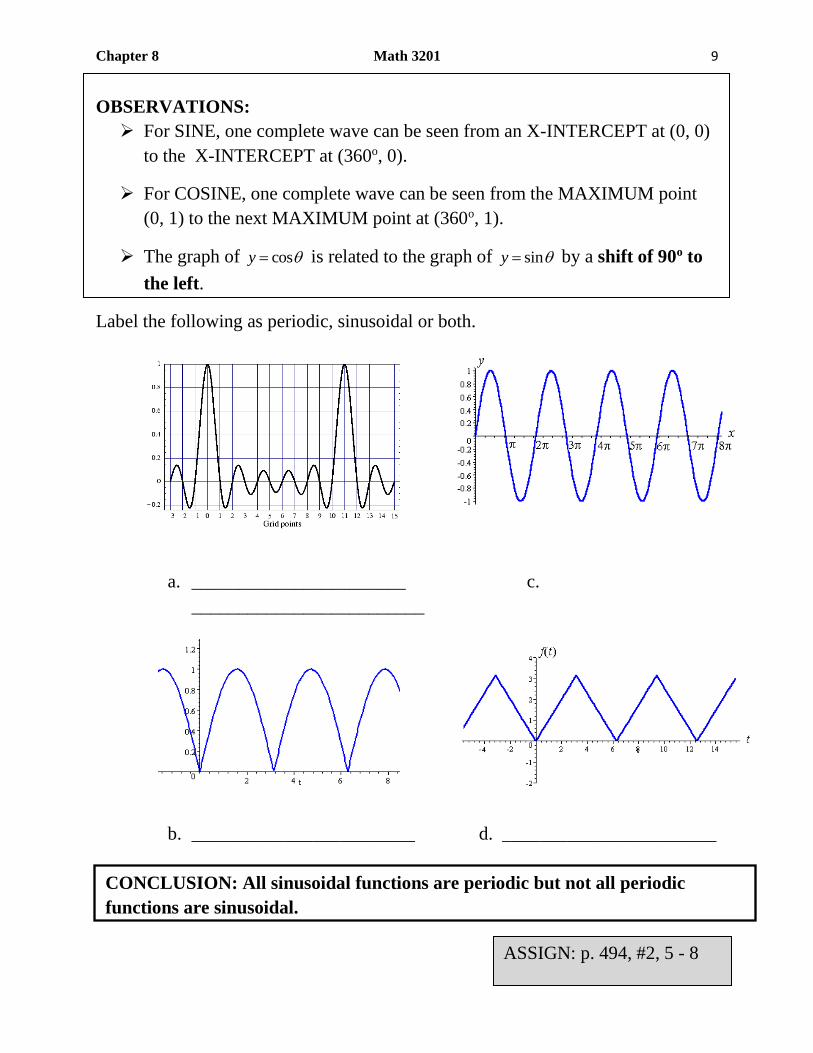
OBSERVATIONS:
For SINE, one complete wave can be seen from an X-INTERCEPT at (0, 0)
to the X-INTERCEPT at (360o, 0).
For COSINE, one complete wave can be seen from the MAXIMUM point
(0, 1) to the next MAXIMUM point at (360o, 1).
The graph of cosy is related to the graph of siny by a shift of 90o to
the left.
Label the following as periodic, sinusoidal or both.
a. _______________________ c.
_________________________
b. ________________________ d. _______________________
ASSIGN: p. 494, #2, 5 - 8
CONCLUSION: All sinusoidal functions are periodic but not all periodic
functions are sinusoidal.
Chapter 8 Math 3201 10
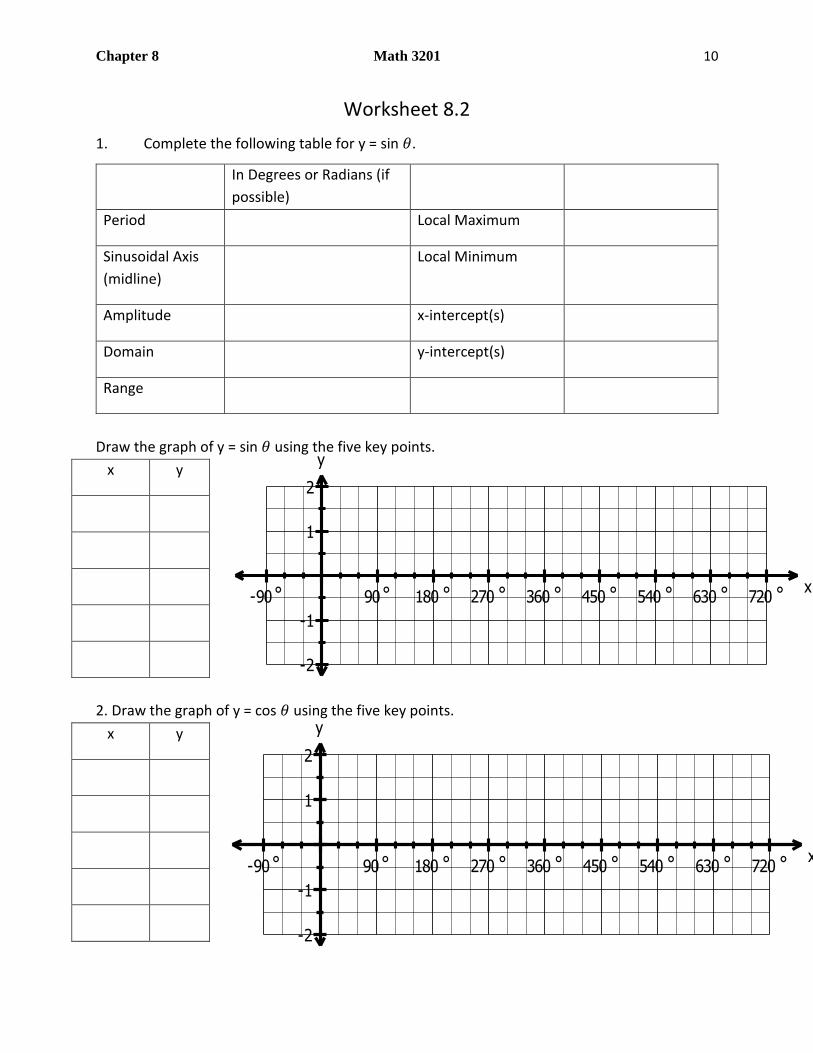
Worksheet 8.2
1. Complete the following table for y = sin 𝜃.
In Degrees or Radians (if
possible)
Period Local Maximum
Sinusoidal Axis
(midline)
Local Minimum
Amplitude x-intercept(s)
Domain y-intercept(s)
Range
Draw the graph of y = sin 𝜃 using the five key points.
x y
2. Draw the graph of y = cos 𝜃 using the five key points.
x y
x-90 ° 90 ° 180 ° 270 ° 360 ° 450 ° 540 ° 630 ° 720 °
y
-2
-1
1
2
x-90 ° 90 ° 180 ° 270 ° 360 ° 450 ° 540 ° 630 ° 720 °
y
-2
-1
1
2

Chapter 8 Math 3201 11
Section 8.3: The Graphs of Sinusoidal Functions p. 497
Equation of the midline: is the average of the maximum and minimum values:
𝑦 =𝑚𝑎𝑥𝑖𝑚𝑢𝑚 𝑣𝑎𝑙𝑢𝑒 + 𝑚𝑖𝑛𝑖𝑚𝑢𝑚 𝑣𝑎𝑙𝑢𝑒
2
Amplitude: is the positive vertical distance between the midline and either a
maximum or minimum value. It is also half of the vertical distance between a
maximum value and a minimum value.
𝐴𝑚𝑝𝑙𝑖𝑡𝑢𝑑𝑒 =𝑚𝑎𝑥𝑖𝑚𝑢𝑚 𝑣𝑎𝑙𝑢𝑒 − 𝑚𝑖𝑛𝑖𝑚𝑢𝑚 𝑣𝑎𝑙𝑢𝑒
2
Examples:
1. For the sinusoidal function shown, determine: (Example 1, p. 499)
a. Range:
b. Equation of Midline/Sinusoidal Axis:
c. Amplitude:
d. Period:

Chapter 8 Math 3201 12
2. For the sinusoidal function shown, determine: (Example 1, p. 499)
a. Range:
b. Equation of Midline/Sinusoidal Axis:
c. Amplitude:
d. Period:
3. While riding a Ferris
wheel, Mason’s height
above the ground
in terms of time
can be represented by the
following graph.
a. How far is the Ferris wheel off the ground? __________________________
b. What is the range of the function? What does it represent? _____________
________________________________________________________________
c. What is the height of the Ferris wheel? _____________________________
d. What is the equation of the midline? What does it represent? ____________
________________________________________________________________
e. How long does it take for the Ferris wheel to make one complete
revolution? What characteristic does this correspond to?
y
Chapter 8 Math 3201 13
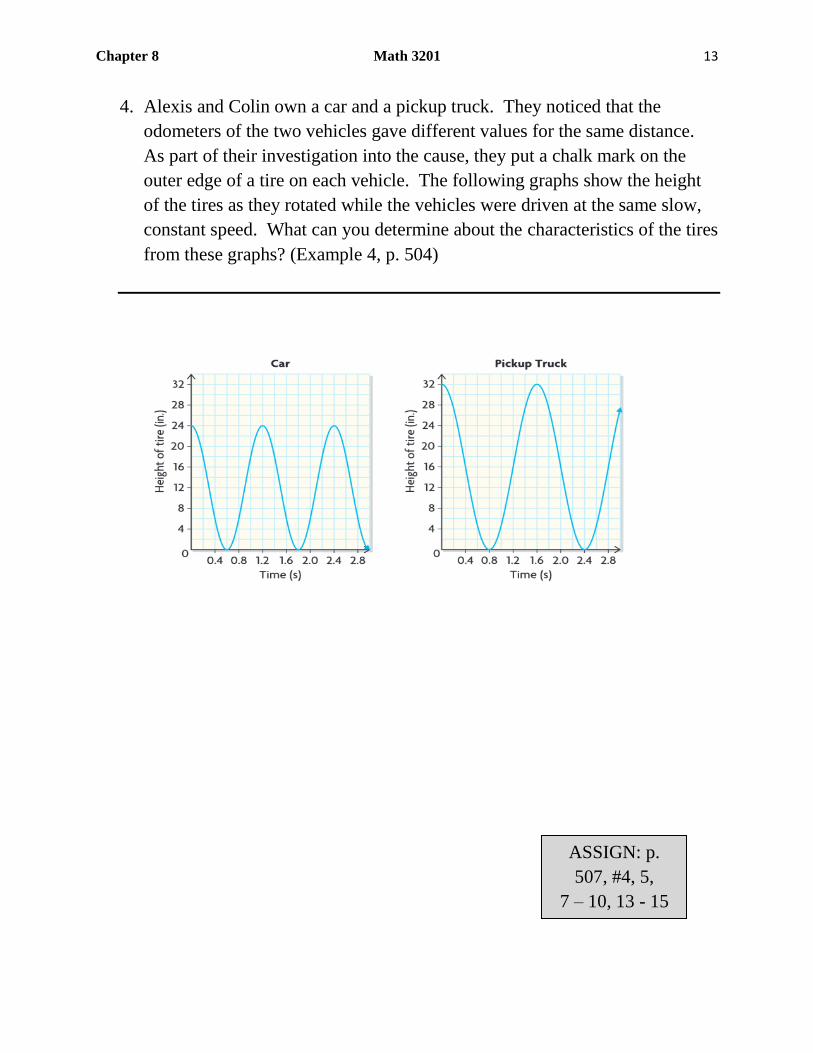
4. Alexis and Colin own a car and a pickup truck. They noticed that the
odometers of the two vehicles gave different values for the same distance.
As part of their investigation into the cause, they put a chalk mark on the
outer edge of a tire on each vehicle. The following graphs show the height
of the tires as they rotated while the vehicles were driven at the same slow,
constant speed. What can you determine about the characteristics of the tires
from these graphs? (Example 4, p. 504)
ASSIGN: p.
507, #4, 5,
7 – 10, 13 - 15

Chapter 8 Math 3201 14
Worksheet 8.3
1. What is the midline of the following graph?
2. What is the amplitude of the following graph?
3. What is the period of the following graph?
4. What is the range of the following graph?
5. A sinusoidal graph has an amplitude of 10 and a maximum at the
point (18, 5). What is the midline of the graph?
A) y = 0 B) y = -5 C) y = 13 D) y = 8
A) y = 2 B) y = 3
C) y = 4 D) y = 5
A) 2 B) 3
C) 4 D) 5
A) 120° B) 240°
C) 300° D) 360°
A) {𝑦|1 ≤ 𝑦 ≤ 5, 𝑦𝜖𝑅} B) {𝑦| − 2 ≤ 𝑦 ≤2, 𝑦𝜖𝑅}
C) {𝑦|0 ≤ 𝑦 ≤ 4, 𝑦𝜖𝑅} D) {𝑦| 𝑦𝜖𝑅}
Chapter 8 Math 3201 15
x- 90 ° 90 ° 180 ° 270 ° 360 ° 450 ° 540 ° 630 ° 720 ° 810 ° 900 ° 990 ° 1080 °
y
- 6
- 4
- 2
2
4
6
6. A sinusoidal graph has a maximum at the point (4, -8) and the next
minimum is at the point (7, -10). What is the period of the graph?
A) 2 B) 3 C) 4 D) 6
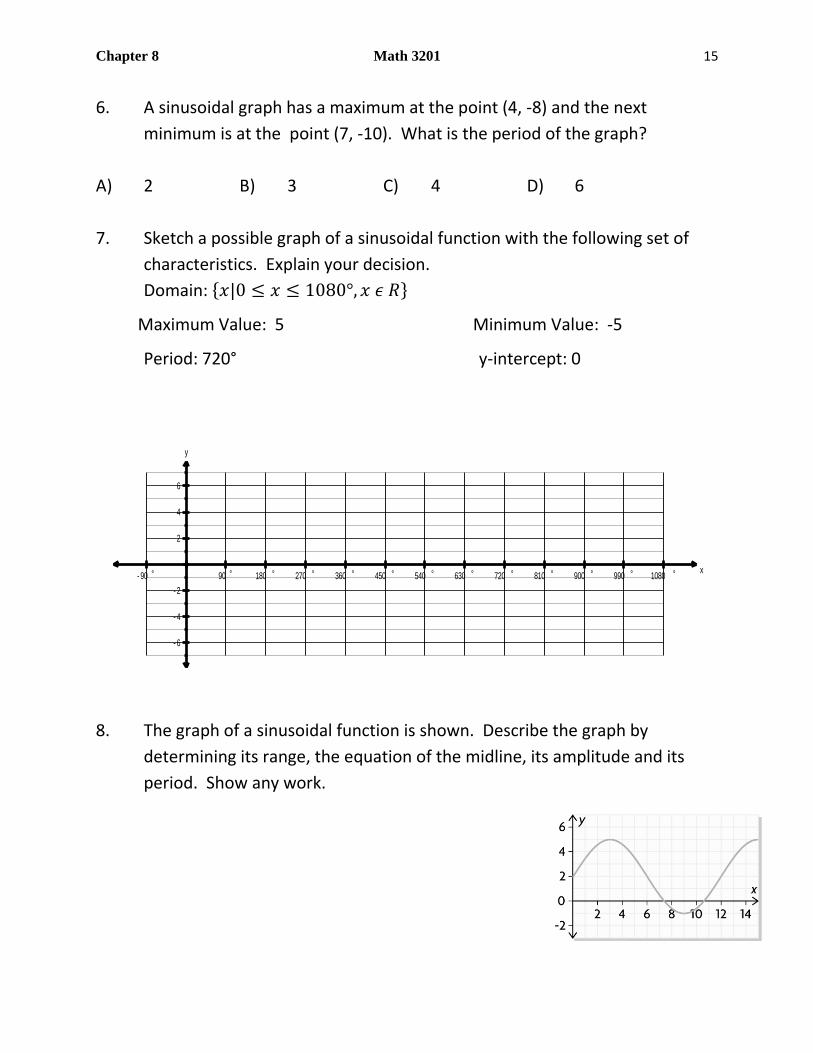
7. Sketch a possible graph of a sinusoidal function with the following set of
characteristics. Explain your decision.
Domain: {𝑥|0 ≤ 𝑥 ≤ 1080°, 𝑥 𝜖 𝑅}
Maximum Value: 5 Minimum Value: -5
Period: 720° y-intercept: 0
8. The graph of a sinusoidal function is shown. Describe the graph by
determining its range, the equation of the midline, its amplitude and its
period. Show any work.
Chapter 8 Math 3201 16
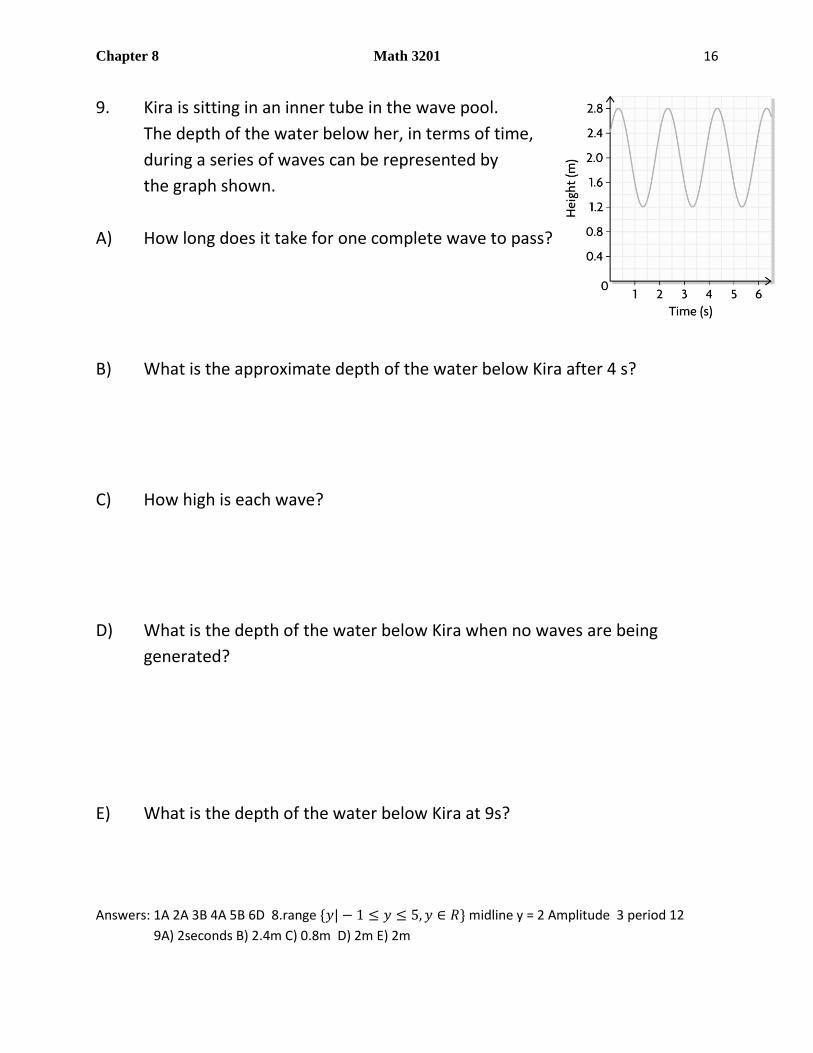
9. Kira is sitting in an inner tube in the wave pool.
The depth of the water below her, in terms of time,
during a series of waves can be represented by
the graph shown.
A) How long does it take for one complete wave to pass?
B) What is the approximate depth of the water below Kira after 4 s?
C) How high is each wave?
D) What is the depth of the water below Kira when no waves are being
generated?
E) What is the depth of the water below Kira at 9s?
Answers: 1A 2A 3B 4A 5B 6D 8.range {𝑦| − 1 ≤ 𝑦 ≤ 5, 𝑦 ∈ 𝑅} midline y = 2 Amplitude 3 period 12
9A) 2seconds B) 2.4m C) 0.8m D) 2m E) 2m
Chapter 8 Math 3201 17
Section 8.4: The Equations of Sinusoidal Functions p. 516
INVESTIGATION:
Using technology, we will explore how the parameters a, b, c and d affect the
graph of sinusoidal functions written in the form:
sin ( )y a b x c d and cos ( )y a b x c d
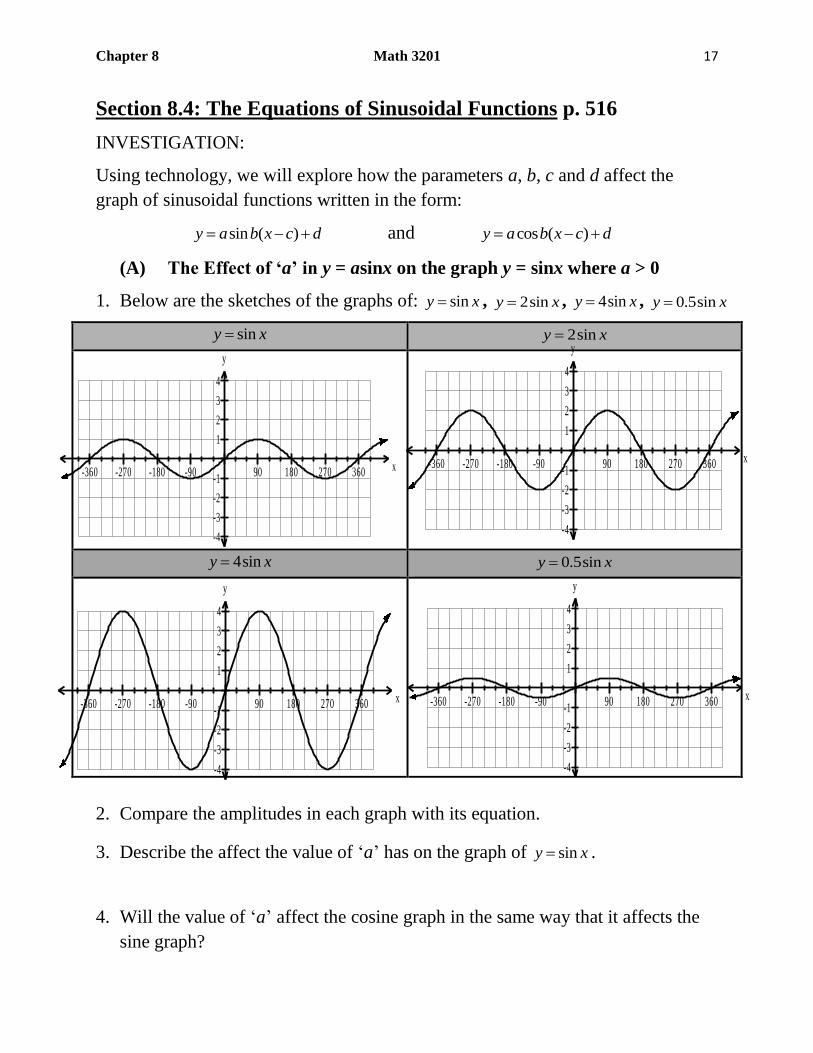
(A) The Effect of ‘a’ in y = asinx on the graph y = sinx where a > 0
1. Below are the sketches of the graphs of: siny x , 2siny x , 4siny x , 0.5siny x
siny x 2siny x
4siny x 0.5siny x
2. Compare the amplitudes in each graph with its equation.
3. Describe the affect the value of ‘a’ has on the graph of siny x .
4. Will the value of ‘a’ affect the cosine graph in the same way that it affects the
sine graph?
x-360 -270 -180 -90 90 180 270 360
y
-4
-3
-2
-1
1
2
3
4
x-360 -270 -180 -90 90 180 270 360
y
-4
-3
-2
-1
1
2
3
4
x-360 -270 -180 -90 90 180 270 360
y
-4
-3
-2
-1
1
2
3
4
x-360 -270 -180 -90 90 180 270 360
y
-4
-3
-2
-1
1
2
3
4
Chapter 8 Math 3201 18
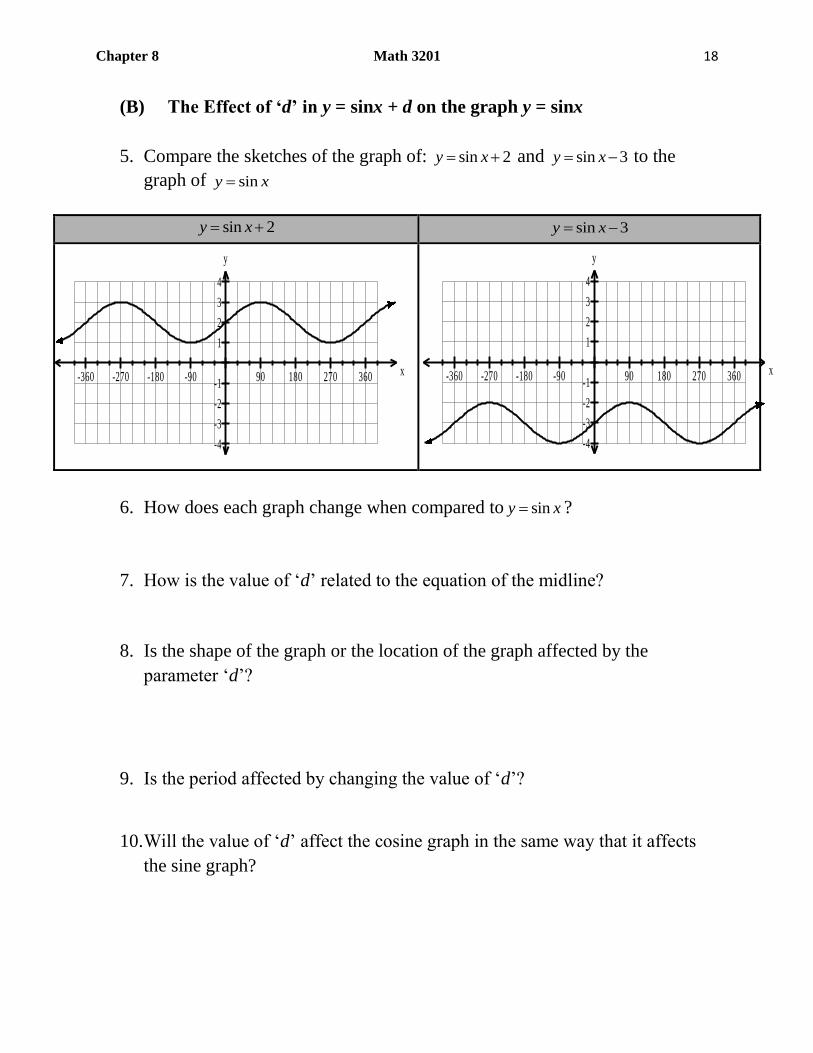
(B) The Effect of ‘d’ in y = sinx + d on the graph y = sinx
5. Compare the sketches of the graph of: sin 2y x and sin 3y x to the
graph of siny x
sin 2y x sin 3y x
6. How does each graph change when compared to siny x ?
7. How is the value of ‘d’ related to the equation of the midline?
8. Is the shape of the graph or the location of the graph affected by the
parameter ‘d’?
9. Is the period affected by changing the value of ‘d’?
10. Will the value of ‘d’ affect the cosine graph in the same way that it affects
the sine graph?
x-360 -270 -180 -90 90 180 270 360
y
-4
-3
-2
-1
1
2
3
4
x-360 -270 -180 -90 90 180 270 360
y
-4
-3
-2
-1
1
2
3
4
Chapter 8 Math 3201 19
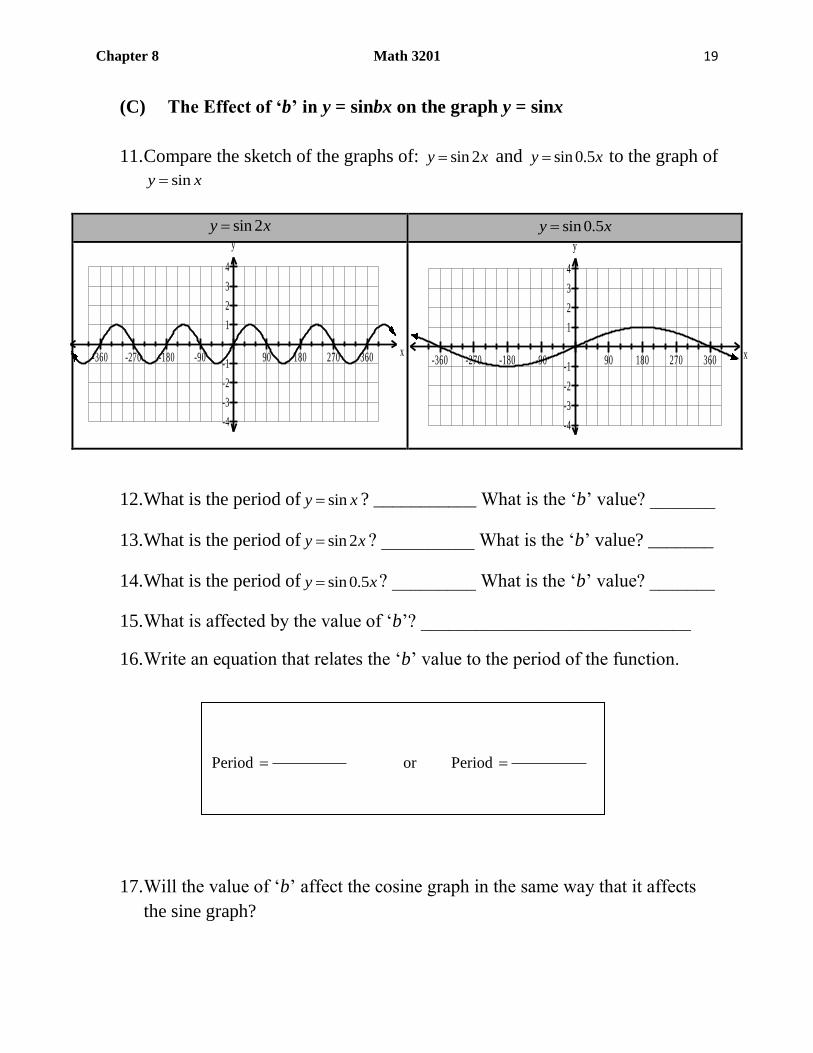
(C) The Effect of ‘b’ in y = sinbx on the graph y = sinx
11. Compare the sketch of the graphs of: sin 2y x and sin 0.5y x to the graph of
siny x
sin 2y x sin 0.5y x
12. What is the period of siny x ? ___________ What is the ‘b’ value? _______
13. What is the period of sin 2y x ? __________ What is the ‘b’ value? _______
14. What is the period of sin 0.5y x ? _________ What is the ‘b’ value? _______
15. What is affected by the value of ‘b’? _____________________________
16. Write an equation that relates the ‘b’ value to the period of the function.
17. Will the value of ‘b’ affect the cosine graph in the same way that it affects
the sine graph?
Period or Period
x-360 -270 -180 -90 90 180 270 360
y
-4
-3
-2
-1
1
2
3
4
x-360 -270 -180 -90 90 180 270 360
y
-4
-3
-2
-1
1
2
3
4
Chapter 8 Math 3201 20
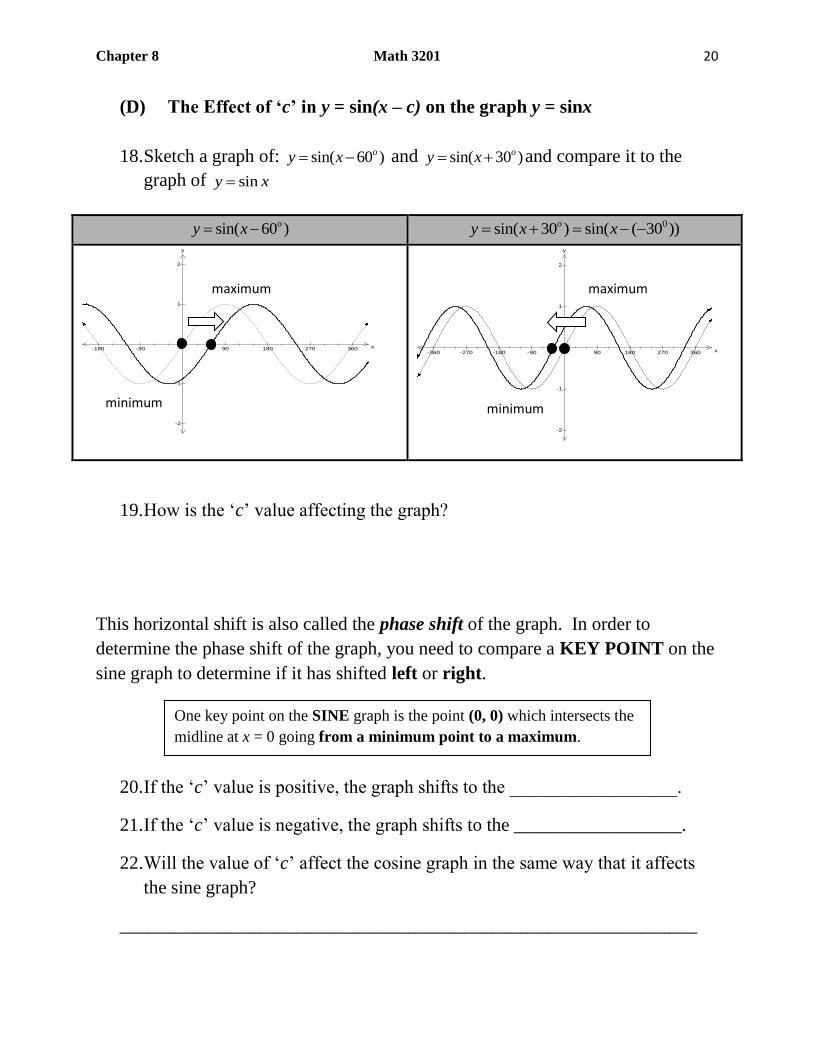
(D) The Effect of ‘c’ in y = sin(x – c) on the graph y = sinx
18. Sketch a graph of: sin( 60 )oy x and sin( 30 )oy x and compare it to the
graph of siny x
sin( 60 )oy x 0sin( 30 ) sin( ( 30 ))oy x x
x-180 -90 90 180 270 360
y
-2
-1
1
2
x-360 -270 -180 -90 90 180 270 360
y
-2
-1
1
2
19. How is the ‘c’ value affecting the graph?
This horizontal shift is also called the phase shift of the graph. In order to
determine the phase shift of the graph, you need to compare a KEY POINT on the
sine graph to determine if it has shifted left or right.
20. If the ‘c’ value is positive, the graph shifts to the __________________.
21. If the ‘c’ value is negative, the graph shifts to the __________________.
22. Will the value of ‘c’ affect the cosine graph in the same way that it affects
the sine graph?
______________________________________________________________
maximum
minimum
maximum
minimum
One key point on the SINE graph is the point (0, 0) which intersects the
midline at x = 0 going from a minimum point to a maximum.
Chapter 8 Math 3201 21
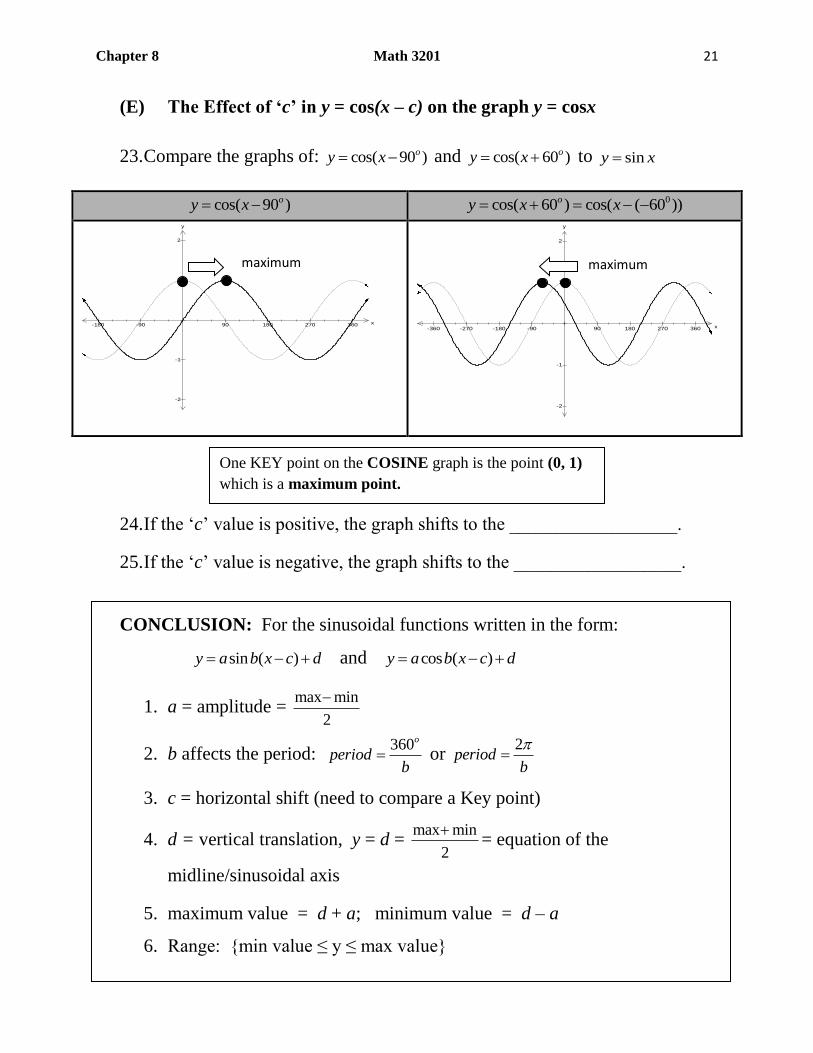
(E) The Effect of ‘c’ in y = cos(x – c) on the graph y = cosx
23. Compare the graphs of: cos( 90 )oy x and cos( 60 )oy x to siny x
cos( 90 )oy x 0cos( 60 ) cos( ( 60 ))oy x x
x-180 -90 90 180 270 360
y
-2
-1
1
2
x-360 -270 -180 -90 90 180 270 360
y
-2
-1
1
2
24. If the ‘c’ value is positive, the graph shifts to the __________________.
25. If the ‘c’ value is negative, the graph shifts to the __________________.
CONCLUSION: For the sinusoidal functions written in the form:
sin ( )y a b x c d and cos ( )y a b x c d
1. a = amplitude = max min
2
2. b affects the period: 360o
periodb
or 2
periodb
3. c = horizontal shift (need to compare a Key point)
4. d = vertical translation, y = d = max min
2
= equation of the
midline/sinusoidal axis
5. maximum value = d + a; minimum value = d – a
6. Range: {min value ≤ y ≤ max value}
maximum maximum
One KEY point on the COSINE graph is the point (0, 1)
which is a maximum point.
Chapter 8 Math 3201 22
NOTE: Beware of the brackets! cos( 2)y x versus cos 2y x
cos( 2)y x results in a horizontal translation
cos 2y x results in a vertical translation
Examples:
1. For the function, 2cos4 1y x , state: (Example 1, p. 518)
a. amplitude:
b. equation of the midline:
c. range:
d. period:
e. phase shift:
2. For the function, 3sin 2( 45 )oy x , state: (Example 2, p.519)
a. amplitude:
b. equation of the midline:
c. range:
d. period:
e. phase shift:
f. How would the graph of 3cos2( 45 )oy x be the same? How would it
be different?
Chapter 8 Math 3201 23
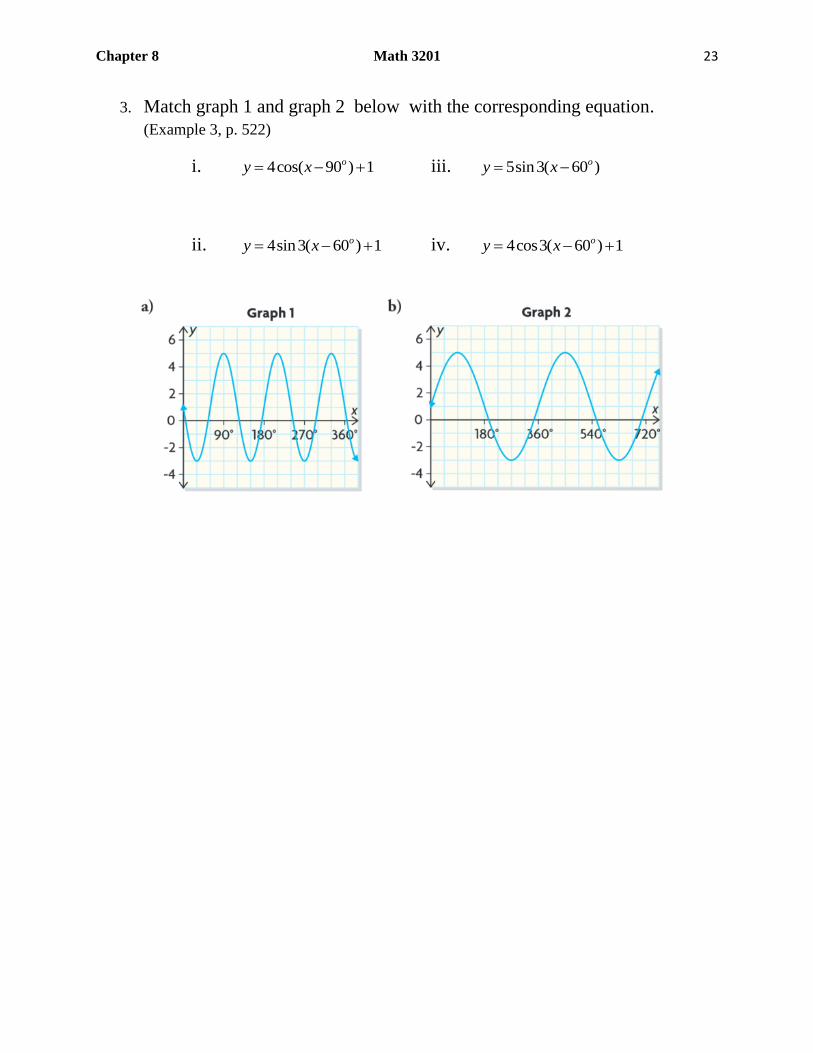
3. Match graph 1 and graph 2 below with the corresponding equation.
(Example 3, p. 522)
i. 4cos( 90 ) 1oy x iii. 5sin3( 60 )oy x
ii. 4sin3( 60 ) 1oy x iv. 4cos3( 60 ) 1oy x

Chapter 8 Math 3201 24
x90 ° 180 ° 270 ° 360 ° 450 ° 540 ° 630 ° 720 °
y
- 5
- 4
- 3
- 2
- 1
1
2
3
4
5
x90 ° 180 ° 270 ° 360 ° 450 ° 540 ° 630 ° 720 °
y
- 5
- 4
- 3
- 2
- 1
1
2
3
4
5
4. Ashley created the following graph for the equation 3sin( 90 ) 2oy x .
Identify her error(s) and construct the correct graph.
Chapter 8 Math 3201 25
5. The temperature of an air-conditioned home on a hot day can be modeled
using the function, 𝑓(𝑥) = 1.5 cos 4𝑥 + 20 ,where x is the time in minutes
after the air conditioner turns on and t(x) is the temperature in degrees
Celsius.
a. What are the maximum and minimum temperatures in the home?
b. What is the temperature 10 minutes after the air conditioner has been
turned on?
c. What is the period of the function? Interpret this value in this
context?
Chapter 8 Math 3201 26
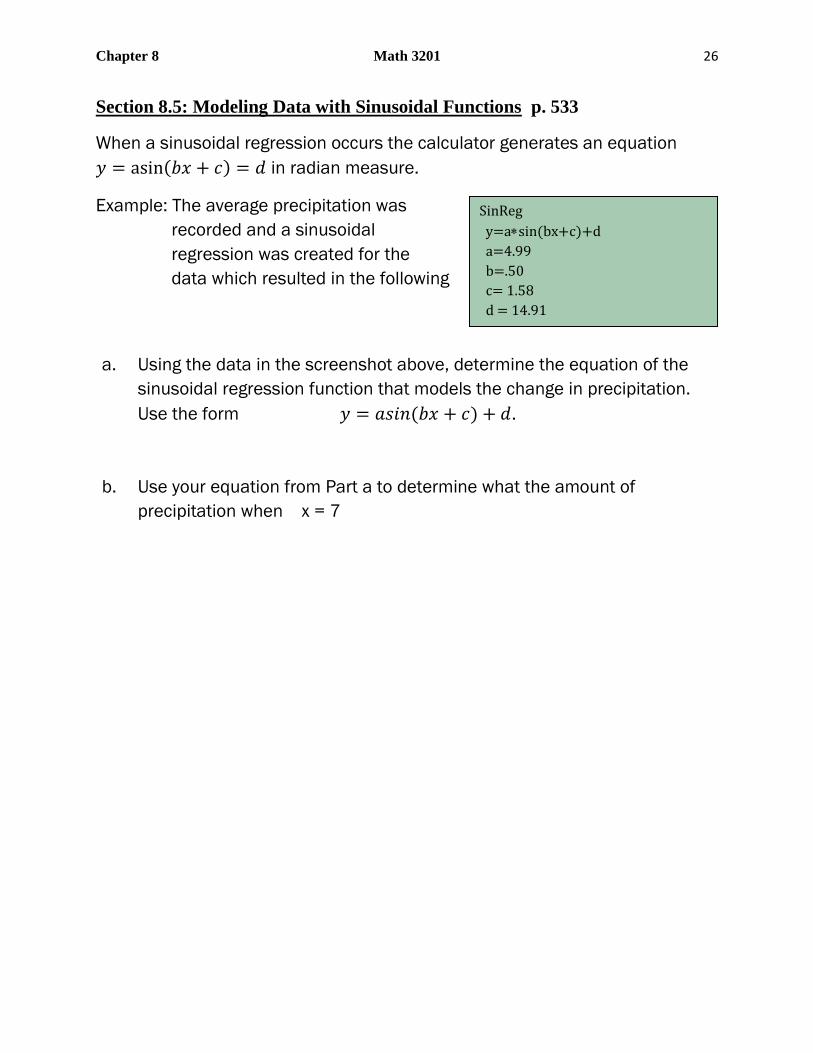
Section 8.5: Modeling Data with Sinusoidal Functions p. 533
When a sinusoidal regression occurs the calculator generates an equation
𝑦 = asin(𝑏𝑥 + 𝑐) = 𝑑 in radian measure.
Example: The average precipitation was
recorded and a sinusoidal
regression was created for the
data which resulted in the following
a. Using the data in the screenshot above, determine the equation of the
sinusoidal regression function that models the change in precipitation.
Use the form 𝑦 = 𝑎𝑠𝑖𝑛(𝑏𝑥 + 𝑐) + 𝑑.
b. Use your equation from Part a to determine what the amount of
precipitation when x = 7
SinReg
y=asin(bx+c)+d
a=4.99
b=.50
c= 1.58
d = 14.91
Chapter 8 Math 3201 27
Unit 8: Sinusoidal Functions
Worksheet 8.4
Section 1: Selected Response
1. Which function below has the greatest amplitude?
A) y = 2 sin 3(x + 90°) + 5 B) y = 3 sin 2(x - 90°) – 3
C) y = 1
3 sin (x + 90°) – 1 D) y = sin 0.5(x - 90°)
2. Which function has the greatest period?
A) y = 2 sin 3(x + 90°) + 5 B) y = 3 sin 2(x - 90°) – 3
C) y = 1
3 sin (x + 90°) – 1 D) y = sin 0.5(x - 90°)
3. Which function has the greatest maximum value?
A) y = 2 sin 3(x + 90°) + 5 B) y = 3 sin 2(x - 90°) – 3
C) y = 1
3 sin (x + 90°) – 1 D) y = sin 0.5(x - 90°)
4. What is the amplitude for the following function: y = 3 sin 2(x + 90°) – 1
A) 2 B) 3 C) 4 D) 5
5. What is the period for the following function: y = cos 1
3x + 12
A) 180° B) 360° C) 720° D) 1080°
6. What is the midline of the following function: y = 0.5 sin(x -2)
A) y = -2 B) y = 0.5 C) y = 0 D) y = 2
7. What is the range of the following function: y = 3 sin 2(x + 90°) – 1
A) {𝑦| − 3 ≤ 𝑦 ≤ 3, 𝑦 𝜖𝑅} B) {𝑦| − 2 ≤ 𝑦 ≤ 4, 𝑦 𝜖𝑅}
C) {𝑦| − 4 ≤ 𝑦 ≤ 2, 𝑦 𝜖𝑅} D) {𝑦| 𝑦 𝜖𝑅}
Chapter 8 Math 3201 28
x2 4 6 8 10 12 14 16 18 20 22 24
y
- 6
- 4
- 2
2
4
6
8. What is the domain of the following function: y = 0.5 sin(x – 2)
A) {𝑥| − 3 ≤ 𝑥 ≤ −1, 𝑥 𝜖𝑅} B) {𝑥| − 0.5 ≤ 𝑥 ≤ 0.5, 𝑥 𝜖𝑅}
C) {𝑥| − 2 ≤ 𝑥 ≤ 2, 𝑥 𝜖𝑅} D) {𝑥| 𝑥 𝜖 𝑅}
Section 2: Constructed Response
1. What is the amplitude of the following function: y = 2
5cos(𝑥 − 𝜋)
2. What is the midline of the following function: y = 5 sin 1.5(x + 60°) – 5
3. What is the range of the following function: y = 10 cos 4(x - 180°) + 2
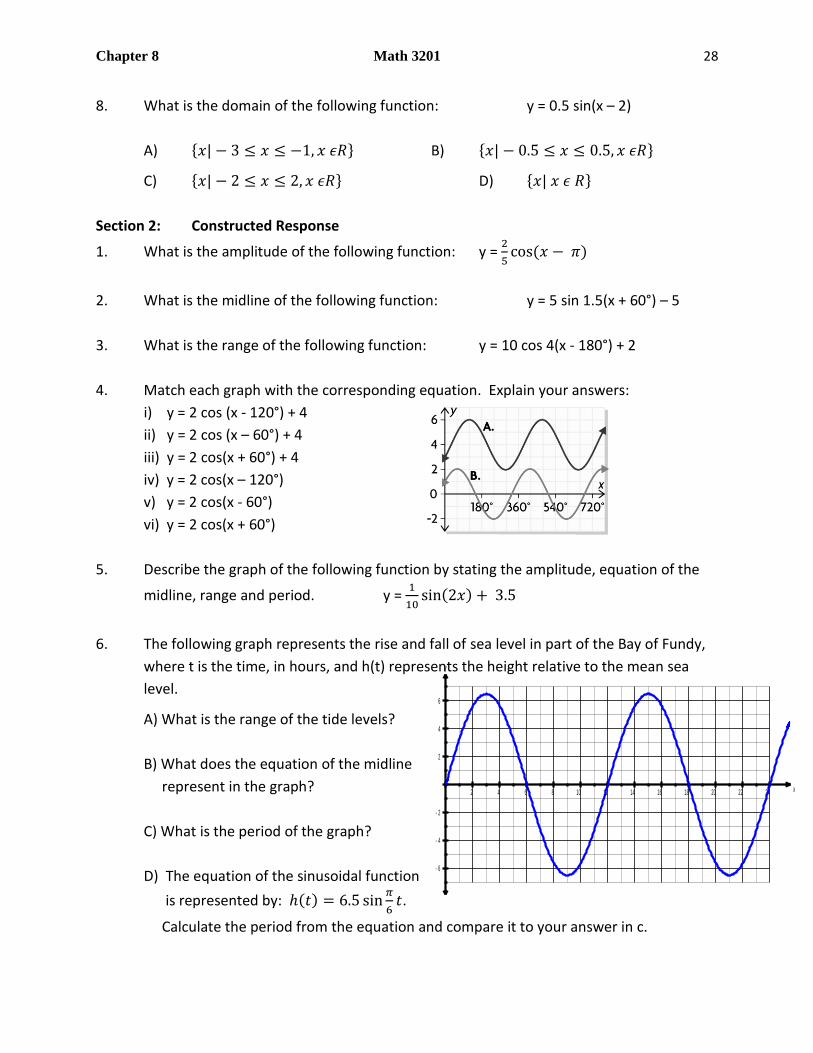
4. Match each graph with the corresponding equation. Explain your answers:
i) y = 2 cos (x - 120°) + 4
ii) y = 2 cos (x – 60°) + 4
iii) y = 2 cos(x + 60°) + 4
iv) y = 2 cos(x – 120°)
v) y = 2 cos(x - 60°)
vi) y = 2 cos(x + 60°)
5. Describe the graph of the following function by stating the amplitude, equation of the
midline, range and period. y = 1
10sin(2𝑥) + 3.5
6. The following graph represents the rise and fall of sea level in part of the Bay of Fundy,
where t is the time, in hours, and h(t) represents the height relative to the mean sea
level.
A) What is the range of the tide levels?
B) What does the equation of the midline
represent in the graph?
C) What is the period of the graph?
D) The equation of the sinusoidal function
is represented by: ℎ(𝑡) = 6.5 sin𝜋
6𝑡.
Calculate the period from the equation and compare it to your answer in c.
Chapter 8 Math 3201 29
7. The temperature of an air-conditioned home on a hot day can be modelled using the
function 𝑡(𝑥) = 2.5𝑠𝑖𝑛 (𝜋
6𝑥) + 25, where x is the time in hours after the air
conditioner turns on and t(x) is the temperature in degrees Celsius.
A) What are the maximum and minimum temperatures in the home?
B) What is the temperature 20 hours after the air conditioner has been turned on?
C) What is the period of the function? How would you interpret this value in this
context?
Answers: SECTION 1:1B 2D 3A 4B 5D 6C 7C 8D
SECTION 2: 1. 2
5 2. y = -5 3. {𝑦| − 8 ≤ 𝑦 ≤ 12, 𝑦 ∈ 𝑅} 4. i) A v) B 5. Amplitude
1
10 midline y
= 3.5 range {𝑦|3.4 ≤ 𝑦 ≤ 3.6, 𝑦 ∈ 𝑅} period 180o 6.A) {𝑦| − 6.5 ≤ 𝑦 ≤ 6.5, 𝑦 ∈ 𝑅} B) y = 0
when the water is calm. C) 12hours D) period 12 same 7. A) max 27.5 min 22.5 B) 22.8 C) 12
Chapter 8 Math 3201 30
Chapter 8 REVIEW
Section 1: Multiple Choice
1) What is 3
10
radians in degrees?
(A) 30 (B) 54 (C) 108 (D) 600
2) What is 5
3
radians in degrees?
(A) 6 (B) 180 (C) 300 (D) 600
3) What is 2.4 radians in degrees?
(A) 24 (B) 138 (C) 275 (D) 432
4) What is 240 in radians?
(A) 3
2
(B) 2 (C) 3 (D)
4
3
5) What is 230 in radians?
(A) 0.4 (B) 1.3 (C) 4.0 (D) 722.6
6) What is the domain of the function siny x ?
(A) | 0,x x x R (B) | 0,x x x R
(C) |x x R (D) | 1,x x x R
7) What is the domain of the function 2cos 3y x ?
(A) | 2,x x x R (B) | 3,x x x R
(B) | 0,x x x R (D) |x x R
8) What is the range of cosy x ?
(A) | y Ry (B) | 1 y 1,y Ry
(C) | 1 y 1,y Ry (D) | 0y y
Chapter 8 Math 3201 31
x- 5 - 4 - 3 - 2 - 1 1 2 3 4 5
y
- 5- 4- 3- 2- 1
12345
x180 360
y
- 6
- 4
- 2
x- 5 - 4 - 3 - 2 - 1 1 2 3 4 5
y
- 5- 4- 3- 2- 1
12345
x- 5 - 4 - 3 - 2 - 1 1 2 3 4 5
y
- 5- 4- 3- 2- 1
12345
9) What is the range of siny x ?
(A) | y Ry (B) | 1 y 1,y Ry
(C) | 1 y 1,y Ry (D) | 0y y
10) Which is an intx of cosy x ?
(A) 0 (B) 90 (C) 180 (D) 360
11) Which is an intx of siny x ?
(A) 0 (B) 90 (C) 270 (D) 300
12) How can the graph of cosy x be translated so that we get the graph of
siny x ?
(A) 90 to the left (B) 90 to the right
(C) 45 to the left (D) 45 to the right
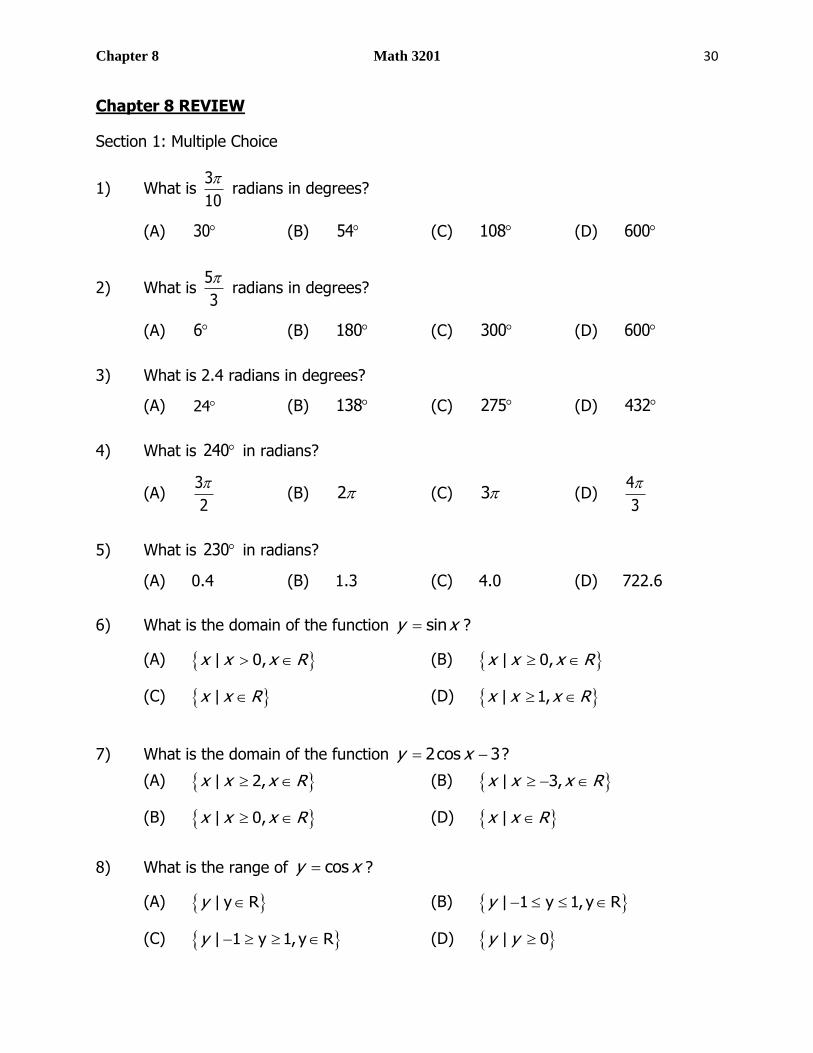
13) Which graph is periodic?
(A) (B)
(C) (D)
Chapter 8 Math 3201 32
x60 ° 120 ° 180 ° 240 ° 300 ° 360 °
y
- 8
- 7
- 6
- 5
- 4
- 3
- 2
- 1
1
2
x- 5 - 4 - 3 - 2 - 1 1 2 3 4 5
y
- 5
- 4
- 3
- 2
- 1
1
2
3
4
5
x- 5 - 4 - 3 - 2 - 1 1 2 3 4 5
y
- 5
- 4
- 3
- 2
- 1
1
2
3
4
5
x- 5 - 4 - 3 - 2 - 1 1 2 3 4 5
y
- 5
- 4
- 3
- 2
- 1
1
2
3
4
5
x- 5 - 4 - 3 - 2 - 1 1 2 3 4 5
y
- 5
- 4
- 3
- 2
- 1
1
2
3
4
5
x90 ° 180 ° 270 ° 360 °
y
- 1
1
2
3
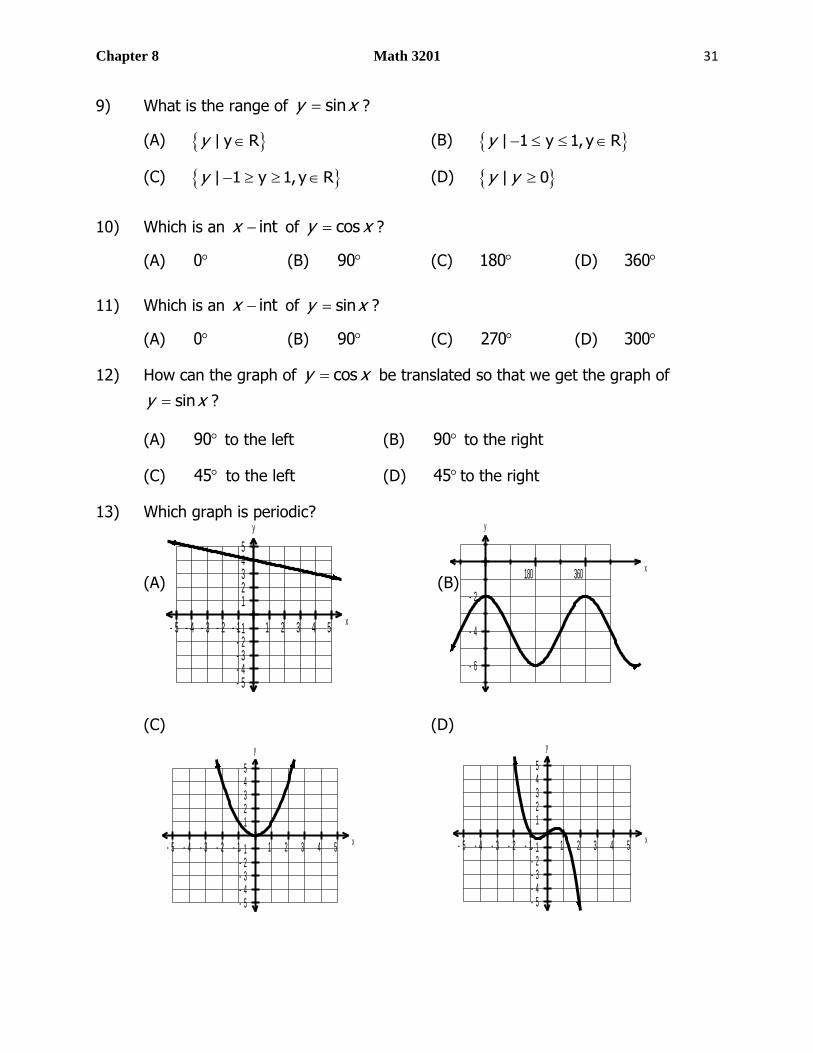
14) Which graph is sinusoidal?
(A) (B)
(C) (D)
15) What is the equation of the midline for the graph shown?
(A) 2y
(B) 3y
(C) 4y
(D) 6y
16) What is the equation of the midline for the graph shown?
(A) 1.5y
(B) 1y
(C) 0.75y
(D) 0.5y

Chapter 8 Math 3201 33
x60 ° 120 ° 180 ° 240 ° 300 ° 360 °
y
- 8
- 7
- 6
- 5
- 4
- 3
- 2
- 1
1
2
x90 ° 180 ° 270 ° 360 °
y
- 1
1
2
3
x60 ° 120 ° 180 ° 240 ° 300 ° 360 °
y
- 8
- 7
- 6
- 5
- 4
- 3
- 2
- 1
1
2
x90 ° 180 ° 270 ° 360 °
y
- 1
1
2
3
17) What is the amplitude for the graph shown?
(A) -4
(B) -2
(C) 2
(D) 4
18) What is the amplitude for the graph shown?
(A) 0.5
(B) 0.75
(C) 0.5
(D) 1
19) What is the period for the graph shown?
(A) 90
(B) 180
(C) 270
(D) 360
20) What is the period for the graph shown?
(A) 45
(B) 90
(C) 135
(D) 180
Chapter 8 Math 3201 34
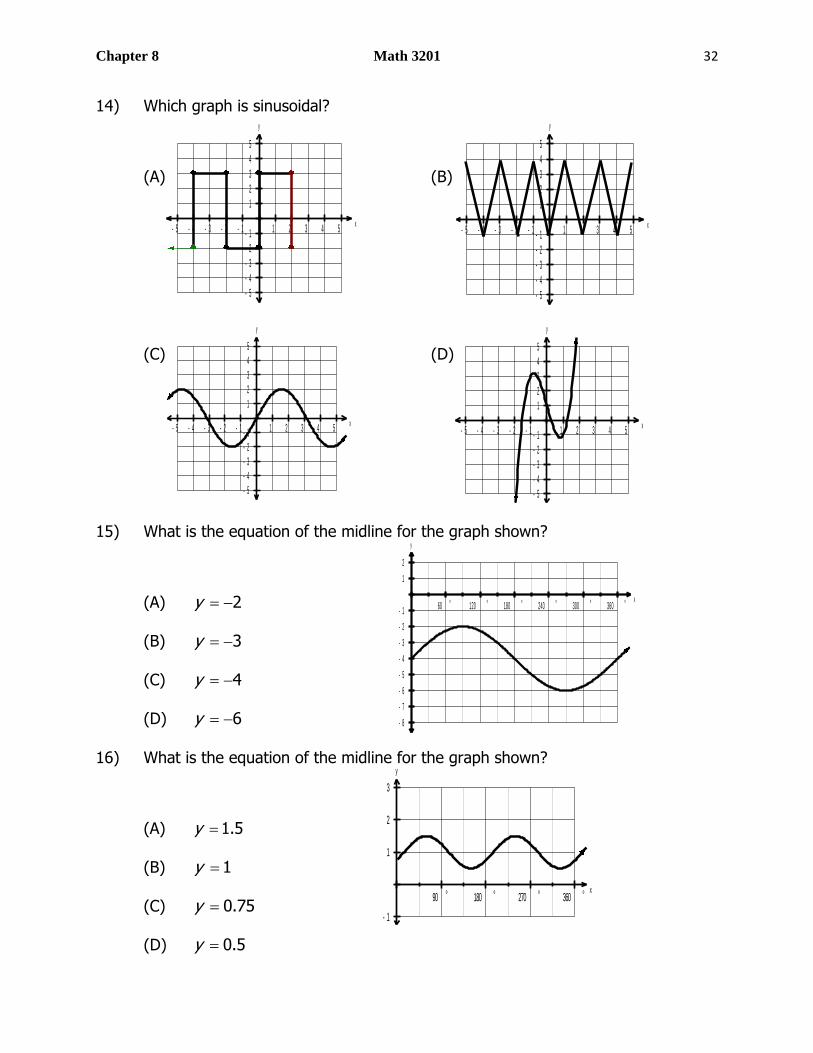
While riding a Ferris wheel, Lily’s height above the ground in terms of time can be
represented by the following graph:
Use the graph to answer #21-#25
21) At what height does Lily board the Ferris Wheel?
(A) 1 m (B) 4 m (C) 5 m (D) 9 m
22) What is the maximum height above the ground?
(A) 1 m (B) 4 m (C) 5 m (D) 9 m
23) What is the height of the axle of the Ferris Wheel?
(A) 1 m (B) 4 m (C) 5 m (D) 9 m
24) What is the radius of the Ferris Wheel?
(A) 1 m (B) 4 m (C) 5 m (D) 9 m
25) What length of time does it take for the Ferris Wheel to complete 1 rotation?
(A) 2 seconds (B) 4 seconds (C) 6 seconds (D) 8 seconds
26) What is the amplitude of 3sin4 30 2y x ?
(A) 2 (B) 3 (C) 4 (D) 30
27) What is the amplitude of 0.5cos 3 1.2 4y x
(A) 0.5 (B) 1.2 (C) 3 (D) 4
x2 4 6 8 10 12 14 16 18 20 22 24
y
123456789
10
Height above ground (in m)
Time (seconds)
Chapter 8 Math 3201 35
28) What is the equation of the midline of 4sin2 2.4 5y x ?
(A) 2y (B) 2.4y (C) 4y (D) 5y
29) What is the equation of the midline of 0.75cos0.5 15 2y x ?
(A) 2y (B) 0.5y (C) 0.75 (D) 15y
30) What is the period of 3sin4 2 1y x ?
(A) 4
(B)
2
(C) 4 (D) 8
31) What is the period of 4sin0.5 1y x ?
(A) 90 (B) 180 (C) 360 (D) 720
32) What is the period of 2sin34
y x
?
(A) 4
(B)
2
3
(C) (D) 6
33) What is the phase shift of 4sin2 2.4 5y x ?
(A) 2.4 radians to the right (B) 2.4 radians to the left
(C) 5 radians to the right (D) 5 radians to the left
34) What is the phase shift of 0.75cos0.5 15 2y x ?
(A) 15 to the right (B) 15 to the left
(C) 2 to the right (D) 2 to the left
35) What is the maximum value of 3sin4 30 2y x ?
(A) 1 (B) 5 (C) 6 (D) 7
36) What is the minimum value of 0.75cos0.5 15 2y x ?
(A) -2.75 (B) -2.5 (C) -2 (D) -1.25
Chapter 8 Math 3201 36
37) What is the maximum value of 4cos0.5 1 7y x ?
(A) 3 (B) 4 (C) 8 (D) 11
38) What is the minimum value of 1.5sin5 46
y x
(A) -5.5 (B) -2.5 (C) 1 (D) 6.5
39) What is the range of 2sin4 14
y x
?
(A) | 5 3,y Ry y (B) | 3 1,y Ry y
(C) | 1 1,y Ry y (D) y R
40) What is the range of 2.5cos3 2.4 3.5y x ?
(A) | 1 1,y Ry y (B) |1 6,y Ry y
(C) | 0.5 6.5,y Ry y (D) y R
Chapter 8 Math 3201 37
x0.5 1 1.5 2 2.5 3
y
2
4
6
8
10
12
14
16
18
20
Section 2: Constructed Response- Answer all questions in the space provided. Be sure
to show all workings to receive full credit!
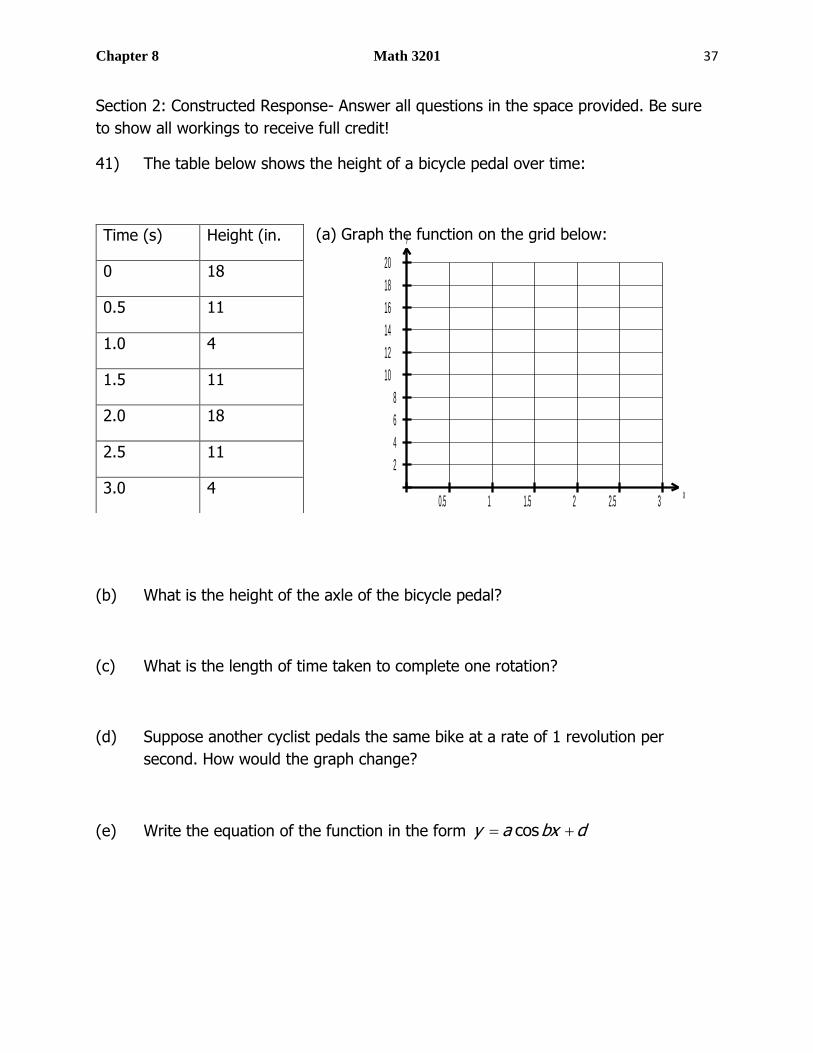
41) The table below shows the height of a bicycle pedal over time:
(a) Graph the function on the grid below:
(b) What is the height of the axle of the bicycle pedal?
(c) What is the length of time taken to complete one rotation?
(d) Suppose another cyclist pedals the same bike at a rate of 1 revolution per
second. How would the graph change?
(e) Write the equation of the function in the form cosy a bx d
Time (s) Height (in.
0 18
0.5 11
1.0 4
1.5 11
2.0 18
2.5 11
3.0 4
Chapter 8 Math 3201 38
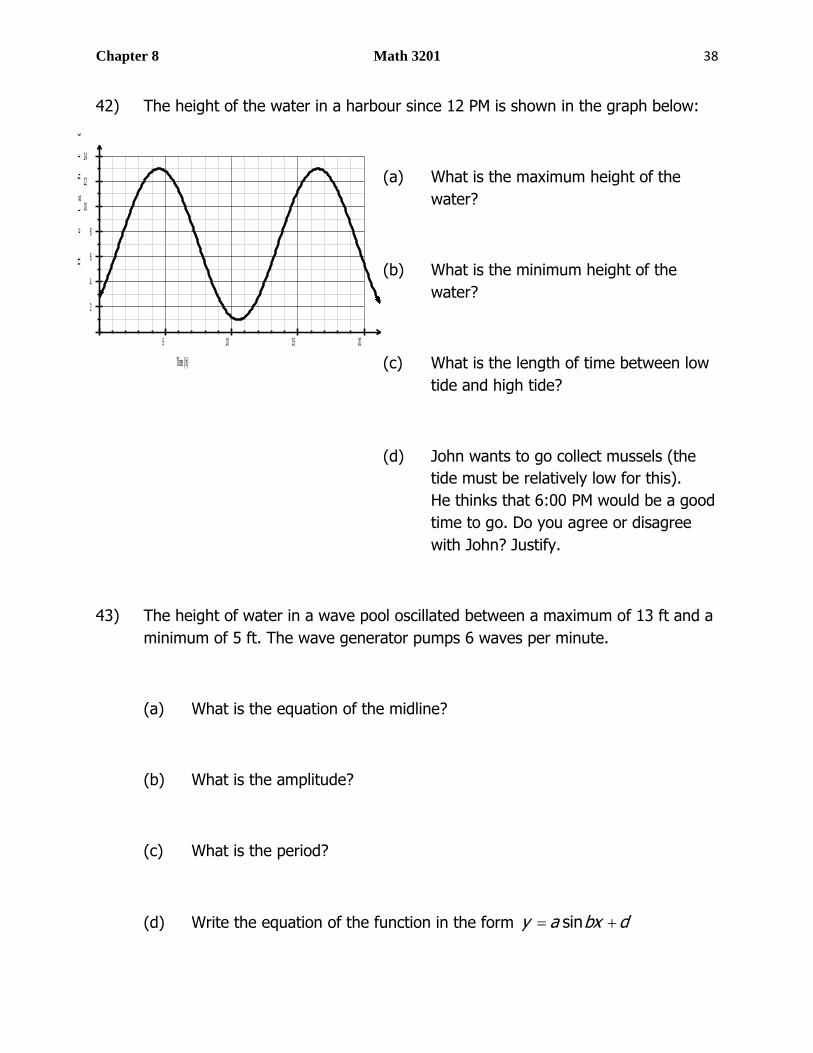
42) The height of the water in a harbour since 12 PM is shown in the graph below:
(a) What is the maximum height of the
water?
(b) What is the minimum height of the
water?
(c) What is the length of time between low
tide and high tide?
(d) John wants to go collect mussels (the
tide must be relatively low for this).
He thinks that 6:00 PM would be a good
time to go. Do you agree or disagree
with John? Justify.
43) The height of water in a wave pool oscillated between a maximum of 13 ft and a
minimum of 5 ft. The wave generator pumps 6 waves per minute.
(a) What is the equation of the midline?
(b) What is the amplitude?
(c) What is the period?
(d) Write the equation of the function in the form siny a bx d
5 10 15 20
2
4
6
8
10
12
14
Time (h)
He
ig
ht
(
ft
)

Chapter 8 Math 3201 39
44) The equation 70.5 19.5sin 46
y t
models the average monthly
temperature for Phoenix, Arizona, in degrees Fahrenheit. In this equation, t
denotes the number of months, with 1t representing January. What is the
average monthly temperature for July?
45) A horse on a carousel goes up and down as the carousel goes round and round.
The height of the horse in inches, h , as a function of time (s) is given by
2
9sin 467
h t
(a) Determine the height of the horse after 8 seconds.
(b) The children have been complaining that the carousel is too slow. How
would the equation change the conductor makes the carousel go around
faster?
46) Bob collects data on the average monthly temperatures of his hometown.
He uses his graphing calculator to perform a Sinusoidal Regression.
The screenshot of his calculator is shown below (where y represents the
temperature in degrees Fahrenheit and x represents the month with 1t
representing January:
(a) Write the equation of the curve of best fit.
(b) Use your equation to determine the
temperature in June.
Chapter 8 Math 3201 40
x90 ° 180 ° 270 ° 360 °
y
- 8
- 7
- 6
- 5
- 4
- 3
- 2
- 1
1
2
x180 ° 360 ° 540 ° 720 °
y
- 8
- 7
- 6
- 5
- 4
- 3
- 2
- 1
1
2
x90 ° 180 ° 270 ° 360 °
y
- 4
- 3
- 2
- 1
1
2
3
4
5
6
x90 ° 180 ° 270 ° 360 °
y
- 4
- 3
- 2
- 1
1
2
3
4
5
6
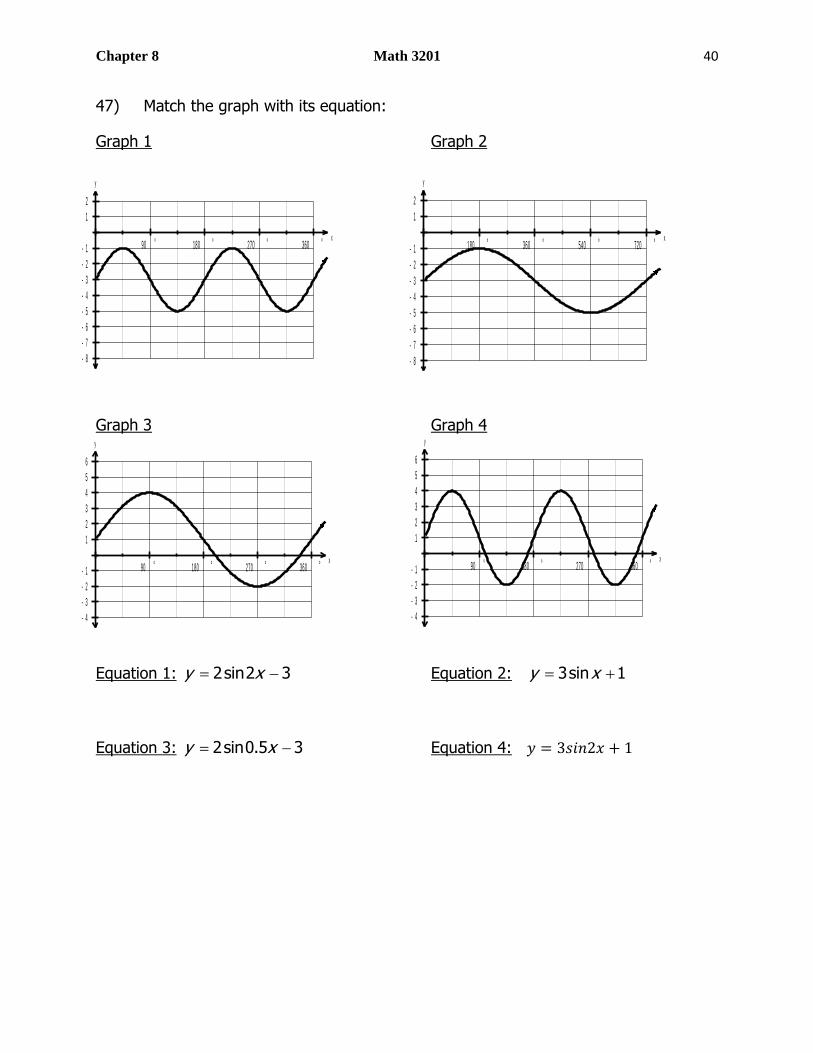
47) Match the graph with its equation:
Graph 1 Graph 2
Graph 3 Graph 4
Equation 1: 2sin2 3y x Equation 2: 3sin 1y x
Equation 3: 2sin0.5 3y x Equation 4: 𝑦 = 3𝑠𝑖𝑛2𝑥 + 1

Chapter 8 Math 3201 41
x0.5 1 1.5 2 2.5 3
y
2
4
6
8
10
12
14
16
18
20
Answers:
1) B 2) C 3) B 4) D 5) C 6) C
7) D 8) B 9) B 10) B 11) A 12) B
13) B 14) C 15) C 16) B 17) C 18) C
19) D 20) D 21) A 22) D 23) C 24) B
25) D 26) B 27) A 28) D 29) A 30) B
31) D 32) B 33) A 34) B 35) B 36) A
37) D 38) A 39) B 40) B
41) (a) (b) Height of axle = midline = 11 in.
(c) Period = time for one
revolution = 2 s
(d) Period would be 1 s. Waves
would be ‘closer’ together. One
complete wave would be shown
from 0-1 second.
(e) 7cos 11y x
42) (a) Maximum height is 13 ft (b) Minimum height is 1 ft
(c) 6 hours (d) No, because the height of water
is over 11 ft.
43) (a) 9y (b) 4 ft (c) 10 s (d) 4sin0.628 9y x
44) 90F 45) (a) 53 in (b) The ‘b’ value would decrease
46) (a) 22.43sin(0.51 2.1) 54.66y x (b) 73F
47) Graph 1 - Equation 1 , Graph 2 - Equation 3
Graph 3 – Equation 2, Graph 4 - Equation 4