CHAPTER 8: Short-Run Costs and Output Decisions © 2007 Prentice Hall Business Publishing Principles...
23
CHAPTER 8: Short-Run Costs and Output Decisions © 2007 Prentice Hall Business Publishing Principles of Economics 8e by Case and Fair 1 of 31 COSTS IN THE SHORT RUN Accounting cost : Accounting cost is also known as explicit cost; that is explicitly paid for factors of production such as salary, raw material, electricity , insurance, taxes , …etc. Opportunity cost : Opportunity cost is also known as implicit cost ; cost that is not actually paid for the factors of production, but it sacrificed for the sake of using existing factors of production available at the work place
-
Upload
clementine-chambers -
Category
Documents
-
view
220 -
download
2
Transcript of CHAPTER 8: Short-Run Costs and Output Decisions © 2007 Prentice Hall Business Publishing Principles...

CH
AP
TE
R 8
: S
hor
t-R
un
Cos
ts a
nd
Ou
tpu
t D
ecis
ion
s
© 2007 Prentice Hall Business Publishing Principles of Economics 8e by Case and Fair 1 of 31
COSTS IN THE SHORT RUN
Accounting cost : Accounting cost is also known as explicit cost; that is explicitly paid for factors of production such as salary, raw material, electricity , insurance, taxes , …etc.
Opportunity cost : Opportunity cost is also known as implicit cost ; cost that is not actually paid for the factors of production, but it sacrificed for the sake of using existing factors of production available at the work place

CH
AP
TE
R 8
: S
hor
t-R
un
Cos
ts a
nd
Ou
tpu
t D
ecis
ion
s
© 2007 Prentice Hall Business Publishing Principles of Economics 8e by Case and Fair 2 of 31
COSTS IN THE SHORT RUN
Example of Opportunity cost : If a company owns a warehouse and uses it to store products, the company will not pay rent for the usage of this warehouse because the company owns it.
The opportunity cost of using the warehouse is renting, and benefiting from the rent.

CH
AP
TE
R 8
: S
hor
t-R
un
Cos
ts a
nd
Ou
tpu
t D
ecis
ion
s
© 2007 Prentice Hall Business Publishing Principles of Economics 8e by Case and Fair 3 of 31
COSTS IN THE SHORT RUN
So,
Accounting Cost = Explicit cost only
Economic cost = Explicit cost + Implicit Cost
If Implicit Cost = 0, Accounting cost = Economic cost

CH
AP
TE
R 8
: S
hor
t-R
un
Cos
ts a
nd
Ou
tpu
t D
ecis
ion
s
© 2007 Prentice Hall Business Publishing Principles of Economics 8e by Case and Fair 4 of 31
COSTS IN THE SHORT RUN
Normal and Economic Profits
Normal Profits is the Accounting profits
Accounting Profits = Total Revenue – Accounting Cost
Accounting Profits = TR – Explicit Cost
Economic Profits = Total Revenue – Economics Cost
Economic Profits = TR – ( Explicit Cost + Implicit Cost )
1. If TR ˃ Economics Cost , the company gains economic profits
2. If TR ˂ Economics Cost , the company gains economic loss
3. If TR = Economics Cost , economic profits = 0 and the company gains only normal profits.

CH
AP
TE
R 8
: S
hor
t-R
un
Cos
ts a
nd
Ou
tpu
t D
ecis
ion
s
© 2007 Prentice Hall Business Publishing Principles of Economics 8e by Case and Fair 5 of 31
COSTS IN THE SHORT RUN
fixed cost Any cost that does not depend on the firm’s level of output. These costs are incurred even if the firm is producing nothing.
variable cost A cost that depends on the level of production chosen.
total cost (TC) Fixed costs + variable costs.

CH
AP
TE
R 8
: S
hor
t-R
un
Cos
ts a
nd
Ou
tpu
t D
ecis
ion
s
© 2007 Prentice Hall Business Publishing Principles of Economics 8e by Case and Fair 6 of 31
COSTS IN THE SHORT RUN
total fixed costs (TFC) The total of all costs that do not change with output, even if output is zero.
Total Fixed Cost (TFC)
FIXED COSTS
TABLE 8.1 Short-Run Fixed Cost (Total and Average) of a Hypothetical Firm
(1)
Q
(2)TFC
(3)AFC (TFC/Q)
012345
$1,000$1,000$1,000$1,000$1,000$1,000
$ 1,000
500333250200

CH
AP
TE
R 8
: S
hor
t-R
un
Cos
ts a
nd
Ou
tpu
t D
ecis
ion
s
© 2007 Prentice Hall Business Publishing Principles of Economics 8e by Case and Fair 7 of 31
COSTS IN THE SHORT RUN
average fixed cost (AFC) Total fixed cost divided by the number of units of output; aper-unit measure of fixed costs.
Average Fixed Cost (AFC)
q
TFCAFC

CH
AP
TE
R 8
: S
hor
t-R
un
Cos
ts a
nd
Ou
tpu
t D
ecis
ion
s
© 2007 Prentice Hall Business Publishing Principles of Economics 8e by Case and Fair 8 of 31
COSTS IN THE SHORT RUN
spreading overhead The process of dividing total fixed costs by more units of output. Average fixed cost declines as quantity rises.
FIGURE 8.2 Short-Run Fixed Cost (Total and Average) of a Hypothetical Firm

CH
AP
TE
R 8
: S
hor
t-R
un
Cos
ts a
nd
Ou
tpu
t D
ecis
ion
s
© 2007 Prentice Hall Business Publishing Principles of Economics 8e by Case and Fair 9 of 31
COSTS IN THE SHORT RUN
total variable cost (TVC) The total of all costs that vary with output in the short run.
Total Variable Cost (TVC)
VARIABLE COSTS
total variable cost curve A graph that shows the relationship between total variable cost and the level of a firm’s output.

CH
AP
TE
R 8
: S
hor
t-R
un
Cos
ts a
nd
Ou
tpu
t D
ecis
ion
s
© 2007 Prentice Hall Business Publishing Principles of Economics 8e by Case and Fair 10 of 31
COSTS IN THE SHORT RUN
The total variable cost curve embodies information about both factor, or input, prices and technology. It shows the cost of production using the best available technique at each output level given current factor prices.
FIGURE 8.3 Total Variable Cost Curve

CH
AP
TE
R 8
: S
hor
t-R
un
Cos
ts a
nd
Ou
tpu
t D
ecis
ion
s
© 2007 Prentice Hall Business Publishing Principles of Economics 8e by Case and Fair 11 of 31
COSTS IN THE SHORT RUN
Marginal Cost (MC)
marginal cost (MC) The increase in total cost that results from producing one more unit of output. Marginal costs reflect changes in variable costs.

CH
AP
TE
R 8
: S
hor
t-R
un
Cos
ts a
nd
Ou
tpu
t D
ecis
ion
s
© 2007 Prentice Hall Business Publishing Principles of Economics 8e by Case and Fair 12 of 31
COSTS IN THE SHORT RUN
Average Variable Cost (AVC)
q
TVCAVC
average variable cost (AVC) Total variable cost divided by the number of units of output.

CH
AP
TE
R 8
: S
hor
t-R
un
Cos
ts a
nd
Ou
tpu
t D
ecis
ion
s
© 2007 Prentice Hall Business Publishing Principles of Economics 8e by Case and Fair 13 of 31
COSTS IN THE SHORT RUN
Q TFC TVC TC AFC AVC ATC MC0 60 0
1 60 7
2 60 8
3 60 9
4 60 16
5 60 30
6 60 72
7 60 133
8 60 224
9 60 351
10 60 520
CH
AP
TE
R 8
: S
hor
t-R
un
Cos
ts a
nd
Ou
tpu
t D
ecis
ion
s
© 2007 Prentice Hall Business Publishing Principles of Economics 8e by Case and Fair 14 of 31
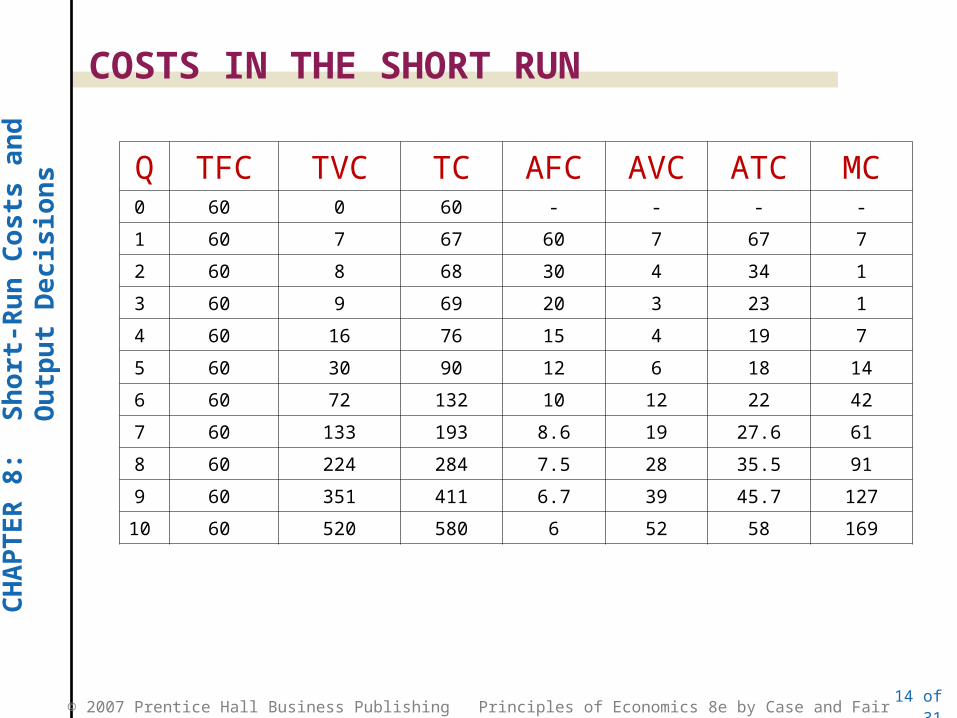
COSTS IN THE SHORT RUN
Q TFC TVC TC AFC AVC ATC MC0 60 0 60 - - - -
1 60 7 67 60 7 67 7
2 60 8 68 30 4 34 1
3 60 9 69 20 3 23 1
4 60 16 76 15 4 19 7
5 60 30 90 12 6 18 14
6 60 72 132 10 12 22 42
7 60 133 193 8.6 19 27.6 61
8 60 224 284 7.5 28 35.5 91
9 60 351 411 6.7 39 45.7 127
10 60 520 580 6 52 58 169

CH
AP
TE
R 8
: S
hor
t-R
un
Cos
ts a
nd
Ou
tpu
t D
ecis
ion
s
© 2007 Prentice Hall Business Publishing Principles of Economics 8e by Case and Fair 15 of 31
COSTS IN THE SHORT RUN
FIGURE 8.7 Total Cost = Total Fixed Cost + Total Variable Cost
TOTAL COSTS

CH
AP
TE
R 8
: S
hor
t-R
un
Cos
ts a
nd
Ou
tpu
t D
ecis
ion
s
© 2007 Prentice Hall Business Publishing Principles of Economics 8e by Case and Fair 16 of 31
The following could be concluded
1. When the AVC curve is ˃ MC, AVC is decreasing
2. When the AVC curve is ˂ MC, AVC is increasing
3. The same speech is applied for ATC and MC
4. AVC crosses the MC curve at its lowest point (Shut-down point) at that point AVC = $3, and Q = 3 units which is the least AVC value.
5. The shut-down point enables the firm to minimize the losses to the minimum.

CH
AP
TE
R 8
: S
hor
t-R
un
Cos
ts a
nd
Ou
tpu
t D
ecis
ion
s
© 2007 Prentice Hall Business Publishing Principles of Economics 8e by Case and Fair 17 of 31
6. ATC crosses the MC curve at its lowest point ( the Breakeven point ) when TR = TC at Q =5 and ATC = $18
7. The ATC curve always remains higher than the AVC curve, the more the production increases, the more curves get closer but never touch.
8. The vertical distance between ATC and AVC is the AFC.
9. The AFC curve descends downwards to the right hand side and get close to the horizontal axis without touching it. This means that AFC is decreasing but never equal zero
10. As long as the AFC curve doesn’t touch the horizontal axis, both the ATC and AVC will not touch

CH
AP
TE
R 8
: S
hor
t-R
un
Cos
ts a
nd
Ou
tpu
t D
ecis
ion
s
© 2007 Prentice Hall Business Publishing Principles of Economics 8e by Case and Fair 18 of 31
The Relationship between Cost and Production Curves in the Short Run
Average Variable Cost (AVC) and Average Production of Labour ( APL )
QLWAVC
QTVCAVC
LWTVC
/*
/
*

CH
AP
TE
R 8
: S
hor
t-R
un
Cos
ts a
nd
Ou
tpu
t D
ecis
ion
s
© 2007 Prentice Hall Business Publishing Principles of Economics 8e by Case and Fair 19 of 31
The Relationship between Cost and Production Curves in the Short Run
APLWAVC
QLWAVC
and
LQAPL
/
)/.(
/
CH
AP
TE
R 8
: S
hor
t-R
un
Cos
ts a
nd
Ou
tpu
t D
ecis
ion
s
© 2007 Prentice Hall Business Publishing Principles of Economics 8e by Case and Fair 20 of 31
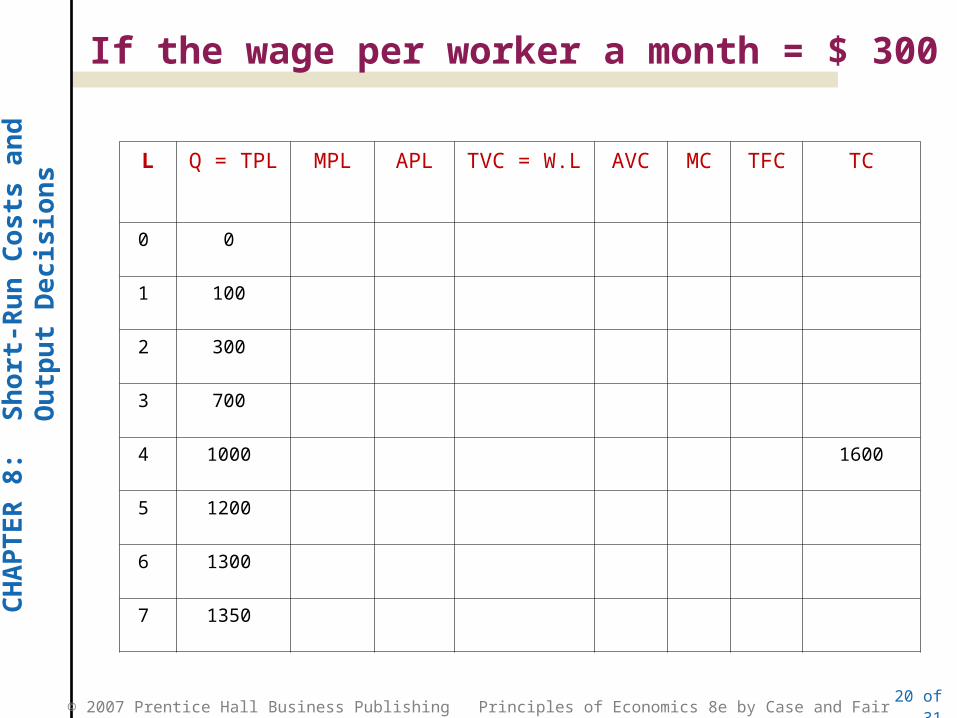
If the wage per worker a month = $ 300
L Q = TPL MPL APL TVC = W.L AVC MC TFC TC
0 0
1 100
2 300
3 700
4 1000 1600
5 1200
6 1300
7 1350

CH
AP
TE
R 8
: S
hor
t-R
un
Cos
ts a
nd
Ou
tpu
t D
ecis
ion
s
© 2007 Prentice Hall Business Publishing Principles of Economics 8e by Case and Fair 21 of 31
If the wage per worker a month = $ 300
L Q = TPL MPL APL TVC = W.L AVC MC TFC TC
0 0 - - 0 - - 400 400
1 100 100 100 300 3 3 400 700
2 300 200 150 600 2 1.5 400 1000
3 700 400 233.3 900 1.26 0.75 400 1300
4 1000 300 250 1200 1.20 1 400 1600
5 1200 200 240 1500 1.25 1.5 400 1900
6 1300 100 216.7 1800 1.38 3 400 2200
7 1350 50 192.9 2100 1.56 6 400 2500

CH
AP
TE
R 8
: S
hor
t-R
un
Cos
ts a
nd
Ou
tpu
t D
ecis
ion
s
© 2007 Prentice Hall Business Publishing Principles of Economics 8e by Case and Fair
Profit Maximization: The Numbers
Q P TR TC TP = TR-TC
MR MC ATC
0 $1 $0 $1.00 -$1.00 $1
1 $1 $1 $2.00 -$1.00 $1 $1.00 $2.00
2 $1 $2 $2.80 -$0.80 $1 $0.80 $1.40
3 $1 $3 $3.50 -$0.50 $1 $0.70 $1.17
4 $1 $4 $4.00 $0.00 $1 $0.50 $1.00
5 $1 $5 $4.50 $0.50 $1 $0.50 $0.90
6 $1 $6 $5.20 $0.80 $1 $0.70 $0.87
7 $1 $7 $6.00 $1.00 $1 $0.80 $0.86
8 $1 $8 $6.86 $1.14 $1 $0.86 $0.86
9 $1 $9 $7.86 $1.14 $1 $1.00 $0.87
10 $1 $10 $9.36 $0.64 $1 $1.50 $0.94
11 $1 $11 $12.00 -$1.00 $1 $2.64 $1.09
MR=MCMR=MC

CH
AP
TE
R 8
: S
hor
t-R
un
Cos
ts a
nd
Ou
tpu
t D
ecis
ion
s
© 2007 Prentice Hall Business Publishing Principles of Economics 8e by Case and Fair
TC TR
0
Tot
al c
ost,
reve
nue
$385
350
315
280
245
210
175
140
105
70
35
Quantity1 2 3 4 5 6 7 8 9
Profit Determination Using Total Cost and Revenue Curves
Maximum profit =$81
$130
Loss
Loss
Profit
Profit =$45
McGraw-Hill/Irwin © 2004 The McGraw-Hill Companies, Inc., All Rights Reserved.