Chapter 8 HYPOTHESIS TESTING USING THE ONE-SAMPLE t-TEST.
26
Chapter 8 HYPOTHESIS TESTING USING THE ONE-SAMPLE t-TEST
-
Upload
maximilian-dean -
Category
Documents
-
view
285 -
download
6
Transcript of Chapter 8 HYPOTHESIS TESTING USING THE ONE-SAMPLE t-TEST.

Chapter 8
HYPOTHESIS TESTING USING THE ONE-SAMPLE t-TEST

Going Forward
Your goals in this chapter are to learn:• The difference between the z-test and the t-
test• How the t-distribution and degrees of
freedom are used• When and how to perform the t-test• What is meant by the confidence interval for
, and how it is computed

Using the t-Test
• Use the z-test when is known
• Use the t-test when is not known and must be estimated by calculating
X
Xs
X

Understanding the One-Sample t-Test

Setting Up the Statistical Test
1. Set up the statistical hypotheses (H0 and Ha) in
precisely the same fashion as in the z-test
2. Select alpha
3. Check the assumptions for a t-test

Assumptions for a t-Test
• You have a one-sample experiment using interval or ratio scores
• The raw score population forms a normal distribution
• The variability of the raw score population is estimated from the sample

Performing the One-Sample t-Test

Performing the One-Sample t-Test
1. Compute the estimated population variance (s ) using the formula2Xs
1
)( 22
2
NNX
XsX

Performing the One-Sample t-Test
2. Compute the estimated standard error of the mean ( ) using the formulaXS
N
ss XX

Performing the One-Sample t-Test
3. Calculate the tobt statistic using the formula
Xs
Xt
obt

The t-Distribution
The t-distribution is the distribution of all possible values of t computed for random sample means selected from the raw score population described by H0

Comparison of Two t-Distributions Based on Different Sample Ns

Degrees of Freedom
• The quantity N – 1 is called the degrees of freedom (df )
• This is the number of scores in a sample that reflect the variability in the population

Using the t-Table
Obtain the appropriate value of tcrit from the t-tables using•The correct table depending on whether you are conducting a one-tailed or a two-tailed test,•The appropriate column for the chosen and •The row associated with your degrees of freedom (df)

Interpreting the t-Test

A Two-Tailed t-Distribution for df = 8When H0 is True and = 10

Reaching a Decision
If tobt is beyond tcrit in the tail of the distribution:
1.Reject H0 ; accept Ha
2.Conclude there is a relationship between your independent variable and dependent variable
3.Describe the relationship
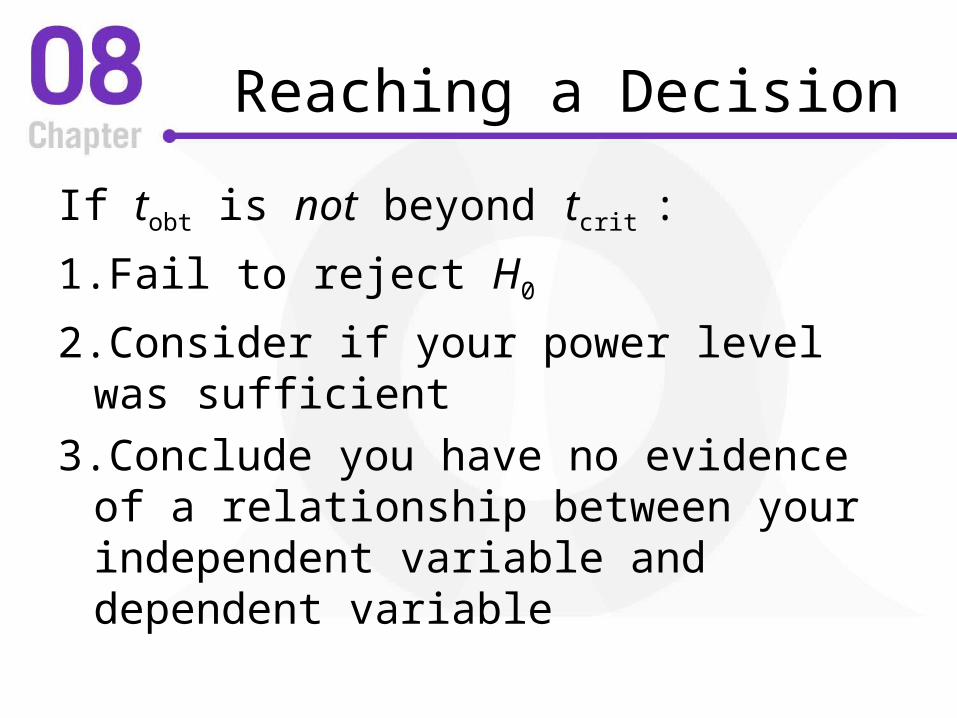
Reaching a Decision
If tobt is not beyond tcrit :
1.Fail to reject H0
2.Consider if your power level was sufficient3.Conclude you have no evidence of a
relationship between your independent variable and dependent variable

One-Tailed Tests
If you believe your sample represents a population where the mean is greater than some value (e.g., 25):
H0: ≤ 25
Ha: > 25

One-Tailed Tests
If you believe your sample represents a population where the mean is less than some value (e.g., 25):
H0: ≥ 25
Ha: < 25

Summary of the One-Sample t-Test
1. Create the two-tailed or the one-tailed H0 and Ha
2. Compute tobt
1. Compute and2. Compute3. Compute tobt
3. Create the sampling t-distribution and use df = N – 1 to find tcrit in the t-tables
4. Compare tobt to tcrit
X 2Xs
Xs

Estimating by Computing a Confidence Interval
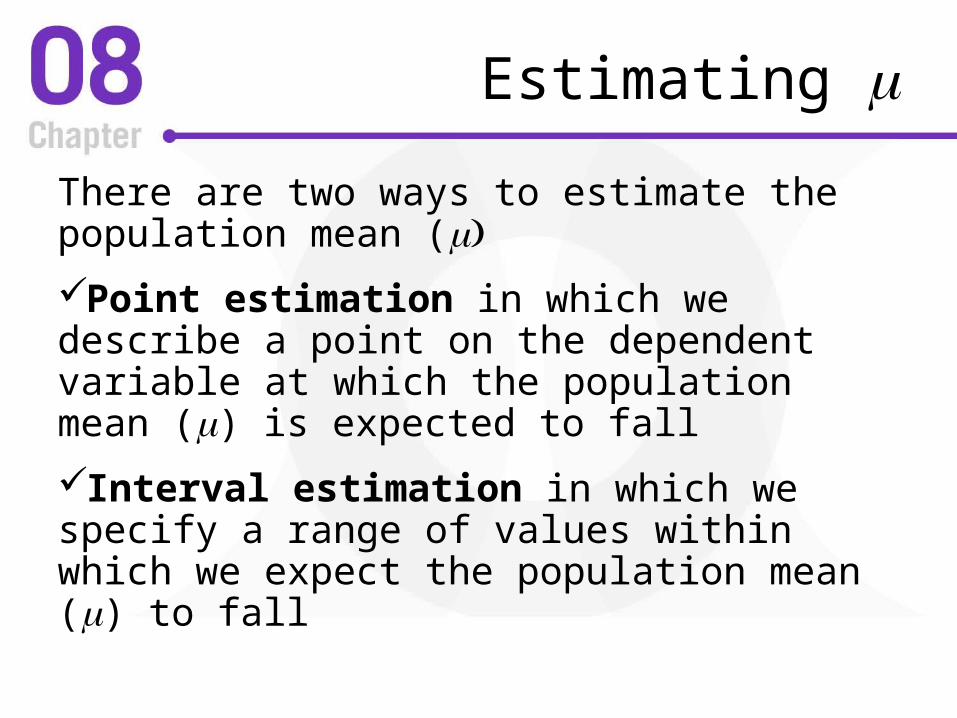
Estimating
There are two ways to estimate the population mean (
Point estimation in which we describe a point on the dependent variable at which the population mean () is expected to fall
Interval estimation in which we specify a range of values within which we expect the population mean () to fall

Confidence Intervals
• We perform interval estimation by creating a confidence interval
• The confidence interval for a single describes an interval containing values of
XtsXts XX ))(())(( critcrit

Example
Use the following data set and conduct a two-tailed t-test to determine if = 12
14 14 13 15 11 15
13 10 12 13 14 13
14 15 17 14 14 15

Example
• • Choose = 0.05• Reject H0 if tobt > +2.110 or if tobt < -2.110
• Since 4.4 > 2.110, reject H0 and conclude does not equal 12
12:;12:0 aHH
40.4380.0
67.1
18
61.11267.13
obt
N
sX
tX