Chapter 8 Hypothesis Testing 1. Chapter 8 Overview Introduction 8-1 Steps in Hypothesis...
38
Chapter 8 Hypothesis Testing 1
-
Upload
christiana-benson -
Category
Documents
-
view
233 -
download
1
Transcript of Chapter 8 Hypothesis Testing 1. Chapter 8 Overview Introduction 8-1 Steps in Hypothesis...
Chapter 8
Hypothesis Testing
1
Chapter 8 Overview Introduction 8-1 Steps in Hypothesis Testing-Traditional
Method 8-2 z Test for a Mean 8-3 t Test for a Mean 8-4 z Test for a Proportion 8-5 Test for a Variance or Standard
Deviation 8-6 Confidence Intervals and Hypothesis
Testing
2
2
Chapter 8 Objectives1. Understand the definitions used in hypothesis
testing.
2. State the null and alternative hypotheses.
3. Find critical values for the z test.
4. State the five steps used in hypothesis testing.
5. Test means when is known, using the z test.
6. Test means when is unknown, using the t test.
3
σσ
Chapter 8 Objectives7. Test proportions, using the z test.
8. Test variances or standard deviations, using the chi-square test.
9. Test hypotheses, using confidence intervals.
4
Today’s Essential Questions
What is hypothesis testing? What are the terms associated with
hypothesis testing and what are their meanings?
5
Hypothesis Testing
What is one question that researchers in today’s world might be interested in studying and attempting to answer?
Submit your answer to pollev.com
270016 (space) your question…..
6

Hypothesis TestingResearchers are interested in answering many types of questions. For example,
Is the earth warming up?
Does a new medication lower blood pressure?
Does the public prefer a certain color in a new fashion line?
Is a new teaching technique better than a traditional one?
What feature would the public like added to their smart phone?
These types of questions can be addressed through statistical hypothesis testing, which is a decision-making process for evaluating claims about a population.
7
Hypothesis Testing
Three methods used to test hypotheses:
1. The traditional method
2. The P-value method
3. The confidence interval method
8
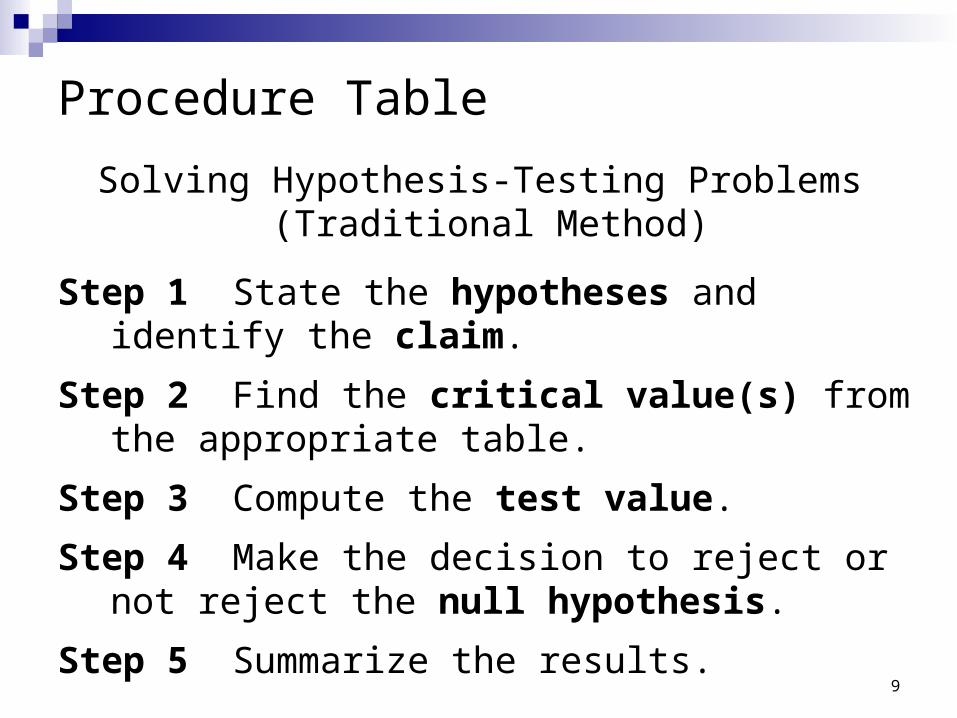
Procedure Table
Solving Hypothesis-Testing Problems (Traditional Method)
Step 1 State the hypotheses and identify the claim.
Step 2 Find the critical value(s) from the appropriate table.
Step 3 Compute the test value.
Step 4 Make the decision to reject or not reject the null hypothesis.
Step 5 Summarize the results.9
10.1 Steps in Hypothesis Testing-Traditional Method
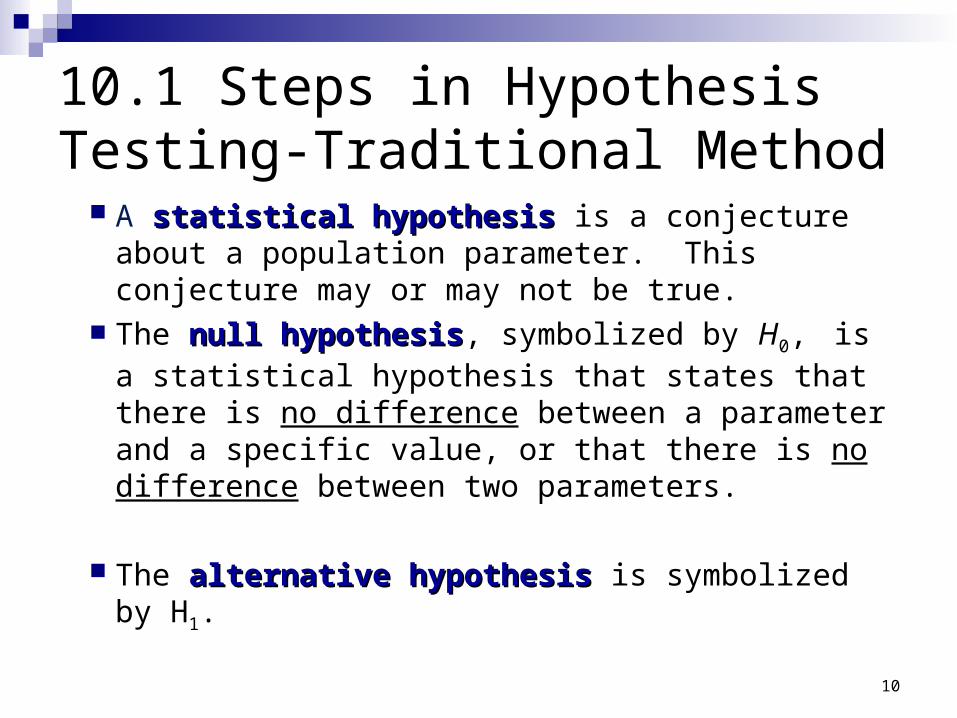
A statistical hypothesis statistical hypothesis is a conjecture about a population parameter. This conjecture may or may not be true.
The null hypothesisnull hypothesis, symbolized by H0, is a statistical hypothesis that states that there is no difference between a parameter and a specific value, or that there is no difference between two parameters.
The alternative hypothesisalternative hypothesis is symbolized by H1.10
Steps in Hypothesis Testing-Traditional Method
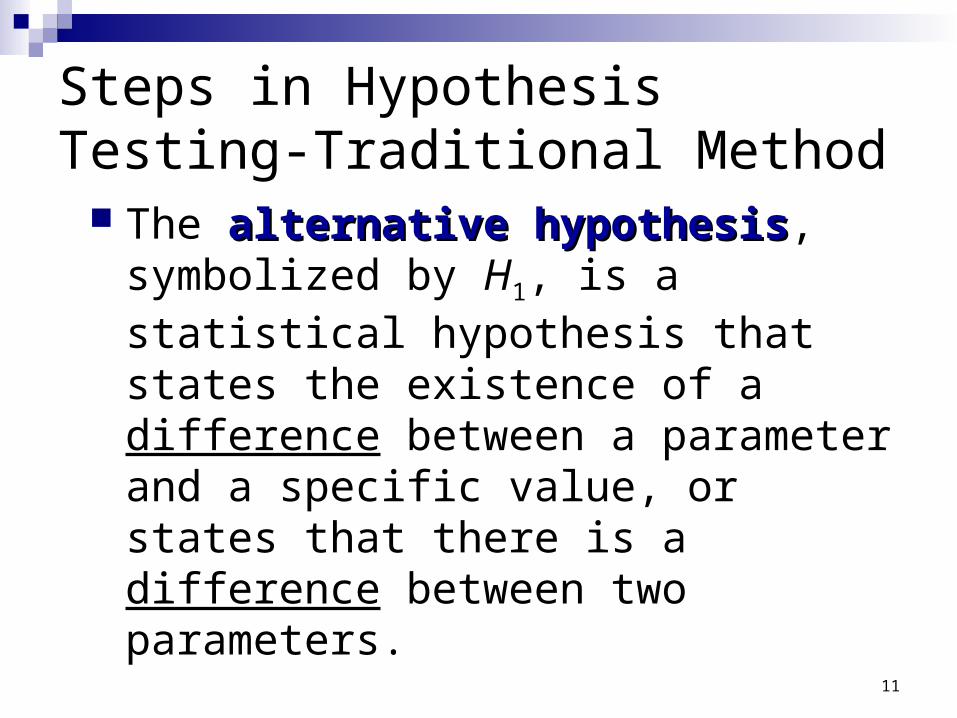
The alternative hypothesisalternative hypothesis, symbolized by H1, is a statistical hypothesis that states the existence of a difference between a parameter and a specific value, or states that there is a difference between two parameters.
11
Stating a Hypothesis
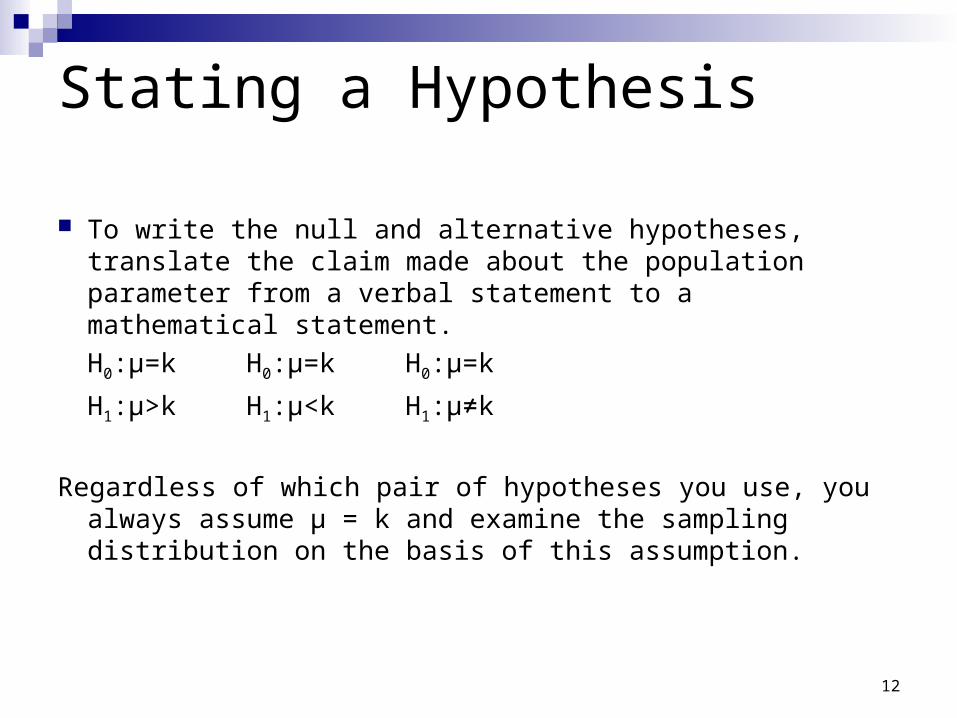
To write the null and alternative hypotheses, translate the claim made about the population parameter from a verbal statement to a mathematical statement.
H0:μ=k H0:μ=k H0:μ=k
H1:μ>k H1:μ<k H1:μ≠k
Regardless of which pair of hypotheses you use, you always assume μ = k and examine the sampling distribution on the basis of this assumption.
12
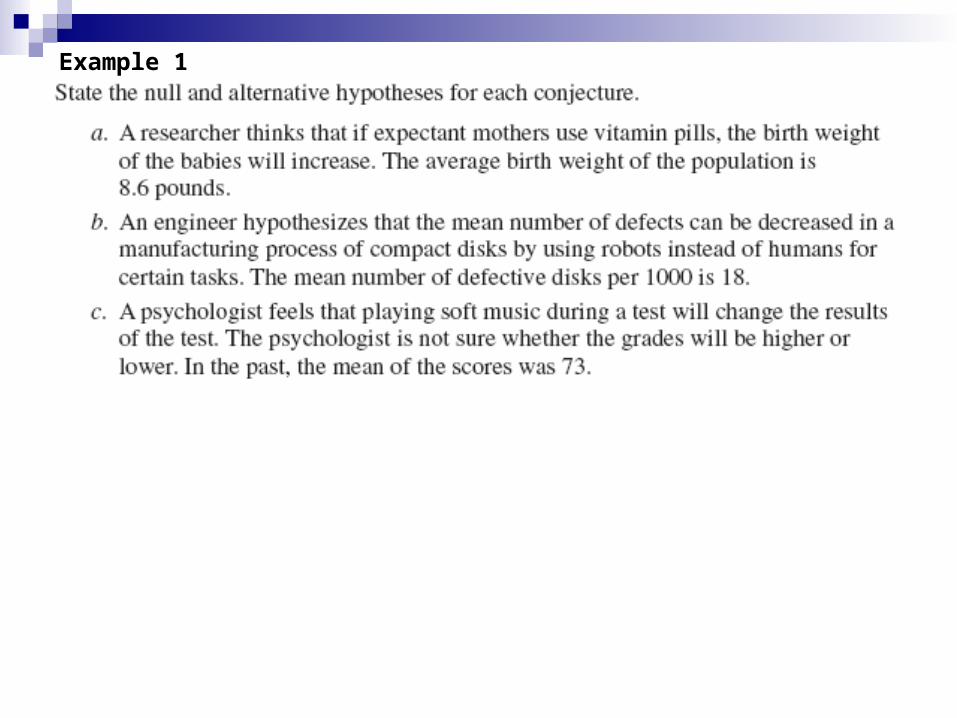
Example 1
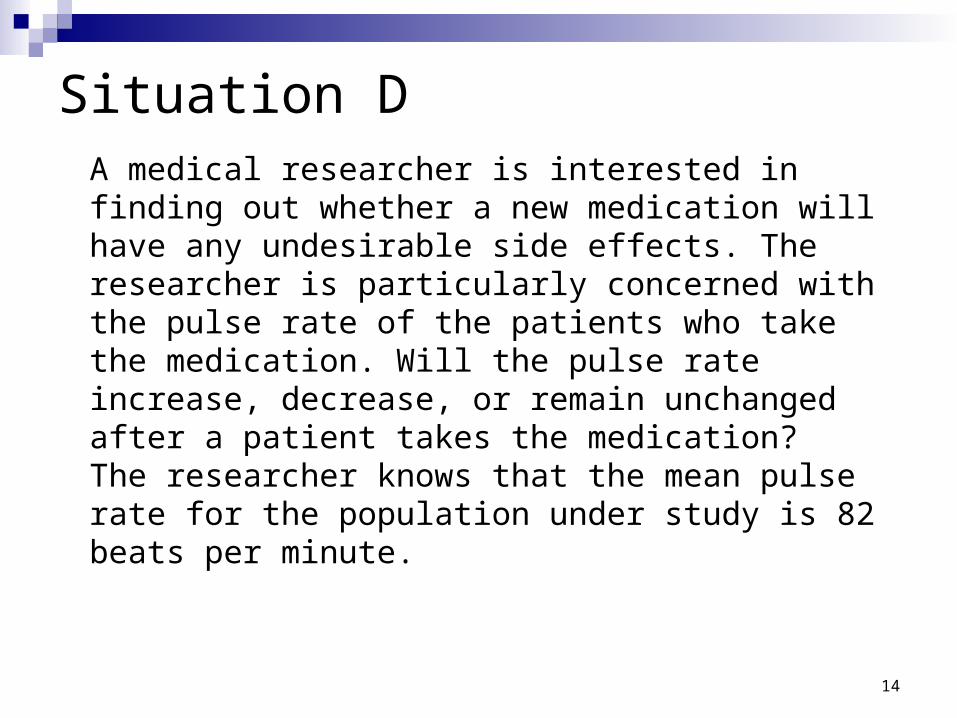
Situation DA medical researcher is interested in finding out whether a new medication will have any undesirable side effects. The researcher is particularly concerned with the pulse rate of the patients who take the medication. Will the pulse rate increase, decrease, or remain unchanged after a patient takes the medication? The researcher knows that the mean pulse rate for the population under study is 82 beats per minute.
14
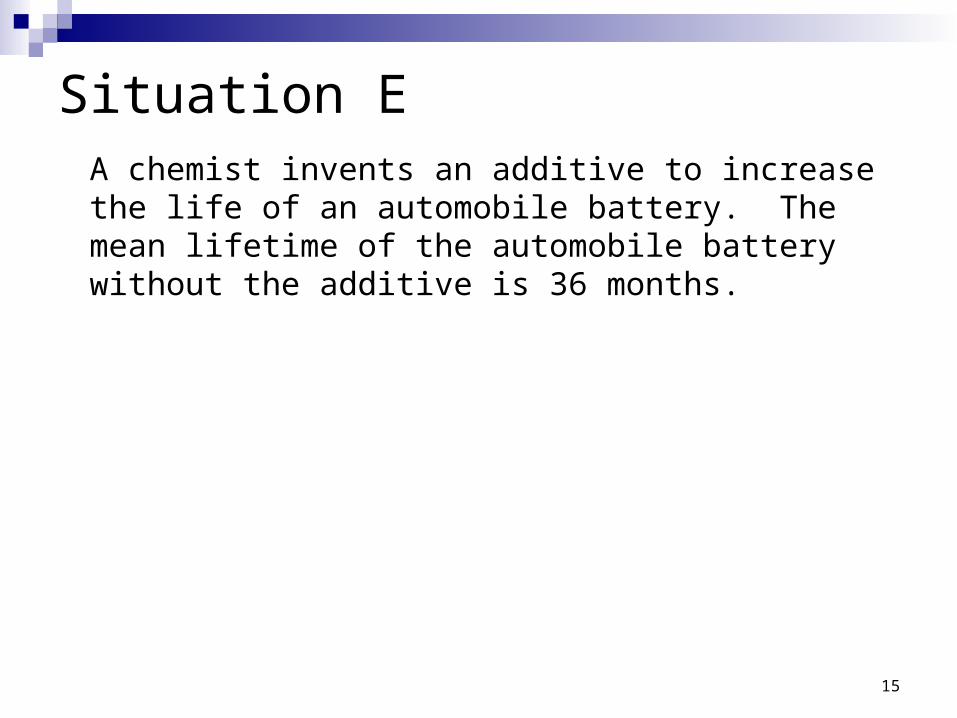
Situation EA chemist invents an additive to increase the life of an automobile battery. The mean lifetime of the automobile battery without the additive is 36 months.
15
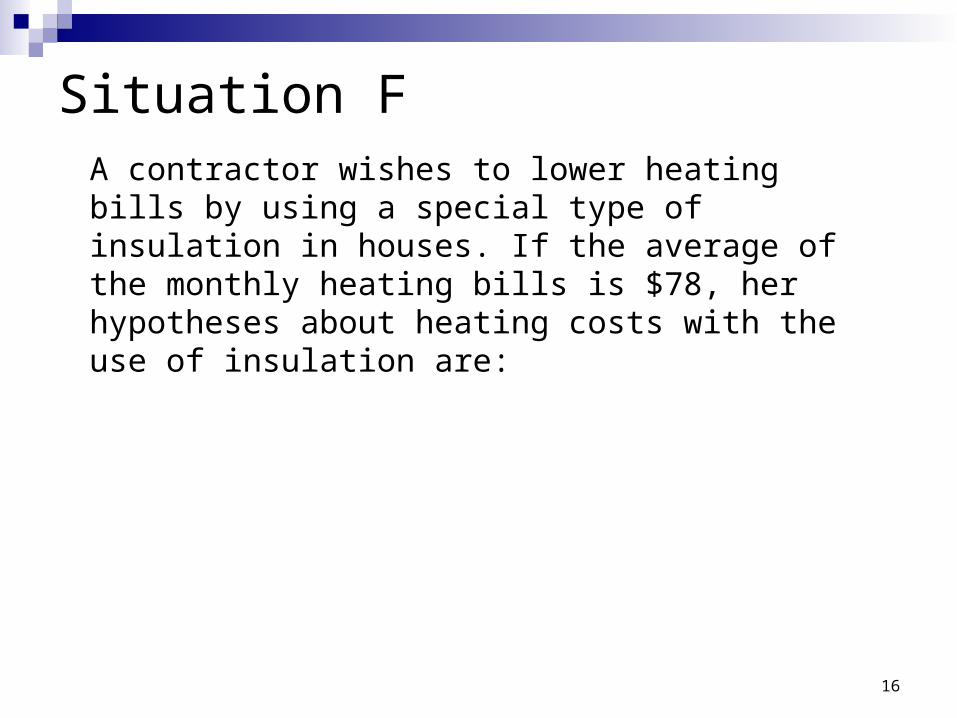
Situation FA contractor wishes to lower heating bills by using a special type of insulation in houses. If the average of the monthly heating bills is $78, her hypotheses about heating costs with the use of insulation are:
16
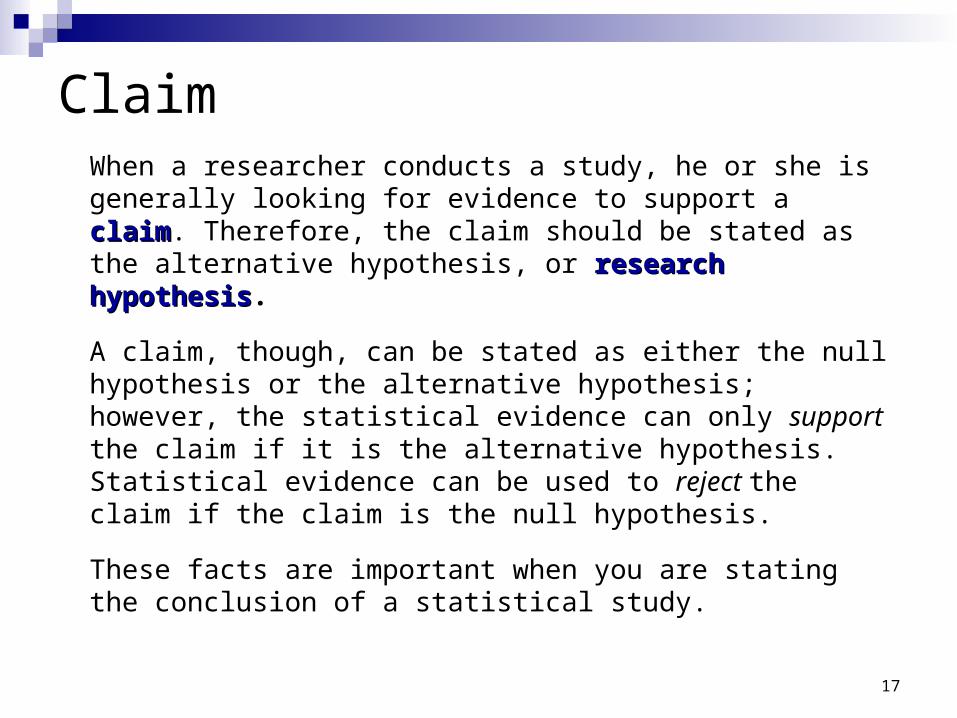
ClaimWhen a researcher conducts a study, he or she is generally looking for evidence to support a claimclaim. Therefore, the claim should be stated as the alternative hypothesis, or research hypothesisresearch hypothesis.
A claim, though, can be stated as either the null hypothesis or the alternative hypothesis; however, the statistical evidence can only support the claim if it is the alternative hypothesis. Statistical evidence can be used to reject the claim if the claim is the null hypothesis.
These facts are important when you are stating the conclusion of a statistical study.
17
Hypothesis Testing
After stating the hypotheses, the researcher’s next step is to design the study.
The researcher
- selects the correct statistical testcorrect statistical test,
- chooses an appropriate level of level of significancesignificance,
- formulates a plan for conducting the study.
18
Hypothesis Testing
A statistical test statistical test uses the data obtained from a sample to make a decision about whether the null hypothesis should be rejected.
The numerical value obtained from a statistical test is called the test valuetest value.
In the hypothesis-testing situation, there are four possible outcomes.
19
Hypothesis Testing
20
Hypothesis Testing
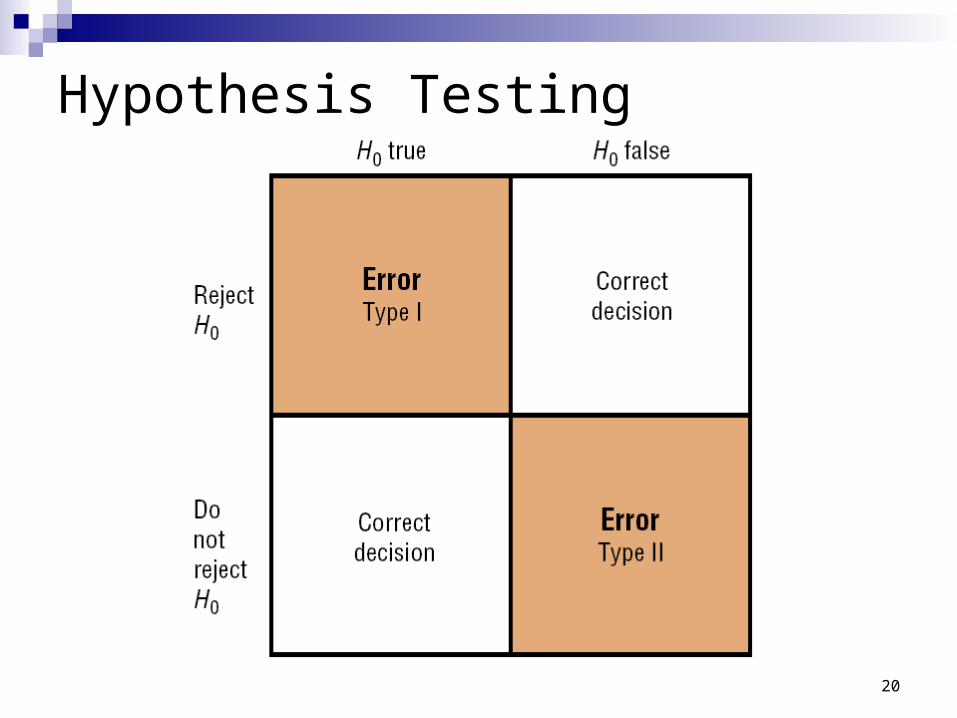
In reality, the null hypothesis may or may not be true, and a decision is made to reject or not to reject it on the basis of the data obtained from a sample.
A type I error type I error occurs if one rejects the null hypothesis when it is true.
A type II error type II error occurs if one does not reject the null hypothesis when it is false.
21
Type I and II Errors
The USDA limit for salmonella contamination for chicken is 20%. A meat inspector reports that the chicken produced by a company exceeds the USDA limit. You perform a hypothesis test to determine whether the meat inspector’s claim is true. When will a type I or type II error occur? Which is more serious? (Source: United States Department of Agriculture)
22
Check for Understanding
A seismologist claims to be able to predict earthquakes.
If the average seismographic reading for 30 minutes is over 1.1, he believes that a quake is eminent.
What is the null and alternative hypothesis of this test?
What is a type 1 error in this case?
What is a type 2 error in this case?
Which would you rather happen while hanging out on
California beach: a type 1 error or a type 2 error?
Bluman, Chapter 8 23
Hypothesis Testing
The level of significance level of significance is the maximum probability of committing a type I error. This probability is symbolized by (alpha). That is,
P(type I error) =
Likewise,
P(type II error) = (beta).
24
αα
β
Hypothesis Testing
Typical significance levels are:
0.10, 0.05, and 0.01
For example, when = 0.10, there is a 10% chance of rejecting a true null hypothesis.
25
α
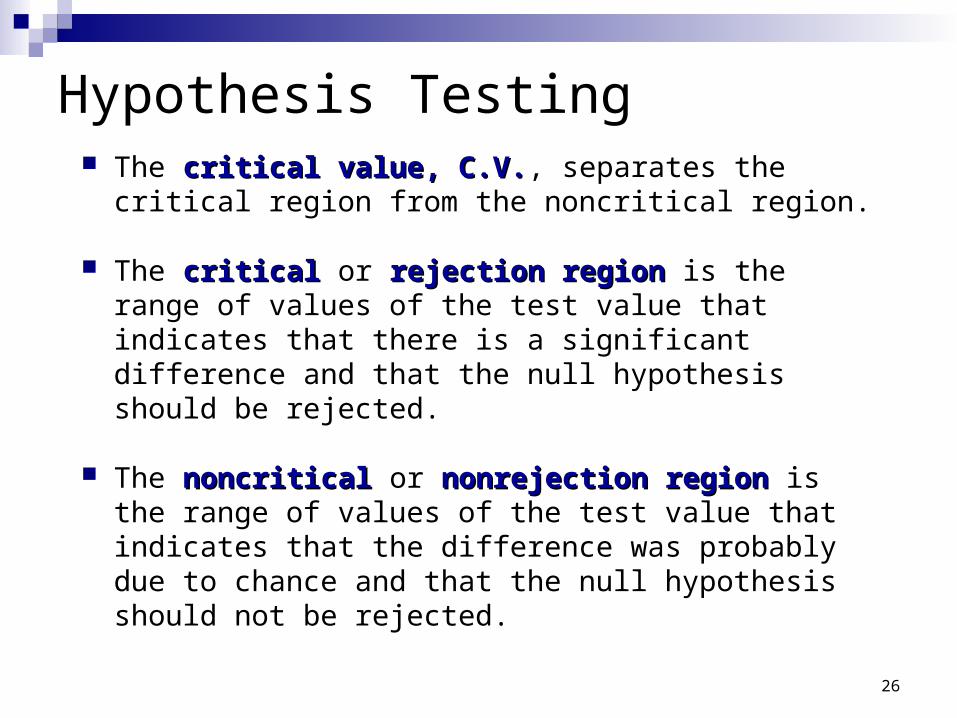
Hypothesis Testing The critical value, C.V.critical value, C.V., separates the critical region
from the noncritical region.
The criticalcritical or rejection region rejection region is the range of values of the test value that indicates that there is a significant difference and that the null hypothesis should be rejected.
The noncritical noncritical or nonrejection region nonrejection region is the range of values of the test value that indicates that the difference was probably due to chance and that the null hypothesis should not be rejected.
26
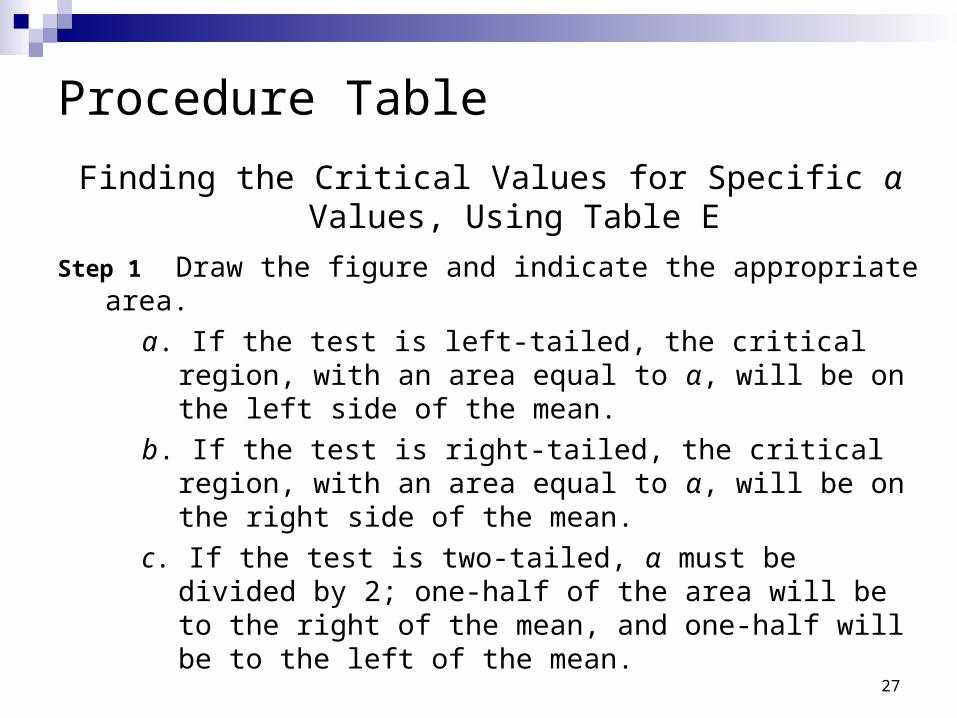
Procedure Table
Finding the Critical Values for Specific α Values, Using Table E
Step 1 Draw the figure and indicate the appropriate area.
a. If the test is left-tailed, the critical region, with an area equal to α, will be on the left side of the mean.
b. If the test is right-tailed, the critical region, with an area equal to α, will be on the right side of the mean.
c. If the test is two-tailed, α must be divided by 2; one-half of the area will be to the right of the mean, and one-half will be to the left of the mean.
27
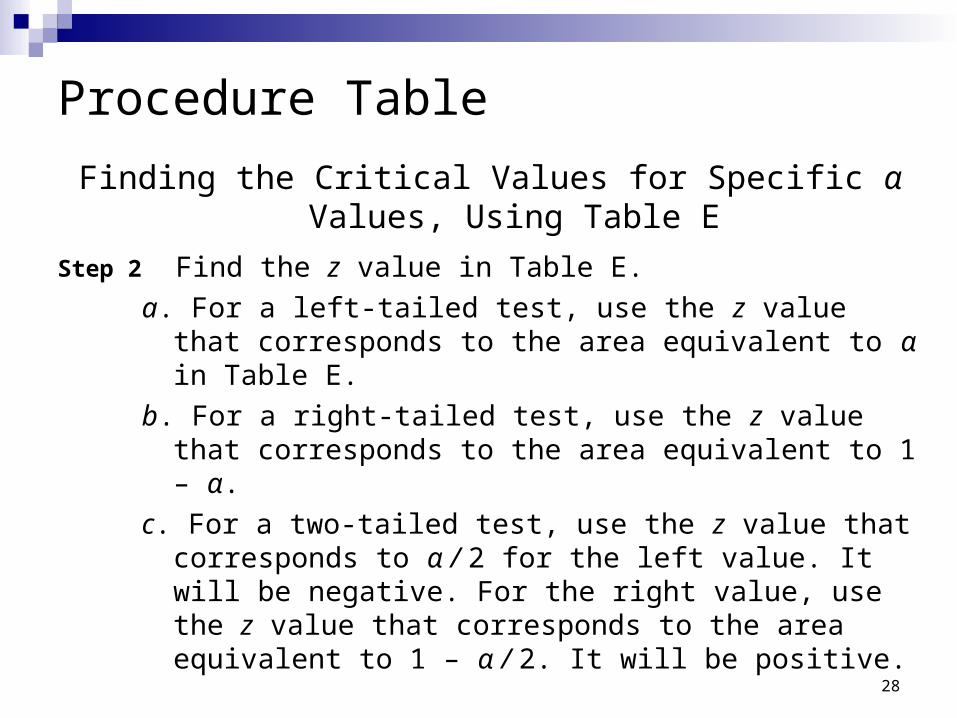
Procedure Table
Finding the Critical Values for Specific α Values, Using Table E
Step 2 Find the z value in Table E.
a. For a left-tailed test, use the z value that corresponds to the area equivalent to α in Table E.
b. For a right-tailed test, use the z value that corresponds to the area equivalent to 1 – α.
c. For a two-tailed test, use the z value that corresponds to α / 2 for the left value. It will be negative. For the right value, use the z value that corresponds to the area equivalent to 1 – α / 2. It will be positive.
28
Hypothesis Testing
29
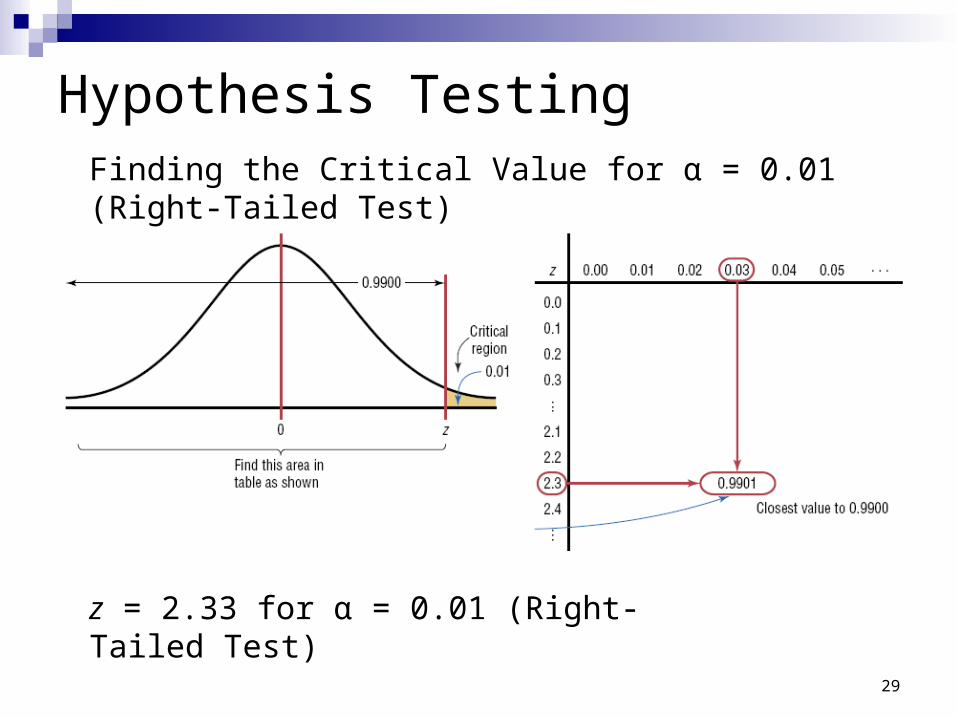
Finding the Critical Value for α = 0.01 (Right-Tailed Test)
z = 2.33 for α = 0.01 (Right-Tailed Test)

Hypothesis Testing
30
Finding the Critical Value for α = 0.05 (Left-Tailed Test)
Hypothesis Testing
31
Finding the Critical Value for α = 0.10 (Two-Tailed Test)
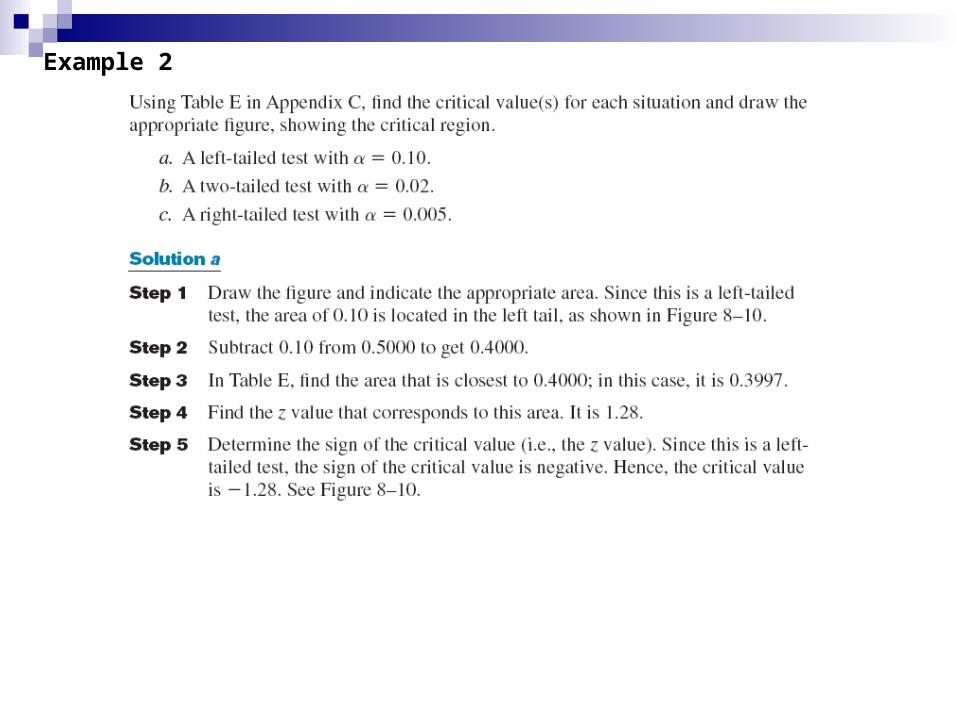
Using Standard Normal Distribution Table, find the critical value(s) for each situation and draw the appropriate figure, showing the critical region.
a. A left-tailed test with α = 0.10.
32
Using Standard Normal Distribution Table, find the critical value(s) for each situation and draw the appropriate figure, showing the critical region.
b. A two-tailed test with α = 0.02.
33
Using Standard Normal Distribution Table, find the critical value(s) for each situation and draw the appropriate figure, showing the critical region.
c. A right-tailed test with α = 0.005.
34
Example 2

Using the z table find the critical value (or values). α = 0.01
Example 3

Using the z table find the critical value (or values). α = 0.05
Example 4

Using the z table find the critical value (or values). α = 0.01
Two - tailed test.
Example 5