Chapter 7 Robotic Chewing Experiments* · 7.2 Force Measurement 181 To provide information on the...
28
W. Xu and J.E. Bronlund: Mastication Robots, SCI 290, pp. 179–206. springerlink.com © Springer-Verlag Berlin Heidelberg 2010 Chapter 7 Robotic Chewing Experiments* Abstract. The Crank Actuation masticatory robot of 6RSS parallel mechanism is applied to the chewing of foods. The forces on food samples during experiments were calculated from the recorded torques measured for each of the six actuators. A series of experiments were carried out on model and real food systems, and the re- sulting forces were discussed with respect to food texture. To begin with, the robot was compared with traditional uni-axial compression testing by implementing a one dimensional vertical crushing motion on the robot with flat plates used in place of the teeth. Very good agreement was found between the robot and texture ana- lyser force-deformation profiles. The robot was also tested against the measured force profiles recorded for a 2D trajectory used to simulate movement of the 2DOF 6-bar linkage robot. Again good agreement was found, particularly in the vertical dimension. Finally, the robot was used to simulate the trajectory of real time 3D re- corded human mandible movements during mastication. Vertical force measure- ments were consistent with the expected failure mechanism for each food. In each experiment unexpected forces in the non-vertical dimensions were found. These forces could be due to internal friction in robot linkages under loaded conditions. After identification and resolution of the cause of the unexpected x- and y-axis forces, the chewing robot will be suitable for use in analysing the initial textural properties of foods. Research into appropriate force control strategies, food bolus retention and re-orientation of the food on the teeth between cycles is required be- fore the machine can be realistically used to mimic whole chewing sequences and provide insight into the food texture dynamics during bolus formation. 7.1 Introduction Chapter 4 outlined the design of a Crank actuation masticatory robot of 6RSS par- allel mechanism. This device was developed to be able to reproduce human chew- ing trajectories in 6 degrees of freedom. Chapter 6 describes the techniques and analysis done to record mandible trajectories in humans during chewing of real foods. The geometries of a human subject and the robotic jaw are different. As * This chapter is based on work conducted by Jonathan Torrance, PhD student at the School of Engineering and Advanced Technology, Massey University, New Zealand.
Transcript of Chapter 7 Robotic Chewing Experiments* · 7.2 Force Measurement 181 To provide information on the...

W. Xu and J.E. Bronlund: Mastication Robots, SCI 290, pp. 179–206. springerlink.com © Springer-Verlag Berlin Heidelberg 2010
Chapter 7 Robotic Chewing Experiments*
Abstract. The Crank Actuation masticatory robot of 6RSS parallel mechanism is applied to the chewing of foods. The forces on food samples during experiments were calculated from the recorded torques measured for each of the six actuators. A series of experiments were carried out on model and real food systems, and the re-sulting forces were discussed with respect to food texture. To begin with, the robot was compared with traditional uni-axial compression testing by implementing a one dimensional vertical crushing motion on the robot with flat plates used in place of the teeth. Very good agreement was found between the robot and texture ana-lyser force-deformation profiles. The robot was also tested against the measured force profiles recorded for a 2D trajectory used to simulate movement of the 2DOF 6-bar linkage robot. Again good agreement was found, particularly in the vertical dimension. Finally, the robot was used to simulate the trajectory of real time 3D re-corded human mandible movements during mastication. Vertical force measure-ments were consistent with the expected failure mechanism for each food. In each experiment unexpected forces in the non-vertical dimensions were found. These forces could be due to internal friction in robot linkages under loaded conditions. After identification and resolution of the cause of the unexpected x- and y-axis forces, the chewing robot will be suitable for use in analysing the initial textural properties of foods. Research into appropriate force control strategies, food bolus retention and re-orientation of the food on the teeth between cycles is required be-fore the machine can be realistically used to mimic whole chewing sequences and provide insight into the food texture dynamics during bolus formation.
7.1 Introduction
Chapter 4 outlined the design of a Crank actuation masticatory robot of 6RSS par-allel mechanism. This device was developed to be able to reproduce human chew-ing trajectories in 6 degrees of freedom. Chapter 6 describes the techniques and analysis done to record mandible trajectories in humans during chewing of real foods. The geometries of a human subject and the robotic jaw are different. As * This chapter is based on work conducted by Jonathan Torrance, PhD student at the School
of Engineering and Advanced Technology, Massey University, New Zealand.

180 Chapter 7 Robotic Chewing Experiments
such the trajectory of the jaw with 6DOF can be faithfully reproduced at only one location on the robot. From the point of view of the magnitude and direction of the forces applied to the food it makes more sense to focus on the first molar on the active side rather than the more commonly reported incisor point. This considera-tion casts some doubt on some of the analysis of lateral and vertical amplitudes reported in the mastication physiology literature where magnitudes are compared between subjects. Similar jaw geometric differences will exist between the differ-ent subjects used in those studies. Comparison of molar trajectories would be a more fundamentally sound basis for analysis.
For these reasons, the trajectories recorded on the human subject were trans-lated from the incisor point to the active molar using the techniques described in Chapter 6. The coordinate system from the recorded trajectory and the robot were then aligned, providing a specified molar trajectory on the robot with the full 6 degrees of freedom (DOF) (x, y, z positions and roll, pitch, yaw angles). In this way the accurate reproduction of the molar and the functionality of the working surfaces of the teeth are achieved. Actuator positions could then be calculated us-ing the inverse kinematics of the robot (Chapter 4.3). By reproducing these human trajectories with the mastication robot, it is then possible to measure information on the resistance forces and deformation of food samples in real time and in three dimensions. Further details of this procedure are given in [1].
The true trajectory of the molars (and hence deformation of the food) will be potentially altered by passive compliance in the robotic design (i.e. backlash) or by the active compliance instigated by the control strategy used. As explained in Chapter 4.9.3, torque limits were set on each actuator, meaning that if the resis-tance to mandible movement is too high, the position of this actuator will be held (while the others continue to move) until it becomes able to move again within the torque limits. In this way the molar movement and food deformation could vary from the original set trajectory. It should be noted that this partial transfer from motion control to force control allows the fine detail of the molar trajectory during the occlusal portion of the motion to be defined by the gliding movement caused as the active surfaces of the opposing molars passing over each other.
It is interesting to note that the combined motion-compliance control strategy used in the robot is strikingly similar to how the mandible is though to be con-trolled in humans. Bosman et al. [2] described the broad approach to mastication control in humans. During the portions of movement where there is no contact with the food, motion is controlled through displacement sensor feedback. The vertical and lateral amplitudes of this part of the trajectory are highly variable and are probably related to keeping food in the correct location, evaluating and/or cop-ing with stickiness of the food to the teeth, the size of the food bolus and its tex-tural properties. Despite the widely varying opening and closing trajectories, the trajectory during occlusion is prescribed by the teeth shape. Accurate motion based control during this phase is not readily achievable and so as the teeth meet resistance from the food, force control is applied. It seems that enough force is ap-plied to try and achieve the gliding path prescribed by the molar shape, but not so much as to cause damage to the dental surfaces.

7.2 Force Measurement 181
To provide information on the magnitude and direction of the forces applied to the food during chewing, some method of estimating the forces must be employed. This chapter outlines how force measurement was achieved before outlining ex-periments where the mastication robot was applied to the chewing of real foods. To give some validation of the robot function and the method to estimate the forces, a simplified one dimensional crushing movement with a flat surface (rather than teeth) was used. This trajectory allowed direct comparison of the resulting forces with uni-axial compression tests carried out on a standard texture analyser used by food scientists. Following this, comparison of the forces measured by the 6-bar linkage robot (Chapter 5) was carried out by simulating its two dimensional trajectory in the 6DOF parallel robot. Finally experiments using a real three di-mensional trajectory were carried out. Although for this scenario there was no data to compare the chewing robot results with, the simulations demonstrated how the magnitude and directions of the forces on the teeth changed when a real jaw tra-jectory was used.
7.2 Force Measurement
Rather than using load cells or other sensors to directly monitor force on the food in this work, the measured torques recorded for each of the robots six actuators were used. The Galil DMC-1860 motion control card together with Galil supplied software was used to record the encoder positions and motor torque data. The Galil DMC-1860 can record the control signal sent to each actuator at any time in-stant. When operating in current source mode, this control signal is directly pro-portional to the current sent to the actuator, with the factor of proportionality being the amplifier gain set by jumper AG1 on the AMP-19540. With the torque con-stant of the DC motors also known, the actuator torque can be found dynamically during motion.
The approach used was based on a report by Simpson et al. [3] where a SCARA robot with high gear reduction of 80:1 similar to the our 6RSS chewing robot, or Massey Robotic Jaw, MRJ for short, was used to measure a small force of 3.5N at the end-effector from DC motor currents. The method involves taking consideration for inertia, friction, and position dependent force components. By running the trajectory first without food, all three of these components can be measured and removed from the food runs provided accurate position control throughout the movement is maintained.
One factor that could compromise accurate position control is the occurrence of saturated control signals as the total torque required to both accelerate the jaw and overcome forces due to food exceeds torque limits. For this reason it is an advan-tage to keep acceleration in joint space to a minimum. However it can be seen in the 6-dof experiments run at full speed that some acceleration can be tolerated, food forces are not extreme and only small positional errors are created allowing accurate force calculations to be obtained.
From the motor torque, forces can be calculated and projected through the 6-RSS linkages. The six force vectors can then be summed giving three force com-ponents and three torque components on the active molar expressed in the final
182 Chapter 7 Robotic Chewing Experiments
Skull frame. By using transformations the calculated force can be expressed in the Molar frame giving an insight into forces on the robots molar during chewing.
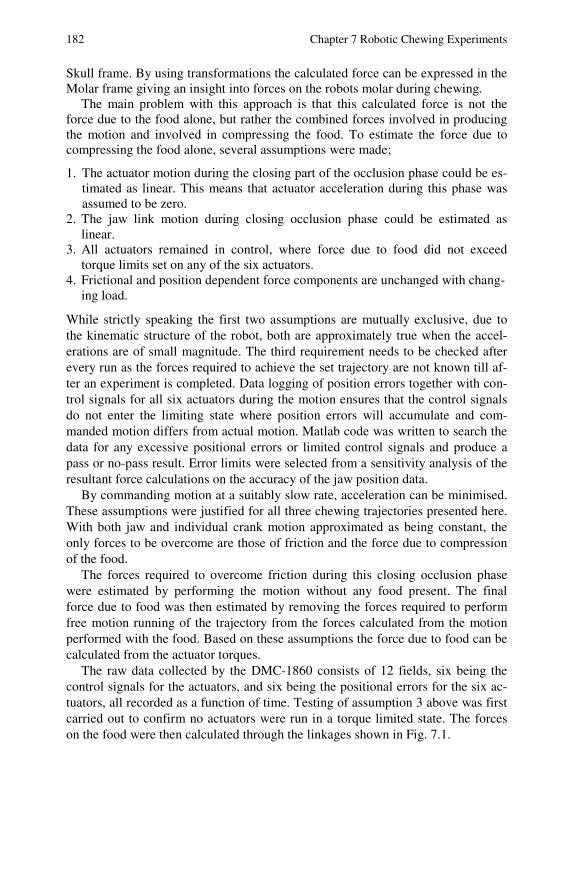
The main problem with this approach is that this calculated force is not the force due to the food alone, but rather the combined forces involved in producing the motion and involved in compressing the food. To estimate the force due to compressing the food alone, several assumptions were made;
1. The actuator motion during the closing part of the occlusion phase could be es-timated as linear. This means that actuator acceleration during this phase was assumed to be zero.
2. The jaw link motion during closing occlusion phase could be estimated as linear.
3. All actuators remained in control, where force due to food did not exceed torque limits set on any of the six actuators.
4. Frictional and position dependent force components are unchanged with chang-ing load.
While strictly speaking the first two assumptions are mutually exclusive, due to the kinematic structure of the robot, both are approximately true when the accel-erations are of small magnitude. The third requirement needs to be checked after every run as the forces required to achieve the set trajectory are not known till af-ter an experiment is completed. Data logging of position errors together with con-trol signals for all six actuators during the motion ensures that the control signals do not enter the limiting state where position errors will accumulate and com-manded motion differs from actual motion. Matlab code was written to search the data for any excessive positional errors or limited control signals and produce a pass or no-pass result. Error limits were selected from a sensitivity analysis of the resultant force calculations on the accuracy of the jaw position data.
By commanding motion at a suitably slow rate, acceleration can be minimised. These assumptions were justified for all three chewing trajectories presented here. With both jaw and individual crank motion approximated as being constant, the only forces to be overcome are those of friction and the force due to compression of the food.
The forces required to overcome friction during this closing occlusion phase were estimated by performing the motion without any food present. The final force due to food was then estimated by removing the forces required to perform free motion running of the trajectory from the forces calculated from the motion performed with the food. Based on these assumptions the force due to food can be calculated from the actuator torques.
The raw data collected by the DMC-1860 consists of 12 fields, six being the control signals for the actuators, and six being the positional errors for the six ac-tuators, all recorded as a function of time. Testing of assumption 3 above was first carried out to confirm no actuators were run in a torque limited state. The forces on the food were then calculated through the linkages shown in Fig. 7.1.

7.2 Force Measurement 183
Fig. 7.1 Torques and forces of a representative actuator ‘i’
First the control signal is converted into a current value based on amplifier gain of 0.7 A/V.
ViCi 7.0= (7.1)
where Ci is the current through actuator i , and Vi is the control signal in volts for actuator i . The actuator torque iT is then calculated using the DC torque con-
stants of the actuators.
669.25 ×= ii CT (7.2)
where the torque constants for the motors were 25.9mNm/A, and the gearing fac-tor magnified the torque by the ratio 66:1. From this, the actuator torque through the axis the actuators lie on is known, and could be converted to a force at points
iS where the actuator cranks are joined through spherical joints to links iL .
ii
ii CG
TFs = (7.3)
in which iFs is the force at point iS , and iiCG is the length of crank iC .
This force at points iS is directed at 90 degrees to the crank link iC , and the
force though links iL connecting the crank link to the mandible can be found by
projecting this force onto the link iL at a given time instant. It is noted that be-
cause of the spherical joints on either end of links iL , no torques can be transmit-
ted through the link and any force transmitted must be in the direction of the link at that time instant.
Ci

184 Chapter 7 Robotic Chewing Experiments
iiM
iiM
ii
SM
SMFsFl
•= (7.4)
where iFl is the force transmitted through link i , iiM SM is the vector from point
iS to point iM measured in the mandible reference frame. The six forces could
then be summed to give the resultant force acting on the mandible.
∑=
=6
1iiFlFm (7.5)
where Fm is the force at the mandible.
7.3 Experiments for One-DOF Chewing Trajectory
Initial experiments were carried out to verify the force calculation method and its associated assumptions, by comparing results with uni-axial compression tests made on a TAXT2 texture analyser [4]. The uni-axial test is a simple linear crush-ing motion with a flat probe and platform. The force-distance profile is recorded in one dimension using a load cell. The machine allows the cross head speed to be set, with two force thresholds used to set trigger recording at the start and end points of the motion. Compression was run at 1mm/second, and a force threshold of 0.1N was selected to trigger recording. Although the motion and teeth shape are not representative of the motion occurring during chewing, this method has been widely used to describe food texture [4].
Three samples were tested. A model food consisting of cast silicon rubber was used as this had very well defined properties. The material is completely elastic so the resisting force would increase on compression and it would relax to its original shape after it is released. Two real foods were used including a muesli bar, (a collec-tion of whole and flaked cereals bound together with a sticky sugar or honey based syrup) and uncooked dry noodles. The muesli bar was expected to deform on teeth-food contact after which individual particles can become trapped between the occlu-sal surfaces of the teeth and fracture or cutting of these components may occur. Dry noodles are an example of a hard brittle food that will fracture under stress.
The vertical 1DOF movement of the Texture Analyser was reproduced on the chewing robot so that the force applied on the texture analyser was aligned with the Skull frames z-axis. Consequently there was no motion in the x- and y-axes of the Skull frame, or rotation about any of the three Skull axes. The velocity was set to be constant at 1mm/s in the positive direction of the Skull frames z-axis. There was no acceleration specified during the movement. The displacement and veloc-ity-time profiles of the 1DOF trajectory are shown in Figs. 7.2 and 7.3 below.
Before the force measurement could be replicated on the mastication robot, some modifications were required. The TATX2 uses two flat aluminium surfaces

7.3 Experiments for One-DOF Chewing Trajectory 185
0 1 2 3 4 5-21
-20.5
-20
-19.5
-19
-18.5
-18
-17.5
-17
-16.5
-16Displacement in Z-axis for texture analyser trajectory
Time (s)
Dis
plac
emen
t (m
m)
Fig. 7.2 z-axis displacement of the lower jaw in the Skull reference frame for the 1DOF trajectory
0 1 2 3 4 5
1
Speed in Z-axis direction for texture analyser trajectory
Time (s)
Z-a
xis
spee
d (m
m/s
)
Fig. 7.3 Velocity of the lower jaw plate in the Skull reference frame.
to compress the food sample between. To test comparable geometries, the robots lower set of teeth were removed leaving the flat machined aluminium mounting plate which is comparable to the base used on the texture analyser. The upper set

186 Chapter 7 Robotic Chewing Experiments
of teeth was replaced with a machined aluminium block (much larger in area than the food sample), with flat surfaces comparable to the upper probe used on the texture analyser.
The texture analyser motion was then programmed to run on the masticatory robot and the forces were recorded as the food was compressed. It should be noted that actuations are required for all six motors to achieve this linear trajectory. Comparisons of the vertical forces are shown for the silicon rubber model food system in Fig. 7.4.
0 1 2 3 40
20
40
60
80
100
120
140
Compression (mm)
For
ce (
N)
Force-Compression in Z-axis for plastic food measured on MRJ and texture analyser
MRJ
Texture analyser
Fig. 7.4 Typical force profile on the 20mm plastic food sample as measured by the chewing robot (MRJ) and the texture analyser for a 1DOF motion
It can be clearly seen in Fig. 7.4 and Table 7.1 that there is very good agree-ment in the shape and magnitude of the force-deformation curves for the silicon rubber material, suggesting that the force in the chewing robot is being calculated correctly.
Table 7.1 Comparison between the chewing robot and the texture analyser force measure-ments in the silicon rubber model food system

7.3 Experiments for One-DOF Chewing Trajectory 187
The force-distance curve measured for muesli bars (Fig. 7.5) shows more com-plex mechanical behaviour than for silicon rubber. Although the curve is approxi-mately linear, curvature is observed due to the multiple components present in muesli bars which possess different mechanical properties. There is again very good agreement between the uni-axial compression test and the chewing robot. The mean results after 4mm of compression are summarised in Table 7.2.
0 1 2 3 40
5
10
15
20
25
30
35
40
45Force-Compression in Z-axis for muesli food measured on MRJ and texture analyser
Compression (mm)
For
ce (
N)
MRJ
Texture analyser
Fig. 7.5 Typical force profile as measured by the chewing robot and texture analyser for 1DOF motion on a muesli bar food sample
Table 7.2 Comparison between the chewing robot and the texture analyser force measure-ments in the muesli bar food system
Uncooked noodles are a hard brittle material which fractures on compression rather than deforming. This can be seen in Fig. 7.6 below where for both the tex-ture analyser and the chewing robot, multiple fracture events are observed over the first 1.5mm. When a fracture event occurs, the resistance of the force is momen-tarily relaxed, before building again. A peak force is observed of 60-70N after

188 Chapter 7 Robotic Chewing Experiments
0 1 2 3 40
10
20
30
40
50
60
70
80Force-Compression in Z-axis for uncooked noodle food measured on MRJ and texture analyser
Compression (mm)
For
ce (
N)
MRJ
Texture analyser
Fig. 7.6 Typical force profile as measured by the chewing robot and texture analyser for 1DOF motion on an uncooked noodle food sample
Table 7.3 Comparison between the chewing robot and the texture analyser force measure-ments in the uncooked noodle food system.
which a large fracture failure is observed. The force then builds again because by this stage much of the open airspace between the noodles has been filled with bro-ken particles and these fragments begin to be compressed.
Both methods demonstrate this fracture behaviour exhibiting similar peak forces, initial fracturability (force at the first failure event), and strain at failure (product deformation at the point where peak force is observed). The magnitude of the reproducibility within each test method was similar to the differences observed between the chewing robot and the texture analyser. This is shown in Table 7.3.
Overall the results show the chewing robot can function well as a 1DOF texture analyser machine and the force calculation method is valid. These forces applied on the food were contributed to by all of the actuators involved in the robotic movement.

7.4 Experiments with Two-DOF Chewing Trajectory 189
7.4 Experiments with Two-DOF Chewing Trajectory
To validate the chewing robot against more complex trajectories, it was compared against force profiles collected using the 6-bar linkage chewing robot discussed in chapter 5. The 2D linkage robot achieves a proscribed two dimensional molar trajectory with anatomically correct dentition. The linkage chewing machine in-corporates a 3D force sensor integrated under the lower jaw which allows the resultant forces on the food to be recorded as foods undergo mastication. The mo-tion was run at approximately 2mm/s in the z-axis direction on both the linkage robot and the 6DOF parallel chewing robot, to ensure any possible influence due to robot dynamics was minimised.
The trajectory of the 2D machine reproduced in the 6DOF chewing robot. The original data recorded using the 2D robot encoder consisted of 370 points for the full cycle. Fig. 7.7 below shows the actual trajectory actuated in the 2D chewing robot. Note that occlusion of the molar teeth occur at z-axis displacements greater than 0. Negative values represent the opening and closing phases of the motion.
Because force measurements are of interest during the occlusion phase, the closing position and angle were matched with the 6DOF chewing robot. Exact re-production of the non-occlusal phase was not required and so the non-occlusion phase was truncated to allow the trajectory to fit within the 6DOF chewing robots smaller workspace. As this part of the trajectory is not where the food is com-pressed, it would not affect the forces recorded. The roll pitch and yaw angles of the mandible were all held constant at 0 degrees. Fig. 7.8 shows the full trajectory applied to the 6DOF chewing robot. Only the occlusal phase of the trajectory in Fig. 7.8 involved food compression.
Figure 7.9 shows the implemented trajectory during which forces were meas-ured. Inspection of the velocity and acceleration of the trajectory was important as it is possible that any large acceleration during the movement could lead to errors in the force calculation. Figs. 7.10 and 7.11 show the velocity and acceleration profiles of the mandible movement.
It can be seen that there are a number of sharp inflection points in both the ve-locity and acceleration plots due to the discrete nature of the data used. Motion was implemented with linear interpolation between points. An attempt was made to smooth the motion by using an Akima spline in Solidworks and taking more points for the trajectory but an improvement was not seen. Despite the spikes, the magnitude of acceleration is small and unlikely to cause problems when calculat-ing forces.
A typical force profile from running the 2D trajectory on both the 6DOF chew-ing robot and the 2D chewing machine is shown in Fig. 7.12 for the 20mm silicon rubber model food system.

190 Chapter 7 Robotic Chewing Experiments
-2 -1 0 1 2 3-30
-20
-10
0
10Y-Z Plot (front view)
Y-axis displacement (mm)
Z-a
xis
disp
lace
men
t (m
m)
-10 -5 0 5-30
-20
-10
0
10X-Z Plot (side view)
X-axis displacement (mm)
Z-a
xis
disp
lace
men
t (m
m)
-10 -5 0 5-2
-1
0
1
2
3X-Y Plot (top view)
X-axis displacement (mm)
Y-a
xis
disp
lace
men
t (m
m)
0 22 44 66 88-10
-5
0
5X-time plot
Time (s)
X-a
xis
disp
lace
men
t (m
m)
0 22 44 66 88-2
-1
0
1
2
3Y-time plot
Time (s)
Y-a
xis
disp
lace
men
t (m
m)
0 22 44 66 88-30
-20
-10
0
10Z-time plot
Time (s)
Z-a
xis
disp
lace
men
t (m
m)
Fig. 7.7 Trajectory implemented on 2D linkage chewing robot during experimental trials

7.4 Experiments with Two-DOF Chewing Trajectory 191
-1 0 1 2 3 4-25
-20
-15
-10
-5
0Y-Z Plot (front view)
Y-axis displacement (mm)
Z-a
xis
disp
lace
men
t (m
m)
-8 -6 -4 -2 0-25
-20
-15
-10
-5
0X-Z Plot (side view)
X-axis displacement (mm)
Z-a
xis
disp
lace
men
t (m
m)
-8 -6 -4 -2 0-1
0
1
2
3
4X-Y Plot (top view)
X-axis displacement (mm)
Y-a
xis
disp
lace
men
t (m
m)
0 22 44 66 88-8
-6
-4
-2
0X-time plot
Time (s)
X-a
xis
disp
lace
men
t (m
m)
0 22 44 66 88-1
0
1
2
3
4Y-time plot
Time (s)
Y-a
xis
disp
lace
men
t (m
m)
0 22 44 66 88-25
-20
-15
-10
-5
0Z-time plot
Time (s)
Z-a
xis
disp
lace
men
t (m
m)
Fig. 7.8 The 6DOF chewing robot trajectory implemented to approximate the 2D chewing robot motion

192 Chapter 7 Robotic Chewing Experiments
-1 0 1 2 3 4-25
-20
-15
-10
-5
0Y-Z Plot (front view)
Y-axis displacement (mm)
Z-a
xis
disp
lace
men
t (m
m)
-8 -6 -4 -2 0-25
-20
-15
-10
-5
0X-Z Plot (side view)
X-axis displacement (mm)
Z-a
xis
disp
lace
men
t (m
m)
-8 -6 -4 -2 0-1
0
1
2
3
4X-Y Plot (top view)
X-axis displacement (mm)
Y-a
xis
disp
lace
men
t (m
m)
0 22-8
-6
-4
-2
0X-time plot
Time (s)
X-a
xis
disp
lace
men
t (m
m)
0 22-1
0
1
2
3
4Y-time plot
Time (s)
Y-a
xis
disp
lace
men
t (m
m)
0 22-25
-20
-15
-10
-5
0Z-time plot
Time (s)
Z-a
xis
disp
lace
men
t (m
m)
Fig. 7.9 Occluding phase of the 2D trajectory as implemented on the 6DOF chewing robot

7.4 Experiments with Two-DOF Chewing Trajectory 193
0 22-0.2
0
0.2
0.4
0.6X-time plot
Time (s)
X-a
xis
spee
d (m
m/s
)
0 22-0.4
-0.3
-0.2
-0.1
0Y-time plot
Time (s)
Y-a
xis
spee
d (m
m/s
)
0 22-1
0
1
2Z-time plot
Time (s)
Z-a
xis
spee
d (m
m/s
)
Fig. 7.10 Mandible (molar) velocity implemented in the chewing robot during reproduction of the 2D linkage robot trajectory

194 Chapter 7 Robotic Chewing Experiments
0 22-0.5
0
0.5X-time plot
Time (s)
X-a
xis
acce
lera
tion
(mm
/s2 )
0 22-0.5
0
0.5Y-time plot
Time (s)
Y-a
xis
acce
lera
tion
(mm
/s2 )
0 22-0.2
-0.1
0
0.1
0.2Z-time plot
Time (s)
Z-a
xis
acce
lera
tion
(mm
/s2 )
Fig. 7.11 Mandible (molar) acceleration implemented in chewing robot during reproduction of 2D linkage robot trajectory
7.4 Experiments with Two-DOF Chewing Trajectory 195
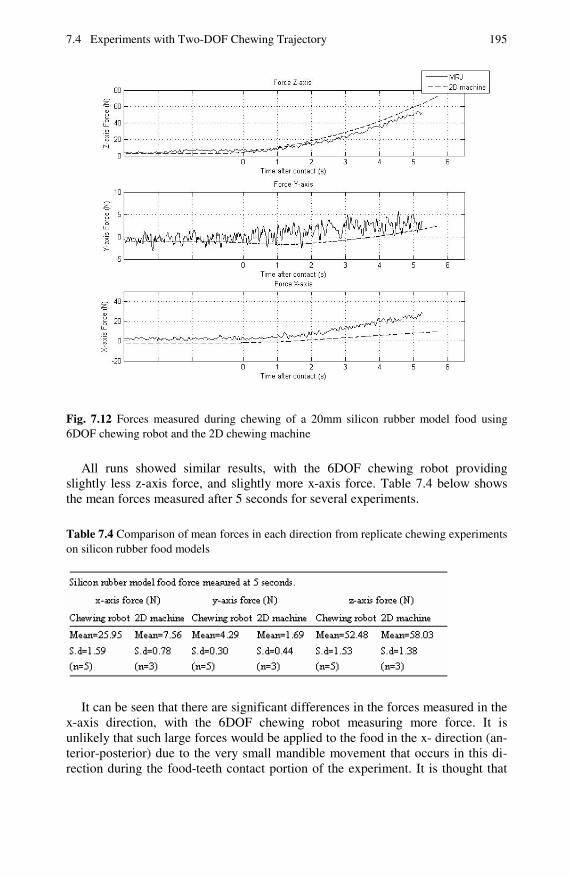
Fig. 7.12 Forces measured during chewing of a 20mm silicon rubber model food using 6DOF chewing robot and the 2D chewing machine
All runs showed similar results, with the 6DOF chewing robot providing slightly less z-axis force, and slightly more x-axis force. Table 7.4 below shows the mean forces measured after 5 seconds for several experiments.
Table 7.4 Comparison of mean forces in each direction from replicate chewing experiments on silicon rubber food models
It can be seen that there are significant differences in the forces measured in the x-axis direction, with the 6DOF chewing robot measuring more force. It is unlikely that such large forces would be applied to the food in the x- direction (an-terior-posterior) due to the very small mandible movement that occurs in this di-rection during the food-teeth contact portion of the experiment. It is thought that

196 Chapter 7 Robotic Chewing Experiments
under loaded conditions (i.e. when the teeth come into contact with the food) the loss of passive compliance combined with the geometric arrangement of the robot causes the propagation of reaction forces in some of the jaw joints. Similar behav-iour was observed in the one dimensional experimental trials (data not shown) where significant x-direction forces were observed although the only x-dimensional movement was that caused by mechanical compliance. Further work is required to resolve this issue before the device could be used to characterise the forces applied to food samples. Direct measurement of the forces on the molar teeth in 3D would add some clarification of what is occurring during the loaded operation of the robot. Despite these differences, there is very good agreement in the trend and magnitude of the forces applied on the food.
Fig. 7.13 shows similar experimental results during chewing of biscuits. As ex-pected for brittle food systems such as biscuits, the results show multiple fracture events occurring during deformation. As observed for the silicon rubber food model above, significant forces were applied in the x-direction. The similarity in shape between the z- and x- direction forces reinforces the explanation discussed above. The magnitude of force in the x-direction is highly correlated to the force applied in the z-direction and it may be that as more vertical load is applied, the internal resistance of the robot linkages increase in the x-direction.
Fig. 7.13 Forces measured during chewing of a biscuit using the 6DOF chewing robot and the 2D chewing machine

7.4 Experiments with Two-DOF Chewing Trajectory 197
Table 7.5 compares the average differences in force in each direction for sev-eral replicate experiments. It can be seen that for both machines there is a rela-tively large spread of forces for the different trials, especially in the z-axis. This is typical of a brittle food where multiple fracture events occur during compressive strain.
Similar experiments were carried out for muesli bar food samples (Fig. 7.14). This experiment showed excellent agreement in the z-dimension between the 6DOF chewing robot and the 2D chewing machine.
Table 7.5 Comparison of mean forces in each direction from replicate chewing experiments on biscuit food samples.
Fig. 7.14 Forces measured during chewing of a muesli bar using the 6DOF chewing robot and the 2D chewing machine

198 Chapter 7 Robotic Chewing Experiments
The resistance force due to the shearing lateral movement of the trajectory is evident in the recorded force measurements in the y-axis. There is good agreement in the magnitude of this component of the forces applied to the foods. The prob-lem with measured forces in the x-direction, as discussed above was again present during the experiments with muesli bars. Table 7.6 below shows that there was good repeatability in the measured forces in the y- and z-axes and good agreement between the two chewing machines.
Table 7.6 Comparison of mean forces in each direction from replicate chewing experiments on muesli bar food samples
7.5 Experiments with Six-DOF Chewing Trajectory
A jaw trajectory recorded from a human subject using the AG500 articulograph (see Chapter 6) was run on the 6DOF chewing robot with various food samples. The resulting forces were then analysed, both at the chewing surface and for the six actuators. This was carried out as the robot was designed from biological prin-ciples and the six actuators mimic the work of the biological muscles of the human subject. The full trajectory implemented on the robot is shown in Fig. 7.15. The plot showing z-axis displacement versus time shows the dynamics of the chewing process. As the number of chewing cycles increase, the z-axis displacement at the top of the chewing motion reduces. This is likely to reflect the breakdown of the food properties so that the molars come closer together due to the reduced resis-tance imparted by the foods. Close to full occlusion occurs after approximately 10 chewing cycles.
The displacement plot for the y-axis shows that lateral movement during the opening phase of each chewing cycle was most often to the right. After six cycles, a short series of cycles were directed to the left. This could have been done to maintain the position or manipulate the orientation of the food on the occlusal ta-ble between cycles. Alternatively it could signal transfer of the bolus to the other side of the dental arch for a few chewing cycles.
The x-axis displacement also changed throughout the chewing process. During the initial few chewing strokes, the amplitude of the anterior-posterior movements was relatively large. The amount of forward jaw movement decreased as the food breaks down and the trajectory of the teeth during the teeth-food contact period moves closer to 0 mm z-axis displacement. During this later stage where much

7.5 Experiments with Six-DOF Chewing Trajectory 199
-4 -3 -2 -1 0 1 2 3-15
-10
-5
0
5Y-Z P lot (front view)
Y-axi s di splacement (mm)
Z-a
xis
dis
pla
ce
me
nt (
mm
)
-5 -4 -3 -2 -1 0 1 2-15
-10
-5
0
5X-Z P lot (side view)
X-axis displacement (mm )
Z-a
xis
dis
pla
cem
ent
(mm
)
-3 -2 -1 0 1 2 3-4
-3
-2
-1
0
1
2Y-X P lot (top view)
Y-axi s di splacement (mm)
X-a
xis
dis
pla
cem
ent
(m
m)
0 5 10 15 20 25 30 35 40-4
-3
-2
-1
0
1
2X-t ime plot
Tim e (s)
X-a
xis
dis
pla
cem
ent
(mm
)
0 5 10 15 20 25 30 35 40-3
-2
-1
0
1
2
3Y-t ime plot
Time (s)
Y-a
xis
dis
pla
cem
ent
(m
m)
0 5 10 15 20 25 30 35 40-15
-10
-5
0
5Z-t ime plot
Tim e (s)
Z-a
xis
dis
pla
cem
ent
(mm
)
Fig. 7.15 3D human trajectory converted for implementation on the chewing robot. Note that in the first 14 seconds the jaw position was held constant to provide a reference point for the orientation of the jaw.
smaller forward movements occur, it can be seen that the x-axis displacement ap-proaches 0 mm, showing that the molar teeth are correctly aligned for occlusion.
As this is a real chewing trajectory it has 6 degrees of freedom. The roll, pitch and yaw movements are shown in Fig 7.16. The tilting of the jaw forwards as the jaw is opened can be seen in the pitch-time plot. This is the largest rotational movement and the maximum angle (at maximum z-axis displacement) is relatively uniform between cycles. The roll and yaw angles follow a consistent pattern but do exhibit a transfer from positive to negative directions periodically during the mastication duration. These observations correspond to the cycles where meas-urements of negative x- and y-axis displacements were recorded, indicating that it is most likely that the active chewing side was switched for these few cycles.
For the experiments run on food samples, only a single chewing cycle was im-plemented. The occlusion movement starting at approximately 20 seconds into the trajectory was selected as it was one of the wider opening movements so larger

200 Chapter 7 Robotic Chewing Experiments
food samples could be tested. Fig. 7.17 shows the single closing chewing trajec-tory run on the foods. Looking from the top view (x-y plane) it can be seen that the molars approach the upper teeth from the right and rear of intercuspal occlu-sion and move slightly beyond the intercuspal position in the y-dimension. Movement in the z-axis does not reach occlusion, suggesting that during the par-ticular bite, for which the measurements were recorded, the food did not fully de-form and teeth to teeth contact could not occur. This explains why the maximum x-axis position was about 1mm behind the intercuspal location. If the jaw contin-ued on to reach 0mm in the z-axis, the 1mm or so of forward movement (x-axis) of the jaw to reach full occlusion would occur.
0 5 10 15 20 25 30 35 40-0.02
-0.01
0
0.01
0.02
0.03Roll-time plot
Time (s)
Rol
l (ra
d)
0 5 10 15 20 25 30 35 40-0.02
0
0.02
0.04
0.06
0.08
0.1Pitch-time plot
Time (s)
Pitc
h (r
ad)
0 5 10 15 20 25 30 35 40-0.04
-0.02
0
0.02
0.04
0.06Yaw-time plot
Time (s)
Yaw
(ra
d)
Fig. 7.16 Jaw angle profile for the 3D human jaw trajectory implemented on the chewing robot

7.5 Experiments with Six-DOF Chewing Trajectory 201
-0.5 0 0.5 1 1.5 2-15
-10
-5
0Y-Z Plot (front view)
Y-axis displacement (mm)
Z-a
xis
disp
lace
men
t (m
m)
-3 -2.5 -2 -1.5 -1 -0.5-15
-10
-5
0X-Z Plot (side view)
X-axis displacement (mm)
Z-a
xis
disp
lace
men
t (m
m)
-0.5 0 0.5 1 1.5 2-3
-2.5
-2
-1.5
-1
-0.5Y-X Plot (top view)
Y-axis displacement (mm)
X-a
xis
disp
lace
men
t (m
m)
0.5 1-3
-2.5
-2
-1.5
-1
-0.5X-time plot
Time (s)
X-a
xis
disp
lace
men
t (m
m)
0.5 1-0.5
0
0.5
1
1.5
2Y-time plot
Time (s)
Y-a
xis
disp
lace
men
t (m
m)
0.5 1-15
-10
-5
0Z-time plot
Time (s)
Z-a
xis
disp
lace
men
t (m
m)
Fig. 7.17 A single chewing cycle implemented on the chewing robot to simulate 3D human chewing movements
The changes in mandible rotation used to simulate the recorded human mastica-tory cycle during the occlusal phase are summarised in Fig. 7.18. The pitch (rota-tion about the y-axis) is the motion of the jaw closing, and approached an approximately flat angle at the point where the teeth contact each other. As ex-pected, this angle is the largest of the three rotational dimensions of the jaw. The roll (rotation about the x-axis), represents the angle that the teeth twist in the lat-eral direction. The teeth become aligned as they approach each other. The yaw (rotation about the z-axis) can be interpreted as the chin pointing left or right and similarly rotates to be back in line with the upper jaw by the time of tooth contact. It can be seen that in the trajectory there is some rotational movement occurring on the teeth before full occlusion occurs, and this will apply more complex stress patterns on the food than that which occurred during the one and two dimensional trajectories implemented in the earlier experiments.

202 Chapter 7 Robotic Chewing Experiments
0.5 1-0.005
0
0.005
0.01
0.015
0.02
0.025Roll-time plot
Time (s)
Rol
l (R
ad)
0.5 1-0.02
0
0.02
0.04
0.06Pitch-time plot
Time (s)
Pitc
h (R
ad)
0.5 10
0.005
0.01
0.015
0.02
0.025Yaw-time plot
Time (s)
Yaw
(R
ad)
Fig. 7.18 Jaw rotation angle – time profiles during the implemented simulated human chewing cycle
Fig. 7.19 shows the velocity profile implemented during this phase of the tra-jectory. It can be seen that in each direction, the jaw velocity increased to a maxi-mum before reducing to zero at the point where opening was initiated.
Force results were recorded for three food samples using this section of the tra-jectory at full human speed. Biscuit, marshmallow and corn thins were used to demonstrate application of the chewing robot to real human mastication simula-tion. These foods were used as their dimensions were small enough to be able to place the foods between the upper and lower molars at the start of the imple-mented trajectory. Biscuits were used to represent a moderately hard, brittle food and to allow comparison with the results observed for this product using the 2D trajectory outlined above. The use of marshmallows tested operation of the robot with a soft partially elastic food that exhibited no fracture behaviour. Corn thins are an extruded maize-flour based product with a light porous structure. The mate-rial is ‘crunchy’ and undergoes fracture on compression but is tougher than the biscuit product.

7.5 Experiments with Six-DOF Chewing Trajectory 203
0 0.5 1-2
0
2
4X-time plot
Time (s)
X-a
xis
spee
d (m
m/s
)
0 0.5 1-6
-4
-2
0
2Y-time plot
Time (s)
Y-a
xis
spee
d (m
m/s
)
0 0.5 1-10
0
10
20Z-time plot
Time (s)
Z-a
xis
spee
d (m
m/s
)
Fig. 7.19 Jaw velocity profile implemented in the single cycle human chewing simulation
Fig. 7.20 Measured force profiles on the molars during simulated 3D human trajectory ap-plied to biscuit

204 Chapter 7 Robotic Chewing Experiments
Fig. 7.20 shows the recorded force profiles applied during chewing of biscuits. The curve is relatively smooth in comparison with the jagged force profile ob-served for biscuits using the previous 2D experiments (Fig. 7.13). This was due to the much shorter time used for the human trajectory experiments. At faster jaw speed, fracture events occur in very quick succession and as a result, the force re-laxation recorded after fracture at low speed will not be as evident. From the re-sults in the z-direction, two larger scale force relaxations were evident during the compression phase of the cycle, indicating failure and that associated large scale structural changes did occur in the sample.
At the start of the cycle the x-axis data was again strongly correlated with the in-crease in force in the z-direction. The x-axis movement of the jaw is occurring at this time, so force in this direction might be expected. As discussed above however, this could indicate the propagation of some internal forces in the linkages of the ro-bot. It is interesting however that after about 0.5 seconds, this force drops away to almost zero. At the same point there is an increase in y-axis force. A detailed analy-sis of the forces within the robot is required to resolve whether or not these meas-ured forces are actually being applied onto the food or due to internal friction in the mechanism. This must be carried out before a full analysis of the data in terms of food resistances can be made. The direct measurement of the forces applied onto the teeth may be more appropriate than calculating them from the motor torques.
Fig. 7.21 shows the measured force profiles recorded during a similar experi-ment using marshmallow as the food system. Due to soft texture of the food, the measured magnitudes of the forces in each direction are low. This could reflect the trajectory used in this experiment where complete occlusion and hence complete deformation of the product was not made. This result highlights an important issue in operation of the robot. If human trajectories are simulated exactly, the forces measured are those that must be applied to achieve this specified degree of defor-mation on the food. An alternative strategy would be to set the robot to achieve full occlusal trajectory but implement some form of force control that allows in-complete deformation of the food if the resistance of the food is too high. Opera-tion of this second approach using different torque thresholds on the robot could be carried out until the actual human trajectory is matched. This would provide in-formation on the force limits used during human mastication for subjects and how these might vary for different food types or the trajectory used.
Fig. 7.21 Measured force profiles on the molars during a simulated 3D human trajectory applied to marshmallow

7.6 Summary 205
Fig. 7.22 Measured force profiles on the molars during simulated 3D human trajectory ap-plied to corn thins
Fig. 7.22 shows the force profile measured using the chewing robot for the corn thin food product. A similar pattern in which x-axis force is present during the early stages of the motion which is later translated into y-axis direction forces. There is a steady increase in vertical forces until at just after 1 second the forces are reduced as the jaw begins the opening phase of the trajectory. The inflection points on the curve suggest fracture events occurring as observed for the biscuit product. The next stage of development in the robot must resolve whether internal friction forces within the robotic linkages are contributing to the measured x- and y-axis forces when the jaw is under load. Implementation of a miniature 3D force sensor such as used in the 6-bar linkage robot (Chapter 5) could provide direct measurements of the local forces applied on the food.
7.6 Summary
The application of the 6RSS parallel chewing robot to food chewing experiments was described. The force vector applied on the active molar was calculated from the measured torques applied on the six actuators using an analysis of forces through the linkage mechanism. A series of experiments were carried out using model and real food systems. Experiments where the robot jaw was made to fol-low a one dimensional trajectory showed very good agreement with measured force-deformation curves measured by uni-axial compression testing. As a further stage of validation of the robot, the molar trajectory of the 6-bar linkage chewing robot was reproduced. Good agreement was observed between the z- and y- direc-tion force-profiles measured using both machines, but significant x-axis forces were recorded on the parallel mechanism robot. It is thought that these could be due to internal friction in the linkages under conditions where the jaw is loaded. Experiments were also carried out simulating 3D recorded human trajectories showing expected profiles in the z-direction but unexplained force profiles in the x- and y-dimensions. Further work interpreting these forces or alternatively the di-rect measurement of forces using a sensor is required. Once this has been com-pleted, testing of various force control strategies can begin.
The work here shows promise for application of the robot to characterise food texture, however a number of future developments are required before simulation of complete chewing sequences can be carried out. One of the key features that must be added to achieve this is retention and manipulation of the food bolus be-tween chewing cycles.

206 Chapter 7 Robotic Chewing Experiments
References
1. Torrance, J., et al.: Human Jaw Motion Measurement, Analysis, and Robotic Reproduc-tion. In: Proceedings of the 15th International Conference on Mechatronics and Ma-chine Vision in Practice, Auckland, New Zealand, December 2–4, pp. 286–293 (2008)
2. Bosman, F., et al.: Neuromuscular control mechanisms in human mastication. J. of Tex-ture Stud. 35, 201–221 (2004)
3. Simpson, J.W.L., Cook, C.D., Li, Z.: Sensorless force estimation for robots with fric-tion. In: Proceedings of the 2002 Australasian Conference on Robotics and Automation, Auckland, New Zealand, November 27-29, pp. 94–99 (2002)
4. Bourne, M.C.: Food Texture and Viscosity: Concept and Measurement. Academic Press, San Diego (2002)