
Chapter 7 Hydropower: Conflict or Synergy?
14
Chapter 7 Biodiversity Restoration and Renewable Energy from Hydropower: Conflict or Synergy? Wondmagegn Tafesse Tirkaso, Ing‐Marie Gren, Leonard Sandin, Joel Segersten, David Spjut and Erik Degerman Additional information is available at the end of the chapter http://dx.doi.org/10.5772/intechopen.69134 Abstract Hydropower plants have a negative impact on biodiversity by transforming stream habitat and hydrology and thereby affecting aquatic organisms negatively. The negative effects can be mitigated by releasing water into the old river bed. This study investigates if the measure of releasing water creates costs and if ecological conditions at the old river bed contribute to such an impact. To this end, we used the cost-minimization framework in economics for deriving hypotheses. Tests were made with data from a survey to 76 hydropower plants in Sweden with questions on existence of a cost, size of the plant, type of water release from reservoirs, characteristics of the dried downstream old river bed, and official statistics on ecological status of the downstream dried segments. The results showed that 42% of the plants reported no cost, measured as impact on electricity production, from release of water into downstream old river bed. We applied logit and probit models to explain the probability of a cost. Significant results were obtained were the electricity produced and program for minimum water discharges increase the prob- ability of loss in electricity production, but favorable ecological conditions in the old river bed decrease the probability of a cost. Keywords: hydropower, biodiversity, streams and rivers, restoration, old river bed, cost, survey data, econometrics, Sweden 1. Introduction Similar to many other countries, Sweden needs to comply with national and international targets on renewable energy and biodiversity provision. Hydropower is important for the © 2018 The Author(s). Licensee IntechOpen. This chapter is distributed under the terms of the Creative Commons Attribution License (http://creativecommons.org/licenses/by/3.0), which permits unrestricted use, distribution, and reproduction in any medium, provided the original work is properly cited.
Transcript of Chapter 7 Hydropower: Conflict or Synergy?
Chapter 7
Biodiversity Restoration and Renewable Energy fromHydropower: Conflict or Synergy?
Wondmagegn Tafesse Tirkaso, Ing‐Marie Gren,Leonard Sandin, Joel Segersten, David Spjut andErik Degerman
Additional information is available at the end of the chapter
http://dx.doi.org/10.5772/intechopen.69134
Provisional chapter
Biodiversity Restoration and Renewable Energy fromHydropower: Conflict or Synergy?
Wondmagegn Tafesse Tirkaso, Ing-Marie
Gren, Leonard Sandin, Joel Segersten, David
Spjut and Erik Degerman
Additional information is available at the end of the chapter
Abstract
Hydropower plants have a negative impact on biodiversity by transforming streamhabitat and hydrology and thereby affecting aquatic organisms negatively. The negativeeffects can be mitigated by releasing water into the old river bed. This study investigatesif the measure of releasing water creates costs and if ecological conditions at the old riverbed contribute to such an impact. To this end, we used the cost-minimization frameworkin economics for deriving hypotheses. Tests were made with data from a survey to 76hydropower plants in Sweden with questions on existence of a cost, size of the plant,type of water release from reservoirs, characteristics of the dried downstream old riverbed, and official statistics on ecological status of the downstream dried segments. Theresults showed that 42% of the plants reported no cost, measured as impact on electricityproduction, from release of water into downstream old river bed. We applied logit andprobit models to explain the probability of a cost. Significant results were obtained werethe electricity produced and program for minimum water discharges increase the prob-ability of loss in electricity production, but favorable ecological conditions in the oldriver bed decrease the probability of a cost.
Keywords: hydropower, biodiversity, streams and rivers, restoration, old river bed,cost, survey data, econometrics, Sweden
1. Introduction
Similar to many other countries, Sweden needs to comply with national and internationaltargets on renewable energy and biodiversity provision. Hydropower is important for the
© The Author(s). Licensee InTech. This chapter is distributed under the terms of the Creative Commons
Attribution License (http://creativecommons.org/licenses/by/3.0), which permits unrestricted use,
distribution, and eproduction in any medium, provided the original work is properly cited.
DOI: 10.5772/intechopen.69134
© 2018 The Author(s). Licensee IntechOpen. This chapter is distributed under the terms of the CreativeCommons Attribution License (http://creativecommons.org/licenses/by/3.0), which permits unrestricted use,distribution, and reproduction in any medium, provided the original work is properly cited.
provision of renewable electricity production and accounts for approximately 47% of the totalelectricity production in the country [1]. Nuclear power is the second largest source of electric-ity and accounts for 34% of total energy production. Not only is hydropower a large source ofelectricity, but also acts a powerful regulatory device for the large fluctuations in demand andsupply of electricity. Further, it is among the least expensive sources of energy as measured inSEK/kWh [2].
Establishments of hydropower plants change the hydrological conditions in the riverine land-scape which affects habitats for animals and plants. Streams can be totally or partially driedand thereby destroying the habitats for several species and migration pathways for fishspecies. Although there is no national evidence on the extinction of species because of thehydropower production, the effects imply a degradation of habitats for red listed species [3],which goes against the national target of preserving biodiversity.
In order to mitigate these effects water power plants may be run with a release of water fromthe reservoir(s) into the downstream dry channel (the old natural river channel). However,this may only be achieved at a cost in terms of less electricity production and hence fulfill-ment of the target on renewable energy. This study investigates whether such a cost exists,and which factors contribute to the probability of its occurrence. To this end, we use the cost-minimization framework to derive testable hypotheses. Test are made with data from asurvey on 76 hydropower plants in Sweden with questions on the existence of a cost in termsof negative impact on electricity production, the type of water release from reservoirs, andcharacteristics of the dried downstream channel and the plant. This data set was completedwith official statistics on ecological status in the downstream segments. We use econometricmethods to examine the impact of water discharges from the reservoir and other explanatoryvariables on electricity production. The dependent variable is a binary variable which equals1 when electricity production is affected and 0 otherwise. We, therefore, use a probit modelfor the regression analysis, where we estimate how the explanatory variables affect theprobability of losing electricity production.
There is a large body of literature on ecological effects of biodiversity restoration in freshwa-ters, such as wetland restoration (see reviews in Refs. [4, 5]). Despite this, the literature on thedetermination of costs of measures mitigating biodiversity degradation from hydropowerplants is scant (e.g., [6–8]). The cost of restoration objects depends on the investment andmanagement of the restoration measure as such, and on the ecological conditions at the siteaffecting the need and quality of restoration [5]. In our view, the main contribution of thisstudy is the estimation of the explanatory power of ecological conditions and water releasefrom reservoirs on the probability of a restoration cost in terms of reduction in electricityproduction.
2. Theoretical framework
The theoretical framework rests on the assumption that each power plant minimizes costs forrestoring biodiversity. This is a common assumption in economics where firms are assumed to
Selected Studies in Biodiversity120
use inputs, such as labor and capital, at given prices to minimize costs for producing certainoutputs. By applying the so-called duality theory a cost function can be derived which showsthe relation between the output and production cost (e.g., [9]). The cost is then expressed as afunction of given input prices, and output level. In our case, biodiversity improvement consti-tutes the output Qi where i ¼ 1,.., n sites of the hydropower plants. The level of the output, orsuccess of restoration, which can be measured as number of fish species or as a quality index,depends on ecological conditions at the site, Eil where l ¼ 1,.., m conditions such as length ofthe channel and natural water flow, and on restoration measures at the plant, Mig where g ¼1,.., h different restoration measures such as water discharges from the dam. The biodiversityat the site is then written as Qi ¼ Qi(Mi1,..,Mih; Ei1,.., Eim).
A crucial assumption in our analysis is that the plant manager minimizes total cost forachieving a minimum level of biodiversity, Q*i. Each restoration measure is then associated
with a cost, Cig(Mig), and a maximum capacity of implementation, Mig. For example, there is a
maximum limit of water discharges into the channel. Plant size, Ki, may also affect costs; alarge plant can have more expertise for implementing restoration measures than a small plant.On the other hand, a larger plant may give rise to more damages in the downstream waters,the mitigation of which requires costly restoration measures. The decision problem for theplant manager is then written as:
MinCi ¼X
gCigðMig; KiÞ
Mig
Subject toQiðMi1, ::,Mih; Ei1,…, EimÞ ≥Q�i and Mig ≤Mig
ð1Þ
By applying the so-called duality theory to Eq. (1) we can express the cost of restoration at theplant as a function of the chosen restoration target Q*i, ecological conditions at the site, Eig, and
the restoration measures, Mig, which is written as follows:
Ci ¼ CiðQ�i, Ei1,…, Eim,Mi1, ::,M
ih, KiÞ ð2Þ
Our main interest is to investigate the impact on costs of a marginal increase in the restorationambition, Q*i. The hypothesis is that the cost, Ci, increases since more of the restorationmeasures need to be implemented. In this case, there is a conflict between biodiversity resto-ration and electricity provision since resources that could be used for electricity production areused for biodiversity restoration. On the other hand, a non-positive effect would imply theopposite interpretation. As shown in Eqs. (1) and (2), a test of this hypothesis requires data, not
only on Ci and Q*i, but also on Eil, Mig, and Ki.
3. Description of data
Unfortunately, the necessary data presented in Section 2 is not available for a sufficient numberof plants. Therefore, a survey was distributed to hydropower plants with dried channels. It
Biodiversity Restoration and Renewable Energy from Hydropower: Conflict or Synergy?http://dx.doi.org/10.5772/intechopen.69134
121

turned out that the plant managers were not able to answer questions on our output variable,diversity at downstream sections of the reservoirs. The survey was therefore completed withofficial data on fish species.
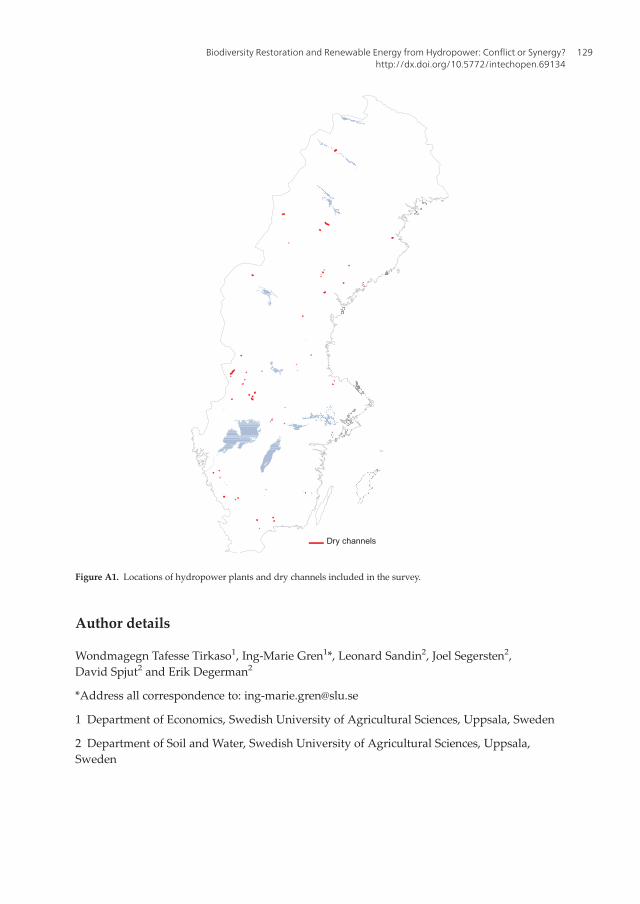
The questionnaire was sent to the four largest hydropower companies in Sweden with anykind of restoration measures, where downstream dry or nearly dry river and stream channelshad been identified and where electrofishing data were available for the dry or nearly drychannel downstream of the reservoir. The questionnaire was filled out and returned for 76hydropower plants where fish data (see below) from downstream sections of the reservoirswere available. These plants are located in the entire Sweden, see Figure A1.
The survey included questions on the variables presented in Section 2: costs, measures for therelease of water into the channel, ecological conditions of the dry river beds, and annualelectricity production. The latter was used as a description of the characteristic of the plant.However, the respondents were not able to assess the costs of the measures, but on whetherthere had been a cost in terms of loss in electricity production. Therefore, our cost variable isbinary, where Cost ¼ 1 when there is a loss in electricity production and Cost ¼ 0 otherwise.
With respect to the choice of measures, a common strategy is to implement a program withminimum water discharge from the reservoir to the old river bed, which ensures that there is aminimum flow of water in order to potentially sustain downstream stream and river organ-isms. A question was included on the existence of such a program (Mindisch) (by court order orvoluntarily) whereMindisch ¼ 1 when the measure is in place andMindisch ¼ 0 otherwise. Theplants can also implement other strategies for improving biodiversity, such as an even flow ofwater to downstream water. A question was therefore included on the existence of othermeasures (Othmeas) where Othmeas ¼ 1 if such measures exist and Othmeas ¼ 0 otherwise.
Sufficient length of dry channels and natural water flow in the dry channels provide favorableecological conditions for restoring biodiversity. Questions were included on the length of thedry channels (Length), and natural water flows in the dry channels in m/s (Msec) as continuousvariables. The size of the plant was measured as the annual electricity production (Elprod).
As shown in Section 2, the variable measuring biological conditions of the downstream dry orpartly dry stream or river section should reflect the effects of restoration measures and ecolog-ical conditions in the channel. This would require data and analysis of biological conditionsbefore and after the implementation of the measures. Such data is not available. Instead, we usedata on measurements of biological conditions in the downstream river section, which isavailable as electrofishing data at the Swedish Electrofishing Register [10]. The Swedish streamand river fish indexVIXwas used to assess the ecological status of the downstream sections [11].The VIX index ranges from 0 to 1, where high values denote high ecological status and lowvalues denote bad ecological status according to the EUWater Framework Directive [12].
Descriptive statistics of the dependent variable Cost and the independent variables are displayedin Table 1.
The results from the survey showed that 58% of all plants report a cost in terms of a reductionin electricity production and 47% have implemented minimum flow discharges into the old
Selected Studies in Biodiversity122

natural downstream channel as a biodiversity restoration measure. It might be argued thatmainly those dams with discharges of water from the reservoirs to the dry channel face a cost.However, the plants reporting a loss in electricity production is evenly distributed betweenplants with and without minimum discharges to the dried channels.
The range in dam size as measured by electricity production is large within the dataset, rangingfrom 900 to 1,120,000,000 kWh/year (Table 1). The continuous variables Elprod, Length, andMsecare highly skewed, and we, therefore, transformed them into the logarithms Logelprod, Loglength,and Logmsec.
4. Econometric model
We have employed the standard logit and probit models to estimate the explanatory power ofthe independent variables listed in Table 1 on the probability of a cost. The difference betweenthe logit and probit model is the distributions of the error terms. The former follows a cumulativestandard logistic distribution, whereas the later follows a cumulative standard normal distribu-tion (see e.g., [13, 14]). The probability functions in both the models are symmetric around zeroand tend to give similar parameter estimate. Therefore, we have estimated parameters of interestapplying both estimators. We know that our dependent variable Cost, can take only two values,i.e., 1 if there is a cost and 0 if there is no cost. The probability of Cost¼ 1 is p and the probabilityof Cost ¼ 0 is (1�p). Hence, the expectation of Cost, E[Cost], is given as follows:
E Cost½ � ¼ 1 � pþ 0 � ð1� pÞ ) p ð3Þ
Considering the probability that Cost ¼ 1 is a function of different covariates presented inTable 1, denoted by vector X, and parameters of interest β, we can write the standard binarychoice model as follows:
PðCost ¼ 1jXÞ ¼ f ðβXÞ ð4Þ
Consequently, the logit and probit models corresponding to Eq. (4) are given by Eqs. (5) and(6), respectively, as:
Variable Observations Mean Standard deviation Minimum Maximum
Cost 66 0.576 0.498 0 1
Elprod, electricity production in kWh 66 90,400,000 202,000,000 900 1,120,000,000
Length in m 75 2113 2612 62 16,308
Msec, water flow in m3/s 67 48 83 0 377
Mindisch 75 0.47 0.50 0 1
Othmeas 75 0.69 0.46 0 1
VIX 20 0.43 0.23 0 1
Table 1. Descriptive statistics.
Biodiversity Restoration and Renewable Energy from Hydropower: Conflict or Synergy?http://dx.doi.org/10.5772/intechopen.69134
123
f β0X
� �¼ eβ
0X
1þ eβ0X
ð5Þ
f β0X
� �¼ Π β
0X
� �¼
ðβ0X�∞
1ffiffiffiffiffiffi2π
p e�u22 du ð6Þ
Since probit and logit models are nonlinear in both parameter and variables, the usual ordi-nary least square (OLS) and weighted least square (WLS) estimators could not be plausible.For that reason, identification of parameters given by a vector β preferably should be obtainedby applying the maximum likelihood (MLE) estimator. Generally, binary choice models can bederived from the latent variable model as it provides a link with standard linear regressionmodels which makes interpretation of the parameters straightforward. Besides, the modelillustrates the difference between logit and probit models. Suppose the binary outcome vari-able Cost and the corresponding latent variable Cost* satisfies the single infix model as:
Cost� ¼ βXþ ε ð7Þ
Given that Cost is observable, it can be expressed as:
Cost ¼1 if Cost� > 0
0 if Cost � ≤ 0
8<: ð8Þ
Combining Eqs. (7) and (8), we can have the following response probabilities:
PðCost ¼ 1Þ ¼ PðβXþ ε > 0Þ ¼ Pð�ε < βXÞ ¼ f ðβXÞ ð9Þ
where, f β0X
� �is the cumulative density functions (CDF). In the case of probit model, the error
term follows the standard normal distribution whereas it follows the logistic distribution in thecase of a logit model.
The signs of parameters β are directly interpretable in both logit and probit models, but not themagnitudes. For that reason, deriving the marginal effects and discrete changes in the estimatesis crucial in order to obtain the magnitudes of parameters. The marginal effect of the continuouscovariate is given by partial derivative with respect to that variable, whereas the discretechanges of dummy covariate are given by the difference in predicted probabilities of the variableat 0 and 1, setting other covariates constant at their reference points. Mathematical notion ofmarginal effects and discrete changes in binary outcome models can be found in Ref. [13].
Recall from Section 3 that the availability of data is limited for the VIX variable with only 20observations. We, therefore, estimated regression equations with and without this variable.The regression equation without VIX is specified as:
Model 1:
Cost ¼ βoþ β1Logelprodþ β2Loglength þ β3Logmsec þ β4Mindisch þ β5Othmeas þ ε ð10Þ
Selected Studies in Biodiversity124

The estimates give information on the probability of a cost from introducing restorationmeasures Mindisch and Othmeas, and the impacts of Logelprod, Loglength, and Logmsec. Theregression equation with VIX includes all variables and is specified as:
Model 2:
Cost ¼ β6 þ β7Logelprodþ β8Loglengthþ β9Logmsec
þ β10Mindischþ β11Othmeasþ β12VIXþ εð11Þ
5. Results
The results showed that the independent variable Othmeas was never significant, and wetherefore excluded this variable. Another result was that the inclusion of all explanatory vari-ables in Model 2 gave poor statistical fit because of the low number of observations. We,therefore, excluded Loglength and Logmse in Model 2.
There might also be statistical problems associated with endogeneity in the included explana-tory variables. Since the purpose of minimum discharge (Mindisch) is to sustain ecologicalconditions in the dry channels, this variable might be dependent on the ecological status inthe stream channels, Loglength, and Logmsec in Model 1 and VIX in Model 2. If so, the ordinaryleast square (OLS) estimates will not give consistent estimates (e.g., [15]). Therefore, we testedfor endogeneity inMindisch by using Loglength and Logmsec as instruments in Model 1 and VIXas an instrument in Model 2. Wald tests of both models showed that exogeneity in Mindischcould not be rejected at the 10% level (see, e.g., [15] for a description of the test). This meansthat we can treat Mindisch as an independent variable.
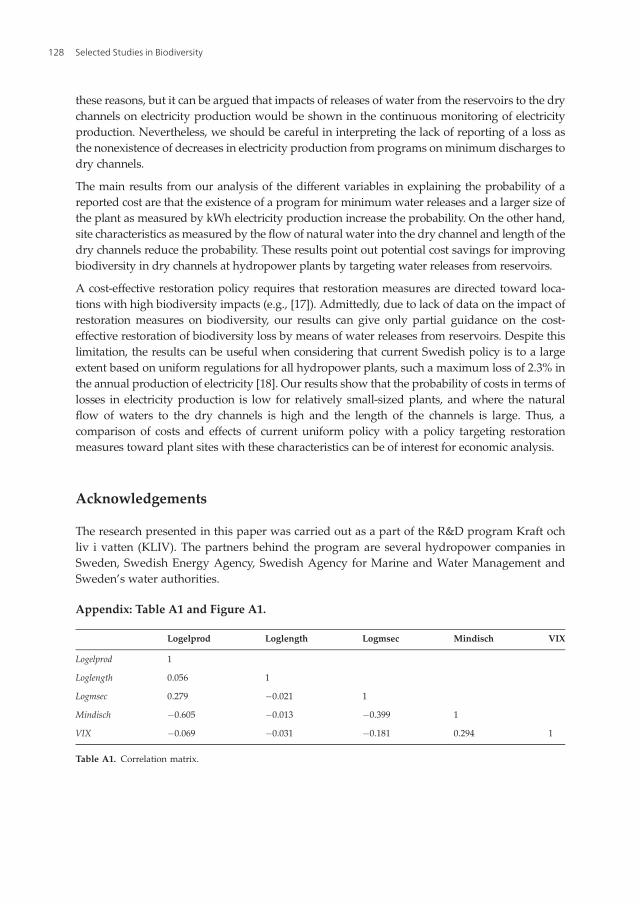
We also tested for the existence of heteroscedasticity, which was not present in any modelaccording to the results from Breach-Pagan tests (e.g., [16]). However, Pearson test of correla-tion among all explanatory variables showed significant associations at the 1% level betweenLogelprod and several other explanatory variables (Table A1). Despite these association, vari-ance inflation factor (VIF) tests did not reveal problems of multicollinearity (mean VIF ¼ 1.29for Model 1 and mean VIF ¼ 1.36 for Model 2).
The binary dependent variable denotes the likelihood of a cost of changes in any of the explan-atory variables. We would expectMindisch to increase the probability of a cost since this measuredischarges water into the dry channel which could be used for electricity production. On theother hand, natural conditions in the dry channels, measured as channel length and naturalwater discharge, are likely to reduce the likelihood of a cost because there is less need formitigation measures. As a measure of the size of the dam, Logelprod can increase the probabilityof a loss in electricity production. The regression results of Model 1 are presented in Table 2.
According to Table 2, the results from the logit and probit models are quite similar. All explan-atory variables are significant and have the expected sign. The models are significant at the 0.01level according to the model Chi-square statistic, and the predicted “Cost ¼ 1” corresponds to87% of the observed “Cost ¼ 1.” The statistical performance of the probit model is slightly better
Biodiversity Restoration and Renewable Energy from Hydropower: Conflict or Synergy?http://dx.doi.org/10.5772/intechopen.69134
125
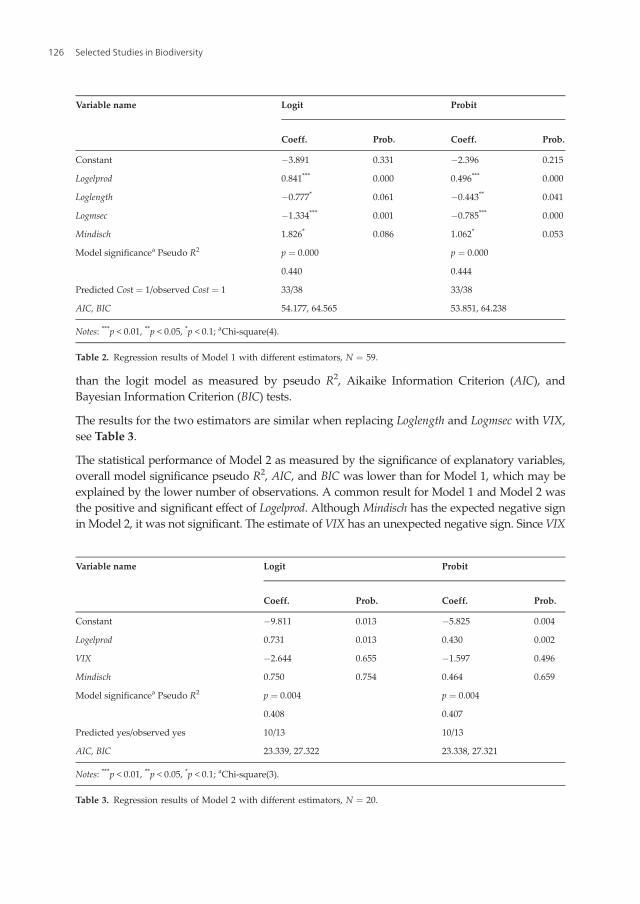
than the logit model as measured by pseudo R2, Aikaike Information Criterion (AIC), andBayesian Information Criterion (BIC) tests.
The results for the two estimators are similar when replacing Loglength and Logmsec with VIX,see Table 3.
The statistical performance of Model 2 as measured by the significance of explanatory variables,overall model significance pseudo R2, AIC, and BIC was lower than for Model 1, which may beexplained by the lower number of observations. A common result for Model 1 and Model 2 wasthe positive and significant effect of Logelprod. Although Mindisch has the expected negative signin Model 2, it was not significant. The estimate of VIX has an unexpected negative sign. Since VIX
Variable name Logit Probit
Coeff. Prob. Coeff. Prob.
Constant �3.891 0.331 �2.396 0.215
Logelprod 0.841*** 0.000 0.496*** 0.000
Loglength �0.777* 0.061 �0.443** 0.041
Logmsec �1.334*** 0.001 �0.785*** 0.000
Mindisch 1.826* 0.086 1.062* 0.053
Model significancea Pseudo R2 p ¼ 0.000 p ¼ 0.000
0.440 0.444
Predicted Cost ¼ 1/observed Cost ¼ 1 33/38 33/38
AIC, BIC 54.177, 64.565 53.851, 64.238
Notes: ***p < 0.01, **p < 0.05, *p < 0.1; aChi-square(4).
Table 2. Regression results of Model 1 with different estimators, N ¼ 59.
Variable name Logit Probit
Coeff. Prob. Coeff. Prob.
Constant �9.811 0.013 �5.825 0.004
Logelprod 0.731 0.013 0.430 0.002
VIX �2.644 0.655 �1.597 0.496
Mindisch 0.750 0.754 0.464 0.659
Model significancea Pseudo R2 p ¼ 0.004 p ¼ 0.004
0.408 0.407
Predicted yes/observed yes 10/13 10/13
AIC, BIC 23.339, 27.322 23.338, 27.321
Notes: ***p < 0.01, **p < 0.05, *p < 0.1; aChi-square(3).
Table 3. Regression results of Model 2 with different estimators, N ¼ 20.
Selected Studies in Biodiversity126
shows the fish habitat conditions at a downstream segment, a higher level of VIX should beassociated with a higher probability of a cost according to the simple economic theory presentedin Section 2. On the other hand, a negative sign indicates that there is no conflict in the achieve-ment of biodiversity targets and energy production. However, the estimate is not significant andwe cannot make conclusions about the effects of VIX on the probability of a cost.
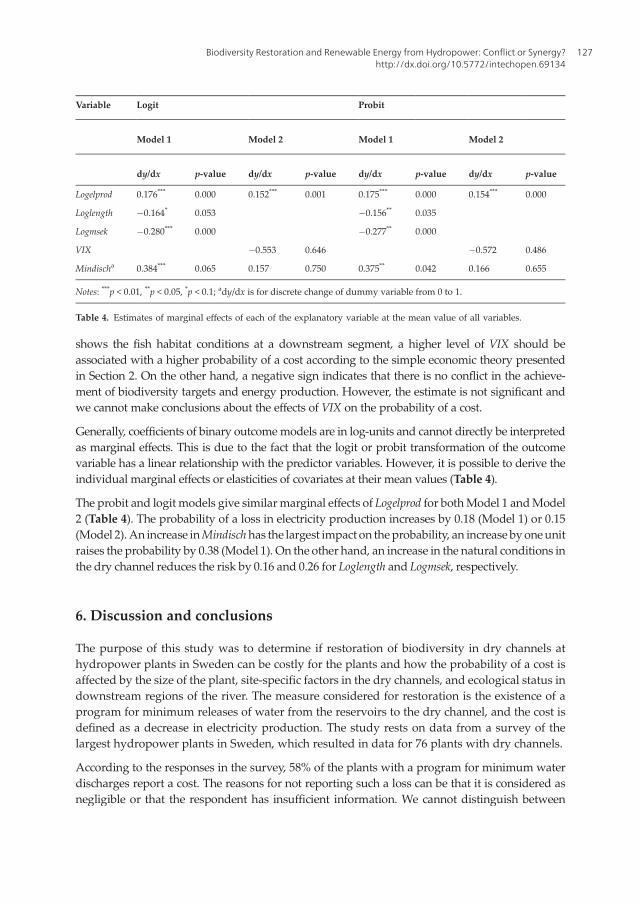
Generally, coefficients of binary outcomemodels are in log-units and cannot directly be interpretedas marginal effects. This is due to the fact that the logit or probit transformation of the outcomevariable has a linear relationship with the predictor variables. However, it is possible to derive theindividual marginal effects or elasticities of covariates at their mean values (Table 4).
The probit and logit models give similarmarginal effects of Logelprod for bothModel 1 andModel2 (Table 4). The probability of a loss in electricity production increases by 0.18 (Model 1) or 0.15(Model 2).An increase inMindischhas the largest impact on theprobability, an increase byoneunitraises the probability by 0.38 (Model 1). On the other hand, an increase in the natural conditions inthe dry channel reduces the risk by 0.16 and 0.26 for Loglength and Logmsek, respectively.
6. Discussion and conclusions
The purpose of this study was to determine if restoration of biodiversity in dry channels athydropower plants in Sweden can be costly for the plants and how the probability of a cost isaffected by the size of the plant, site-specific factors in the dry channels, and ecological status indownstream regions of the river. The measure considered for restoration is the existence of aprogram for minimum releases of water from the reservoirs to the dry channel, and the cost isdefined as a decrease in electricity production. The study rests on data from a survey of thelargest hydropower plants in Sweden, which resulted in data for 76 plants with dry channels.
According to the responses in the survey, 58% of the plants with a program for minimum waterdischarges report a cost. The reasons for not reporting such a loss can be that it is considered asnegligible or that the respondent has insufficient information. We cannot distinguish between
Variable Logit Probit
Model 1 Model 2 Model 1 Model 2
dy/dx p-value dy/dx p-value dy/dx p-value dy/dx p-value
Logelprod 0.176*** 0.000 0.152*** 0.001 0.175*** 0.000 0.154*** 0.000
Loglength �0.164* 0.053 �0.156** 0.035
Logmsek �0.280*** 0.000 �0.277** 0.000
VIX �0.553 0.646 �0.572 0.486
Mindischa 0.384*** 0.065 0.157 0.750 0.375** 0.042 0.166 0.655
Notes: ***p < 0.01, **p < 0.05, *p < 0.1; ady/dx is for discrete change of dummy variable from 0 to 1.
Table 4. Estimates of marginal effects of each of the explanatory variable at the mean value of all variables.
Biodiversity Restoration and Renewable Energy from Hydropower: Conflict or Synergy?http://dx.doi.org/10.5772/intechopen.69134
127
these reasons, but it can be argued that impacts of releases of water from the reservoirs to the drychannels on electricity production would be shown in the continuous monitoring of electricityproduction. Nevertheless, we should be careful in interpreting the lack of reporting of a loss asthe nonexistence of decreases in electricity production from programs onminimumdischarges todry channels.
The main results from our analysis of the different variables in explaining the probability of areported cost are that the existence of a program for minimum water releases and a larger size ofthe plant as measured by kWh electricity production increase the probability. On the other hand,site characteristics as measured by the flow of natural water into the dry channel and length of thedry channels reduce the probability. These results point out potential cost savings for improvingbiodiversity in dry channels at hydropower plants by targeting water releases from reservoirs.
A cost-effective restoration policy requires that restoration measures are directed toward loca-tions with high biodiversity impacts (e.g., [17]). Admittedly, due to lack of data on the impact ofrestoration measures on biodiversity, our results can give only partial guidance on the cost-effective restoration of biodiversity loss by means of water releases from reservoirs. Despite thislimitation, the results can be useful when considering that current Swedish policy is to a largeextent based on uniform regulations for all hydropower plants, such a maximum loss of 2.3% inthe annual production of electricity [18]. Our results show that the probability of costs in terms oflosses in electricity production is low for relatively small-sized plants, and where the naturalflow of waters to the dry channels is high and the length of the channels is large. Thus, acomparison of costs and effects of current uniform policy with a policy targeting restorationmeasures toward plant sites with these characteristics can be of interest for economic analysis.
Acknowledgements
The research presented in this paper was carried out as a part of the R&D program Kraft ochliv i vatten (KLIV). The partners behind the program are several hydropower companies inSweden, Swedish Energy Agency, Swedish Agency for Marine and Water Management andSweden’s water authorities.
Appendix: Table A1 and Figure A1.
Logelprod Loglength Logmsec Mindisch VIX
Logelprod 1
Loglength 0.056 1
Logmsec 0.279 �0.021 1
Mindisch �0.605 �0.013 �0.399 1
VIX �0.069 �0.031 �0.181 0.294 1
Table A1. Correlation matrix.
Selected Studies in Biodiversity128
Author details
Wondmagegn Tafesse Tirkaso1, Ing-Marie Gren1*, Leonard Sandin2, Joel Segersten2,David Spjut2 and Erik Degerman2
*Address all correspondence to: [email protected]
1 Department of Economics, Swedish University of Agricultural Sciences, Uppsala, Sweden
2 Department of Soil and Water, Swedish University of Agricultural Sciences, Uppsala,Sweden
Figure A1. Locations of hydropower plants and dry channels included in the survey.
Biodiversity Restoration and Renewable Energy from Hydropower: Conflict or Synergy?http://dx.doi.org/10.5772/intechopen.69134
129
References
[1] Swedish Energy Agency. Electricity Production in Sweden 2015. [Internet]. 2016. Avail-able from: http://www.energimyndigheten.se/nyhetsarkiv/2016/2015-var-ett-ar-med-stor-elproduktion-och-rekordstor-export-av-el/ [Accessed: November 2016]
[2] Sparrevik E, Viklands H, Bergsten P, Harju L. Ekologiska effekter och verksamhet-spåverkan av förändrade produktionsvillkor i Vattenfalls storskaliga vattenkraftverk.Rapport, Vattenfall. [Internet]. 2011. Available from: https://corporate.vattenfall.se/globalassets/sverige/om-vattenfall/om-oss/var-verksamhet/vattenkraft/bilaga_10_ekologis-ka_effekter_och_verksamhetspaverkan_av_forandrade_produktionsvillkor.pdf No [Accessed:November 2016]
[3] Art Data banken. Rödlistade arter i Sverige. [Internet]. 2015. Available from: http://www.artdatabanken.se/media/2013/hela-boken.pdf. [Accessed: Februrary 2016]
[4] Brudvig LA. The restoration of biodiversity: Where has research been and where does itneed to go? American Journal of Botany. 2011;98:549-558
[5] Meli P, Benayas JMR, Balvanera P, Ramos MM. Restoration enhances wetland biodiver-sity and ecosystem service supply, but results are context-dependent: A meta-analysis.PLoS One. 2014;9:e93507
[6] Rudberg P, Escobar M, Gantenbein J, Niiro N. Mitigating the adverse effects of hydro-power projects: A comparative review of river restoration and hydropower regulation inSweden and the United States. The Georgetown International Environmental LawReview. 2015;27:251-273
[7] Bullock JM, Aronson J, Newton AC, Pywell RF, Rey-Benayas JM. Restoration of ecosys-tem services and biodiversity: Conflicts and opportunities. Trends in Ecology and Evolu-tion. 2011;26:542-549
[8] Nebhöver C, et al. Investing in ecological infrastructure. In: ten Brink P, editor. TheEconomics of Ecosystems and Biodiversity: National and International Policy Making.An output of TEEB. Earthscan; 2011. pp. 401-448
[9] Diewert WE. Duality approaches to microeconomic theory. In: Arrow KJ, Intriligator MD,editors. Handbook of Mathematical Economics. Vol. 2. Amsterdam: North-Holland; 1982
[10] SERS (Swedish Electrofishing Registry). [Internet]. 2017. Available from: http://www.slu.se/elfiskeregistret. [Accessed: November, 2016]
[11] Beier U, Degerman E, Sers B, Bergquist B, Dahlberg M. Environmental quality criteria todetermine the status of fish in running waters – development and application of VIX.Finfo. 2007;5. Fiskeriverket
[12] European Commission. Directive 2000/60/EC of the European Parliament and of theCouncil of 23rd October 2000 Establishing a Framework for Community Action in theField of Water Policy. Official Journal of the European Communities, L327/1. EuropeanCommission, Brussels. 2000
Selected Studies in Biodiversity130

[13] Cameron AC, Trivedi PK. Microeconometrics Using Stata. Texas: Stata press CollegeStation; 2009
[14] Hosmer DW, LemeshowS. Introduction to the logistic regression model. Applied LogisticRegression. 2nd ed. Hoboken, NJ, USA: John Wiley & Sons, Inc.; 2000
[15] Davidson R, MacKinnon JG. Estimation and Inference in Econometrics. New York:Oxford University Press; 1993
[16] Wooldridge JM. Introductory Econometrics: A Modern Approach. 5th ed. USA: South-Western, Mason; 2013
[17] Gren IM, Baxter P, Mikusinski G, Possingham H. Cost-effective biodiversity restorationwith uncertain growth in forest habitat quality. Journal of Forest Economics. 2014;20:77-92
[18] Havs och vattenmyndighet. Nationell strategi för vattenkraft och vattenmiljö. [Internet].2017. Available from: https://www.havochvatten.se/hav/uppdrag--kontakt/publikationer/publikationer/2014-07-04-strategi-for-atgarder-inom-vattenkraften.html [Accessed: February2017]
Biodiversity Restoration and Renewable Energy from Hydropower: Conflict or Synergy?http://dx.doi.org/10.5772/intechopen.69134
131


![Workshop Hydropower and Fish.pptx [Schreibgeschützt] - Workshop Hydropower and Fish... · Workshop Hydropower and Fish Existing hydropower facilities: ... spawning grounds and shelter](https://static.fdocuments.us/doc/165x107/5a8733247f8b9afc5d8da3c5/workshop-hydropower-and-fishpptx-schreibgeschtzt-workshop-hydropower-and-fishworkshop.jpg)