CHAPTER 7 EXPERIMENTAL STUDY USING COMPOSITE BEAM …
25
CHAPTER 7 EXPERIMENTAL STUDY USING COMPOSITE BEAM TESTS 7.1 General In previous chapters, the results of over 200 composite slab push-out tests performed at VT were used to develop a new strength prediction method for welded headed shear studs. In Chapter 8, the results of more than 80 full-scale beam tests performed at VT and elsewhere will be used to verify the accuracy of the new method for predicting the bending strength of composite beams. This chapter will describe three new beam tests, the results of which are included in the beam tests reported in Chapter 8, that were performed at VT. These tests were similar to the tests performed by Gibbings et al (1993), who used 3 in. deck. By comparing the results of these new tests to the results from Gibbings et al (1993), one may investigate the effect of deck height on stud strength. This effect has already been studied by using the results of push-out tests. The only nominal difference in the three new beam tests was the stud position. The first test had single studs placed in the strong position; the second test had single studs placed in the weak position; and the third test had pairs of studs placed in the strong position. A comparison of the first and second tests will determine the effect of the stud position in the rib on stud strength. A comparison of the first and third tests will determine if there is a reduction in strength if studs are placed in pairs. 179
Transcript of CHAPTER 7 EXPERIMENTAL STUDY USING COMPOSITE BEAM …

CHAPTER 7
EXPERIMENTAL STUDY USING COMPOSITE BEAM TESTS
7.1 General
In previous chapters, the results of over 200 composite slab push-out tests
performed at VT were used to develop a new strength prediction method for welded
headed shear studs. In Chapter 8, the results of more than 80 full-scale beam tests
performed at VT and elsewhere will be used to verify the accuracy of the new method for
predicting the bending strength of composite beams.
This chapter will describe three new beam tests, the results of which are included
in the beam tests reported in Chapter 8, that were performed at VT. These tests were
similar to the tests performed by Gibbings et al (1993), who used 3 in. deck. By
comparing the results of these new tests to the results from Gibbings et al (1993), one
may investigate the effect of deck height on stud strength. This effect has already been
studied by using the results of push-out tests.
The only nominal difference in the three new beam tests was the stud position.
The first test had single studs placed in the strong position; the second test had single
studs placed in the weak position; and the third test had pairs of studs placed in the strong
position. A comparison of the first and second tests will determine the effect of the stud
position in the rib on stud strength. A comparison of the first and third tests will
determine if there is a reduction in strength if studs are placed in pairs.
179

7.2 Composite Beam Test Matrix
Three composite beams were tested, with the only nominal difference in the tests
being the position of the shear studs in the deck ribs and the number of studs in each rib.
The test parameters are summarized in Table 7.1. Each of the beams consisted of a
simply supported W16x31 A572 Grade 50 section with a 5 in. deep composite slab. The
beams were 32 ft long and spanned 30 ft between supports. The steel section and
concrete slab were connected with 28 – 3/4 in. x 3 1/2 in. (after welding studs that were
welded through the deck). The 81 in. wide slab used normal weight concrete, with a
nominal strength of 4000 psi. The deck was 2 in. deep and 20 gauge, with the ribs placed
perpendicular to the beam. The beams were designed to be partially composite.
The steel sections used in all three tests were from the same heat and thus had the
same material properties. The same comment applies to the shear studs. The major
180
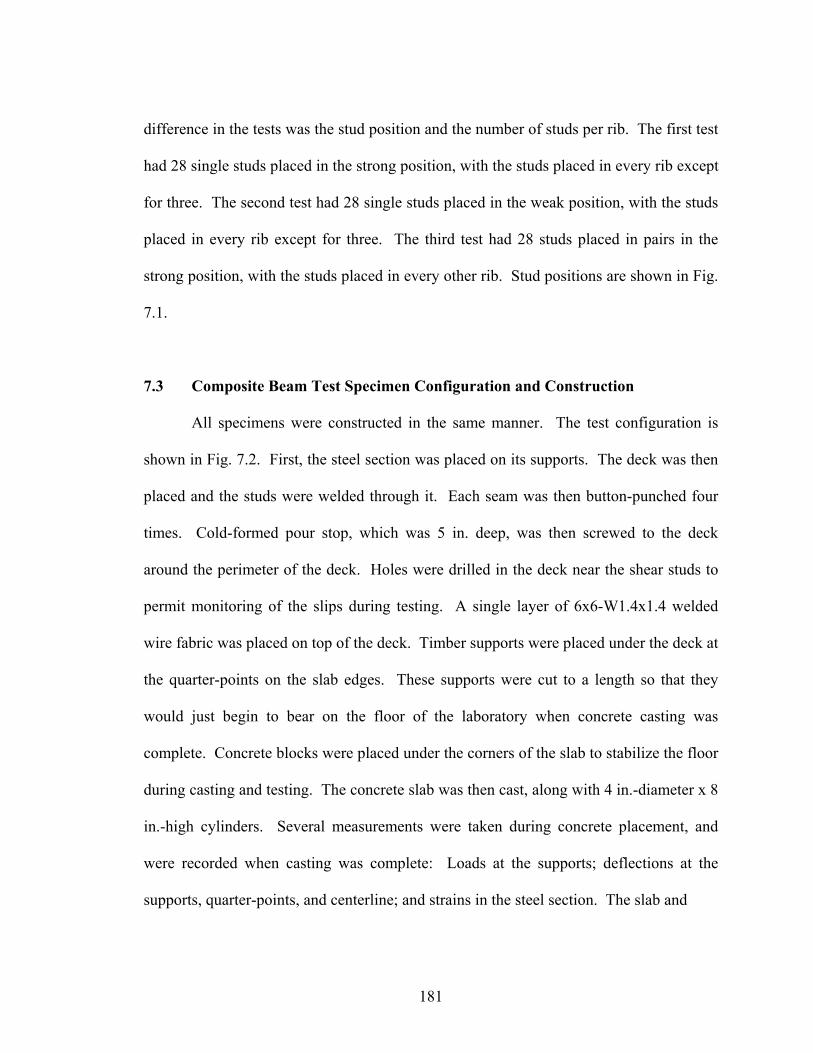
difference in the tests was the stud position and the number of studs per rib. The first test
had 28 single studs placed in the strong position, with the studs placed in every rib except
for three. The second test had 28 single studs placed in the weak position, with the studs
placed in every rib except for three. The third test had 28 studs placed in pairs in the
strong position, with the studs placed in every other rib. Stud positions are shown in Fig.
7.1.
7.3 Composite Beam Test Specimen Configuration and Construction
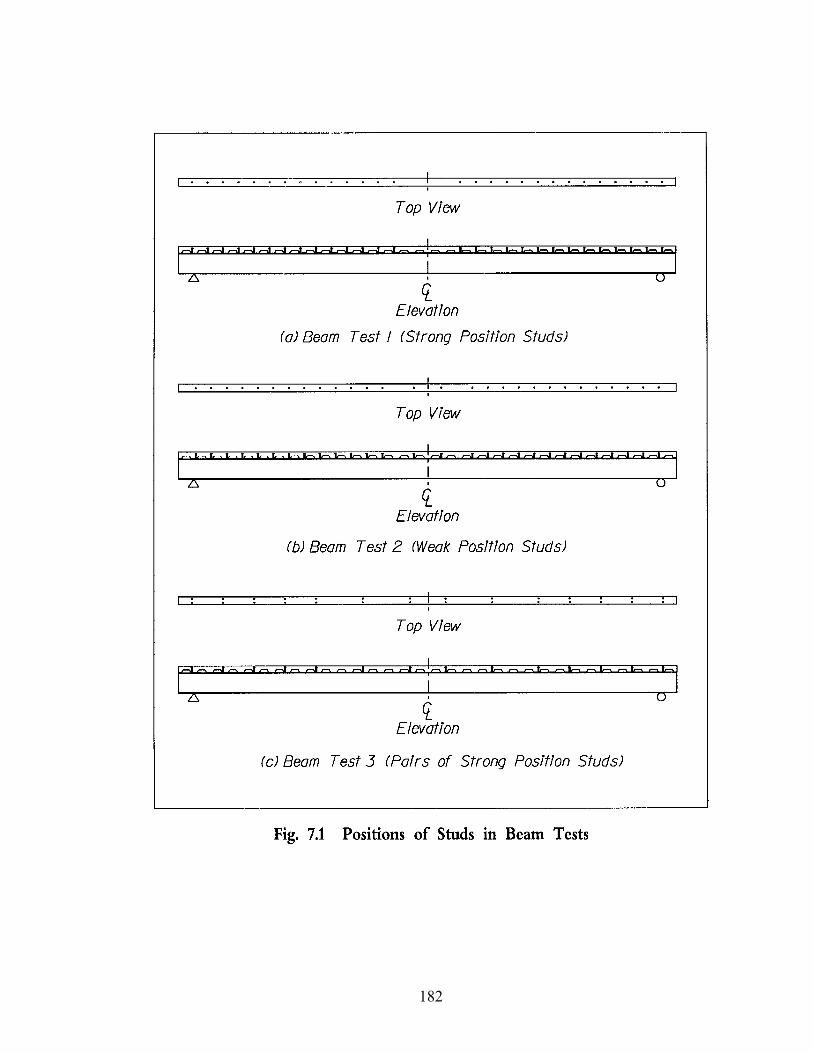
All specimens were constructed in the same manner. The test configuration is
shown in Fig. 7.2. First, the steel section was placed on its supports. The deck was then
placed and the studs were welded through it. Each seam was then button-punched four
times. Cold-formed pour stop, which was 5 in. deep, was then screwed to the deck
around the perimeter of the deck. Holes were drilled in the deck near the shear studs to
permit monitoring of the slips during testing. A single layer of 6x6-W1.4x1.4 welded
wire fabric was placed on top of the deck. Timber supports were placed under the deck at
the quarter-points on the slab edges. These supports were cut to a length so that they
would just begin to bear on the floor of the laboratory when concrete casting was
complete. Concrete blocks were placed under the corners of the slab to stabilize the floor
during casting and testing. The concrete slab was then cast, along with 4 in.-diameter x 8
in.-high cylinders. Several measurements were taken during concrete placement, and
were recorded when casting was complete: Loads at the supports; deflections at the
supports, quarter-points, and centerline; and strains in the steel section. The slab and
181
182
183

cylinders were covered with plastic and moist-cured for seven days. The plastic, timber
supports, and pour-stop were then removed. The concrete was cured for a minimum of
28 days before testing began.
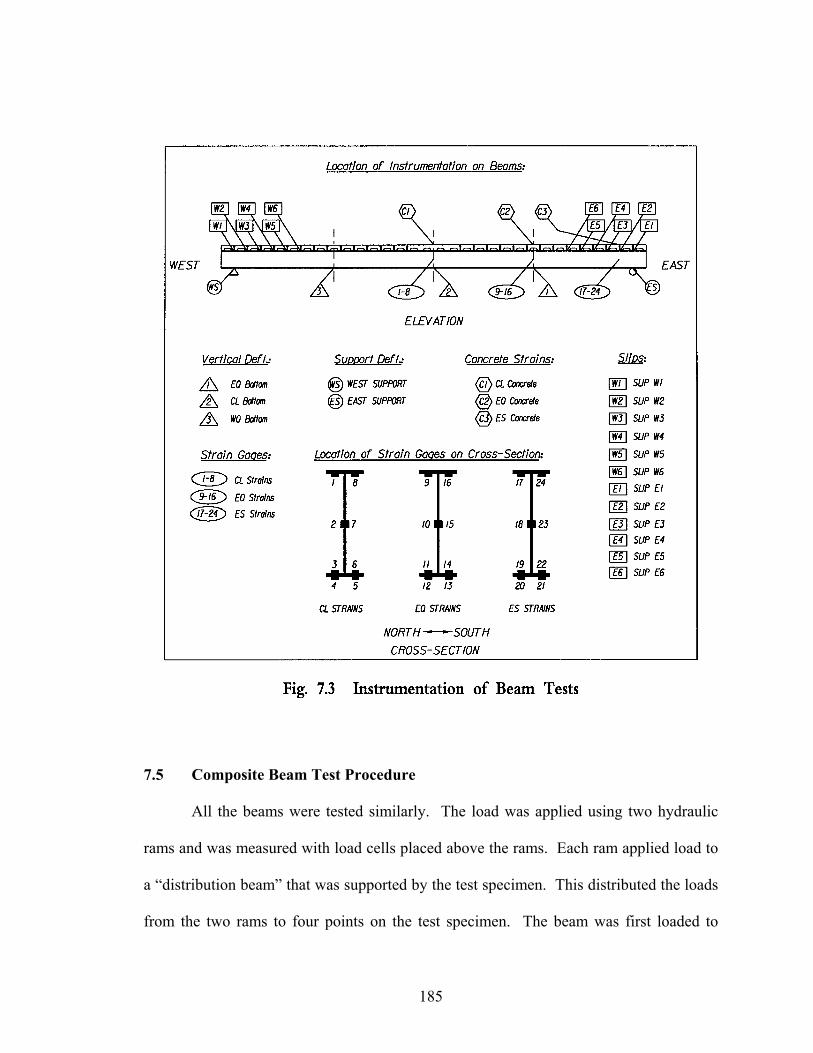
7.4 Instrumentation of Composite Beam Tests
The three beams were instrumented similarly. An instrumentation diagram is
shown in Fig. 7.3. Deflections of the bottom flange of the steel section were monitored at
the centerline and quarter-points with linear wire transducers. Deflections of the supports
were measured with dial gages.
Strains were measured in eight locations within a given cross-section: two on the
bottom of the top flange, two on the center of the web, two on the top of the bottom
flange, and two on the bottom of the bottom flange. This was done at three locations
along the beam: the centerline, east quarter-point, and 1 ft from the support. This
resulted in a total of 24 strain measurements for each beam.
Slips were measured with potentiometers that were attached to the top flange of
the beam. The tips of the potentiometers were wired to nails that were placed in the
concrete slab and through the holes that were drilled in the deck before the concrete was
cast. Measurements were taken adjacent to the six ribs nearest each support.
Concrete strains in the top of the slab were measured at the centerline, the east
quarter-point, and 1 ft from the east support of each beam.
184
7.5 Composite Beam Test Procedure
All the beams were tested similarly. The load was applied using two hydraulic
rams and was measured with load cells placed above the rams. Each ram applied load to
a “distribution beam” that was supported by the test specimen. This distributed the loads
from the two rams to four points on the test specimen. The beam was first loaded to
185
about 15% of its predicted capacity. It was then unloaded, and the measurements were
all “zeroed”. Increments of load were then applied to the beam, and the measurements
were recorded after each increment. When the load-deflection response became non-
linear, the beam was unloaded and then reloaded, stopping approximately three times to
record measurements. Thereafter, the beam was loaded in increments of midspan
deflection until failure of the specimen was observed or until very large deflections
occurred.
7.6 Results of Composite Beam Tests
7.6.1 General
This section is a discussion of how the data was adjusted to obtain the “total
loads” and their effects and how the predicted results were obtained. Test data and
calculations are reported in Rambo-Roddenberry et al (2002).
The total load given consists of the theoretical weight of the steel beam, deck,
concrete, load beams and plates, and the measured applied load. Effects due to the
weight of the steel beam and deck could not be measured, so they were determined
theoretically by interpolating from the measurements taken during concrete placement.
The weights of the beam and deck were determined theoretically and then calculated as a
fraction of the measured weight of the concrete. The deflections and strains were also
adjusted accordingly. The deflections were also adjusted by subtracting the support
deflections.
186

The experimental moment of inertia, Ie, was found by using two data points in the
elastic region of the load vs. midspan deflection plot.
The predicted moment of inertia was found from the following formula:
Ic = Is + 0.85p0.25(It – Is)
where Ic = predicted moment of inertia
Is = moment of inertia of steel section
p = ΣQc/AsFy = ratio of composite action, using the new stud strength prediction
method
It = transformed moment of inertia of composite beam
The experimental ultimate moment, Me, was found by separating the distributed
loads (due to the weight of the specimen) from the point loads (due to the load beams and
plates and the applied loads). The moment was then calculated using statics.
The experimental stud strength, Qbc, was found by back-calculating the stud
strength that was necessary to obtain the experimental flexural strength.
The stud strength was predicted using either the AISC stud strength model or the
new stud strength model and the flexural strength was predicted using the AISC flexural
strength method.
7.6.2 Beam Test 1
The first beam had single studs welded in the strong position. There were 28
studs total, with 12 studs in each “shear span”, between zero and maximum moments.
187

The concrete strength was 5000 psi, with a unit weight of 141.3 pcf. The studs had an
ultimate strength, which was supplied by the manufacturer, of 66.8 ksi. The flanges of
the W16x31 beam had yield and ultimate strengths of 54.3 ksi and 72.6 ksi, respectively.
The web had yield and ultimate strengths of 58.2 ksi and 72.4 ksi, respectively.
The predicted moment of inertia was 1061 in4. The experimental moment of
inertia was 1139 in4.
The predicted flexural strength from the AISC stud strength model was 469.2 k-ft
and from the new stud strength model was 424.3 k-ft. The ultimate load applied to the
beam was 104.5 k, which equates to an experimental flexural strength of 412.1 k-ft. At
this maximum moment, there was a midspan deflection of 7.88 in. and an average slip of
0.176 in.
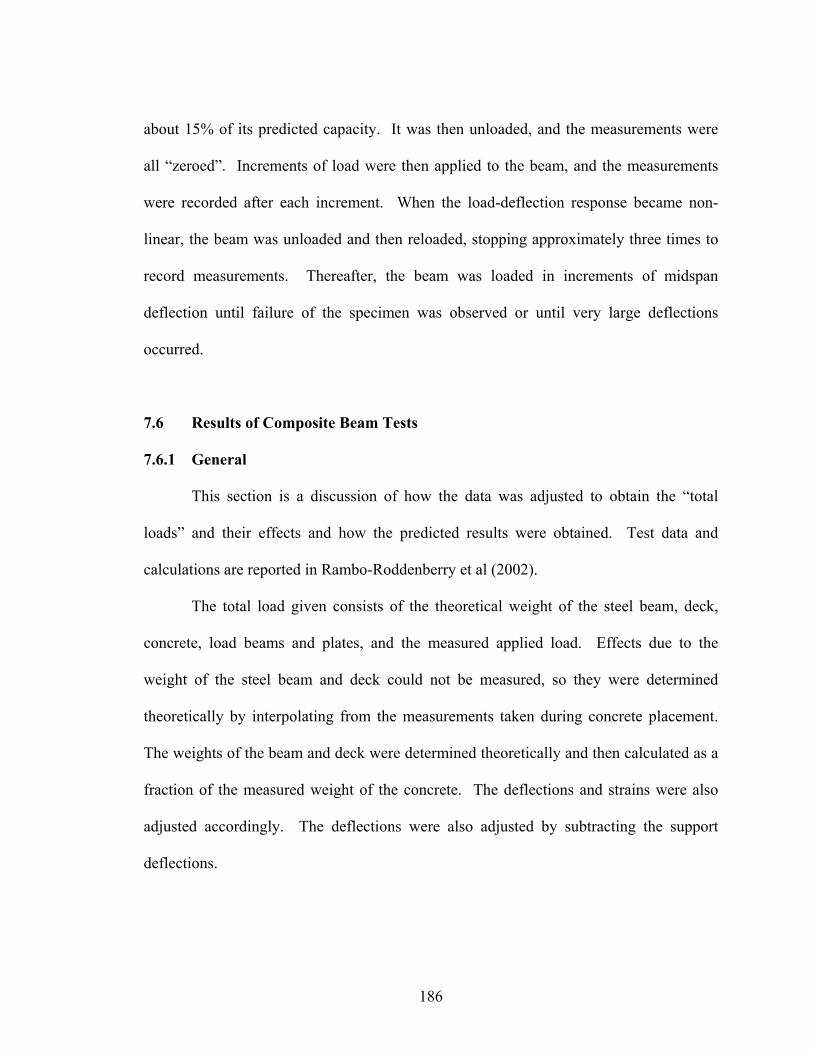
Plots of total load vs. deflection and total load vs. slip are shown in Figs. 7.4 - 7.5.
A photo of the failed specimen is shown in Fig. 7.6. Failure occurred by yielding
of the steel beam. Web yielding of the steel beam is shown in Fig. 7.7. Yielding of the
bottom flange was observed at a total load of 72.81 k. Diagonal yield lines were
observed on the web at 90.18 k, with significant yielding at 102.9 k. Cracking noises
were heard after the maximum load was reached. While waiting to apply the next
increment of load, a large longitudinal crack suddenly formed down the centerline of the
beam. When this crack formed, the load fell from 104.1 k to 93.69 k. The beam was
then loaded to 98.18 k, at which the beam had deflected a total of 8.75 in. Testing was
terminated because of the large deflections. The slab was removed after testing so that
the studs could be observed. All studs remained attached to the steel beam upon failure
188

of the specimen. A photo of a deformed stud after removal of the slab is shown in Fig.
7.8.
The formation of the crack could have affected the beam strength. The
experimental strength of the studs, which was back-calculated from the flexural strength,
was 17.7 k per stud. The stud strength obtained from push-out tests with similar
parameters was 20.0 k (Lyons’ Tests D2-D3). The predicted stud strength from AISC
was 29.5 k per stud, and the new predicted stud strength was 20.1 k per stud.
189
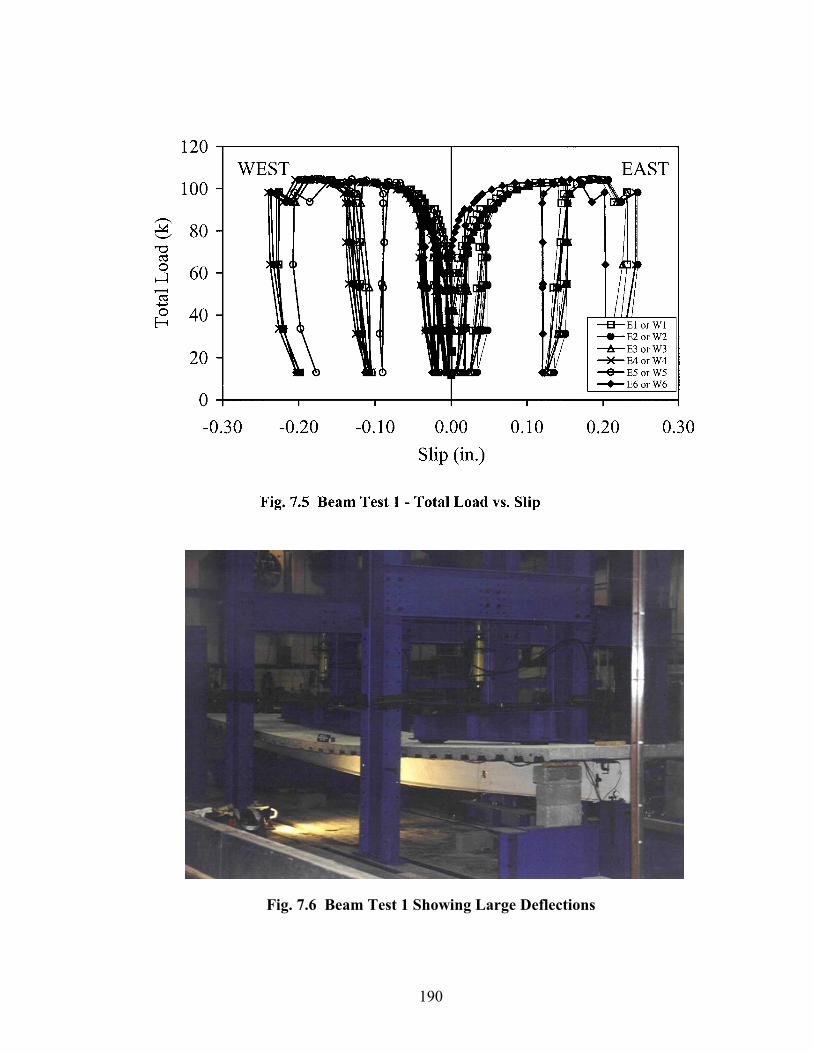
Fig. 7.6 Beam Test 1 Showing Large Deflections
190
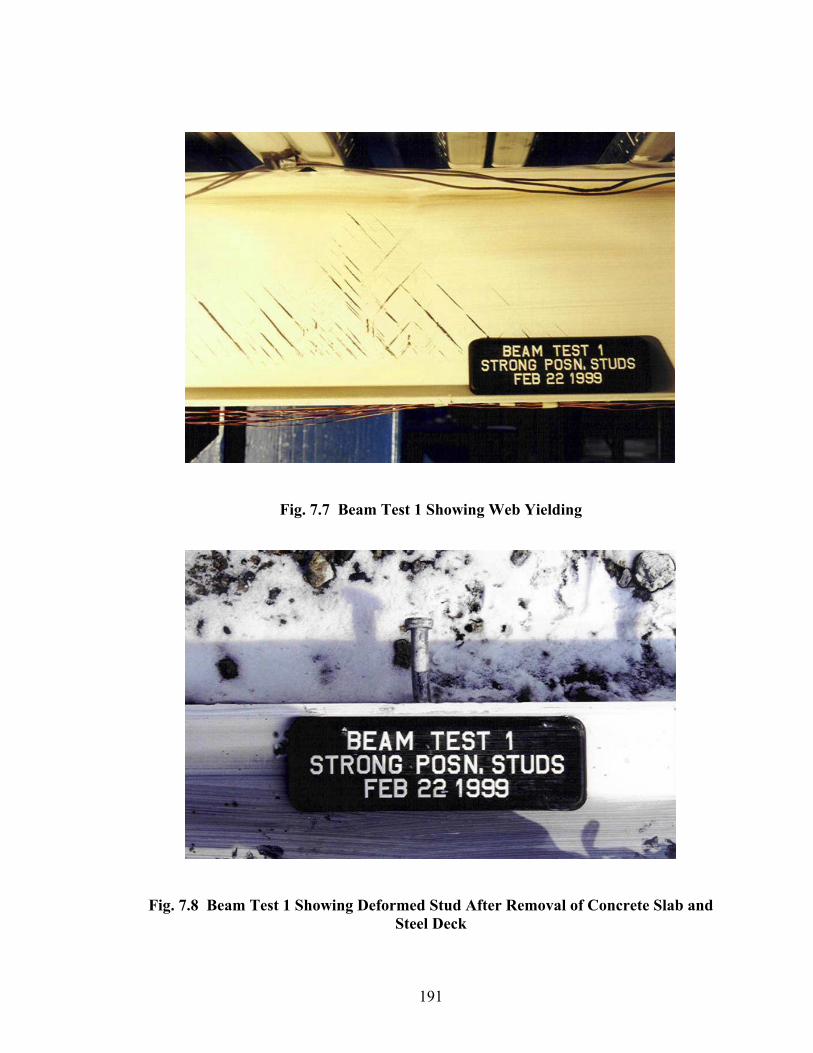
Fig. 7.7 Beam Test 1 Showing Web Yielding
Fig. 7.8 Beam Test 1 Showing Deformed Stud After Removal of Concrete Slab and Steel Deck
191

7.6.3 Beam Test 2
The second beam had single studs welded in the weak position. There were 28
studs total, with 12 studs in each “shear span”, between zero and maximum moments.
The concrete strength was 4840 psi, with a unit weight of 141.1 pcf. The studs had an
ultimate strength, which was supplied by the manufacturer, of 66.8 ksi. The flanges of
the W16x31 beam had yield and ultimate strengths of 54.3 ksi and 72.6 ksi, respectively.
The web had yield and ultimate strengths of 58.2 ksi and 72.4 ksi, respectively.
The predicted moment of inertia was 1003 in4. The experimental moment of
inertia was 1013 in4.
The predicted flexural strength from the AISC stud strength model was 468.7 k-ft
and from the new stud strength model was 389.2 k-ft. The ultimate load applied to the
beam was 96.20 k, which equates to an experimental flexural strength of 379.0 k-ft. At
this maximum moment, there was a midspan deflection of 7.88 in. and an average slip of
0.268 in.
Plots of total load vs. deflection and total load vs. slip are shown in Figs. 7.9 -
7.10.
Failure occurred by yielding of the steel beam. Yielding of the bottom flange was
observed at a total load of 73.69 k. Web yielding was observed on the web at 84.30 k,
with significant yielding at 94.65 k. Deck bulging at the location of the studs was
observed at 95.47 k. Testing was terminated, at a midspan deflection of 9.57 in., because
of the large deflections. The slab was removed after testing so that the studs could be
observed. All studs remained attached to the steel beam upon failure of the specimen.
192
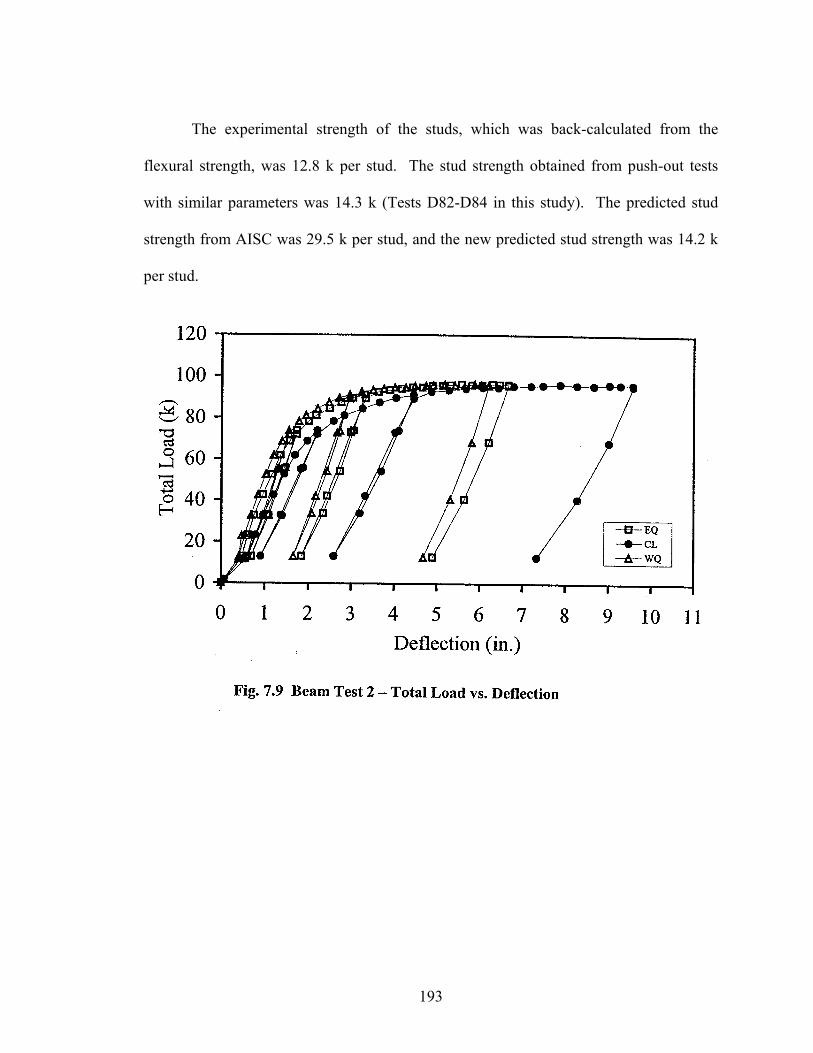
The experimental strength of the studs, which was back-calculated from the
flexural strength, was 12.8 k per stud. The stud strength obtained from push-out tests
with similar parameters was 14.3 k (Tests D82-D84 in this study). The predicted stud
strength from AISC was 29.5 k per stud, and the new predicted stud strength was 14.2 k
per stud.
193

7.6.4 Beam Test 3
The third beam had studs welded in pairs in the strong position. There were 28
studs total, with 12 studs in each “shear span”, between zero and maximum moments.
The concrete strength was 5610 psi, with a unit weight of 143.4 pcf. The studs had an
ultimate strength, which was supplied by the manufacturer, of 66.8 ksi. The flanges of
the W16x31 beam had yield and ultimate strengths of 54.3 ksi and 72.6 ksi, respectively.
The web had yield and ultimate strengths of 58.2 ksi and 72.4 ksi, respectively.
The predicted moment of inertia was 1033 in4. The experimental moment of
inertia was 1132 in4.
194

The predicted flexural strength from the AISC stud strength model was 470.8 k-ft
and from the new stud strength model was 408.8 k-ft. The ultimate load applied to the
beam was 95.48 k, which equates to an experimental flexural strength of 376.1 k-ft. At
this maximum moment, there was a midspan deflection of 4.70 in. and an average slip of
0.096 in.
Plots of total load vs. deflection and total load vs. slip are shown in Figs. 7.11 -
7.12.
A photo of the failed specimen is shown in Fig. 7.13. Failure occurred by
yielding of the steel beam. Yielding of the bottom flange was observed at a total load of
71.58 k. Popping noises were heard at a total load of 78.68 k and again at 88.79 k, before
ultimate load was reached. A large crack, transverse to the beam, formed in the slab at a
195

load of 89.28 k and is shown in Fig. 7.14. The ultimate load of 95.48 k was reached, and
shortly after this, cracks formed around the pair of studs closest to the west end.
Significant deck debonding occurred thereafter. Testing was terminated, at a midspan
deflection of 7.86 in., because of the large deflections.
The formation of the crack could have affected the beam strength. The
experimental strength of the studs, which was back-calculated from the flexural strength,
was 12.4 k per stud. The stud strength obtained from push-out tests with similar
parameters was 15.5 k (Lyon’s Tests D73-D75). The predicted stud strength from AISC
was 29.5 k per stud, and the new predicted stud strength was 17.1 k per stud.
196
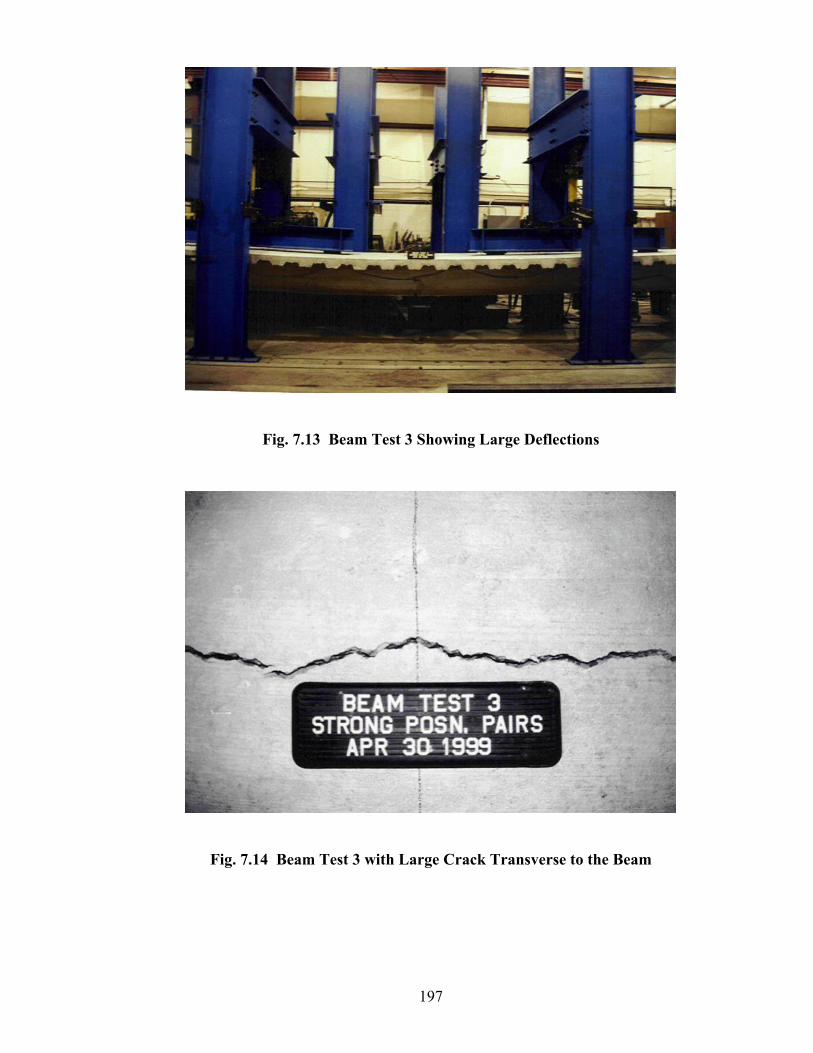
Fig. 7.13 Beam Test 3 Showing Large Deflections
Fig. 7.14 Beam Test 3 with Large Crack Transverse to the Beam
197

The slab was removed after testing so that the studs could be observed. All studs,
except for the third pair of studs from the west end, remained attached to the steel beam
upon failure of the specimen. It appears that one of the studs pulled out of the beam
flange because of an inadequate weld; failure of this stud caused the adjacent stud to fail
in shear. It is believed that these studs failed well before the ultimate load was reached,
when the two distinct popping noises, described previously, were heard.
One could argue that the flexural strengths should be calculated using the ten
remaining studs, instead of the original 12 on the beam. Using ten studs, AISC predicts a
capacity of 448.8 k-ft, and the new method predicts a capacity of 390.1 k-ft. The new
prediction for the capacity is 390.1 k-ft, 3.7% more than the experimental capacity of
376.1 k-ft. Also, using ten studs gives a back-calculated stud strength of 14.8 k. It is
interesting to note that if the stud strength of 15.5 k from push-out tests is used, along
with ten studs, the flexural strength is 380.4 k-ft, which is 1% more than the experimental
capacity.
7.7 Discussion of VT Composite Beam Test Results
7.7.1 General
The purpose of the composite beam tests reported in this chapter was to
investigate the effect on stud strength of the stud position in the rib and of placing the
studs in pairs. These tests are similar to those tests using 3 in. deck reported by Gibbings
et al (1993), except that the tests in this chapter used 2 in. deck. Therefore, this section is
198
a discussion of the tests by Gibbings et al (1993) and the tests reported in Section 7.6; a
summary of these tests is given in Tables 7.2 and 7.3.
In this section, both the experimental flexural strength and stud strength will be
compared to both the AISC and the new predictions. It is important to note that the
experimental flexural strengths were obtained directly from the beam tests, but the
experimental stud strengths were back-calculated from the flexural strengths. It was
stated previously that the flexural strength of a beam is not very sensitive to the stud
strength, which means that the back-calculated stud strength cannot be precisely
calculated from the flexural strength. A slight error in the experimental flexural strength
may cause a large error in the back-calculated stud strength.
It should also be emphasized that the purpose of evaluating the beam tests is not
to investigate the effects of different parameters on stud strength, because this was done
using push-out tests. Instead, the purpose is to validate the new stud strength prediction
model and to be sure that it gives reliable results for beam flexural strengths.
7.7.2 AISC Predictions of Flexural Strength
The experimental flexural strengths were all less than the AISC predictions, as
seen by the ratios Me/MAISC in Table 7.2. For the tests using 3 in. deck, the average ratio
was 0.94; and for the tests using 2 in. deck, the average ratio was 0.83. (This ratio
increases to 0.84 if ten studs instead of 12 are used in the west shear span for Test 3.
Refer to Section 7.6.4 for explanation).
199

200

7.7.3 New Predictions for Flexural Strength
The new predicted flexural strengths were more conservative than the AISC
predictions, as seen by the ratios Me/Mc in Table 7.2. For the 3 in. tests, the average ratio
of the experimental moment to new predicted moment, Me/Mc, was 1.04. For the 2 in.
tests, this ratio was 0.95, which increases to 0.97 if ten studs instead of 12 are used in the
west shear span for Test 3 (see Section 7.6.4).
7.7.4 AISC Predictions for Stud Strength
The AISC predictions for stud strength were all unconservative, as seen by the
ratios Qbc/QAISC in Table 7.3. The best prediction was for Gibbings’ Test 3, for which the
experimental stud strength-to-AISC predicted stud strength ratio (Qbc,/QAISC) was 0.99.
This test used concrete with a relatively low strength of 2280 psi, compared to the other
tests which had strengths over 4800 psi (except for Gibbings’ Test 2, with a strength of
3200 psi). The AISC predictions for the other three tests using 3 in. deck were more
unconservative, with an average experimental-to-predicted ratio of 0.74. The AISC
predictions for the tests using 2 in. deck were extremely unconservative. The single
strong position studs had an experimental-to-predicted ratio of 0.60, the weak position
studs had a ratio of 0.43, and the pairs of strong position studs had a ratio of 0.42.
7.7.5 New Predictions for Stud Strength
The new stud strength predictions are much more conservative than the AISC
predictions, as seen by the ratios Qbc/Qc in Table 7.3. The average ratio of experimental
201

stud strength-to-new predicted stud strength is 1.14 for the 3 in. tests and 0.83 for the 2
in. tests.
Gibbings et al (1993) noted that push-out tests provide a reliable method of
finding stud strengths and can be used to accurately predict the flexural strength of a
beam. Table 7.3 shows the stud strengths Qpo from push-out tests, which each had
similar parameters as its corresponding beam test. The average ratio of experimental stud
strength-to-push-out prediction was 1.19 for the 3 in. tests and 0.86 for the 2 in. tests.
These ratios are reasonably close to the experimental-to-new prediction ratios, which was
expected because the new prediction method was based on push-out tests.
7.7.6 Effects of Deck Height, Stud Position, and Pairing of Studs on Stud Strength
From these seven beam tests, one can compare the effects on stud strength of the
deck height, stud position, and placing studs in pairs. The comparisons are made in
Tables 7.4 – 7.6. From Table 7.4, the strength of the studs in 2 in. deck were about 78%
of those in 3 in. deck. From Table 7.5, the strength of the studs in the weak position were
an average of 71% of the strength of the studs in the strong position. This was expected,
because the weak position studs had a new predicted strength of 0.48AsFu, and the strong
position studs had a new predicted strength of 0.68AsFu (Assuming that AsFu is about the
same for all tests, 0.48AsFu/0.68AsFu = 0.71). From Table 7.6, the strength of a stud
placed in a pair from Test 3 is 70% of the strength of a single stud from Test 1. If 10
studs are used in the west shear span of Test 3 (see Section 7.6.4), this ratio is 0.84. The
new stud strength prediction method estimates a ratio of 0.85, and AISC predicts that
202

there is no difference in strength between a stud placed in pair and a single stud for the
parameters of Tests 1 and 3.
203