Chapter 7: Clouds and Aerosols - IPCC · PDF file2 Chapter 7: Clouds and Aerosols ... (USA),...
121
First Order Draft Chapter 7 IPCC WGI Fifth Assessment Report Do Not Cite, Quote or Distribute 7-1 Total pages: 121 1 Chapter 7: Clouds and Aerosols 2 3 Coordinating Lead Authors: Olivier Boucher (France), David Randall (USA) 4 5 Lead Authors: Paulo Artaxo (Brazil), Christopher Bretherton (USA), Graham Feingold (USA), Piers 6 Forster (UK), Veli-Matti Kerminen (Finland), Yutaka Kondo (Japan), Hong Liao (China), Ulrike Lohmann 7 (Switzerland), Philip Rasch (USA), S. K. Satheesh (India), Steven Sherwood (Australia), Bjorn Stevens 8 (Germany), Xiao-Ye Zhang (China) 9 10 Contributing Authors: Govindswamy Bala (India), Nicolas Bellouin (UK), Cristina Facchini (Italy), Mark 11 Flanner (USA), Steve Ghan (USA), Claire Granier (France), Corinna Hoose (Germany), Makoto Koike 12 (Japan), Natalie Mahowald (USA), Gunnar Myhre (Norway), Alan Robock (USA), Bjørn Samset (Norway), 13 Hauke Schmidt (Germany), Michael Schulz (Norway), Trude Storelvmo (USA) 14 15 Review Editors: Sandro Fuzzi (Italy), Joyce Penner (USA), Venkatachalam Ramaswamy (USA), Claudia 16 Stubenrauch (France) 17 18 Date of Draft: 16 December 2011 19 20 Notes: TSU Compiled Version 21 22 23 Table of Contents 24 25 Executive Summary .......................................................................................................................................... 3 26 7.1 Introduction .............................................................................................................................................. 5 27 7.2 Clouds ........................................................................................................................................................ 6 28 7.2.1 Clouds in the Present-Day Climate System .................................................................................. 7 29 7.2.2 Process Modelling and Observation of Clouds ............................................................................ 9 30 7.2.3 Representation of Clouds in Climate Models ............................................................................. 10 31 7.2.4 Cloud and Water-Vapour Feedback ........................................................................................... 13 32 7.2.5 Basis of Precipitation Changes in Cloud Physical Processes .................................................... 19 33 7.2.6 Anthropogenic Sources of Cloudiness ........................................................................................ 21 34 7.3 Aerosols ................................................................................................................................................... 22 35 7.3.1 Introduction ................................................................................................................................ 22 36 7.3.2 Aerosol Sources and Processes .................................................................................................. 22 37 7.3.3 Progresses and Gaps in Understanding Climate Relevant Aerosol Properties ......................... 24 38 7.3.4 Aerosol Distributions .................................................................................................................. 28 39 7.3.5 Aerosol Radiative Effects ............................................................................................................ 30 40 7.3.6 Aerosol-Climate Feedbacks ........................................................................................................ 35 41 7.4 Aerosol-Cloud Interactions .................................................................................................................... 37 42 7.4.1 Introduction ................................................................................................................................ 37 43 7.4.2 Aerosol Effects on Liquid Cloud Albedo (Indirect Radiative Forcing – iRF) ............................ 39 44 7.4.3 Adjustments in Liquid Clouds ..................................................................................................... 41 45 7.4.4 Adjustments in Cold Clouds ........................................................................................................ 43 46 7.4.5 Aerosol-Cloud Microphysical Effects on Precipitating Systems ................................................ 45 47 7.4.6 Synthesis of Aerosol Effects ........................................................................................................ 48 48 7.4.7 Impact of Cosmic Rays on Aerosols and Clouds ........................................................................ 50 49 7.5 Solar Radiation Management and Related Techniques ...................................................................... 52 50 7.5.1 Introduction ................................................................................................................................ 52 51 7.5.2 Idealised Experiments ................................................................................................................. 53 52 7.5.3 Stratospheric Aerosols ................................................................................................................ 53 53 7.5.4 Cloud Brightening....................................................................................................................... 54 54 7.5.5 Surface Albedo Changes ............................................................................................................. 55 55 7.5.6 Cirrus Thinning........................................................................................................................... 55 56 FAQ 7.1: How do Aerosols Affect Climate and Climate Change?............................................................. 56 57
Transcript of Chapter 7: Clouds and Aerosols - IPCC · PDF file2 Chapter 7: Clouds and Aerosols ... (USA),...
First Order Draft Chapter 7 IPCC WGI Fifth Assessment Report
Do Not Cite, Quote or Distribute 7-1 Total pages: 121
1
Chapter 7: Clouds and Aerosols 2 3 Coordinating Lead Authors: Olivier Boucher (France), David Randall (USA) 4 5 Lead Authors: Paulo Artaxo (Brazil), Christopher Bretherton (USA), Graham Feingold (USA), Piers 6 Forster (UK), Veli-Matti Kerminen (Finland), Yutaka Kondo (Japan), Hong Liao (China), Ulrike Lohmann 7 (Switzerland), Philip Rasch (USA), S. K. Satheesh (India), Steven Sherwood (Australia), Bjorn Stevens 8 (Germany), Xiao-Ye Zhang (China) 9 10 Contributing Authors: Govindswamy Bala (India), Nicolas Bellouin (UK), Cristina Facchini (Italy), Mark 11 Flanner (USA), Steve Ghan (USA), Claire Granier (France), Corinna Hoose (Germany), Makoto Koike 12 (Japan), Natalie Mahowald (USA), Gunnar Myhre (Norway), Alan Robock (USA), Bjørn Samset (Norway), 13 Hauke Schmidt (Germany), Michael Schulz (Norway), Trude Storelvmo (USA) 14 15 Review Editors: Sandro Fuzzi (Italy), Joyce Penner (USA), Venkatachalam Ramaswamy (USA), Claudia 16 Stubenrauch (France) 17 18 Date of Draft: 16 December 2011 19 20 Notes: TSU Compiled Version 21 22
23 Table of Contents 24 25 Executive Summary..........................................................................................................................................326 7.1 Introduction ..............................................................................................................................................527 7.2 Clouds ........................................................................................................................................................628
7.2.1 Clouds in the Present-Day Climate System ..................................................................................729 7.2.2 Process Modelling and Observation of Clouds ............................................................................930 7.2.3 Representation of Clouds in Climate Models .............................................................................1031 7.2.4 Cloud and Water-Vapour Feedback ...........................................................................................1332 7.2.5 Basis of Precipitation Changes in Cloud Physical Processes ....................................................1933 7.2.6 Anthropogenic Sources of Cloudiness ........................................................................................2134
7.3 Aerosols ...................................................................................................................................................2235 7.3.1 Introduction ................................................................................................................................2236 7.3.2 Aerosol Sources and Processes ..................................................................................................2237 7.3.3 Progresses and Gaps in Understanding Climate Relevant Aerosol Properties .........................2438 7.3.4 Aerosol Distributions ..................................................................................................................2839 7.3.5 Aerosol Radiative Effects............................................................................................................3040 7.3.6 Aerosol-Climate Feedbacks ........................................................................................................3541
7.4 Aerosol-Cloud Interactions....................................................................................................................3742 7.4.1 Introduction ................................................................................................................................3743 7.4.2 Aerosol Effects on Liquid Cloud Albedo (Indirect Radiative Forcing – iRF) ............................3944 7.4.3 Adjustments in Liquid Clouds .....................................................................................................4145 7.4.4 Adjustments in Cold Clouds........................................................................................................4346 7.4.5 Aerosol-Cloud Microphysical Effects on Precipitating Systems ................................................4547 7.4.6 Synthesis of Aerosol Effects ........................................................................................................4848 7.4.7 Impact of Cosmic Rays on Aerosols and Clouds ........................................................................5049
7.5 Solar Radiation Management and Related Techniques......................................................................5250 7.5.1 Introduction ................................................................................................................................5251 7.5.2 Idealised Experiments.................................................................................................................5352 7.5.3 Stratospheric Aerosols ................................................................................................................5353 7.5.4 Cloud Brightening.......................................................................................................................5454 7.5.5 Surface Albedo Changes .............................................................................................................5555 7.5.6 Cirrus Thinning...........................................................................................................................5556
FAQ 7.1: How do Aerosols Affect Climate and Climate Change?.............................................................5657
First Order Draft Chapter 7 IPCC WGI Fifth Assessment Report
Do Not Cite, Quote or Distribute 7-2 Total pages: 121
FAQ 7.2: How do Clouds Affect Climate and Climate Change? ...............................................................571 FAQ 7.3: Could Geoengineering Counteract Climate Change and What Side-Effects Might Occur?..582 References........................................................................................................................................................613 Tables .............................................................................................................................................................1004 Figures ...........................................................................................................................................................102 5
6
First Order Draft Chapter 7 IPCC WGI Fifth Assessment Report
Do Not Cite, Quote or Distribute 7-3 Total pages: 121
Executive Summary 1 2 • Clouds cool the Earth on average, by about 17 W m–2. This is the net result of a greenhouse (infrared) 3
warming due mainly to high clouds (~30 W m–2) and a cooling effect from reflecting solar radiation 4 contributed by all cloud types (~47 W m–2). 5
6 • New satellite observations and advances to models have given us global simulations that can explicitly 7
resolve some types of clouds. Comparison to detailed observations with such models has led to improved 8 understanding of cloud interactions with the meteorology and the climate. However observations alone do 9 not provide a robust constraint on the sign and magnitude of cloud feedbacks. 10
11 • Evidence for a net positive feedback from water vapour and lapse rate changes has increased robustness. 12
The net long-term feedback parameter is very likely positive with an interquartile range of 0.90 to 1.06 W 13 m–2 K–1 from CMIP3 model [PLACEHOLDER FOR SECOND ORDER DRAFT: CMIP5 models]. 14
15 • Cloud feedbacks on long-term greenhouse-gas induced surface temperature change are likely positive. 16
Robust positive feedback mechanisms have been established while no mechanism for strong negative 17 global cloud feedback has convincing observational or model-based support. The robust mechanisms 18 include a rise in the heights of cirrus cloud tops and a reduction in subtropical cloudiness. The range of 19 the cloud feedback parameter in the CMIP5 models is [xx to yy] W m–2 K–1. Inconsistent prediction of 20 changes to low cloud remains the largest source of spread in the cloud feedback parameter and 21 equilibrium climate sensitivity among climate models. Since all cloud types are crudely represented by 22 climate models, values outside the current spread of climate models cannot be ruled out. 23
24 • Observations, theoretical considerations and models indicate that the strength of extreme precipitation 25
events, which can cause flooding, tend to strongly increase as the climate warms and atmospheric 26 humidity increases. This tendency is expected to vary significantly by region. 27
28 • Observational studies since AR4 suggest that contrails and contrail-cirrus from aircraft, at current levels 29
of coverage, exert only a small adjusted forcing (AF) of 0.03 W m–2 (with a 5%–95% uncertainty range of 30 0.01 to 0.06 W m–2), and are unlikely to have an observable effect on surface temperature and diurnal 31 temperature range. 32
33 • There has been continuous progress since AR4 on observing and modelling climate-relevant aerosols 34
properties (including their size distribution, hygroscopicity, chemical composition, mixing state, optical 35 and cloud nucleation properties) and their atmospheric distribution. The representation of aerosol 36 processes in the CMIP5 models remain more simplistic than in some of the more detailed aerosol models 37 used to assess radiative forcing (RF). 38
39 • The aerosol direct effect was assessed for the year 2010 relative to 1750 with all ranges indicative of 5%-40
95% confidence intervals. The RF for the total direct aerosol effect is –0.3 ± 0.3 W m–2 (not accounting 41 for possible anthropogenic changes in mineral dust), using evidence from aerosol models and some 42 constraints from observations. The semi-direct effect of atmospheric heating on clouds can be significant 43 and of either sign regionally but is thought to be small globally (~0.1 W m–2) and not significantly 44 different than zero. The direct and semi-direct effects from anthropogenic aerosols are assessed together 45 as an AF of –0.3 ± 0.4 W m–2. 46
47 • Sulphate aerosol is responsible for a RF of −0.3 W m–2 (–0.2 to –0.6 W m–2). Black carbon (BC) aerosol 48
has a RF +0.2 ± 0.2 W m–2 (fossil fuel sources only) and +0.4 ± 0.2 W m–2 (fossil fuel and biomass 49 burning including a possible small fraction from vegetation feedbacks). The largest uncertainties relate to 50 the vertical profile of BC. Organic carbon aerosol from fossil fuel sources has a RF –0.05 ± 0.05 W m–2. 51 Biomass burning aerosol has a RF –0.01 W m–2 (–0.15 to +0.1 W m–2). Secondary organic aerosol has a 52 RF –0.04 W m–2 (–0.03 to –0.07 W m–2) and nitrate aerosol has a RF of –0.1 ± 0.08 W m–2. Finally 53 mineral aerosol has a RF of –0.1 ± 0.2 W m–2 but this may include part of a feedback. 54
55 • Anthropogenic absorbing aerosols (BC and brown carbon) on snow and ice are responsible for a positive 56
RF of +0.04 W m–2, with a 0.01–0.10 W m–2 (5%-95%) uncertainty range. This radiative forcing is 2-4 57
First Order Draft Chapter 7 IPCC WGI Fifth Assessment Report
Do Not Cite, Quote or Distribute 7-4 Total pages: 121
time more effective at causing global mean temperature changes than an equivalent radiative forcing from 1 CO2. 2
3 • A number of climate feedbacks have been identified which involve aerosols, either through a change in 4
the source strength of natural aerosols or a change in sink processes. There is low agreement in model 5 simulations and no solid evidence to suggest that such feedbacks could be significant during the 21st 6 century although they may be important at the regional scale. 7
8 • There has been continuous progress in our understanding of aerosol-cloud interactions in liquid clouds, in 9
particular from observations and large-eddy simulating models, which reveal some compensating effects. 10 Progress has been made on our understanding of aerosol interactions with mixed phase and ice clouds and 11 their representation in climate models. This progress has led to a reduction in the estimate for the 12 magnitude of global aerosol indirect forcings. 13
14 • The indirect radiative forcing (iRF) is very likely between –1 and –0.1 W m–2, the lower bound being 15
based on estimates from climate models, and likely between –0.4 and –0.2 W m–2, the lower bound being 16 based on studies that take satellite data into account. Following the same line of argumentation, the 17 indirect adjusted forcing (iAF) is very likely between –1.5 and 0 W m–2 and likely between –0.7 and –0.2 18 W m–2. 19
20 • There is limited, if any, evidence and no agreement that the small-scale impact of aerosols on cloud 21
microphysical structure translates into a significant regional impact in terms of precipitation amount 22 (beyond orographic locations) but there is medium evidence and agreement for an effect on timing and 23 intensity of precipitation. 24
25 • New studies provide robust evidence that cosmic rays influence new particle formation through changes 26
in atmospheric ionization rate. However there is medium evidence and high agreement that any effects 27 from variations in cosmic rays on CCN and cloud properties are insignificant climatically. 28
29 • From a physical-science assessment basis, model studies, observations of the effects of volcanic 30
eruptions, and physical arguments suggest that some Solar Radiation Management (SRM) strategies for 31 geoengineering may be effective in offsetting the global average surface temperature increase. However 32 SRM would produce an inexact compensation for the RF by greenhouse gases and there would be 33 residual regional differences in temperature and rainfall patterns. SRM will not compensate for ocean 34 acidification from increasing CO2 and may have other impacts on the climate system (e.g., stratospheric 35 ozone depletion from stratospheric aerosol injection). Termination of SRM would produce a reappearance 36 of most of the avoided global warming within about a decade. 37
38 • Evidence from past volcanic eruptions and modelling studies suggest that increasing the amount of 39
aerosols in the stratosphere can increase the Earth’s albedo enough to counteract the global RF of at least 40 up to a doubling of CO2 (within the limitations stated above). The effectiveness and potential of SRM 41 through cloud brightening is more uncertain than through stratospheric aerosol injection because of our 42 limited understanding of aerosol indirect effects on clouds. 43
44
First Order Draft Chapter 7 IPCC WGI Fifth Assessment Report
Do Not Cite, Quote or Distribute 7-5 Total pages: 121
7.1 Introduction 1 2 The atmosphere, although mostly composed of gases, is full of particles. It is usual to partition these particles 3 into cloud particles, atmospheric aerosols, and falling hydrometeors according to their size, water content 4 and sedimentation velocity. 5 6 Clouds usually form in rising air, which expands and cools until cloud formation occurs through nucleation 7 or freezing of aerosol particles. Cloud particles are generally larger than aerosols and mostly composed of 8 water; they are suspended in the atmosphere and collectively form a cloud which is usually a visible body. 9 The evolution of a cloud is governed by the balance between a number of dynamical, radiative and 10 microphysical processes. Cloud particles of sufficient size become falling hydrometeors, which are 11 categorised as drizzle, raindrops, snow crystals and graupel. Clouds affect the climate system by regulating 12 the flow of radiation at the top of the atmosphere, by controlling precipitation, and through additional 13 mechanisms too numerous to list here. Precipitation processes merit special attention not only because the 14 hydrological cycle is important in its own right, and intricately linked to the structure of regional circulation 15 systems, but also because the frequency and distribution of precipitation is an important sink of aerosol 16 particles. 17 18 Atmospheric aerosols are relatively small solid and liquid particles in suspension in the air that can be of 19 natural or anthropogenic origin. They interact with solar radiation, through absorption and scattering, and to 20 a lesser extent with terrestrial radiation, through absorption, scattering and emission. Aerosols can serve as 21 cloud condensation nuclei and ice nuclei upon which cloud droplets and ice crystals form. They also play a 22 wider role in biogeochemical cycles in the Earth system, for instance by carrying nutrients to ocean 23 ecosystems. 24 25 Cloud and aerosol amounts and properties are extremely variable in space and time. The short lifetime of 26 clouds in the atmosphere often creates relatively sharp cloud edges and rapid horizontal variations in cloud 27 properties, which is much less typical of aerosol layers. While the dichotomy between aerosols and clouds is 28 generally appropriate and useful, it should be appreciated that there can be a continuum in particle size and a 29 continuum between clear and cloudy sky which makes the distinction between aerosols and clouds, or clouds 30 and rain more difficult and sometimes less relevant (Charlson et al., 2007; Koren et al., 2007). 31 32 Both clouds and aerosols are a major source of uncertainties in the climate system. Clouds respond to climate 33 forcing mechanisms in multiple ways and individual cloud feedbacks can be positive or negative. The 34 representation of cloud processes in climate models has been recognised for decades as a continuing source 35 of much of the uncertainty surrounding climate change (e.g., Arakawa 1975, 2004; Bony et al., 2006; Cess et 36 al., 1989; Charney, 1979; Randall, 1989), but with the exception of the Charney report (Charney, 1979) 37 clouds have not been a focal point of past assessment reports. Key issues include the representation of both 38 deep and shallow cumulus convection, microphysical processes in ice clouds, and partial cloudiness that 39 results from small-scale variations of cloud-producing and cloud-destroying processes. Inter-model 40 differences in cloud feedbacks constitute by far the primary source of spread of both equilibrium and 41 transient climate responses simulated by the CMIP3 climate models (Dufresne and Bony, 2008) despite the 42 fact that, as discussed by Randall et al. (2007) and also later in this chapter, most models agree on a near-43 neutral or positive cloud feedback. 44 45 Anthropogenic aerosols are responsible for a radiative forcing of climate through their direct effect (the 46 interaction of aerosols with radiation) and their indirect effects (the interaction of aerosols with clouds). 47 Quantification of the direct and indirect effects of anthropogenic aerosols has proven difficult, and is fraught 48 with uncertainties (Haywood and Boucher, 2000; Lohmann and Feichter, 2005). While previous attempts to 49 quantify the probability distribution function for the net anthropogenic radiative forcing from bottom up 50 approaches have found that it is very likely or virtually certain to be positive, the possibility of negative 51 values could not completely be ruled out (Forster et al., 2007; Haywood and Schulz, 2007). Our inability to 52 better quantify non-greenhouse gas radiative forcings, and primarily that associated with atmospheric 53 aerosols, is partly responsible for the uncertainty in observationally-constrained climate sensitivity (Andreae 54 et al., 2005). It was also found that the total anthropogenic forcing is inversely correlated to climate 55 sensitivity in climate models used for CMIP3 (Kiehl, 2007). This is important because, for a given climate 56 model, the uncertainty in aerosol radiative forcing has proportionally more impact on the simulation of the 57
First Order Draft Chapter 7 IPCC WGI Fifth Assessment Report
Do Not Cite, Quote or Distribute 7-6 Total pages: 121
20th century’s climate than of future climate projections (Dufresne et al., 2005) because scenarios of 1 anthropogenic aerosol emissions tend to stabilise or decrease in the future (Lamarque et al., 2010). 2 3 Research into cloud-climate interactions has also progressed significantly since the Fourth Assessment report 4 (AR4, IPCC 2007). Examples include additional field programmes (e.g., the Tropical Warm Pool 5 International Cloud Experiment, TWPICE, as described by May et al. (2008)), greatly improved satellite data 6 (e.g., Stephens and Kummerow, 2007), improved cloud parameterisations (e.g., Park and Bretherton, 2009), 7 studies with high-resolution global models (e.g., Sato et al., 2009), and very-high-resolution regional models 8 (e.g., Khairoutdinov et al., 2009). 9 10 The Third Assessment Report (TAR, IPCC 2001) dedicated a chapter to atmospheric aerosols (Penner et al., 11 2001), while their radiative forcing was assessed in a separate chapter (Ramaswamy et al., 2001). The AR4 12 updated our understanding of the aerosol radiative forcing (Forster et al., 2007), but did not assess all aspects 13 of aerosol influences on climate. Aerosol indirect effects on climate were discussed in Denman et al. (2007). 14 Our capability to observe aerosols has increased substantially since the TAR and the AR4, and so has our 15 understanding of aerosol processes and our modelling capability, from the fine to the large scale. Many 16 climate models now include more complex parameterisations of aerosol and cloud microphysics, 17 incorporating understanding from process-based models. Models are being more thoroughly evaluated 18 against in-situ (e.g., Koch et al., 2009b) and remote-sensing observations (e.g., Huneeus et al., 2011b), and 19 that evaluation feeds back into model development. However an accurate treatment of aerosol processes and 20 their impact on climate at the global scale remains a challenge. 21 22 For the first time in the IPCC WGI assessment reports, clouds and aerosols are discussed together in a single 23 chapter. This offers the opportunity to assess in a unified framework not only cloud feedbacks and aerosol 24 forcings, but also the multiple interactions among aerosols, clouds and precipitation and their relevance for 25 climate and climate change. 26 27 Figure 7.1 provides an overview of the chapter’s approach to clouds and aerosols in the context of climate 28 change. Forcings associated with forcing agents such as greenhouse gases and aerosols act on global mean 29 surface temperature through the global radiation budget. Rapid forcing adjustments (or rapid responses) arise 30 when forcing agents, by altering flows of energy internal to the system, affect cloud cover (or other 31 components of the climate system) and thereby alter the global budget indirectly. Because these adjustments 32 do not operate through changes to global mean surface temperature, which are slowed by the massive heat 33 capacity of the oceans, they are generally rapid and most are thought to occur within a week. Feedbacks 34 amplify or damp changes to the global mean surface temperature via its impact on atmospheric variables that 35 affect the global budget. Such a framework offers a clear distinction between the traditional concept of 36 radiative forcing (RF, defined as the instantaneous radiative forcing with stratospheric adjustment only) and 37 the new concept of adjusted forcing (AF, which includes other atmospheric and surface rapid adjustments) as 38 introduced in Chapter 1 and detailed in Section 8.1.1. The aerosol semi-direct and indirect effects, which 39 have been recognised as important for some time, will be quantified here through the concept of adjusted 40 forcing. 41 42 [INSERT FIGURE 7.1 HERE] 43 Figure 7.1: Overview of feedback and forcing pathways involving clouds and aerosols. Forcings are represented by 44 dark arrows; forcing agents are boxes with grey shadows, rapid forcing adjustments (or rapid response) are red arrows 45 and feedbacks are other-colored arrows. See text for further discussion. 46 47 The Chapter aims to discuss clouds and aerosols in a comprehensive but climate-focused way. Section 7.2 48 describes our understanding of the role of clouds in climate change. Section 7.3 discusses aerosol properties 49 and how these link up with best estimates of the aerosol direct radiative forcing and their uncertainties. 50 Section 7.4 covers aerosol-cloud interactions and derives estimates for the aerosol indirect forcing. Finally 51 Section 7.5 assesses solar radiation management techniques aimed at cooling the planet as a number of these 52 techniques rely on the modification of aerosols and clouds. Our radiative forcing estimates for the aerosol 53 effects feed into Chapter 8. 54 55 7.2 Clouds 56 57
First Order Draft Chapter 7 IPCC WGI Fifth Assessment Report
Do Not Cite, Quote or Distribute 7-7 Total pages: 121
7.2.1 Clouds in the Present-Day Climate System 1 2 7.2.1.1 Cloud Formation, Cloud Types, and Cloud Climatology 3 4 To form a cloud, air must cool or moisten until it is sufficiently supersaturated with respect to water vapor to 5 nucleate some of the available condensation or freezing nuclei. Clouds form in diverse ways, including 6 large-scale or orographically-driven ascent, small-scale turbulent buoyant ascent, radiative or evaporative 7 cooling, or turbulent mixing of a moist layer. These formation mechanisms support many important cloud 8 types, e.g., cirrus, stratus, or cumulus, organized by large-scale circulations into different climatological 9 cloud regimes (such as subtropical marine stratocumulus) or transient cloud systems (such as tropical or 10 midlatitude cyclones). Each cloud regime or system has a characteristic assemblage of cloud types that 11 contribute to its radiative properties and precipitation characteristics. Such assemblages can be objectively 12 isolated from satellite data (Jakob and Schumacher, 2008; Jakob et al., 2005). 13 14 Figure 7.2 shows a selection of widely occurring tropical and extratropical cloud regimes, and how they 15 might look on at visible wavelengths on a typical geostationary satellite image. 16 17 [INSERT FIGURE 7.2 HERE] 18 Figure 7.2: Diverse cloud regimes reflect diverse meteorology. (a) A visible-wavelength geostationary satellite image 19 shows (from top to bottom) expanses and long arcs of cloud associated with extratropical cyclones, subtropical coastal 20 stratocumulus near Baja California breaking up into shallow cumulus clouds in the central Pacific, and mesoscale 21 convective systems outlining the Pacific ITCZ. (b) A schematic vertical section through a typical warm front of an 22 extratropical cyclone shows multiple layers of upper-tropospheric ice (cirrus) and mid-tropospheric water (altostratus) 23 cloud upwind of the frontal zone, an extensive region of nimbostratus associated with frontal uplift and turbulence-24 driven boundary layer cloud in the warm sector. (c) A schematic cross section along the low-level trade wind flow from 25 a subtropical west coast of a continent to the ITCZ shows typical low-latitude cloud types, shallow stratocumulus in the 26 cool waters of the oceanic upwelling zone near the coast, trapped under a strong subsidence inversion, shallow cumulus 27 of warmer waters further offshore and a transition into precipitating cumulonimbus cloud systems with extensive cirrus 28 anvils associated with rising air motions in the ITCZ. 29 30 Figure 7.3a shows a corresponding geographical annual-mean plot of the total fraction of atmospheric 31 columns that contain cloud, thresholded to remove very thin cloud of little radiative significance. Figure 7.3b 32 shows a latitude-height section of annual- zonal-mean cloud fractional occurrence from CloudSat and 33 Calipso, a combination of active sensors that can detect even thin clouds (optical depth less than rougly 3–5) 34 and see deep into thick cloud layers. Clouds appearing above roughly the 400 hPa level (which are nearly all 35 ice) are typically considered “high clouds”, while those appearing below roughly 700 hPa (which are mostly 36 liquid but often contain ice outside the tropics) are considered “low” (Zelinka et al., 2011a). 37 38 [INSERT FIGURE 7.3 HERE] 39 Figure 7.3: Annual-mean cloud fractional occurrence based on four years of satellite observations (June 2006-February 40 2011) from CloudSat and Calipso (Kay et al., 2011; COSP simulator). (a) Geographical mean, with thin cloud (SR < 5) 41 removed; (b) latitude-height section of zonal mean cloud cover. [PLACEHOLDER FOR SECOND ORDER DRAFT: 42 further graphical refinement.] 43 44 [INSERT FIGURE 7.4 HERE] 45 Figure 7.4: Distribution of annual-mean SWCRE, LWCRE, net CRE (from CERES-EBAF) and precipitation (from 46 CMAP). 47 48 7.2.1.2 Effects of Clouds on Earth’s Radiation Budget 49 50 The effect of clouds on Earth’s radiation budget can be inferred by comparing satellite estimates of 51 upwelling solar and longwave radiation with the corresponding fluxes in the absence of clouds, obtained by 52 screening cloudy pixels or using clear-sky radiative transfer models. Using this method, Loeb et al., (2009) 53 estimate that in annual global mean, clouds enhance the planetary albedo, changing the net shortwave 54 radiative flux into the top of the atmosphere (TOA) by –47 W m–2 compared to a cloud-free atmosphere (the 55 global shortwave cloud radiative effect or SWCRE), and that clouds enhance the planetary greenhouse 56 effect, reducing net longwave radiative energy loss by 30 W m–2 (the global longwave cloud radiative effect 57 or LWCRE). Other published estimates differ from these by 10% or less (Loeb et al., 2009). The combined 58 annual global mean net CRE of –17 W m–2 can be regarded as a cooling effect of clouds on climate. Both 59
First Order Draft Chapter 7 IPCC WGI Fifth Assessment Report
Do Not Cite, Quote or Distribute 7-8 Total pages: 121
global mean SWCRE and LWCRE are large compared to the 4 W m–2 radiative forcing of doubling CO2. 1 Hence, even modest changes in the global distribution of clouds could produce substantial radiative feedback 2 on climate change. 3 4 The regional patterns of annual-mean SWCRE and LWCRE, shown in Figure 7.4a-b, reflect typical cloud 5 regimes averaged across the seasonal cycle. High clouds, which are cold compared to the underlying surface, 6 dominate patterns of LWCRE, while the SWCRE is sensitive to optically thick clouds at all altitudes. Figure 7 7.2 shows that regions of deep, thick cloud with large LWCRE and large negative SWCRE tend to 8 accompany precipitation, emphasizing their intimate connection with the hydrological cycle. The net CRE is 9 negative over most of the globe and most negative in regions of very extensive low-lying reflective cloud 10 such as the midlatitude and eastern subtropical oceans, where SWCRE is strong but LWCRE is weak. 11 12 7.2.1.3 Coupling Between Clouds, Precipitation, Large-Scale Dynamics and Stratification 13 14 Precipitation is almost exclusively initiated in updrafts inside clouds. Thus, it is inextricably linked to clouds 15 and their dynamical drivers. 16 17 7.2.1.3.1 Deep precipitating cloud systems 18 Over the tropical oceans, where most rain falls from cumulus cloud systems, we observe particularly tight 19 statistical correlations over daily or longer timescales and space scales of a few hundred kilometres or more. 20 More rainfall associates with more deep convective cloud cover (Wyant et al., 2006), higher relative 21 humidity throughout the depth of the free troposphere (Holloway and Neelin, 2009) and more mean mid-22 tropospheric upward motion (Bony et al., 2004; Lintner et al., 2011). Similar relationships have been 23 documented in the midlatitude storm tracks (Norris and Iacobellis, 2005). These relationships may change 24 somewhat if climate changes; for instance, they could be affected by temperature changes that affect 25 saturation water vapour mixing ratio, as well as the depth of the tropopause and the freezing level. However, 26 we do expect a close correspondence between regional changes in mean vertical motion, precipitation and 27 cloud cover that accompany a climate change, a theme explored further in the discussion of cloud feedbacks 28 in Section 7.2.4. 29 30 7.2.1.3.2 Large-scale controls on boundary-layer cloudiness 31 While cumulus clouds develop in conditionally unstable layers of the atmosphere, marine stratocumulus 32 clouds persist where there is a strong capping inversion that traps moisture in the atmospheric boundary 33 layer. Klein and Hartmann (1993) showed that on seasonal and longer timescales, increased subtropical 34 marine stratocumulus cloud cover is strongly correlated with greater lower tropospheric stability (LTS) 35 between the surface and 700 hPa. Variants of LTS such as estimated inversion strength (EIS) (Wood; 36 Bretherton 2006) or others that also account for humidity variations (Williams et al., 2006; Zhang et al., 37 2010a) better predict low cloud cover over the mid-latitude oceans and may be more applicable to changed 38 climates (Wood and Bretherton, 2006). 39 40 7.2.1.3.3 Mixed-phase arctic clouds 41 Arctic clouds have become a focus of recent interest because they may affect the sensitivity of the Arctic to 42 climate change, and because they can involve complex, vertically layered interactions between ice, liquid 43 and aerosol particles. These clouds can persist for days, in spite of the inherent instability of the ice-water 44 mix (Fridlind et al., 2007); theory suggests that mixed phase clouds persist if their updraughts are strong 45 enough and ice nucleus concentrations low enough to maintain liquid water and prevent complete glaciation 46 of the cloud (Korolev and Field, 2008). Morrison et al. (2011) argue this leads to a self-regulating structure 47 in which thin layers of liquid water are maintained by radiatively-driven turbulence but are depleted by 48 formation of ice that falls away from the liquid layer. Slight changes in meteorological forcing can rapidly 49 glaciate the cloud layer and greatly diminish its radiative impact (Stramler et al., 2011). This combination of 50 processes challenges numerical models of all scales, which struggle to simulate the balance between liquid 51 and ice particles in field observations of Arctic boundary-layer clouds (Klein et al., 2009). 52 53 The response of high-latitude boundary-layer cloud cover response to the fractional cover of underlying sea-54 ice could be an important climate feedback and is discussed (including relevant observations) in Section 55 7.2.4.3.5. 56 57
First Order Draft Chapter 7 IPCC WGI Fifth Assessment Report
Do Not Cite, Quote or Distribute 7-9 Total pages: 121
7.2.1.3.4 Small-scale cloud-precipitation-circulation interaction 1 Precipitation can feed back profoundly on the small-scale circulations that accompany most cloud systems, 2 for example by generating downdrafts and gusts that can produce more clouds, and by removing condensed 3 water and aerosol particles. This helps foster characteristic ‘open-cell’ patterns of marine boundary layer 4 cloud in midlatitude cold-air outbreaks (e.g., Muller and Chlond, 1996) and the low-latitude trade-wind belts 5 (e.g., Xue et al., 2008); interactions with aerosols may also be involved, allowing rapid transitions between 6 regimes of much vs. little cloud cover (see Section 7.4.3.2). Similar interactions help organize deep cumulus 7 convection into mesoscale convective systems, squall lines, and tornadic thunderstorms (Houze, 1993), and 8 the tendency to organize at these and larger scales gives convection a leading role in driving weather and 9 climate variability especially at low latitudes. The organization is affected by details at small scales such as 10 the fall speed of ice and snow crystals (Houze 1993). These interactions typically occur below the grid scale 11 of climate models, partly explaining why many climate models reproduce convective organization poorly 12 (Mapes et al., 2009). 13 14 7.2.2 Process Modelling and Observation of Clouds 15 16 7.2.2.1 Challenges in Modelling and Measurement of Cloud Processes 17 18 Cloud formation processes span scales from the submicron scale of cloud condensation nuclei to cloud 19 system scales of up to thousands of kilometres. This range of scales is impossible to cover with direct 20 numerical simulations on computers, and is unlikely to become so for decades if ever. 21 22 High-resolution models of individual cloud systems have nonetheless contributed greatly to our appreciation 23 of interactions of turbulence with various types of cloud, e.g., cumulus, stratocumulus and cirrus. The usual 24 strategy is called large-eddy simulation (LES) when applied to boundary-layer turbulence and cloud-25 resolving modelling (CRM) when applied to deep cumulus convection. The grid spacing is chosen to be 26 small enough to resolve the dominant turbulent eddies that drive cloud heterogeneity, and the effects of 27 unresolved eddies are parameterized. CRMs of deep convective cloud systems with horizontal resolutions of 28 2 km or finer can skilfully characterize statistical characteristics of the cloud ensemble, including fractional 29 area coverage of cloud, vertical thermodynamic structure, the distribution of updrafts and downdrafts, and 30 organization into mesoscale convective systems. However, some cloud ensemble properties are still sensitive 31 to CRM microphysical parameterization assumptions, particularly the vertical distribution and optical depth 32 of ice and mixed-phase clouds. Also, this type of modelling approach does not capture interactions with large 33 scales, which requires a larger-scale model in which most of the cloud behaviour is parameterized. 34 35 Shallow cumulus cloud fields with clouds of below 2 km thickness are widespread over low latitudes. LES 36 of such cloud fields with horizontal grid spacing of ~100 m and vertical grid spacing of ~40 m produces 37 vertical profiles of cloud fraction, temperature, moisture and turbulent fluxes that agree well with available 38 observations, though the simulated precipitation efficiency still shows some sensitivity to microphysical 39 parameterizations (vanZanten et al., 2011). 40 41 LES of stratocumulus-topped boundary layers have shown considerable skill in simulating turbulence 42 statistics and vertical thermodynamic structure (e.g., Ackerman et al., 2009; Stevens et al., 2005), and have 43 been used to study the sensitivity of stratocumulus cloud organization, cloud thickness and albedo to changes 44 in cloud condensation nucleus concentration (e.g., Savic-Jovcic and Stevens, 2008; Xue et al., 2008), sea-45 surface temperature (SST) and free-tropospheric conditions. However, model intercomparisons show that the 46 simulated entrainment rate and stratocumulus cloud thickness are sensitive to the underlying numerical 47 algorithms, even with vertical grid spacings as small as 5 m, due to under-resolution of the sharp capping 48 inversion (Stevens et al., 2005). 49 50 7.2.2.2 Current Observing Capacities Relevant to Cloud Processes and Global Effects 51 52 Observations useful for detecting long-term (at least 20 year) changes in clouds, along with the significant 53 difficulties in interpreting such observations given natural variability and other factors, are discussed in 54 Chapter 2, Section 2.3.8. Here we discuss current observing capabilities for assessing climate-relevant cloud 55 properties. A variety of observing systems, some new since AR4, combine to give us unprecedented insight 56
First Order Draft Chapter 7 IPCC WGI Fifth Assessment Report
Do Not Cite, Quote or Distribute 7-10 Total pages: 121
into different aspects of clouds on different temporal and spatial scales and to test and improve climate 1 model simulations. 2 3 Satellites observations have proved particularly useful in the above regard due to their frequent and global 4 (or near-global) coverage and because they directly measure how cloud characteristics affect outgoing 5 radiation and hence the Earth's energy budget. Instruments available since the late 1970's on a combination 6 of polar orbiters and geostationary weather satellites measure in the visible, near-infrared, thermal and 7 microwave bands of the spectrum, and infer the reflectance, greenhouse effect, and approximate 8 characteristic particle size and liquid water content of clouds. They observe nearly every spot on Earth at 9 intervals from under an hour to many days depending on the instrument. Such satellite observations have 10 limitations - meteorologically different distributions of cloud can look identical to the satellite, particularly if 11 there are multiple cloud layers or cloud properties vary substantially across a satellite pixel (Wolters et al., 12 2010). Low-lying clouds over ice-covered surfaces are hard to detect in visible channels that are only useful 13 during daytime. Most polar-orbiting satellites overfly each location at two particular local times of day, an 14 issue in many regions with significant diurnal cycles of cloud cover. Geostationary satellites observe 15 throughout the day, but with less spatial resolution. 16 17 Since the late 1990's, other satellites (e.g., NASA’s Terra and Aqua) have carried advanced instruments that 18 sample more wavelengths, polarisation, and multiple viewing angles to more accurately estimate the above 19 cloud properties, as well as cloud-top altitudes, and to improve the estimation of rain rates although this 20 remains a challenge (Marchand et al., 2010; Stephens; Kummerow 2007). Since 1997 the TRMM 21 spaceborne radar has also observed the vertical structure of precipitation at latitudes equatorwards of about 22 35°N/S. 23
24 The 2006 launch by NASA of two coordinated, downward-pointing active sensors, the cloud profiling radar 25 (CPR) on the CloudSat satellite and the CALIOP lidar on board the CALIPSO satellite has given the first 26 accurate, near-global picture of the vertical distribution of cloud water and precipitation. Their high 27 sensitivity, small footprint (roughly 1.5 km for CPR and 0.33 km for CALIOP), and vertical resolution (500 28 m and 30 m below 8 km, respectively) enable them to detect more tenuous and smaller clouds than most 29 previous instruments (Winker et al., 2009). Their small daily sampling area makes them most useful for 30 long-term statistics and for improving the interpretation of other instruments with overlapping, but broader, 31 spatial coverage. Since AR4, satellite simulators (Chapter 9) have become widely used for comparing clouds 32 and precipitation simulated by climate models with observations, and new simulators have been developed to 33 compare with modern generations of cloud-observing satellite instruments. 34 35 Surface or aircraft-based observations give detailed process information on clouds in limited regions, often 36 combining many types of measurements. Over the last 15 years, sites in different climate regimes, such as 37 northern Europe, the central USA, China, the tropical Pacific, the West Indies, and the Arctic have begun 38 continuously measuring overlying cloud properties using lidars, radars, and radiometers within a rich context 39 of other atmospheric measurements. Such observations are widely compared with climate model behaviour 40 (e.g., Phillips et al., 2004). Many field programs have been designed to improve understanding of cloud 41 processes important to climate models using multi-instrument, multiplatform observations over a period of a 42 few weeks that sample relationships between many quantities, followed by organized comparisons of climate 43 and process models with the gathered data to evaluate and improve specific aspects of the simulations. Two 44 recent examples are TWP-ICE for tropical cumulus convection in the Australian monsoon and cirrus 45 formation (May et al., 2008) and VOCALS for aerosol-cloud-precipitation interaction in subtropical 46 southeast Pacific stratocumulus clouds (Wood et al., 2011). 47 48 7.2.3 Representation of Clouds in Climate Models 49 50 7.2.3.1 Challenges of Parameterization Interaction and Subgrid Variability 51 52 Clouds form where rising air supersaturates sufficiently with respect to water vapour. The cloud droplets or 53 ice crystals can then evolve, collide and grow to form precipitation. If these processes occurred uniformly 54 across model grid cells, representing clouds in climate models would reduce to parameterizing their 55 microphysics. Especially for ice and mixed-phase clouds this is already a challenge due to the complexity of 56 microphysical processes. 57
First Order Draft Chapter 7 IPCC WGI Fifth Assessment Report
Do Not Cite, Quote or Distribute 7-11 Total pages: 121
1 Unfortunately clouds are often thin and short-lived, typically form through turbulent processes not resolved 2 by the grid of a general circulation model (GCM), and may vary considerably within a GCM grid cell 3 especially in convective systems or over mountainous terrain. Most CMIP5 climate model simulations use 4 horizontal resolutions of 100–200 km in the atmosphere, with vertical layers varying between 100 m near the 5 surface to more than 1000 m aloft. Within regions of this size in the real world, there is often enormous 6 subgrid variability in cloud properties, associated with variability in humidity, temperature and vertical 7 motion. 8 9 Because of this, the simulation of clouds in most modern climate models involves many interacting 10 parameterizations that must work together as a system. These include parameterization of turbulence and 11 cumulus convection, cloud fraction at each level, vertical overlap of these quantities at different heights, as 12 well as cloud microphysics and aerosol and chemical transport. Each parameterization makes simplifying 13 mathematical assumptions about the nature of subgrid variability within each grid cell; for pragmatic and 14 historical reasons, these assumptions are frequently not fully consistent across the parameterizations used in 15 one model, and vary significantly from model to model. For example, clouds in a grid column may be 16 assumed to be vertically stacked for the radiation calculation, but not for calculating evaporation of 17 precipitation. In summary, realistic simulation of clouds and their response to climate change forms one of 18 the greatest challenges of climate modelling. 19 20 7.2.3.2 Advances in Microphysical Representation of Liquid Clouds Since AR4 21 22 Most microphysics schemes used in CMIP5-class climate models no longer assume that clouds are uniform 23 within a model cell, but account for anticipated heterogeneity through simplifying assumptions and concise 24 representations of subgrid-scale variability and covariance of relevant variables. Climate modellers have 25 generally decomposed liquid clouds through a variety of attributes: 1) by considering gross categories of 26 drop size (small cloud drops versus larger precipitating raindrops); 2) by classifying whether the drops 27 developed within convective cloud cores or stratiform clouds that flow out of convective cores or form 28 independently of them; 3) by predicting one or two parameters of an assumed drop size distributions; and/or 29 4) by assuming particular forms (e.g., Gaussian, top-hat) for the spatial variability of fields within a model 30 cell or a cloud. 31 32 Most AR4 era climate models used a bulk (single moment) formulation for stratiform clouds, predicting only 33 the time evolution of the average cloud and rain water mass in each gridbox. Two of 23 CMIP3 models 34 (Storelvmo et al., 2006) employed two-moment formulations for cloud droplets with explicit prognostic 35 equations for cloud drop number concentration (CDNC); others diagnosed CDNC from prognosed aerosols 36 to allow for aerosol indirect effects (Storelvmo et al., 2009), using empirical relationships connecting aerosol 37 mass to CDNC (e.g., Boucher and Lohmann, 1995; Menon et al., 2002), or based on proximity to land and 38 altitude. The two moment schemes employed evolution equations for CDNC that activate cloud drops based 39 on a subgrid vertical velocity and the size spectra of hygroscopic aerosols (Abdul-Razzak and Ghan, 2000; 40 Ghan et al., 2011b; Nenes and Seinfeld, 2003). Many AR4 era models were forced to employ an arbitrary 41 lower bound on CDNC to reduce the AIE, which is undesirable (Hoose et al., 2009). 42 43 More models participating in CMIP5 will use two moment schemes for liquid stratiform cloud. with the 44 following advances. Some models include a diagnostic treatment of rain and snow number concentration as 45 well as mixing ratio (Morrison and Gettelman, 2008; Salzmann et al., 2010), allowing the treatment of 46 aerosol-scavenging and inclusion of the radiative effect of snow. Some models include an explicit treatment 47 of subgrid cloud water variability for calculation of the microphysical process rates (Morrison and 48 Gettelman, 2008). Some models no longer have to specify a lower bound on CDNC. Cloud drop activation 49 schemes are becoming more sophisticated as aerosol schemes are becoming more complex, including more 50 realistic accounting for aerosol hygroscopicity and particle size. 51 52 7.2.3.3 Advances in Microphysical Representation in Mixed Phase and Ice Clouds Since AR4 53 54 7.2.3.3.1 Mixed-phase clouds 55 New representations of the Bergeron-Wegener-Findeisen process in mixed-phase clouds (Lohmann and 56 Hoose, 2009; Storelvmo et al., 2008b) compare the rate at which the pre-existing ice crystals deplete the 57
First Order Draft Chapter 7 IPCC WGI Fifth Assessment Report
Do Not Cite, Quote or Distribute 7-12 Total pages: 121
water vapour (Korolev 2007) with the condensation rate for liquid water driven by vertical updraft speed. 1 Climate models are increasingly representing detailed microphysics, including mixed phase processes, inside 2 convective clouds (Fowler and Randall, 2002; Lohmann, 2008; Song and Zhang, 2011). Such processes can 3 influence storm characteristics like strength and electrification; more studies are needed to assess their 4 importance for climate simulations. 5 6 7.2.3.3.2 Ice clouds 7 Although supersaturation with respect to ice is commonly observed in cirrus clouds, only one AR4 GCM 8 (ECHAM) allowed ice supersaturation (Lohmann and Kärcher, 2002). Several global models now predict ice 9 supersaturation (Gettelman et al., 2010; Liu et al., 2007; Salzmann et al., 2010; Tompkins et al., 2007). 10 Tompkins et al. (2007) assume that once an ice cloud forms, the deposition process is sufficiently rapid that 11 supersaturation is removed within a GCM time step. All other global models predict ice supersaturation 12 based on parameterizations of homogeneous and/or heterogeneous freezing rates, which are discussed in 13 Section 7.4.4. 14 15 7.2.3.4 Advances in Parameterization of Moist Turbulence and Cumulus Convection 16 17 Since AR4, parameterizations of cumulus convection and moist turbulence in many numerical weather 18 prediction and climate models have continued to advance, leading to substantial improvement in their 19 simulation of tropical rainfall and boundary-layer cloud and new capabilities for simulating cloud-aerosol 20 interaction. 21 22 New ‘adaptive’ treatments of lateral entrainment into deep cumulus updrafts sensitive to environmental 23 humidity or updraft buoyancy and velocity have improved simulations of the Madden-Julian Oscillation 24 (MJO), tropical convectively-coupled waves, and mean rainfall patterns in the ECMWF operational weather 25 forecast model (Bechtold et al., 2008) and the MIROC4 GCM (Chikira and Sugiyama, 2010). An adaptive 26 detrainment parameterization implemented in the Met Office weather forecast model permits a 27 computationally efficient bulk plume to mimic detrainment from a more realistic ensemble of clouds, 28 improving forecast skill (Derbyshire et al., 2011). Various incremental cumulus parameterization changes 29 have improved other climate models, e.g., modification of the deep convective trigger to account for 30 entrainment effects on updraft buoyancy (Neale et al., 2008), combined with a new parameterization of 31 cumulus momentum fluxes (Richter and Rasch, 2008), improved both the tropical mean state and ENSO 32 variability simulated by the CCSM4 climate model. 33 34 Since AR4, more climate models have adopted cumulus parameterizations that calculate the typical vertical 35 velocity in cumulus updrafts (e.g., Donner et al., 2011; Park and Bretherton, 2009), allowing more realistic 36 representations of cloud microphysics and cloud droplet activation, a key issue for global simulation of 37 aerosol-cloud interaction. 38 39 Several global models have adopted new approaches that more closely couple the parameterization of 40 shallow cumulus convection and moist boundary layer turbulence. The eddy-diffusion mass flux (EDMF) 41 scheme of Siebesma et al. (2007), adopted by ECMWF, combines an eddy-diffusion approach for small-42 scale turbulence with a mass-flux representation for strong non-cloudy and cloudy turbulent updrafts, which 43 can incorporate a cumulus parameterization (Neggers, 2009; Neggers et al., 2009). In the CAM5 GCM, the 44 shallow cumulus scheme of Park and Bretherton (2009) coupled to the turbulence parameterization of 45 Bretherton and Park (2009) determines the cumulus-base mass flux from boundary layer updraft properties 46 rather than ad-hoc closure assumptions typical of AR4 climate models. Using approaches such as these, 47 many climate models simulate boundary-layer cloud radiative properties and vertical structure more 48 accurately than at the time of AR4 (e.g., Köhler et al., 2011; Park and Bretherton, 2009). 49 50 7.2.3.5 High-Resolution Global Modelling 51 52 Since AR4, increasing computer power has made it possible to simulate the global circulation of the 53 atmosphere and associated clouds with greater resolution. There have been three types of developments. 54 First, models have been run with resolution that is higher than in the past, but not so high that cumulus 55 clouds can be resolved. Second, models have been run with resolution high enough to resolve (or “permit”) 56 large individual cumulus clouds over the entire globe. In a third approach, the parameterizations of global 57
First Order Draft Chapter 7 IPCC WGI Fifth Assessment Report
Do Not Cite, Quote or Distribute 7-13 Total pages: 121
models have been replaced by embedded cloud-resolving models. The first approach is a continuation of the 1 broad evolution of climate models toward finer simulated scales, so it is assessed in Chapter 9. The other 2 approaches discussed below, are computationally intensive and have only been applied to weather and short 3 climate simulations. Because they overcome many of the parameterization challenges associated with clouds, 4 they make an interesting complement to conventional global atmospheric models. 5 6 7.2.3.5.1 Global cloud-resolving models 7 A Japanese global cloud-resolving model (GCRM) called NICAM (Miura et al., 2005; Tomita et al., 2005) 8 has been run with a grid spacing of as little as 3.5 km. At present it can only be used for relatively short 9 simulations of a few simulated weeks or months on the fastest supercomputers. Even with a 3.5 km grid 10 spacing, NICAM can only resolve large cumulus clouds, not the eddies within boundary-layer clouds. 11 Parameterizations of cloud microphysics, radiation, and turbulence are still needed, but these benefit from 12 the fine grid spacing. 13 14 NICAM simulates many features of deep convection that are very challenging for conventional GCMs. Sato 15 et al. (2009) show that NICAM can simulate the diurnal cycles of precipitation associated with land-sea 16 breezes and thermally induced topographic circulations; results improve for finer grid spacing. Oouchi et al. 17 (2009) shows NICAM accurately simulates most features of the Asian summer monsoon. Inoue et al. (2010) 18 showed the cloudiness simulated by NICAM is in good agreement with observations from CloudSat and 19 CALIPSO, but the simulation of cloud ice is not satisfactory and requires an improved parameterization of 20 ice microphysics. Iga et al. (2010) found that changes in the turbulence and cloud microphysics 21 parameterizations of NICAM can strongly affect the upper-level cloudiness, total precipitation, and Hadley 22 circulation. In particular, the Hadley circulation weakens when the simulated high cloud amount increases, 23 due to reduced tropospheric radiative cooling. Even with such fine grid resolution, microphysical 24 parameterization uncertainties can significantly affect simulated climate. 25 26 Within the next decade, it may become computationally feasible to use GCRMs for century-long climate 27 change simulations. Meanwhile, GCRMs can be used in shorter numerical experiments that shed light on 28 results from lower-resolution models. 29 30 7.2.3.5.2 Models that use embedded cloud-resolving models as “super-parameterizations” 31 Grabowski and Smolarkiewicz (1999) and Grabowski (2001) pioneered the use of CRMs as ‘super-32 parameterizations’, i.e., substitutes for the parameterizations in conventional GCMs. Khairoutdinov and 33 Randall (2001) tested the idea in a version of the Community Atmosphere Model (CAM). Tao et al. (2009) 34 developed a similar model using a different global model and different CRM. As with NICAM, cloud 35 microphysics, radiation, and turbulence must still be parameterized; the computational cost is intermediate 36 between GCRMs and conventional GCMs 37 38 The “super-parameterized” CAM gives realistic simulations of the diurnal cycle of precipitation 39 (Khairoutdinov et al., 2005; Pritchard and Somerville, 2010) and the MJO (Benedict and Randall, 2009). Its 40 climatological biases in precipitation and mean circulation are comparable to other climate models, including 41 excessive rainfall in boreal summer over the western Pacific Ocean and southern Asia (Khairoutdinov et al., 42 2005) and under-prediction of marine stratocumulus clouds (Blossey et al., 2009; Wyant et al., 2009). Stan et 43 al. (2010) coupled the super-parameterized atmosphere model with a global ocean model for 20 simulated 44 years, giving an improved simulation of the Asian summer monsoon (DeMott et al., 2011) and mean rainfall 45 biases compared to the uncoupled model version, and an encouraging simulation of El Niño - Southern 46 Oscillation. 47 48 Super-parameterized global atmospheric models can be used for climate simulations spanning decades or 49 centuries with present-day computers. Like GCRMs, these models give improved simulations of climate 50 variability on a range of time scales, but will benefit from improved parameterizations of turbulence and 51 microphysics. 52 53 7.2.4 Cloud and Water-Vapour Feedback 54 55 Climate feedbacks are a central concern for projecting the magnitude of climate change, because they 56 determine the sensitivity of climate to external forcing agents. The overall climate sensitivity of current 57
First Order Draft Chapter 7 IPCC WGI Fifth Assessment Report
Do Not Cite, Quote or Distribute 7-14 Total pages: 121
climate models is assessed in Chapter 9, but the individual contributing feedbacks are assessed in the 1 relevant process-oriented chapters. Water vapour, lapse rate and cloud feedbacks are all assessed in this 2 chapter because they involve moist atmospheric processes closely linked to clouds. In combination they 3 produce most of the simulated climate feedback and also most of its intermodel spread. 4 5 Feedbacks are often expressed as a TOA net downward radiative flux change per degree of global surface 6 temperature increase; in this section they are converted to dimensionless feedback factors by further 7 multiplying by 0.31 K W–1 m2 (Roe and Baker, 2007). Such feedback factors from different processes add to 8 give the total feedback factor f. The equilibrium climate sensitivity is inversely proportional to 1-f, so a total 9 feedback factor of f = 0.6 (typical of GCMs) would amplify the (blackbody) climate sensitivity by a factor of 10 2.5. Regional feedbacks are sometimes estimated based on surface, rather than TOA, energy fluxes; 11 however, one must then also consider turbulent latent and sensible heat fluxes, complicating the analysis and 12 making it a less useful predictor of the overall coupled system response, so we do not adopt this approach. 13 14 7.2.4.1 Cloud Altitude Feedback Mechanisms Involving High-Level Clouds 15 16 High clouds exert little net TOA radiative effect in the current climate due to near-compensation between 17 their longwave and shortwave cloud radiative effects (Kiehl, 1994). Nonetheless, systematic changes in their 18 properties could produce a significant radiative feedback by altering this balance. 19 20 New studies confirm that in typical global warming scenarios, longwave cloud feedback is consistently 21 positive across CMIP3 climate models, with an interquartile range (IQR) of 0.06–0.12 (i.e., 0.2–0.4 W m–2 22 K–1) (Soden and Vecchi, 2011; Zelinka et al., 2011a), and is primarily due to high clouds (Zelinka et al., 23 2011a). The dominant driver of longwave cloud feedback appears to be a robust consequence of global 24 warming - an increase in the heights of the tropopause and the main level at which the deepest convective 25 clouds stop rising and cloudy air flows outward, tentatively attributed in AR4 to the so-called fixed anvil-26 temperature (or FAT) mechanism (Hartmann and Larson, 2002). According to this mechanism, the outflow 27 level from deep convective systems is determined ultimately by the highest point at which water vapour 28 amounts are sufficient to emit significant infrared radiation; this point tends to occur at the same temperature 29 regardless of climate, provided that relative humidity does not change too much, and therefore occurs at a 30 higher altitude in a warmer climate. A positive cloud altitude feedback results because an otherwise identical 31 cloud located higher in the atmosphere exerts a stronger greenhouse effect. New research has confirmed that 32 the hypothesised behaviour is simulated in more realistic models (Kuang and Hartmann, 2007; Kubar et al., 33 2007), and explains the systematic tendency toward positive cloud feedback in GCMs (Zelinka and 34 Hartmann, 2010). Zelinka et al. (2011b) find that in the CMIP3 models, the IQR of cloud altitude feedback 35 factor is 0.08–0.15, which is even stronger than the overall longwave cloud feedback. 36 37 The observational record allows us to verify various elements of the expected FAT response to global 38 warming. The global tropopause is rising as expected (Chapter 2). Cloud height is correlated to regional and 39 seasonal changes in near-tropopause temperature structure (Eitzen et al., 2009), although the response is 40 affected by changes in stratospheric circulation (Chae and Sherwood, 2010; Eitzen et al., 2009). 41 42 7.2.4.2 Feedback Mechanisms Involving the Amount of Middle and High Cloud 43 44 Nearly all GCMs also simulate an overall reduction in middle and high cloud amount in warmer climates, 45 especially in the subtropics (Trenberth and Fasullo 2009; Zelinka and Hartmann 2010). This reduction is 46 geographically correlated with simulated subtropical drying (Meehl et al., 2007), suggesting that it is tied to 47 large-scale circulation changes (Sherwood et al., 2010; Wetherald and Manabe, 1980). The upward mass flux 48 in deep clouds also decreases in a warmer climate (Section 7.2.5.1) which might affect cloud cover in ways 49 difficult to capture in current models. In global average, both middle and high-level simulated cloudiness 50 reductions cause a positive shortwave feedback, but the high cloud reductions also compensate nearly half of 51 the longwave cloud altitude feedback. This may explain why researchers did not identify the important role 52 of cloud altitude feedbacks sooner. From Figure 8 of Zelinka and Hartmann (2011b) the IQR of the CMIP3 53 multimodel mean net cloud feedback factor from middle and high clouds is estimated to be 0.08–0.16. This 54 is similar to the cloud altitude feedback alone, so we conclude that the additional net feedback due to 55 mid/high cloud amount reductions is small. 56 57
First Order Draft Chapter 7 IPCC WGI Fifth Assessment Report
Do Not Cite, Quote or Distribute 7-15 Total pages: 121
Bender et al. (2011) find decreasing trends in satellite-derived subtropical cloud cover, but also note large 1 uncertainties involved in correcting for satellite radiometer and orbital drift as well as cross-calibration 2 between satellites (see Chapter 2). Tselioudis and Rossow (2006) predict reduced storm-track cloud cover in 3 warmer climates based on observed present-day relationships with meteorological variables combined with 4 model-simulated changes to those driving variables. In agreement with the above analysis, they found that 5 this reduction contributed little to net cloud feedback, due to compensating longwave and shortwave 6 contributions. 7 8 Thin cirrus clouds exert a net warming effect on climate, and cover a significant area. These clouds could 9 therefore exert an important feedback on climate if their area changed relatively moderately with global 10 temperature (e.g., Rondanelli and Lindzen, 2010). We find no compelling evidence from observations, 11 process models, or GCMs suggesting such a feedback is important, and the CMIP3 multimodel mean change 12 of thin high cloud fraction is smaller than for other cloud types (Zelinka et al., 2011a). A caveat is that these 13 clouds are challenging to accurately simulate in climate models (see Chapter 9). 14 15 A positive contribution to net cloud feedback also comes from the anticipated poleward shift of storm tracks 16 in a warmer climate. Even if storm track clouds remained unaltered, this shifts clouds to latitudes of weaker 17 sunlight, decreasing the planetary albedo. Such a shift occurs in most models (Yin, 2005) and has appeared 18 in recent cloud and other data (see Chapter 2); similar shifts are also seen in indicators of the edge of the 19 tropics (Scheff and Frierson, 2011). The impact of the observed shift on clouds, particularly the reduction in 20 subtropical cloud cover, appears to be significant and would imply a strong positive feedback if it were due 21 to global warming (Bender et al., 2011). Recent studies call into question how much of the observed shifts 22 are temperature-driven vs. ozone-driven [Chapter 10.3.x], so the true magnitude of this feedback 23 contribution remains highly uncertain. As most GCMs produce too little storm-track cloud in the southern 24 hemisphere, it has been suggested that they underestimate this feedback (Trenberth and Fasullo, 2010) even 25 if the model-predicted shifts are correct. 26 27 7.2.4.3 Feedback Mechanisms Involving Low Clouds 28 29 Low clouds exert a strong net cooling effect on the Earth, such that if their coverage or water content were 30 climate-sensitive a feedback would result. Feedback contributions from low clouds continue to differ 31 significantly among models, and to cause most of the spread in global climate sensitivity among GCMs for 32 both transient and equilibrium simulations (e.g., Dufresne and Bony, 2008). Zelinka et al. (2011a) show that 33 the CMIP3 IQR for low cloud feedback factor is 0.09–0.15; all analysed models had positive low cloud 34 feedback, but of widely differing magnitudes. The feedback derives from slight decreases in low cloud 35 cover, which in multimodel mean occurs throughout low and mid-latitudes (Zelinka et al., 2011b), though 36 the geographical pattern varies widely between models (Webb et al., 2012). 37 38 No robust feedback mechanisms involving tropical and mid-latitude low clouds have yet been established, 39 though many possible mechanisms for both positive and negative feedbacks have been proposed. It has long 40 been suggested that cloud water content could increase in a warmer climate simply due to the higher water 41 vapour mixing ratio (WVMR) in sub-cloud air or more condensation per unit height in an adiabatic cloudy 42 updrafts, but this argument ignores the physics of crucial cloud-regulating processes like precipitation 43 formation and turbulence. Observational evidence discounting the suggested effects was reported in AR4. 44 45 As noted in Section 7.2.1.3.2, at each latitude, low cloud cover tends to favor the coldest oceans, which can 46 naively be interpreted to imply a positive feedback. This relationship is thought to be regulated by lower-47 tropospheric stability, but different measures of stability that are similarly skilful in the current climate imply 48 significantly different cloud changes in a warmer climate (Section 7.2.1.3). Likewise, interannual variations 49 of ocean surface temperature in marine stratocumulus regions tend to anti-correlate with changes in cloud 50 cover and water content, again suggesting a negative feedback if taken at face value (Eitzen et al., 2011). 51 However, since these regional variations are accompanied by local atmospheric stability changes that would 52 differ from those accompanying a global warming, this interannual relationship is unlikely to indicate the 53 global feedback (see Section 7.2.4.3.4). 54 55 Studies since the AR4 have yielded some further insight into the diversity of low-cloud feedbacks in GCMs. 56 Several climate models that have been run with land removed (a so called aquaplanet) show cloud feedback 57
First Order Draft Chapter 7 IPCC WGI Fifth Assessment Report
Do Not Cite, Quote or Distribute 7-16 Total pages: 121
comparable to their usual configuration, suggesting that neither land-surface feedbacks nor land-induced 1 heterogeneity is crucial in determining the low-cloud response to warming in the full GCMs (Medeiros et al., 2 2008). Low-cloud feedback in GCMs arises from a mix of cumulus and stratocumulus cloud feedbacks 3 (Williams and Tselioudis, 2007; Williams and Webb, 2009; Xu et al., 2010). Bony and Dufresne (2005) 4 found that that the intermodel spread among tropical feedbacks derives mainly from the regimes of moderate 5 subsidence that support both these cloud types. Webb et al. (2012) found that the feedback factor and its 6 spread is largest in cool-ocean (stratocumulus) regimes and shallow cumulus regimes covering a larger 7 fraction of the subtropics. 8 9 Other post-AR4 studies have probed how different parameterizations affect simulated low-cloud feedbacks. 10 For example, an increased positive cloud feedback in two successive versions of the NCAR GCM is due 11 mainly to changes in the representation of shallow cumulus convection, but with significant compensation 12 from the boundary-layer parameterisation, and the biggest simulated cloudiness reductions occur in the 13 Southern Ocean stratocumulus regime due to interactions between cumulus and stratocumulus (Gettelman et 14 al., 2011b). A single-column diagnostic study of Zhang and Bretherton (2008) found that the interaction 15 between boundary layer, shallow and deep convective parameterisations in transporting moisture upward to 16 form clouds was crucial in determining the cloud albedo feedback, even in a stratocumulus regime. 17 18 Cloud feedbacks have been examined in first-generation global cloud-resolving models and 19 “superparameterized” GCMs, (Section 7.2.3.5), which avoid cumulus parameterization. These models have 20 shown increases in low-cloud cover in warmer climates (Wyant et al., 2009; Wyant et al., 2006), predicting 21 climate sensitivities at or below the low end from GCMs. GCMs with superparameterisations do not, 22 however, simulate low clouds any better than (or even as well as) traditional GCMs, apparently due to the 23 very fine grid (~100 m or better) required for proper, explicit simulation of the cloudy boundary layer 24 (Section 7.2.2.1, Blossey et al., 2009). Limited-area high-resolutions models have also been used to estimate 25 cloud feedbacks (Lauer et al., 2010; Xu et al., 2010), and have yielded a range of estimates even broader than 26 those of global models. These models and methodologies are less well tested than traditional GCMs, so we 27 assign relatively little confidence to their feedback behaviour at this time. 28 29 7.2.4.4 Feedbacks Involving Changes in Cloud Optical Depth 30 31 Another possible cloud feedback mechanism involves changes in cloud phase. At mixed-phase temperatures 32 of –40 to 0°C, cloud ice particles that contribute most to light scattering are typically several-fold larger than 33 cloud water drops (e.g., Mitchell et al., 2010), so a given mass of cloud ice reflects less sunlight than the 34 same mass of cloud water droplets in today’s atmosphere. As climate warms, the shift from ice to liquid 35 clouds would raise albedos if cloud water mass did not change. The resulting negative cloud feedback 36 appears in GCMs (Senior and Mitchell, 1993), with a magnitude that correlates with the simulated amount of 37 cloud ice in mixed phase clouds (Tsushima et al., 2006). It is unlikely however that cloud water content 38 would remain fixed as clouds changed phase, and the key physics is not represented in climate models, so 39 this feedback mechanism is highly uncertain. 40 41 Zelinka et al. (2011b) isolated the component of simulated cloud feedback due to changes in cloud optical 42 depth in a set of CMIP3 GCMs. The global-mean net feedback scattered around zero, but, there was a 43 tendency toward slightly reduced optical depths at low and middle latitudes, and increases at latitudes 44 poleward of 50° yielding a negative local feedback that they attributed partly to phase changes and partly to 45 the greater cloud water amounts expected from increased poleward moisture transport (Vavrus et al., 2009). 46 47 7.2.4.5 Feedback from Arctic Cloud Interactions with Sea Ice 48 49 Arctic clouds, despite their low altitude, have a net warming effect at the surface in the present climate 50 because their downward emission of infrared radiation over the year outweighs their reflection of sunlight 51 during the short summer season. However, they also cool the atmosphere, so their effect on the energy 52 balance of the whole system is ambiguous and depends on the details of the vertical cloud distribution and 53 the impact of cloud radiative interactions on ice cover. 54 55 Visual cloud reports (Eastman and Warren, 2010) and lidar observations available since AR4 (Kay and 56 Gettelman, 2009; Palm et al., 2010) now agree that low cloud cover over Arctic oceans is inversely 57
First Order Draft Chapter 7 IPCC WGI Fifth Assessment Report
Do Not Cite, Quote or Distribute 7-17 Total pages: 121
correlated to sea ice amount, with open water producing more cloud. The observed effect is weak in boreal 1 summer, when the melting sea-ice is at a similar temperature to open water and stable boundary layers with 2 extensive low cloud are common over both surfaces, and strongest in boreal autumn when cold air flowing 3 over regions of open water stimulates cloud formation by boundary-layer convection (Kay and Gettelman, 4 2009; Vavrus et al., 2011). Kay et al. (2011) show that a GCM can represent this seasonal sensitivity of low 5 cloud to open water, but only with an appropriate boundary-layer cloud parameterization. Vavrus et al. 6 (2009) show that in a global warming scenario, GCMs simulate more Arctic low-level cloud in all seasons, 7 but especially during autumn and winter when open water and very thin sea ice increase considerably, 8 decreasing low-level stability and increasing upward moisture transport from the surface to levels at which it 9 forms clouds. 10 11 A negative Arctic cloud feedback was suggested by Liu et al. (2008) on the basis that observed surface 12 warming in recent decades was greater under clear-sky than under cloudy conditions, but this argument was 13 not tested in a climate model and does not control for the large correlated effects of weather variability on 14 both clouds and surface temperature. Gagen et al. (2011) present tree-ring evidence that summertime Arctic 15 cloud cover was negatively correlated with Arctic temperatures over the last millennium, which is consistent 16 with the conclusions of the above studies assuming there was less ice during warmer periods. While Gagen 17 et al. (2011) presented this as evidence of negative cloud feedback, they ignored the year-round greenhouse 18 effect of clouds, which could change the imputed feedback to a positive one (Palm et al., 2010). Note that 19 there are pitfalls to using natural climate variations to infer cloud feedbacks, described in Section 7.2.4.3.7, 20 that apply here as well. 21 22 7.2.4.6 Fast Adjustment of Clouds and Precipitation to a CO2 Change 23 24 Climate feedbacks are usually estimated by comparing steady-state simulations with control and doubled 25 CO2, and analysing the contribution of different processes to the simulated changes in radiation balance, 26 normalized by the change in global-mean surface air temperature (e.g., Soden and Held, 2006). 27 28 Gregory and Webb (2008) partitioned the transient response of the radiation balance of GCMs to an 29 instantaneous doubling of CO2 into a ‘fast’ (sub-seasonal) adjustment in which the land surface, atmospheric 30 circulations and clouds respond to the radiative effect of the CO2 increase, and an ‘SST-mediated’ response 31 that develops more slowly as the oceans warm. They found that in some climate models, fast adjustment of 32 clouds can have comparable top-of-atmosphere radiative effects to the ensuing SST-mediated cloud changes. 33 However, Andrews and Forster (2008) found that this behavior was exceptional and that on average, fast 34 cloud adjustments in a suite of climate models causes less than 20% of their equilibrium radiative feedback; 35 low cloud adjustments have the biggest global net radiative impact (Colman and McAvaney, 2011). Fast 36 adjustment may cause clouds to respond slightly differently during a transient climate change (in which SST 37 changes have not caught up to CO2 changes) than after equilibrium is reached and SST changes have been 38 fully expressed. Studies of fast adjustment of climate models to a step CO2 increase have also shown reduced 39 global-mean precipitation (Cao et al., 2011) and cloud cover (Andrews and Forster, 2008), a shift of tropical 40 clouds and precipitation from ocean to land (Lambert et al., 2011; Wyant et al., 2011), and shallowing of 41 marine stratocumulus cloud (Caldwell and Bretherton, 2009; Wyant et al., 2011). The ensuing response to 42 warming SST reverses many of these trends, increasing global-mean precipitation and shifting precipitation 43 and high clouds back over the tropical oceans (Cao et al., 2011). 44 45 7.2.4.7 Observational Constraints on Global Cloud Feedback 46 47 A number of studies since AR4 have attempted to constrain cloud feedback (or total climate sensitivity) from 48 observations; here we discuss those using modern cloud, radiation or other measurements. Section [12.5] 49 discusses those based on past temperature data and forcing proxies. 50 51 One approach is to seek observable aspects of present-day cloud behaviour that reveal cloud feedback. In at 52 least two climate models, large sets of runs with nonstandard parameter settings produce feedback strengths 53 that correlate with the amount or water content of cloud simulated for the present day (Williams and Webb, 54 2009), but in other models this does not happen (Yokohata et al., 2010), and the resulting relationships do 55 not hold across multiple models e.g., CMIP3 (Gettelman et al., 2011a). Among the AR4 models, net cloud 56 feedback is strongly correlated with mid-latitude relative humidity (Volodin, 2008) and with characteristics 57
First Order Draft Chapter 7 IPCC WGI Fifth Assessment Report
Do Not Cite, Quote or Distribute 7-18 Total pages: 121
of the southern-hemisphere storm track (Trenberth and Fasullo, 2010); if valid either regression relation 1 would imply a relatively strong positive cloud feedback in reality, but no mechanism has been proposed to 2 explain or validate these empirical relationships. Likewise, Clement et al. (2009) found realistic decadal 3 variations of low cloud over the North Pacific in only one model (HadCM3) and argued that the relatively 4 strong cloud feedback in this model should therefore be regarded as more likely, but provided no evidence 5 for such a link. Chang and Coakley (2007) examined midlatitude maritime clouds and found cloud thinning 6 with increasing temperature, consistent with a positive feedback, while Gordon and Norris (2010) found the 7 opposite result in following a methodology that tried to isolate thermal and advective effects. In summary, 8 there is no evidence of a robust link between any of the noted observables and the global feedback, though 9 some apparent connexions are tantalising and are being further studied. 10 11 Several studies have attempted to derive long-term climate sensitivity from interannual relationships between 12 global-mean observations of top-of-atmosphere radiation and surface temperature. One problem with this is 13 the different spatial character of interannual and long-term warmings; another is that the methodology can be 14 confounded by cloud variations not caused by those of surface temperature (Spencer and Braswell, 2008). A 15 range of climate sensitivities has been inferred based on such analyses (Forster and Gregory 2006; Lindzen 16 and Choi, 2011). Crucially, however, among different GCMs there is no correlation between the interannual 17 and long-term cloud-temperature relationships (Dessler, 2010), contradicting the basic assumption of these 18 methods. On the other hand the GCMs, on average, do predict a cloud radiative response to these high-19 frequency global temperature changes that is consistent with the global feedback response and with 20 observations, increasing the credibility of their predictions at longer timescales (Dessler, 2010). More 21 recently there is interest in relating the time-lagged correlations of cloud and temperature to feedback 22 processes (Spencer and Braswell, 2010) but again these relationships appear to reveal only a model’s ability 23 to simulate ENSO or other modes of interannual variability properly, which cannot be translated directly into 24 cloud feedback on long-term global warming (Dessler, 2011). 25 26 While a number of studies have proposed methods to infer the long-term cloud feedback from observed 27 variability, for a method to be accepted it should have a sound physical basis and be shown to work 28 consistently when applied to climate models. No method yet proposed passes both tests. Moreover, some 29 model studies show that the response of global cloud radiative effect to a global warming is sensitive to 30 relatively subtle details in the geographic warming pattern, such as the slight hemispheric asymmetry due to 31 the lag of southern ocean warming relative to northern latitudes (Senior and Mitchell, 2000; Yokohata et al., 32 2008). Cloud responses to specified uniform ocean warming without CO2 increases are not the same as those 33 to CO2-induced global warming simulated with more realistic oceans (Ringer et al., 2006), partly because of 34 fast adjustment (Section 7.2.4.3.6) and because low clouds also feed back tightly to the underlying surface 35 (Caldwell and Bretherton, 2009). Simulated cloud feedbacks also differ significantly between colder and 36 warmer climates in some models (Crucifix, 2006; Yoshimori et al., 2009). These sensitivities highlight the 37 challenges facing any attempt to infer long-term cloud feedbacks from simple data analyses. 38 39 [INSERT FIGURE 7.5 HERE] 40 Figure 7.5: CFMIP figure on cloud feedbacks in CMIP5 models. [PLACEHOLDER FOR SECOND ORDER DRAFT: 41 CMIP3 version used as placeholder.] 42 43 7.2.4.8 Feedback Synthesis 44 45 Together, water vapour-lapse rate and cloud feedback are the principal determinants of climate sensitivity. 46 The combined global water vapour-lapse rate feedback simulated by all GCMs is strongly positive (feedback 47 factor IQR 0.28–0.33), similar to AR4, and has the magnitude expected from simple physical arguments that 48 on global scales, absolute humidity changes much more than relative humidity in a perturbed climate. 49 50 Cloud feedbacks on CO2-induced climate change are less certain, but the combined evidence suggests a 51 substantial positive net feedback from clouds. Two estimates of the IQR of overall cloud feedback factor, 52 based on two slightly different groups of CMIP3 GCM simulations are 0.11–0.33 (Table 1 of Soden and 53 Held, 2006), and 0.17–0.28 (Figure 8 of Zelinka et al., 2011a). Differences between models have not reduced 54 since AR4 [TBC] and dominate the spread in model climate sensitivities. However, new approaches to 55 diagnosing cloud feedback in GCMs have clarified robust cloud responses, while continuing to implicate low 56 cloud cover as the most important source of intermodel spread in simulated cloud feedbacks. Some new 57
First Order Draft Chapter 7 IPCC WGI Fifth Assessment Report
Do Not Cite, Quote or Distribute 7-19 Total pages: 121
approaches to observation and mechanistic understanding of cloud feedback have been taken, using a 1 hierarchy of models and observations on local and global scales. 2 3 Several physical processes contribute to a positive net cloud feedback, as summarized in Figure 7.6. First, 4 high clouds to rise in altitude and thereby exert a stronger greenhouse effect in warmer climates. This 5 altitude feedback mechanism is well understood, has theoretical and observational support, occurs 6 consistently in GCMs and other models, and explains about half of the multimodel-mean positive cloud 7 feedback. Second, middle and high level cloud cover tends to decrease in warmer climates even within the 8 storm tracks and ITCZ, consistent with the reduction of upward, cloudy air fluxes required to balance the 9 hydrological cycle in an atmosphere with more water vapour. This decreases the albedo more than the 10 greenhouse effect, adding positive feedback. Third, observations and most models suggest storm tracks shift 11 poleward in a warmer climate, drying the subtropics and moistening the high latitudes, which causes further 12 positive feedback via a net shift of cloud cover to latitudes that receive less sunshine. Most GCMs also 13 predict low cloud amount decreases especially in the subtropics, another source of positive feedback, though 14 there is wide spread in this feedback and it lacks a well-accepted theoretical basis. Over high latitudes, 15 models suggest warming-induced transitions from ice to water clouds may cause clouds to become more 16 reflective, but this optical depth feedback operates over too small a region to be globally significant. While 17 other feedbacks remain possible and uncertainties remain –particularly for low cloud amount– there is no 18 consistent observational evidence, consensus among models, nor robust physical argument that would favour 19 these having a negative feedback contribution over a positive one. 20 21 Since all established globally-significant feedback mechanisms are positive, a positive overall cloud 22 feedback is more likely than a negative one. How much more likely depends on the likely strength of any 23 other mechanisms that may exist. Our chief guidance on this question is from GCMs. As of yet, the wide 24 variety of formulations and resulting behaviour in these models has not produced a single example [TBC] 25 where other mechanisms have been strong enough to outweigh unequivocally the known sources of positive 26 feedback. In the absence of supporting evidence, we judge that cloud feedback outside the range of any 27 current CMIP3 GCM is unlikely (less than 33% probability), and that such cloud feedback is no more likely 28 to lie below the CMIP3 range than above it. The lowest cloud feedback for any CMIP3 model was slightly 29 positive (Soden and Held, 2006), so this reasoning implies that the net cloud feedback is likely (83% chance) 30 positive. Note that this conclusion is independent of constraints on climate sensitivity from observed trends 31 or palaeoclimate information as discussed in Section 12.4. 32 33 [INSERT FIGURE 7.6 HERE] 34 Figure 7.6: Robust cloud responses to greenhouse warming simulated by the CMIP3 multimodel ensemble. Panel (a) is 35 a schematic latitude-altitude section showing typical cloud types in a pre-industrial climate. Grey (white) indicates 36 clouds composed predominantly of liquid water (ice). Raindrops and snowflakes indicate the typical precipitation type. 37 Dotted line indicates the typical freezing level, and purple dashed line indicates the tropopause. Panel (b) shows the 38 same cross section for a warmer climate, with arrows denoting the movement of different boundaries. Tropical deep 39 convection regions narrow and intensify, the subsidence regions of the subtropics widen poleward, with most GCMs 40 projecting low cloud decreases in this area, and storm track cloud and precipitation also shift poleward. Cirrus cloud 41 tops rise in lockstep with the tropopause, helping induce positive longwave cloud feedbacks. The rising freezing level 42 causes more cloud to become liquid, contributing to increased optical thickness of high latitude clouds in the CMIP3 43 multimodel mean. [PLACHOLDER FOR SECOND ORDER DRAFT: CMIP5] 44 45 7.2.5 Basis of Precipitation Changes in Cloud Physical Processes 46 47 This section reviews fundamental process-level knowledge relevant to changes of precipitation 48 characteristics in warmer climates and their relation to clouds. Observed trends in mean and extreme 49 precipitation are discussed in Chapters 2 and 10; changes in hurricanes and other dynamical phenomena, and 50 precipitation projections for specific regions, are discussed in Chapters 11, 12 and 14. 51 52 7.2.5.1 Coupling of Large-Scale Trends in Clouds and the Hydrological Cycle 53 54 In a perturbed climate, regional changes in cloud cover and type will inevitably accompany regional changes 55 in the hydrological cycle. The CMIP3 coupled climate models as a group predict that in 21st century global 56 warming scenarios, the ITCZ will narrow and intensify, the subtropics will dry, and the storm tracks will 57 move poleward (Held and Soden, 2006; Meehl et al., 2007); helping induce the cloud responses discussed in 58
First Order Draft Chapter 7 IPCC WGI Fifth Assessment Report
Do Not Cite, Quote or Distribute 7-20 Total pages: 121
Section 7.2.4 and shown in Figure 7.6. The strong geographical relation between projected precipitation and 1 cloud changes can be seen in CMIP multimodel mean results (IPCC 2007) [PLACEHOLDER FOR 2 SECOND ORDER DRAFT: CMIP5 updates]. 3 4 Within the tropics, individual climate models simulate regional changes in the zonally asymmetric part of 5 mean rainfall patterns and circulation as the climate warms. The detailed geographical pattern of these 6 changes is model-dependent (Bony et al., 2004; Neelin et al., 2006), and they lead to annual-mean deep 7 convective cloud changes in each model that are quite similar to the corresponding changes in mid-8 tropospheric vertical motion (Bony et al., 2004), such that up to 70% of the longwave and shortwave cloud 9 radiative forcing changes at a typical location over the tropical oceans can be ascribed to changes in the 10 vertical motion at that location (Wyant et al., 2006). This point motivates such analysis techniques as 11 vertical-velocity binning (Bony et al., 2004) for separating local dynamically driven cloud changes from the 12 residual ‘thermodynamic’ cloud changes. Over the scale of the tropics or the entire globe, regions of 13 enhanced mean ascent balance those of more mean descent, so these dynamical effects on cloud response 14 largely cancel while the thermodynamic cloud changes need not (Bony et al., 2004). 15 16 7.2.5.2 Changes in Precipitation Extremes 17 18 Studies since AR4 have focused new attention on the climate-dependence of rainfall extremes down to 19 hourly time scales. The expectation has been that extreme precipitation is limited by the precipitable water 20 content of the atmosphere in the storm environment, which increases at roughly 7% per °C of warming 21
(“Clausius-Clapeyron” or CC scaling) if relative humidity is constant. However, not only can relative 22 humidity vary significantly, but intensified latent heating could feed back on cloud-scale dynamics so as to 23 alter the efficiency with which precipitable water is condensed (O'Gorman and Schneider, 2009); such 24 changes are sensitive to factors other than surface temperature (Berg et al., 2009). 25 26 Lenderink and van Meijgaard (2008, 2010) report that extremes of daily rain accumulation at several sites in 27 Europe show approximate CC scaling with respect to weather variations (not temperature trends), but 28 summertime extremes at the hourly time scale showed a scaling twice this strong, probably due to stronger 29 convective storms on hotter days. Lenderink and van Meijgaard (2010) link this to atmospheric humidity, 30 finding an even stronger supersensitivity of 17% per °C of dewpoint. These results were roughly reproduced 31
by regional model simulations. Similar supersensitivities appear in maritime tropical rainfall rates (Allan and 32 Soden, 2008; Allan et al., 2010). However, they do not appear at most sites in the U.S. (Shaw et al., 2011) or 33 Australia (Jones et al., 2010b), where hourly rain scaling is more erratic but close to CC on average. In some 34 datasets, particularly the Australian data, scaling turns negative at the highest temperatures which are 35 associated with dry conditions. 36 37 The interpretation of these results is not straightforward, especially since weather relationships cannot be 38 assumed to apply directly to climate changes. Berg et al. (2009) point out that the temperature scaling 39 inferred from the European data can weaken significantly if one controls for other factors such as storm type. 40 Allan et al. (2010) note that modelled and observed trends in maritime convective extremes since the 1980's 41 are both close to CC, but that weather-related fluctuations show scaling several times stronger; this reflects 42 the relatively strong sensitivity of tropical convection to local maxima of temperature as opposed to overall 43 means (Johnson and Xie, 2010). Idealised calculations using regional (Muller et al., 2011) or cloud-resolving 44 (Romps, 2011) models show extremes scaling with or somewhat below CC in idealised global warming 45 scenarios, possibly because humidity increases more slowly near the surface than aloft. 46 47 Regional models are inconsistent in predicting how rainfall extremes will change with global warming, 48 ranging from CC scaling to nearly double this; predicted changes to extremes are also regionally diverse, 49 exceeding CC by factors of several in regions that receive more rain but decreasing in those receiving less 50 (Lenderink and van Meijgaard, 2010). This makes generalised statements difficult. However, all results point 51 to greater rainfall extremes in warmer climates except in places of significant rainfall decline. The best guess 52 as to the magnitude of the increases for typical conditions (e.g., where rain climatology matches the global 53 mean) is probably close to 7% per °C, but this remains uncertain especially for extremes on sub-daily time 54
scales. 55 56
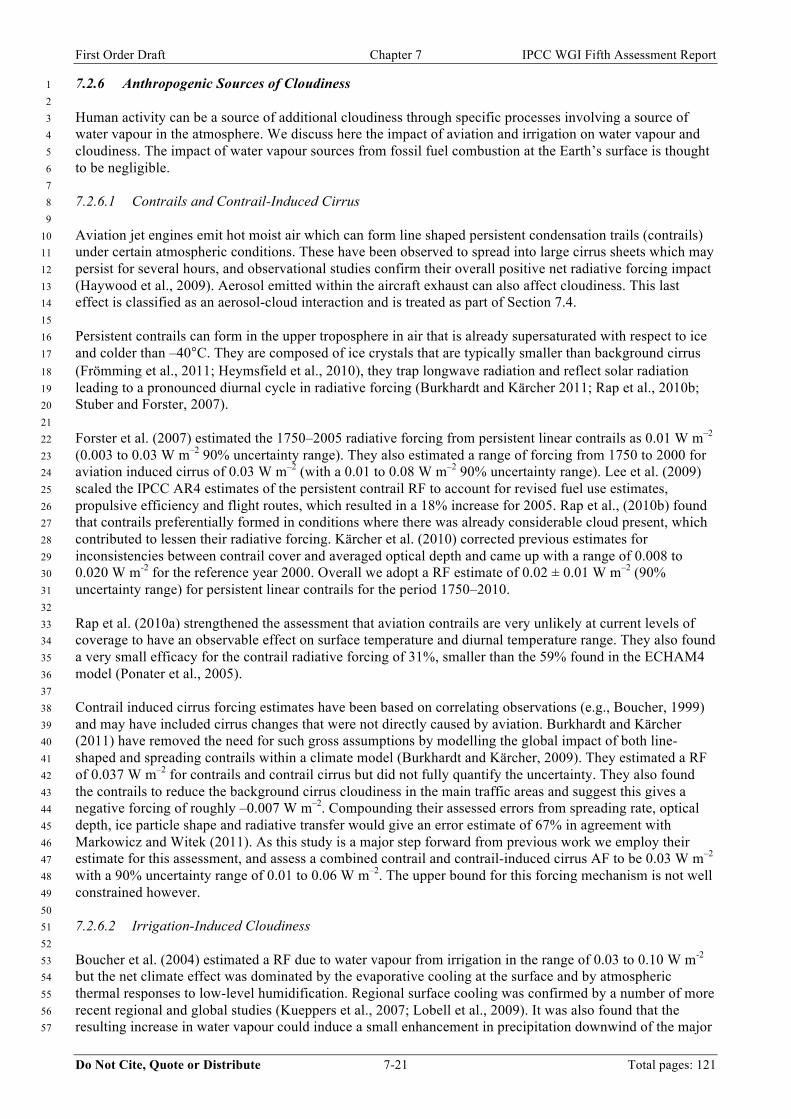
First Order Draft Chapter 7 IPCC WGI Fifth Assessment Report
Do Not Cite, Quote or Distribute 7-21 Total pages: 121
7.2.6 Anthropogenic Sources of Cloudiness 1 2 Human activity can be a source of additional cloudiness through specific processes involving a source of 3 water vapour in the atmosphere. We discuss here the impact of aviation and irrigation on water vapour and 4 cloudiness. The impact of water vapour sources from fossil fuel combustion at the Earth’s surface is thought 5 to be negligible. 6 7 7.2.6.1 Contrails and Contrail-Induced Cirrus 8 9 Aviation jet engines emit hot moist air which can form line shaped persistent condensation trails (contrails) 10 under certain atmospheric conditions. These have been observed to spread into large cirrus sheets which may 11 persist for several hours, and observational studies confirm their overall positive net radiative forcing impact 12 (Haywood et al., 2009). Aerosol emitted within the aircraft exhaust can also affect cloudiness. This last 13 effect is classified as an aerosol-cloud interaction and is treated as part of Section 7.4. 14 15 Persistent contrails can form in the upper troposphere in air that is already supersaturated with respect to ice 16 and colder than –40°C. They are composed of ice crystals that are typically smaller than background cirrus 17
(Frömming et al., 2011; Heymsfield et al., 2010), they trap longwave radiation and reflect solar radiation 18 leading to a pronounced diurnal cycle in radiative forcing (Burkhardt and Kärcher 2011; Rap et al., 2010b; 19 Stuber and Forster, 2007). 20 21 Forster et al. (2007) estimated the 1750–2005 radiative forcing from persistent linear contrails as 0.01 W m–2 22 (0.003 to 0.03 W m–2 90% uncertainty range). They also estimated a range of forcing from 1750 to 2000 for 23 aviation induced cirrus of 0.03 W m–2 (with a 0.01 to 0.08 W m–2 90% uncertainty range). Lee et al. (2009) 24 scaled the IPCC AR4 estimates of the persistent contrail RF to account for revised fuel use estimates, 25 propulsive efficiency and flight routes, which resulted in a 18% increase for 2005. Rap et al., (2010b) found 26 that contrails preferentially formed in conditions where there was already considerable cloud present, which 27 contributed to lessen their radiative forcing. Kärcher et al. (2010) corrected previous estimates for 28 inconsistencies between contrail cover and averaged optical depth and came up with a range of 0.008 to 29 0.020 W m-2 for the reference year 2000. Overall we adopt a RF estimate of 0.02 ± 0.01 W m–2 (90% 30 uncertainty range) for persistent linear contrails for the period 1750–2010. 31 32 Rap et al. (2010a) strengthened the assessment that aviation contrails are very unlikely at current levels of 33 coverage to have an observable effect on surface temperature and diurnal temperature range. They also found 34 a very small efficacy for the contrail radiative forcing of 31%, smaller than the 59% found in the ECHAM4 35 model (Ponater et al., 2005). 36 37 Contrail induced cirrus forcing estimates have been based on correlating observations (e.g., Boucher, 1999) 38 and may have included cirrus changes that were not directly caused by aviation. Burkhardt and Kärcher 39 (2011) have removed the need for such gross assumptions by modelling the global impact of both line-40 shaped and spreading contrails within a climate model (Burkhardt and Kärcher, 2009). They estimated a RF 41 of 0.037 W m–2 for contrails and contrail cirrus but did not fully quantify the uncertainty. They also found 42 the contrails to reduce the background cirrus cloudiness in the main traffic areas and suggest this gives a 43 negative forcing of roughly –0.007 W m–2. Compounding their assessed errors from spreading rate, optical 44 depth, ice particle shape and radiative transfer would give an error estimate of 67% in agreement with 45 Markowicz and Witek (2011). As this study is a major step forward from previous work we employ their 46 estimate for this assessment, and assess a combined contrail and contrail-induced cirrus AF to be 0.03 W m–2 47 with a 90% uncertainty range of 0.01 to 0.06 W m–2. The upper bound for this forcing mechanism is not well 48 constrained however. 49 50 7.2.6.2 Irrigation-Induced Cloudiness 51 52 Boucher et al. (2004) estimated a RF due to water vapour from irrigation in the range of 0.03 to 0.10 W m-2 53 but the net climate effect was dominated by the evaporative cooling at the surface and by atmospheric 54 thermal responses to low-level humidification. Regional surface cooling was confirmed by a number of more 55 recent regional and global studies (Kueppers et al., 2007; Lobell et al., 2009). It was also found that the 56 resulting increase in water vapour could induce a small enhancement in precipitation downwind of the major 57
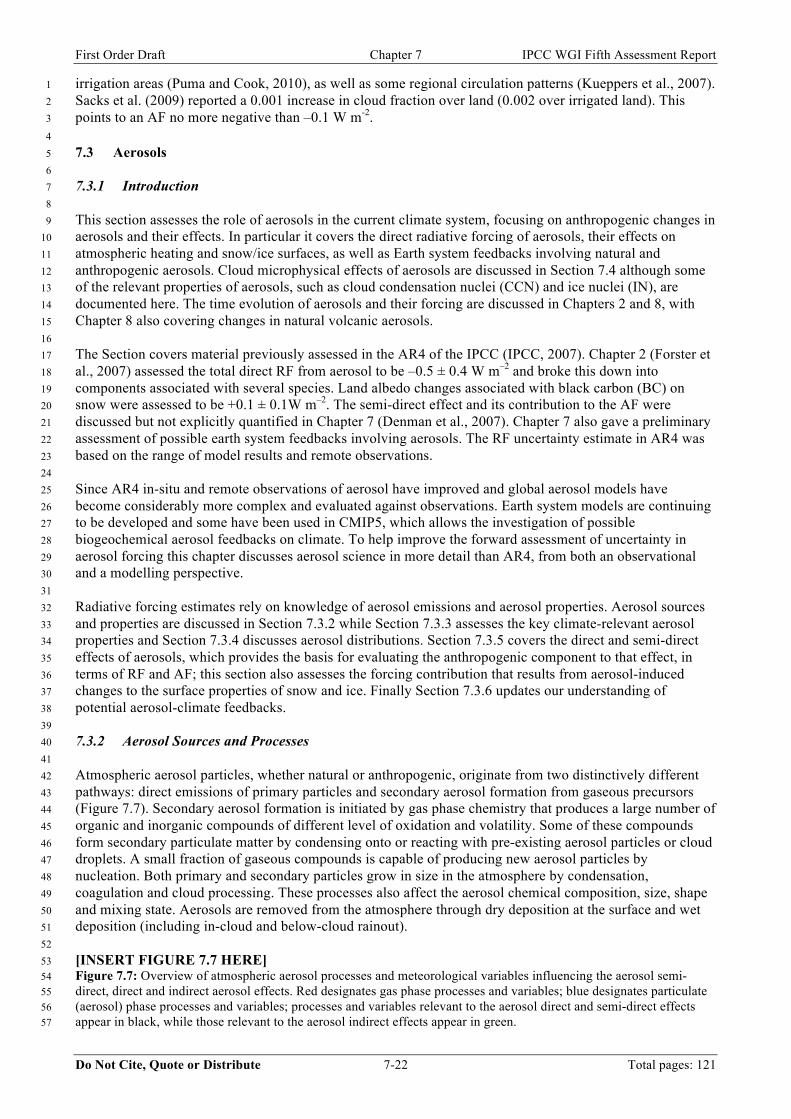
First Order Draft Chapter 7 IPCC WGI Fifth Assessment Report
Do Not Cite, Quote or Distribute 7-22 Total pages: 121
irrigation areas (Puma and Cook, 2010), as well as some regional circulation patterns (Kueppers et al., 2007). 1 Sacks et al. (2009) reported a 0.001 increase in cloud fraction over land (0.002 over irrigated land). This 2 points to an AF no more negative than –0.1 W m-2. 3
4 7.3 Aerosols 5 6 7.3.1 Introduction 7 8 This section assesses the role of aerosols in the current climate system, focusing on anthropogenic changes in 9 aerosols and their effects. In particular it covers the direct radiative forcing of aerosols, their effects on 10 atmospheric heating and snow/ice surfaces, as well as Earth system feedbacks involving natural and 11 anthropogenic aerosols. Cloud microphysical effects of aerosols are discussed in Section 7.4 although some 12 of the relevant properties of aerosols, such as cloud condensation nuclei (CCN) and ice nuclei (IN), are 13 documented here. The time evolution of aerosols and their forcing are discussed in Chapters 2 and 8, with 14 Chapter 8 also covering changes in natural volcanic aerosols. 15 16 The Section covers material previously assessed in the AR4 of the IPCC (IPCC, 2007). Chapter 2 (Forster et 17 al., 2007) assessed the total direct RF from aerosol to be –0.5 ± 0.4 W m–2 and broke this down into 18 components associated with several species. Land albedo changes associated with black carbon (BC) on 19 snow were assessed to be +0.1 ± 0.1W m–2. The semi-direct effect and its contribution to the AF were 20 discussed but not explicitly quantified in Chapter 7 (Denman et al., 2007). Chapter 7 also gave a preliminary 21 assessment of possible earth system feedbacks involving aerosols. The RF uncertainty estimate in AR4 was 22 based on the range of model results and remote observations. 23 24 Since AR4 in-situ and remote observations of aerosol have improved and global aerosol models have 25 become considerably more complex and evaluated against observations. Earth system models are continuing 26 to be developed and some have been used in CMIP5, which allows the investigation of possible 27 biogeochemical aerosol feedbacks on climate. To help improve the forward assessment of uncertainty in 28 aerosol forcing this chapter discusses aerosol science in more detail than AR4, from both an observational 29 and a modelling perspective. 30 31 Radiative forcing estimates rely on knowledge of aerosol emissions and aerosol properties. Aerosol sources 32 and properties are discussed in Section 7.3.2 while Section 7.3.3 assesses the key climate-relevant aerosol 33 properties and Section 7.3.4 discusses aerosol distributions. Section 7.3.5 covers the direct and semi-direct 34 effects of aerosols, which provides the basis for evaluating the anthropogenic component to that effect, in 35 terms of RF and AF; this section also assesses the forcing contribution that results from aerosol-induced 36 changes to the surface properties of snow and ice. Finally Section 7.3.6 updates our understanding of 37 potential aerosol-climate feedbacks. 38 39 7.3.2 Aerosol Sources and Processes 40 41 Atmospheric aerosol particles, whether natural or anthropogenic, originate from two distinctively different 42 pathways: direct emissions of primary particles and secondary aerosol formation from gaseous precursors 43 (Figure 7.7). Secondary aerosol formation is initiated by gas phase chemistry that produces a large number of 44 organic and inorganic compounds of different level of oxidation and volatility. Some of these compounds 45 form secondary particulate matter by condensing onto or reacting with pre-existing aerosol particles or cloud 46 droplets. A small fraction of gaseous compounds is capable of producing new aerosol particles by 47 nucleation. Both primary and secondary particles grow in size in the atmosphere by condensation, 48 coagulation and cloud processing. These processes also affect the aerosol chemical composition, size, shape 49 and mixing state. Aerosols are removed from the atmosphere through dry deposition at the surface and wet 50 deposition (including in-cloud and below-cloud rainout). 51 52 [INSERT FIGURE 7.7 HERE] 53 Figure 7.7: Overview of atmospheric aerosol processes and meteorological variables influencing the aerosol semi-54 direct, direct and indirect aerosol effects. Red designates gas phase processes and variables; blue designates particulate 55 (aerosol) phase processes and variables; processes and variables relevant to the aerosol direct and semi-direct effects 56 appear in black, while those relevant to the aerosol indirect effects appear in green. 57
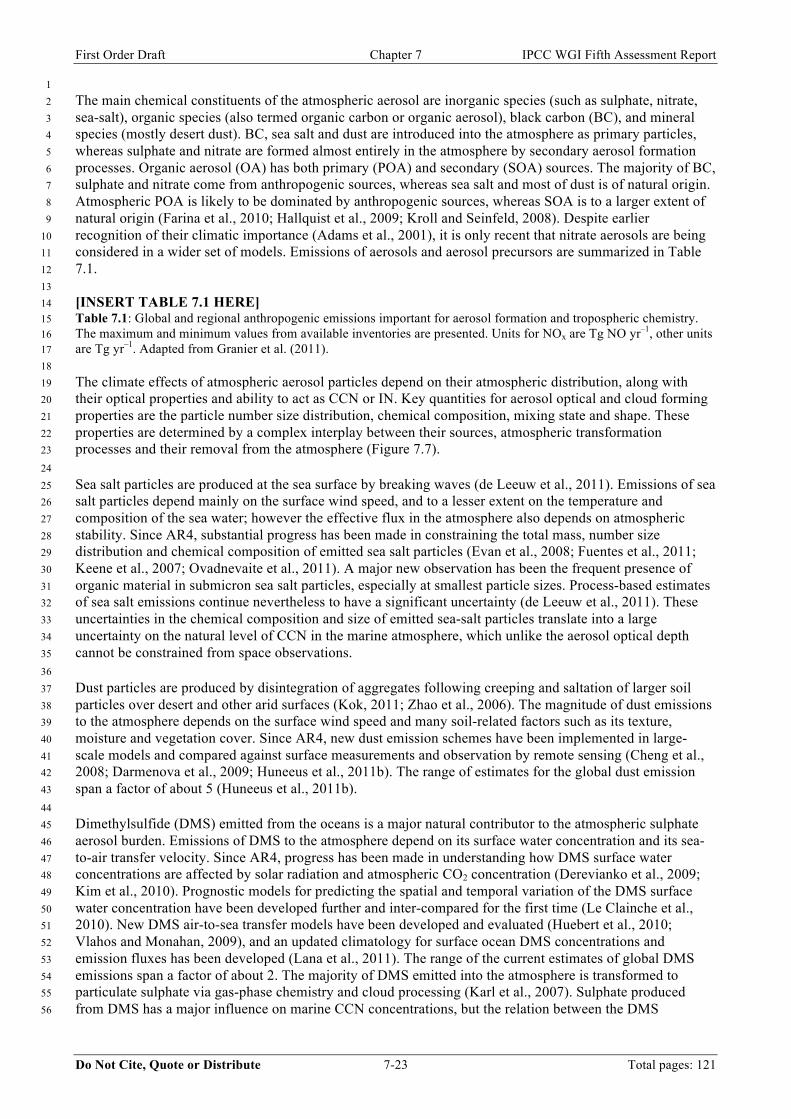
First Order Draft Chapter 7 IPCC WGI Fifth Assessment Report
Do Not Cite, Quote or Distribute 7-23 Total pages: 121
1 The main chemical constituents of the atmospheric aerosol are inorganic species (such as sulphate, nitrate, 2 sea-salt), organic species (also termed organic carbon or organic aerosol), black carbon (BC), and mineral 3 species (mostly desert dust). BC, sea salt and dust are introduced into the atmosphere as primary particles, 4 whereas sulphate and nitrate are formed almost entirely in the atmosphere by secondary aerosol formation 5 processes. Organic aerosol (OA) has both primary (POA) and secondary (SOA) sources. The majority of BC, 6 sulphate and nitrate come from anthropogenic sources, whereas sea salt and most of dust is of natural origin. 7 Atmospheric POA is likely to be dominated by anthropogenic sources, whereas SOA is to a larger extent of 8 natural origin (Farina et al., 2010; Hallquist et al., 2009; Kroll and Seinfeld, 2008). Despite earlier 9 recognition of their climatic importance (Adams et al., 2001), it is only recent that nitrate aerosols are being 10 considered in a wider set of models. Emissions of aerosols and aerosol precursors are summarized in Table 11 7.1. 12 13 [INSERT TABLE 7.1 HERE] 14 Table 7.1: Global and regional anthropogenic emissions important for aerosol formation and tropospheric chemistry. 15 The maximum and minimum values from available inventories are presented. Units for NOx are Tg NO yr–1, other units 16 are Tg yr–1. Adapted from Granier et al. (2011). 17 18 The climate effects of atmospheric aerosol particles depend on their atmospheric distribution, along with 19 their optical properties and ability to act as CCN or IN. Key quantities for aerosol optical and cloud forming 20 properties are the particle number size distribution, chemical composition, mixing state and shape. These 21 properties are determined by a complex interplay between their sources, atmospheric transformation 22 processes and their removal from the atmosphere (Figure 7.7). 23
24 Sea salt particles are produced at the sea surface by breaking waves (de Leeuw et al., 2011). Emissions of sea 25 salt particles depend mainly on the surface wind speed, and to a lesser extent on the temperature and 26 composition of the sea water; however the effective flux in the atmosphere also depends on atmospheric 27 stability. Since AR4, substantial progress has been made in constraining the total mass, number size 28 distribution and chemical composition of emitted sea salt particles (Evan et al., 2008; Fuentes et al., 2011; 29 Keene et al., 2007; Ovadnevaite et al., 2011). A major new observation has been the frequent presence of 30 organic material in submicron sea salt particles, especially at smallest particle sizes. Process-based estimates 31 of sea salt emissions continue nevertheless to have a significant uncertainty (de Leeuw et al., 2011). These 32 uncertainties in the chemical composition and size of emitted sea-salt particles translate into a large 33 uncertainty on the natural level of CCN in the marine atmosphere, which unlike the aerosol optical depth 34 cannot be constrained from space observations. 35
36 Dust particles are produced by disintegration of aggregates following creeping and saltation of larger soil 37 particles over desert and other arid surfaces (Kok, 2011; Zhao et al., 2006). The magnitude of dust emissions 38 to the atmosphere depends on the surface wind speed and many soil-related factors such as its texture, 39 moisture and vegetation cover. Since AR4, new dust emission schemes have been implemented in large-40 scale models and compared against surface measurements and observation by remote sensing (Cheng et al., 41 2008; Darmenova et al., 2009; Huneeus et al., 2011b). The range of estimates for the global dust emission 42 span a factor of about 5 (Huneeus et al., 2011b). 43
44 Dimethylsulfide (DMS) emitted from the oceans is a major natural contributor to the atmospheric sulphate 45 aerosol burden. Emissions of DMS to the atmosphere depend on its surface water concentration and its sea-46 to-air transfer velocity. Since AR4, progress has been made in understanding how DMS surface water 47 concentrations are affected by solar radiation and atmospheric CO2 concentration (Derevianko et al., 2009; 48 Kim et al., 2010). Prognostic models for predicting the spatial and temporal variation of the DMS surface 49 water concentration have been developed further and inter-compared for the first time (Le Clainche et al., 50 2010). New DMS air-to-sea transfer models have been developed and evaluated (Huebert et al., 2010; 51 Vlahos and Monahan, 2009), and an updated climatology for surface ocean DMS concentrations and 52 emission fluxes has been developed (Lana et al., 2011). The range of the current estimates of global DMS 53 emissions span a factor of about 2. The majority of DMS emitted into the atmosphere is transformed to 54 particulate sulphate via gas-phase chemistry and cloud processing (Karl et al., 2007). Sulphate produced 55 from DMS has a major influence on marine CCN concentrations, but the relation between the DMS 56
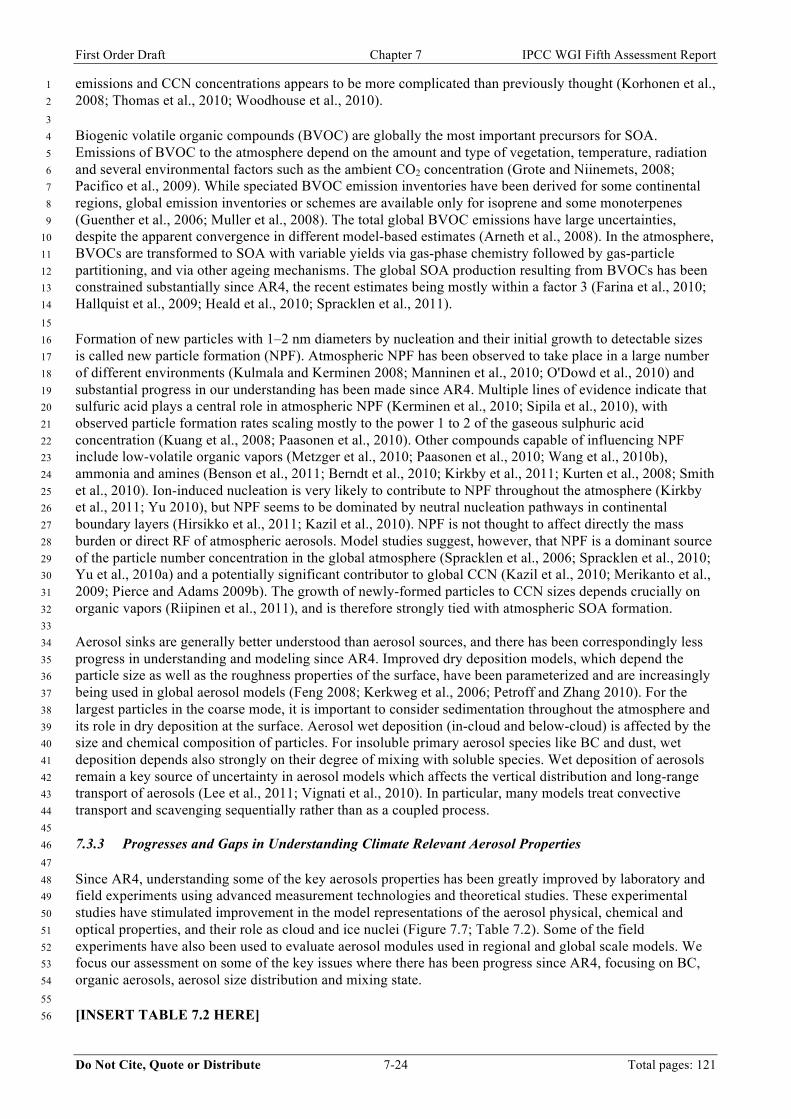
First Order Draft Chapter 7 IPCC WGI Fifth Assessment Report
Do Not Cite, Quote or Distribute 7-24 Total pages: 121
emissions and CCN concentrations appears to be more complicated than previously thought (Korhonen et al., 1 2008; Thomas et al., 2010; Woodhouse et al., 2010). 2
3 Biogenic volatile organic compounds (BVOC) are globally the most important precursors for SOA. 4 Emissions of BVOC to the atmosphere depend on the amount and type of vegetation, temperature, radiation 5 and several environmental factors such as the ambient CO2 concentration (Grote and Niinemets, 2008; 6 Pacifico et al., 2009). While speciated BVOC emission inventories have been derived for some continental 7 regions, global emission inventories or schemes are available only for isoprene and some monoterpenes 8 (Guenther et al., 2006; Muller et al., 2008). The total global BVOC emissions have large uncertainties, 9 despite the apparent convergence in different model-based estimates (Arneth et al., 2008). In the atmosphere, 10 BVOCs are transformed to SOA with variable yields via gas-phase chemistry followed by gas-particle 11 partitioning, and via other ageing mechanisms. The global SOA production resulting from BVOCs has been 12 constrained substantially since AR4, the recent estimates being mostly within a factor 3 (Farina et al., 2010; 13 Hallquist et al., 2009; Heald et al., 2010; Spracklen et al., 2011). 14
15 Formation of new particles with 1–2 nm diameters by nucleation and their initial growth to detectable sizes 16 is called new particle formation (NPF). Atmospheric NPF has been observed to take place in a large number 17 of different environments (Kulmala and Kerminen 2008; Manninen et al., 2010; O'Dowd et al., 2010) and 18 substantial progress in our understanding has been made since AR4. Multiple lines of evidence indicate that 19 sulfuric acid plays a central role in atmospheric NPF (Kerminen et al., 2010; Sipila et al., 2010), with 20 observed particle formation rates scaling mostly to the power 1 to 2 of the gaseous sulphuric acid 21 concentration (Kuang et al., 2008; Paasonen et al., 2010). Other compounds capable of influencing NPF 22 include low-volatile organic vapors (Metzger et al., 2010; Paasonen et al., 2010; Wang et al., 2010b), 23 ammonia and amines (Benson et al., 2011; Berndt et al., 2010; Kirkby et al., 2011; Kurten et al., 2008; Smith 24 et al., 2010). Ion-induced nucleation is very likely to contribute to NPF throughout the atmosphere (Kirkby 25 et al., 2011; Yu 2010), but NPF seems to be dominated by neutral nucleation pathways in continental 26 boundary layers (Hirsikko et al., 2011; Kazil et al., 2010). NPF is not thought to affect directly the mass 27 burden or direct RF of atmospheric aerosols. Model studies suggest, however, that NPF is a dominant source 28 of the particle number concentration in the global atmosphere (Spracklen et al., 2006; Spracklen et al., 2010; 29 Yu et al., 2010a) and a potentially significant contributor to global CCN (Kazil et al., 2010; Merikanto et al., 30 2009; Pierce and Adams 2009b). The growth of newly-formed particles to CCN sizes depends crucially on 31 organic vapors (Riipinen et al., 2011), and is therefore strongly tied with atmospheric SOA formation. 32 33 Aerosol sinks are generally better understood than aerosol sources, and there has been correspondingly less 34 progress in understanding and modeling since AR4. Improved dry deposition models, which depend the 35 particle size as well as the roughness properties of the surface, have been parameterized and are increasingly 36 being used in global aerosol models (Feng 2008; Kerkweg et al., 2006; Petroff and Zhang 2010). For the 37 largest particles in the coarse mode, it is important to consider sedimentation throughout the atmosphere and 38 its role in dry deposition at the surface. Aerosol wet deposition (in-cloud and below-cloud) is affected by the 39 size and chemical composition of particles. For insoluble primary aerosol species like BC and dust, wet 40 deposition depends also strongly on their degree of mixing with soluble species. Wet deposition of aerosols 41 remain a key source of uncertainty in aerosol models which affects the vertical distribution and long-range 42 transport of aerosols (Lee et al., 2011; Vignati et al., 2010). In particular, many models treat convective 43 transport and scavenging sequentially rather than as a coupled process. 44 45 7.3.3 Progresses and Gaps in Understanding Climate Relevant Aerosol Properties 46
47 Since AR4, understanding some of the key aerosols properties has been greatly improved by laboratory and 48 field experiments using advanced measurement technologies and theoretical studies. These experimental 49 studies have stimulated improvement in the model representations of the aerosol physical, chemical and 50 optical properties, and their role as cloud and ice nuclei (Figure 7.7; Table 7.2). Some of the field 51 experiments have also been used to evaluate aerosol modules used in regional and global scale models. We 52 focus our assessment on some of the key issues where there has been progress since AR4, focusing on BC, 53 organic aerosols, aerosol size distribution and mixing state. 54
55 [INSERT TABLE 7.2 HERE] 56
First Order Draft Chapter 7 IPCC WGI Fifth Assessment Report
Do Not Cite, Quote or Distribute 7-25 Total pages: 121
Table 7.2: Key aerosol properties of the main aerosol species in the troposphere. Brown carbon is a particular type of 1 OA but is treated here as an additional component because it is light absorbing. The estimate of aerosol burdens and 2 lifetimes in the troposphere are based on the AeroCom models. 3 4 7.3.3.1 Chemical Composition 5 6 The gas-aerosol partitioning of semi-volatile inorganic species (H2SO4, HNO3, HCl, and NH3) is governed by 7 gas-particle mass transfer kinetics, equilibrium thermodynamics, and heterogeneous chemical reactions. 8 These processes are determined by meteorological conditions, such as temperature and relative humidity, 9 and chemical conditions, such as gas-phase concentrations, aerosol size distribution and phase, and pH of 10 particles. Aerosol models are increasingly calculating the gas-aerosol partitioning by assuming 11 thermodynamic equilibrium (e.g., Nenes et al., 1998; Wexler and Clegg, 2002) or by solving gas-particle 12 mass transfer dynamically (e.g., Zaveri et al., 2008; Zhang et al., 2004). Although a number of climate and 13 global models assume thermodynamic equilibrium for semi-volatile inorganic species (or do not include 14 semi-volatile inorganic species), the equilibrium assumption is not always valid even under typical 15 atmospheric conditions. 16 17 BC is a distinct type of carbonaceous material, formed only near flames during combustion of carbon-based 18 fuels. It strongly absorbs visible light and it is refractory. These physical properties allow at least in principle 19 for a strict definition of BC. Direct measurement of individual BC-containing particles is possible with a 20 single-particle soot photometer (SP2) based on laser-induced incandescence (Gao et al., 2007; Moteki and 21 Kondo, 2010; Moteki et al., 2009; Schwarz et al., 2008; Schwarz et al., 2006). This technique has enabled 22 accurate measurements of the size of BC cores (mean number diameters of 50–80 nm for fossil-fuel sources 23 and 120 nm for biomass burning). However spatial and temporal coverage of the measurements are still 24 limited (Schwarz et al., 2010). 25
26 Condensation of gas-phase species on BC and coagulation with other particles alter the mixing state of BC 27 (e.g., Adachi et al., 2010; Li et al., 2003; Pósfai et al., 2003). In polluted urban air, BC becomes internally 28 mixed on a timescale of ~12 h (McMeeking et al., 2010; Moteki et al., 2007). The resulting BC-containing 29 particles become more hydrophilic which can lead to a reduced lifetime and atmospheric loading (Stier et al., 30 2006b). In addition, internal mixing can enhance the BC mass absorption efficiency by up to a factor of 2 31 (Bond and Bergstrom, 2006; Cross et al., 2010), with typical values of about 8–20 m2 g–1 at a wavelength of 32 532 nm. 33
34 Long-range transport of BC has been observed in some conditions, e.g., from biomass burning in Russia to 35 the Arctic in spring (Kondo et al., 2011; Warneke et al., 2009; Warneke et al., 2010), or in northeastern 36 China in spring when humidity was relatively low (Oshima et al., 2011). However it is thought that rapid 37 coating of BC by soluble material reduce the effectiveness of the vertical transport by convection. 38 39 Formation processes of OA remain highly uncertain, which is a major weakness in the present understanding 40 of atmospheric aerosol (Hallquist et al., 2009; Kanakidou et al., 2005). Measurements by Aerosol Mass 41 Spectrometers have provided some insights into sources of OA (Lanz et al., 2007; Ulbrich et al., 2009; 42 Zhang et al., 2005b). Measurements at continental midlatitudes including urban and rural/remote air suggest 43 that majority of SOA is likely to be oxygenated OA (Zhang et al., 2005a; Zhang et al., 2007). Measurements 44 within and downstream of urban air indicate that under most circumstances SOA substantially contributes to 45 the total OA mass (de Gouw et al., 2005; Volkamer et al., 2006; Zhang et al., 2007). 46 47 The contribution of secondary organic aerosol (SOA) to the total OA is larger than previously thought, but 48 the split between primary organic aerosols (POA) and SOA has remained somewhat ambiguous (Jimenez et 49 al., 2009; Robinson et al., 2007). POA had been assumed to be completely non-volatile. However, it has 50 been found that a certain amount of POA may evaporate, followed by gas-phase photochemical oxidation of 51 the vapors, to produce even less volatile SOA (Robinson et al., 2007), as shown in Figure 7.7. 52 53 Some of OA is light absorbing (brown carbon; BrC), which is produced mainly by lower temperature 54 combustion, such as biomass burning (Andreae and Gelencser 2006). The absorption properties of BrC can 55 be attributed to water soluble organic compounds and humic-like substances (Graber and Rudich 2006; 56 Kirchstetter et al., 2004), although they are poorly quantified (Alexander et al., 2008; Flowers et al., 2010). 57
First Order Draft Chapter 7 IPCC WGI Fifth Assessment Report
Do Not Cite, Quote or Distribute 7-26 Total pages: 121
1 There is a large range in the complexity with which OA are represented in global aerosol models. Some 2 complex, yet still parameterized, chemical schemes have been developed recently which account for 3 multigenerational oxidation (Donahue et al., 2011; Jimenez et al., 2009; Robinson et al., 2007). Some 4 regional and global models use semi-empirical schemes, where semi- or non-volatile organic compounds 5 (SVOC) are produced from parent VOCs by oxidation processes and partitioned between the aerosol and gas 6 phases (Fan et al., 2005; Heald et al., 2005; Russell and Allen, 2005; Tsigaridis and Kanakidou, 2003). The 7 representation of secondary organic aerosols in many of the models used in CMIP5 is either non-existent or 8 very crude in that the source terms are prescribed and/or the models ignore the complex chemical and aging 9 processes. 10
11 7.3.3.2 Mixing State 12 13 There are multiple observations that show aerosols to be internally mixed (that is with multiple materials in 14 individual particles) relatively soon after emission. In general, organic and black carbon, in biomass burning 15 aerosols were found frequently internally mixed with ammonium, nitrate, and sulphate (Deboudt et al., 2010; 16 Pratt and Prather 2010). Studies over urban locations revealed that as much as 90% of the particles are 17 internally mixed with secondary inorganic species (Bi et al., 2011). Likewise there is evidence of internal 18 mixing between dust and biomass burning aerosols when these aerosol types age together (Hand et al., 19 2010). Studies have shown that state of mixing can alter particle hygroscopicity and hence their ability to act 20 as CCN (Wex et al., 2010). 21 22 A common form of mixing is coating of soluble material (secondary aerosol) over a primary aerosol such as 23 a BC or dust core. The solid to liquid transition of such mixed aerosols as the RH increases influences their 24 light scattering properties through changes in particle shape, size, and refractive index (Freney et al., 2010). 25 Another form of coating involves fine BC contaminating large dust particles. The optical properties of an 26 internal mixture are known to be significantly different from those of an external mixture (Garcia et al., 27 2011; Jacobson, 2001; Shiraiwa et al., 2008) with an increase in the mass absorption efficiency. 28 29 Global aerosol models are increasingly treating aerosols as an internal mixture, which enables a consistent 30 treatment of aerosol hygroscopicity, scavenging and optical properties (i.e., Stier et al., 2006a). Commonly-31 used modal approaches do not allow to represent discrete variations of mixing state across an aerosol mode, 32 though. 33
34 7.3.3.3 Aerosol Size Distribution 35 36 Aerosol size distribution is one of the key characteristics required for estimating the spectral optical and 37 CCN properties of aerosols. Though ground-based measurements of aerosol size distribution are being 38 carried out as part of various field campaigns (Haywood et al., 2011), such information is still sparse and 39 there have been only few attempts to build a climatology of aerosol size distribution (e.g., Heintzenberg et 40 al., 2000). There have been improvements in the algorithms to derive column-averaged volume size 41 distribution from sun photometer measurements (Dubovik et al., 2006). Validation studies show agreement 42 for the derived size distribution against in situ (surface as well as aircraft-based) measurements 43 (Gerasopoulos et al., 2007; Haywood et al., 2011; Radhi et al., 2010; Smirnov et al., 2011), but these 44 inversion products have not been comprehensively validated. There has also been some progress in 45 measuring the aerosol size distribution down to a few nanometre size (e.g., Feldpausch et al., 2006) which 46 revealed large Aitken mode concentrations in the tropical upper troposphere. 47 48 Satellite sensors such as MODIS and POLDER also provides the Angström coefficient and AOD fine mode 49 fraction (i.e., contributed by those aerosols with diameter less than about 1 µm). Even though aerosol fine 50
mode fraction has been validated over ocean (Remer et al., 2005), accurate determination of fine mode 51 fraction over land still remains a challenge (Jethva et al., 2009; Levy et al., 2007). 52 53 Measurements have been used to evaluate the ability of the new generation of global aerosol models to 54 simulate aerosol number concentration and the aerosol size distribution (Bauer et al., 2008; Liu et al., 2005b; 55 Spracklen et al., 2005a, 2005b; Spracklen et al., 2010; Stier et al., 2005; Wang et al., 2009; Yu and Luo, 56 2009; Zhang et al., 2010b). Such evaluations place powerful constraints on the representation of new particle 57
First Order Draft Chapter 7 IPCC WGI Fifth Assessment Report
Do Not Cite, Quote or Distribute 7-27 Total pages: 121
formation in the models, which is a major source of uncertainty in estimates of the aerosol indirect effects 1 (see Section 7.4). Simulated aerosol number concentrations at the surface are usually found to be too low 2 unless empirical particle nucleation schemes are used. Models are also hampered by the lack of size-resolved 3 inventories of aerosol emissions. 4
5 7.3.3.4 CCN Properties of Aerosols 6 7 A proportion of aerosol acts as CCN. The ability of an aerosol particle to take up water and subsequently 8 activate is determined by its size and composition. Common CCN in the atmosphere are composed of sea 9 salt, sulphates and sulphuric acid, nitrate and some organics (Table 7.2). The size of the CCN was found to 10 be more important than their chemical composition at one continental location as larger particles are more 11 readily activated than smaller particles because they require a lower critical supersaturation (Dusek et al., 12 2006). However, the chemical composition influences the aerosol size distribution and may be important in 13 other locations. The CCN activity of aerosols can be characterised by a hygroscopicity parameter κ that can 14
be derived from measurements (Petters and Kreidenweis, 2007). 15 16 CCN activity of inorganic aerosols is relatively well understood. Lately most attention has been paid to the 17 CCN activity of mixed organic/inorganic aerosols (e.g., King et al., 2010; Prisle et al., 2010). Uncertainties 18 in our current understanding of CCN properties are associated with SOA (Good et al., 2010), mainly because 19 OA are still poorly characterized (Jimenez et al., 2009). For SOA it is not clear how important surface 20 tension effects and bulk to surface partitioning are and if the water activity coefficient changes significantly 21 as a function of the solute concentration (Good et al., 2010; Prisle et al., 2008). Thus, when the aerosol is 22 dominated by organics, discrepancies between values of κ obtained directly from both CCN activity 23 measurements and sub-saturated particle water uptake measurements have been observed in some instances 24 (e.g., Irwin et al., 2010; Prenni et al., 2007; Roberts et al., 2010), whereas in other studies closure could be 25 obtained (e.g., Duplissy et al., 2008; Rose et al., 2011). 26 27 Pringle et al. (2010) used surface and aircraft measurements to evaluate the values of the hygroscopicity 28 parameter simulated by a global aerosol model, and found generally good agreement. Spracklen et al. (2008) 29 used surface and aircraft measurements to evaluate simulated distributions of CCN concentration, and found 30 good agreement between simulated and observed concentrations. 31 32 7.3.3.5 IN Properties of Aerosols 33 34 Aerosols that act as IN are solid substances at atmospheric temperatures and supersaturations. Mineral dust 35 and primary biological particles are typically known as good IN. Conflicting evidence has been presented for 36 the ability of BC, organic and biomass burning particles to act as IN. Four heterogeneous ice nucleation 37 modes are distinguished in the literature. Immersion freezing refers to freezing that is initiated from within a 38 cloud droplet, condensation freezing refers to freezing during droplet formation, and contact freezing is 39 initiated when an IN collides with a supercooled cloud droplet. Deposition nucleation refers to the direct 40 deposition of vapour onto IN. Lidar observations revealed that liquid cloud droplets are present before ice 41 crystals form via heterogeneous freezing mechanisms (Ansmann et al., 2008; de Boer et al., 2011) indicating 42 that deposition nucleation does not seem to be important for mixed-phase clouds. 43 44 A compilation of onset temperatures and relative humidities for deposition/condensation nucleation versus 45 immersion freezing for bacteria, mineral dust and soot based on recent data from laboratory data is shown in 46 Figure 7.8. It should be noted that the reported nucleation onset points for the different materials differ with 47 respect to the fraction of ice nucleating particles (e.g., due to the detection thresholds of measurement 48 methods). Bacteria initiate immersion freezing at the highest temperatures, followed by mineral dust and 49 then soot. It is obvious that for dust and bacteria, heterogeneous ice nucleation occurs at considerably higher 50 temperatures than homogeneous freezing. Remote sensing observations confirm that ice clouds in air 51 containing dust can be found at significant warmer temperatures than in dust-free conditions (Choi et al., 52 2010; Sassen et al., 2003; Seifert et al., 2010). Laboratory results indicate that, in comparison with natural IN 53 such as mineral dust and biological particles, soot initiates ice at the coldest temperatures. Deposition 54 nucleation of ice on most types of soot particles is not important above –30ºC and below water saturation 55 (Dymarska et al., 2006; Friedman et al., 2011). However, in-situ observations indicate an enrichment of BC 56
First Order Draft Chapter 7 IPCC WGI Fifth Assessment Report
Do Not Cite, Quote or Distribute 7-28 Total pages: 121
in atmospheric ice particle residuals in tropospheric mixed phase clouds (Cozic et al., 2008; Targino et al., 1 2009; Twohy et al., 2010), thus there must be some mechanism for BC to enter ice clouds. 2 3 Lately, a variety of other substances such as crystalline ammonium sulphate at cirrus temperatures (e.g., 4 Abbatt et al., 2006; Baustian et al., 2010; Wise et al., 2009), oxalic acid (Wagner et al., 2010, 2011; Zobrist 5 et al., 2006), marine diatoms (Knopf et al., 2011) as well as fulvic and humic acid (Wang and Knopf, 2011) 6 have been identified as possible IN. Biological particles in significant concentrations have also been 7 observed in residues from ice crystals (Pratt et al., 2009; Prenni et al., 2009). 8 9 IN can either be bare or mixed with other substances. As bare particles age in the atmosphere, they acquire 10 liquid surface coatings by condensing soluble species and water vapor or by scavenging soluble particles, 11 which may transform IN from deposition or contact nuclei into possible immersion nuclei. This 12 transformation or the chemical processing with ozone or other oxidizing substances may dampen the ice-13 forming ability of some IN types (Chernoff and Bertram, 2010; Cziczo et al., 2009b; DeMott et al., 2009; 14 Eastwood et al., 2009; Mohler et al., 2005; Sullivan et al., 2010b; Wang and Knopf, 2011). IN have been 15 observed to be less efficient after chemical aging with nitric acid (Sullivan et al., 2010a) with ammonia gas 16 (Salam et al., 2007) and of BC particles with aqueous sulphuric acid for nucleation in cirrus clouds (DeMott 17 et al., 1999; Koehler et al., 2009). 18 19 [INSERT FIGURE 7.8 HERE] 20 Figure 7.8: The onset temperatures and relative humidities for deposition/condensation freezing and immersion 21 freezing for bioaerosols (Ahern et al., 2007; Diehl et al., 2001; Iannone et al., 2011; Kanji et al., 2011; Mohler et al., 22 2008; Mortazavi et al., 2008; von Blohn et al., 2005; Yankofsky et al., 1981), mineral dusts (Archuleta et al., 2005; 23 Bundke et al., 2008; Connolly et al., 2009; Cziczo et al., 2009a; Field et al., 2006; Kanji and Abbatt 2006; Kanji et al., 24 2011; Knopf and Koop 2006; Koehler et al., 2010; Kulkarni and Dobbie 2010; Lüönd et al., 2010; Mohler et al., 2006; 25 Murray et al., 2011; Niedermeier et al., 2010; Niemand et al., 2011; Roberts and Hallett 1968; Salam et al., 2006; 26 Schaller and Fukuta 1979; Welti et al., 2009; Zimmermann et al., 2008), organics (Baustian et al., 2010; Kanji et al., 27 2008; Petters et al., 2009; Prenni et al., 2007; Shilling et al., 2006; Wagner et al., 2010, 2011; Wang and Knopf 2011; 28 Zobrist et al., 2007), solid ammonium sulphate (Abbatt et al., 2006; Baustian et al., 2010; Mangold et al., 2005; Shilling 29 et al., 2006; Wise et al., 2009; 2010) and BC (soot) (Crawford et al., 2011; DeMott 1990; DeMott et al., 1999; Diehl 30 and Mitra 1998; Dymarska et al., 2006; Fornea et al., 2009; Gorbunov et al., 2001; Kanji et al., 2011; Mohler et al., 31 2005), from a compilation of experimental data of sub- and super-micron aerosol particles in the literature (for 32 references see supplementary material). The large range of observed ice nucleation onset conditions is due to different 33 experimental setups, particle sizes, activated fractions and chemical composition. Only those IN species for which at 34 least three papers exists are shown. The dashed line refers to the homogeneous freezing of solution droplets after (Koop 35 et al., 2000). 36 37 7.3.4 Aerosol Distributions 38 39 This section assesses our current understanding of aerosol distributions from in-situ and remote-sensing 40 measurements, and the current ability of global aerosol models to simulate such distributions. Aerosol 41 predictions in the CMIP5 models are assessed in Chapter 12. Since the AR4, new and improved 42 observational tools for global aerosol model evaluation have emerged. 43 44 The most commonly used in-situ measurements for global aerosol model evaluation are mass concentrations 45 and deposition fluxes. Long-term aerosol mass concentrations have been measured at the surface by global 46 and local networks, as well as individual efforts with improved coordination and quality assurance. 47 Climatologies of the main aerosol types can be constructed from such measurements (e.g., Jimenez et al., 48 2009; Figure 7.9). They show a wide spatial variability in the dominant aerosol type and aerosol 49 concentrations worldwide. Mineral aerosol is the largest aerosol component in most areas with higher 50 concentrations in Urban S. Asia and China, accounting ~ 35% of PM10. Aerosol fraction in rural U.S. and 51 South America are composed mainly (i.e., ~20%) of OC, and the OC fractions also rank second or third with 52 a mean of ~16% in other areas of the world. Sulfate normally accounts for ~10–30%, except for the areas in 53 rural Africa, high Asia, urban Oceania and South America with less than ~5%. The fractions of nitrate and 54 ammonium are only around 6% and 4%, in average respectively. In most areas, BC fractions are less than 55 5%, although this percentage may be larger in South America, urban Africa, urban Europe, South-East and 56 East Asia and urban Oceania. Sea-salt aerosols can be dominant at oceanic sites. Measurements of dry and 57 wet deposition on the surface have also been made (e.g., Hjellbrekke, 2001; McConnell et al., 2007) and 58
First Order Draft Chapter 7 IPCC WGI Fifth Assessment Report
Do Not Cite, Quote or Distribute 7-29 Total pages: 121
used to evaluate global aerosol models (e.g., Boucher and Pham, 2002; Easter et al., 2004; Flanner et al., 1 2007; Huneeus et al., 2011b). 2 3 [INSERT FIGURE 7.9 HERE] 4 Figure 7.9: Bar chart plots summarizing the annual, seasonal or monthly mean mass concentration (µg m–3) of six 5 major types of aerosol particles in diameter smaller than 10 µm with at least an entire year data from various rural and 6 urban sites in nine continental areas of the world. These include: 1) rural U. S. (Chow et al., 1993; Liu et al., 2005a; 7 Malm and Schichtel 2004; Malm et al., 1994); urban U. S. (Chow et al., 1993; Ito et al., 2004; Kim et al., 2000; Liu et 8 al., 2005a; Malm and Schichtel 2004; Sawant et al., 2004); 2) South America (Artaxo et al., 1998; Artaxo et al., 2002; 9 Bourotte et al., 2007; Celis et al., 2004; Fuzzi et al., 2007; Gioda et al., 2011; Mariani and Mello 2007; Martin et al., 10 2010; Morales et al., 1998; Souza et al., 2010); 3) rural Europe (Gullu et al., 2000; Hueglin et al., 2005; Kocak et al., 11 2007; Putaud et al., 2004; Puxbaum et al., 2004; Querol et al., 2001; Querol et al., 2009; Querol et al., 2004; Rodriguez 12 et al., 2002; Rodrıguez et al., 2004; Salvador et al., 2007; Theodosi et al., 2010; Viana et al., 2008; Yin and Harrison 13 2008; Yttri 2007); urban Europe (Hueglin et al., 2005; Lenschow et al., 2001; Lodhi et al., 2009; Lonati et al., 2005; 14 Perez et al., 2008; Putaud et al., 2004; Querol et al., 2001; Querol et al., 2006; Querol et al., 2004; Querol et al., 2008; 15 Rodriguez et al., 2002; Rodrıguez et al., 2004; Roosli et al., 2001; Viana et al., 2007; Viana et al., 2006; Yin and 16 Harrison 2008); 4) rural Africa (Maenhaut et al., 1996; Mkoma 2008; Mkoma et al., 2009a; Mkoma et al., 2009b; 17 Nyanganyura et al., 2007; Weinstein et al., 2010); urban Africa (Favez et al., 2008; Mkoma 2008; Mkoma et al., 18 2009a); 5) high Asia, with altitude larger than 1680 m. (Carrico et al., 2003; Decesari et al., 2010; Ming et al., 2007a; 19 Qu et al., 2008; Ram et al., 2010; Rastogi and Sarin 2005; Rengarajan et al., 2007; Shresth et al., 2000; Zhang et al., 20 2001; Zhang et al., 2008; Zhang et al., 2011a); 6) rural China (Hagler et al., 2006; Hu et al., 2002; Zhang et al., 2011a); 21 urban China (Cheng et al., 2000; Hagler et al., 2006; Oanh et al., 2006; Wang et al., 2003; Wang et al., 2005b; Wang et 22 al., 2006; Xiao and Liu 2004; Yao et al., 2002; Ye et al., 2003; Zhang et al., 2002; Zhang et al., 2011a; Zhang et al., 23 2011b); 7) South-East and East Asia (Han et al., 2008; Khan et al., 2010; Kim et al., 2007; Lee and Kang 2001; Oanh et 24 al., 2006); 8) urban South Asia (Chakraborty and Gupta 2010; Khare and Baruah 2010; Kumar et al., 2007; Lodhi et al., 25 2009; Raman et al., 2010; Rastogi and Sarin 2005; Safai et al., 2010; Stone et al., 2010); 9) urban Oceania (Chan et al., 26 1997; Maenhaut et al., 2000; Radhi et al., 2010; Wang and Shooter 2001; Wang et al., 2005a). 27 28 Measurements of aerosol optical depth (AOD) are retrieved at the surface by AERONET (e.g., Holben et al., 29 1998; Holben et al., 2001), other ground-based networks and an increasing number of satellite missions. 30 Retrievals from aerosol-dedicated instruments such as MODIS (Kleidman et al., 2011; Levy et al., 2010; 31 Remer et al., 2005), MISR (Kahn et al., 2005; Kahn et al., 2007) and POLDER/PARASOL (Tanré et al., 32 2011). Other instruments such as AVHRR (Geogdzhayev et al., 2002; Jeong and Li 2005), TOMS (Torres et 33 al., 1998; Torres et al., 2002) and ATSR/AATSR have longer measurements records. Composite aerosol 34 datasets have also been developed (see Chapter 2). While each aerosol retrieval shows some skill against 35 AERONET measurements, there are still large differences in regional and seasonal patterns because of 36 differences in sampling, cloud screening and treatment of the surface reflectivity (Kokhanovsky et al., 2010). 37 38 Field experiments involving research aircraft such as TRACE-P (Jacob et al., 2003), INTEX-A (Singh et al., 39 2006), ARCTAS (Jacob et al., 2010), ARCPAC (Warneke et al., 2010) and HIPPO1 (Schwarz et al., 2010; 40 Schwarz et al., 2006), commercial aircraft (Brenninkmeijer et al., 2007) and spaceborne lidars (Omar et al., 41 2009; Winker et al., 2009) can provide measurements of the aerosol vertical profile. For example, Koch et al. 42 (2009b) and Schwarz et al. (2010) used BC measurements by an SP2 instrument on aircraft to evaluate 43 AeroCom model simulations of the vertical distribution of BC aerosol in many regions, and found that most 44 models simulate too much BC in the upper troposphere (Schwarz et al., 2010, see Figure 7.10). Koch et al. 45 (2009b) also used AERONET retrievals of aerosol absorption optical depth (AAOD) to show that most 46 AeroCom models underestimate AAOD in many regions. Yu et al. (2010b) and Koffi et al. (2011) found that 47 global aerosol models tend to have a positive bias on the aerosol extinction scale height in some (but not all) 48 regions resulting in an overestimate of aerosol concentrations above 6 km. 49 50 [INSERT FIGURE 7.10 HERE] 51 Figure 7.10: Comparison of BC profiles as measured during the ARCTAS, HIPPO1 and FORCE-A campaigns and 52 simulated by a range of global aerosol models. [PLACEHOLDER FOR SECOND ORDER DRAFT: will be updated 53 from AeroCom and CMIP5 models] 54 55 Overall aerosol measurements have been widely used in the evaluation of aerosol models both within the 56 AeroCom activity (e.g., Huneeus et al., 2011b; Kinne et al., 2006; Koch et al., 2009b) and elsewhere (e.g., 57 Mann et al., 2010; Myhre et al., 2007; Wang et al., 2009). This has contributed to continuous model 58 improvement since AR4 but models are still imperfect [PLACEHOLDER FOR SECOND ORDER DRAFT: 59
First Order Draft Chapter 7 IPCC WGI Fifth Assessment Report
Do Not Cite, Quote or Distribute 7-30 Total pages: 121
AeroCom reference]. In a few studies the measurements are also used directly to improve aerosol 1 distributions through data assimilation (e.g., Benedetti et al., 2009; Huneeus et al., 2011a). The lack of an 2 observational constraint on the pre-industrial aerosol distribution is a continuous source of uncertainty when 3 estimating aerosol radiative forcing. 4 5 7.3.5 Aerosol Radiative Effects 6 7 7.3.5.1 Direct Radiative Effect 8 9 Direct radiative effect (DRE) is the change in radiative flux caused by the combined direct effect of all 10 anthropogenic and natural aerosols. The physics behind the DRE is robust and the DRE is close to being an 11 observable quantity, yet our knowledge of aerosol and environmental characteristics needed to quantify the 12 DRE at the global scale remains incomplete (Anderson et al., 2005; Jaegle et al., 2011; Satheesh and 13 Moorthy 2005). The DRE of aerosols depends on the distribution of their optical properties and the 14 scattering and absorbing properties of the environment (i.e., surface, atmospheric molecules and clouds) as 15 illustrated on Figure 7.7. More specifically the DRE requires the knowledge of the spectral variations in 16 aerosol extinction coefficient, single scattering albedo and phase function, which can in principle be 17 estimated from the aerosol size distribution, shape, chemical composition and the state of mixing. In the 18 solar spectrum, the DRE is typically negative at the top-of-atmosphere but gets weaker and can become 19 positive with increasing aerosol absorption, decreasing upscatter fraction, or increasing albedo of the 20 underlying surface. DRE is largest in cloud-free conditions, but can be significant in the presence of a thin 21 cloud layer. Top-of-atmosphere DRE can become positive when the aerosols are located above clouds (e.g., 22 Chand et al., 2009). The DRE at the surface is almost always negative and its magnitude can be much larger 23 than the DRE at top-of-atmosphere when there is aerosol absorption (Li et al., 2010). In the longwave 24 spectrum, the DRE is generally positive at the top-of-atmosphere but is only significant for desert dust and 25 sea-salt (Reddy et al., 2005). 26 27 There have been many measurement-based estimates of the DRE (Bauer et al., 2011; Bergamo et al., 2008; 28 Di Biagio et al., 2010; Yu et al., 2006) although some studies involve some degree of modelling. There is 29 generally a good agreement between observed and calculated shortwave radiative fluxes when aerosol 30 properties are known (e.g., Osborne et al., 2011). Global observational estimates of the DRE rely on satellite 31 remote sensing of aerosol properties and/or measurements of the Earth’s radiative budget (Chen et al., 2011; 32 Haywood et al., 2011). The shortwave clear-sky top-of-atmosphere DRE over the ocean is estimated to be in 33 a range from –4 to –6 W m–2, with sea-salt being the main contributor (Bellouin et al., 2005; Loeb and 34 Manalo-Smith 2005; Myhre et al., 2007; Yu et al., 2006). Uncertainties are larger over land because satellite 35 retrievals are more difficult and the surface is less well characterised (Chen et al., 2009; Jethva et al., 2009) 36 despite recent progress in inversion algorithms (e.g., Dubovik et al., 2011). Attempts to estimate the DRE in 37 cloudy-sky remain elusive (e.g., Peters et al., 2011) although remote sensing of aerosols over clouds is now 38 possible from passive (Waquet et al., 2009) and active (Omar et al., 2009) methods. Notable areas of positive 39 DRE include the Arctic, where absorbing fossil-fuel aerosols overlie ice surfaces (Stone et al., 2008), and off 40 the shore of Namibia, where absorbing biomass-burning aerosols seasonally overlie stratocumulus clouds. 41 While AOD and aerosols size are relatively well constrained, uncertainties in the aerosol single-scattering 42 albedo (Loeb and Su, 2010) and vertical profile (e.g., Zarzycki and Bond, 2010) contribute significantly to 43 the overall uncertainties in DRE, especially for all-sky estimates. 44 45 7.3.5.2 Aerosol Semi-Direct Effect and its Impact on Precipitation 46 47 BC, dust and other absorbing aerosols perturb the temperature structure of the atmosphere through radiative 48 heating, modify the surface fluxes, and thus can influence cloud cover, precipitation and atmospheric 49 dynamics. This effect, known as the semi-direct effect, can be considered as a rapid response associated to 50 the direct effect and as such it can be accounted for through the concept of AF introduced in Chapters 1 and 51 8. Denman et al. (2007) assessed the semi-direct aerosol forcing to be small and of indeterminate sign and 52 attached a very low understanding to it. This very low understanding resulted from the differences between 53 cloud resolving and global model studies. 54 55 Since AR4 the observational evidence for the semi-direct effect has strengthened. There are additional 56 observations of variations in cloud cover correlating with variations in the amount of absorbing aerosols 57
First Order Draft Chapter 7 IPCC WGI Fifth Assessment Report
Do Not Cite, Quote or Distribute 7-31 Total pages: 121
(e.g., Brioude et al., 2009; Wilcox, 2010) for which the semi-direct effect has been offered as an explanation. 1 Such a causal effect between aerosol atmospheric heating (and surface cooling) and cloudiness has been 2 confirmed by modelling studies on eddy-resolving, regional and global scale, which have revealed a more 3 complicated picture than initially anticipated (e.g., Hill and Dobbie, 2008; Sakaeda et al., 2011; Zhuang et 4 al., 2010). 5 6 Absorbing aerosol modifies atmospheric stability; the effect of this on cloud cover depends on the height of 7 the aerosol relative to the clouds (Allen and Sherwood, 2010; Yoshimori and Broccoli, 2008). Both 8 scattering and absorbing aerosols are very effective at reducing the downwelling solar radiation at the 9 surface such that their changes contribute to solar dimming and brightening (see also Chapter 2). Balance in 10 the net surface radiation therefore requires that either the upwelling surface sensible or latent heat fluxes 11 decrease. Over land, where surface heating is a primary driver for convective clouds, this will affect cloud 12 fraction and depth. Together the mechanisms of stabilisation and reduction in surface fluxes provide a means 13 for aerosols to significantly modify the cloud fraction of surface-forced continental clouds (Feingold et al., 14 2005; Sakaeda et al., 2011). The microphysical properties of the cloud can modify entrainment rates and 15 have also been shown to affect the semi direct effect when BC occurs within the cloud layer (Hill and 16 Dobbie, 2008). 17 18 Cloud cover is expected to decrease if absorbing aerosol is embedded in the cloud layer. This has been 19 observed (Koren et al., 2004) and simulated (e.g., Feingold et al., 2005) for clouds over the Amazon forest in 20 the presence of smoke aerosols. In the stratocumulus regime, absorbing aerosol above cloud-top strengthens 21 the temperature inversion, reduces entrainment and tends to enhance cloudiness. Satellite observations 22 (Wilcox, 2010) and modelling (Johnson et al., 2004) of marine stratocumulus show a thickening of the cloud 23 layer beneath layers of absorbing smoke aerosol, which gives a local negative semi-direct effect. 24 25 GCMs lack the ability of large eddy simulation models to represent smaller scale cloud processes and this 26 gives low confidence in their ability to simulate the semi-direct effect (Johnson, 2005). Conversely, the 27 GCM response allows for large scale circulation changes that can have significant additional effects which 28 are not captured in large eddy models. Importantly, GCM results have shown that semi-direct effects are not 29 confined to absorbing aerosol, CO2 and potentially all mechanisms have an associated tropospheric 30 adjustment (Section 7.2.4.3.6). Further, the semi-direct effect is not only associated with cloud changes that 31 are co-located with the forcing, it also leads to circulation changes that effect clouds and land surface 32 properties remotely. 33 34 There is a clear link between changes in atmospheric heating and global mean precipitation changes 35 (Andrews et al., 2010; Lambert and Allen, 2009; Liepert and Previdi, 2009; Stephens and Ellis, 2008; 36 Takahashi, 2009; Wild and Liepert, 2010). Andrews et al. (2010) showed that absorbing aerosols lead to an 37 initial reduction in global precipitation which is not completely offset by the slow global precipitation 38 change that responds linearly to the global mean surface temperature change. 39 40 7.3.5.3 Estimates of Aerosol Radiative and Adjusted Forcings 41 42 Building on our understanding of aerosol concentration distributions (Section 7.3.4) and their radiative 43 effects (Sections 7.3.5.1 and 7.3.5.2), the section combines the direct RF with the adjustment effect to 44 produce an AF. The subsection additionally assesses the forcings from absorbing aerosol (BC and dust) on 45 both snow and ice. 46 47 In Forster et al. (2007) these adjustment effects were not included in the forcing term but were evaluated as 48 part of the response. Instead, adjustment was accounted for by applying an efficacy term that modified the 49 climate sensitivity. For consistency with Chapter 8, all quoted ranges represent a 2-σ uncertainty (i.e., 5% to 50
95% probability and we evaluate radiative forcings between 1750 and ~2010. Note that for several aerosol 51 species (such as biomass burning) this does not quite equate to the anthropogenic effect as emissions started 52 to be influenced by humans before the industrial revolution. Many models estimate the aerosol radiative 53 forcings between 1850 and present-day and conversion to a radiative forcing between 1750 and present-day 54 contributes to increase the uncertainty (Bellouin et al., 2008). 55 56
First Order Draft Chapter 7 IPCC WGI Fifth Assessment Report
Do Not Cite, Quote or Distribute 7-32 Total pages: 121
The estimate of the total aerosol direct radiative forcing in Forster et al. (2007) combined estimates from 9 1 AeroCom models, 8 other model studies and 3 observationally-based estimates. The model direct radiative 2 forcing was estimated to be –0.4 W m–2 with a 0 to –0.8 W m–2 range. However, the observationally-based 3 estimates gave a more negative radiative forcing, so overall a best estimate for the aerosol direct forcing was 4 given as –0.5 ± 0.4 W m–2. Due to the extra evidence from observations for the total forcing there was more 5 confidence placed in the total aerosol direct forcing than in that from individual aerosol species. 6 7 Observationally-based estimates of the direct RF are not completely independent of global aerosol models 8 (Loeb and Su, 2010; Myhre, 2009). They employ satellite data of aerosol optical depth in combination with 9 either aerosol optical properties from AERONET (Bellouin et al., 2008) or observationally-derived aerosol 10 radiative efficiency (Quaas et al., 2008). In the observationally-based method, satellite retrieval constraints 11 over land necessitate the use of information from global aerosol models in order to derive the change in 12 AOD that is due to anthropogenic activity. The aerosol optical properties (single scattering albedo and 13 asymmetry factor) have been held constant between preindustrial and present time, and radiative forcing 14 calculations have been performed with radiative transfer schemes (Bellouin et al., 2008), or the aerosol 15 radiative efficiency has been assumed to be constant over the industrial era (Quaas et al., 2008). 16 17 Since AR4 further observationally-based estimates of the total direct radiative forcing have been made. 18 These employ both improved observations and also a more robust methodology for combining with models 19 to infer radiative forcing. Zhao et al. (2008) derived a clear-sky anthropogenic aerosol direct forcing over 20 ocean from a combination of CERES/MODIS data and the GOCART aerosol model finding radiative effects 21 that would broadly agree with equivalent estimates from Bellouin et al., (2008). Two studies (Bellouin et al., 22 2008; Myhre, 2009) identified a number of causes for the larger magnitude in the observationally-based 23 radiative forcing estimate compared with modelling-based estimates within AR4. Compared to Bellouin et 24 al., (2005), Bellouin et al., (2008) refined their calculation of the direct radiative forcing using updated 25 satellite retrievals, finding an all sky radiative forcing of –0.65 W m–2. They were able to attribute a more 26 negative observationally-based forcing to i) a positive cloudy-sky direct radiative forcing in the model, ii) the 27 exclusion of high surface albedo regions, and iii) the fact that the model forcing was compared to 1750 rather 28 than present day natural aerosol for the observed estimate. Myhre (2009) extended this analysis and used 29 model results to adjust their observed estimate to make it representative of a globally averaged all-sky 30 present – preindustrial radiative forcing. Making these changes reduced the magnitude of the 31 observationally-based radiative forcing estimate from –0.65 W m–2 to –0.3 ± 0.2 W m–2. An additional 32 comparison of the Oslo model with various observations suggested that the estimate of total direct RF was 33 rather robust, giving increased confidence to their estimate. 34 35 Loeb and Su (2010) have challenged the uncertainty ranges presented in Forster et al. (2007) and Myhre 36 (2009). They use an estimate of present-day AERONET uncertainties in aerosol optical depth, single-37 scattering albedo, asymmetry parameter, aerosol scale height, and anthropogenic fraction. The aerosol 38 optical depth was perturbed by ±0.01, the asymmetry parameter was perturbed by ±0.02, and the single-39 scattering albedo was perturbed by ±0.06 over ocean and ±0.03 over land. The scale height was perturbed by 40 0.8 km and the anthropogenic fraction by 10%. Their analysis does not take into account additional 41 uncertainties in the estimate of direct radiative forcing such as preindustrial emissions. Nevertheless, they 42 find that uncertainties in aerosol optical depth alone can lead to errors of ±0.2 W m–2. The single-scattering 43 albedo error was found to be much more significant, contributing an error of greater than ±0.5 W m–2. Our 44 own assessment of uncertainty (see below) falls between those from past studies, indicating that the Loeb 45 and Su (2010) approach is valid but likely over-estimated the single scattering albedo uncertainty. 46 47 Lohmann et al. (2010) found direct RFs in five GCMs ranged from –0.1 to –0.4 W m–2. A second phase of 48 AeroCom model results is being compiled, based on updated emissions and model codes. Simulations of the 49 secondary components nitrate and SOA are now included in the analysis. Estimates of the radiative forcing 50 for the total anthropogenic direct aerosol effect range from –0.06 to –0.49 W m–2. Figure 7.11 shows the 51 zonal mean total aerosol RF for all participating AeroCom models. Most of the models have a maximum 52 negative radiative forcing around 20–50°N, in the region with highest aerosol concentrations. Several models 53
show a positive radiative forcing at high latitudes due to the higher surface albedo there. We combine our 54 uncertainty analysis with the best estimate of –0.3 W m–2 from the satellite derived estimates, reinforced by 55 the RF from the Lohmann et al. (2010) and the new AeroCom modelling studies, to estimate an aerosol 56 direct RF of –0.3 ± 0.3 W m–2
. 57
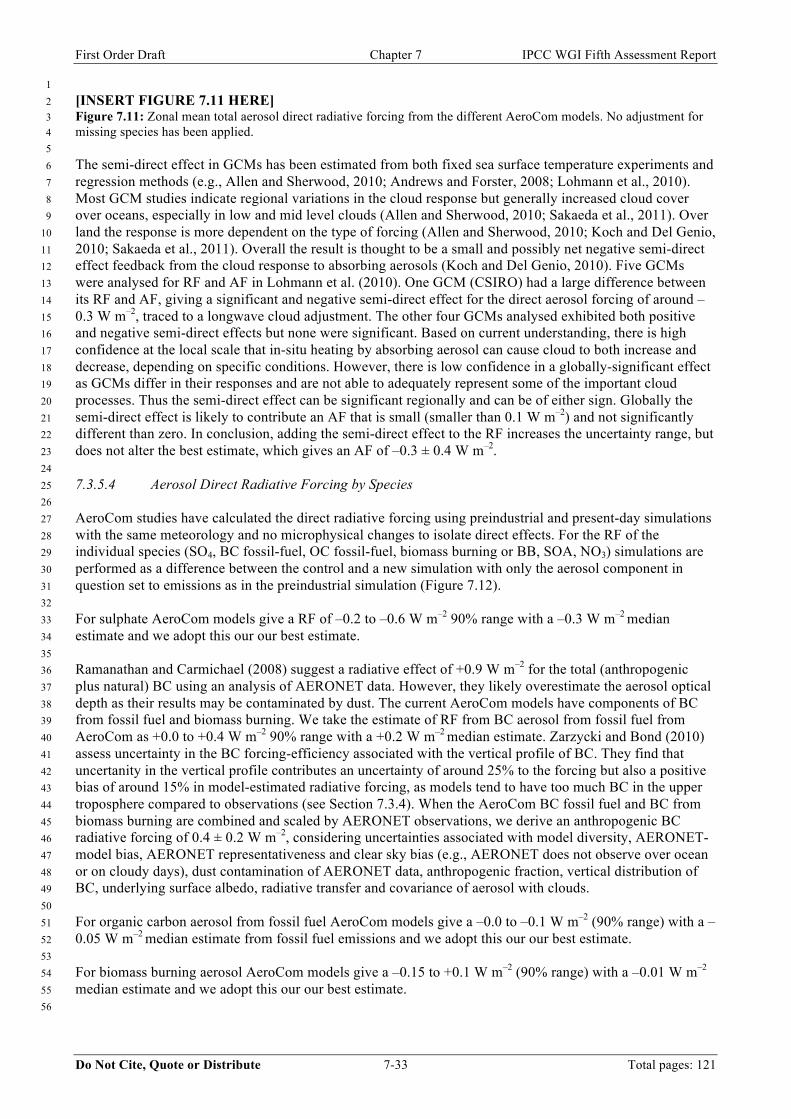
First Order Draft Chapter 7 IPCC WGI Fifth Assessment Report
Do Not Cite, Quote or Distribute 7-33 Total pages: 121
1 [INSERT FIGURE 7.11 HERE] 2 Figure 7.11: Zonal mean total aerosol direct radiative forcing from the different AeroCom models. No adjustment for 3 missing species has been applied. 4 5 The semi-direct effect in GCMs has been estimated from both fixed sea surface temperature experiments and 6 regression methods (e.g., Allen and Sherwood, 2010; Andrews and Forster, 2008; Lohmann et al., 2010). 7 Most GCM studies indicate regional variations in the cloud response but generally increased cloud cover 8 over oceans, especially in low and mid level clouds (Allen and Sherwood, 2010; Sakaeda et al., 2011). Over 9 land the response is more dependent on the type of forcing (Allen and Sherwood, 2010; Koch and Del Genio, 10 2010; Sakaeda et al., 2011). Overall the result is thought to be a small and possibly net negative semi-direct 11 effect feedback from the cloud response to absorbing aerosols (Koch and Del Genio, 2010). Five GCMs 12 were analysed for RF and AF in Lohmann et al. (2010). One GCM (CSIRO) had a large difference between 13 its RF and AF, giving a significant and negative semi-direct effect for the direct aerosol forcing of around –14 0.3 W m–2, traced to a longwave cloud adjustment. The other four GCMs analysed exhibited both positive 15 and negative semi-direct effects but none were significant. Based on current understanding, there is high 16 confidence at the local scale that in-situ heating by absorbing aerosol can cause cloud to both increase and 17 decrease, depending on specific conditions. However, there is low confidence in a globally-significant effect 18 as GCMs differ in their responses and are not able to adequately represent some of the important cloud 19 processes. Thus the semi-direct effect can be significant regionally and can be of either sign. Globally the 20 semi-direct effect is likely to contribute an AF that is small (smaller than 0.1 W m–2) and not significantly 21 different than zero. In conclusion, adding the semi-direct effect to the RF increases the uncertainty range, but 22 does not alter the best estimate, which gives an AF of –0.3 ± 0.4 W m–2. 23 24 7.3.5.4 Aerosol Direct Radiative Forcing by Species 25 26 AeroCom studies have calculated the direct radiative forcing using preindustrial and present-day simulations 27 with the same meteorology and no microphysical changes to isolate direct effects. For the RF of the 28 individual species (SO4, BC fossil-fuel, OC fossil-fuel, biomass burning or BB, SOA, NO3) simulations are 29 performed as a difference between the control and a new simulation with only the aerosol component in 30 question set to emissions as in the preindustrial simulation (Figure 7.12). 31 32 For sulphate AeroCom models give a RF of –0.2 to –0.6 W m–2 90% range with a –0.3 W m–2 median 33 estimate and we adopt this our our best estimate. 34 35 Ramanathan and Carmichael (2008) suggest a radiative effect of +0.9 W m–2 for the total (anthropogenic 36 plus natural) BC using an analysis of AERONET data. However, they likely overestimate the aerosol optical 37 depth as their results may be contaminated by dust. The current AeroCom models have components of BC 38 from fossil fuel and biomass burning. We take the estimate of RF from BC aerosol from fossil fuel from 39 AeroCom as +0.0 to +0.4 W m–2 90% range with a +0.2 W m–2 median estimate. Zarzycki and Bond (2010) 40 assess uncertainty in the BC forcing-efficiency associated with the vertical profile of BC. They find that 41 uncertanity in the vertical profile contributes an uncertainty of around 25% to the forcing but also a positive 42 bias of around 15% in model-estimated radiative forcing, as models tend to have too much BC in the upper 43 troposphere compared to observations (see Section 7.3.4). When the AeroCom BC fossil fuel and BC from 44 biomass burning are combined and scaled by AERONET observations, we derive an anthropogenic BC 45 radiative forcing of 0.4 ± 0.2 W m–2, considering uncertainties associated with model diversity, AERONET-46 model bias, AERONET representativeness and clear sky bias (e.g., AERONET does not observe over ocean 47 or on cloudy days), dust contamination of AERONET data, anthropogenic fraction, vertical distribution of 48 BC, underlying surface albedo, radiative transfer and covariance of aerosol with clouds. 49 50 For organic carbon aerosol from fossil fuel AeroCom models give a –0.0 to –0.1 W m–2 (90% range) with a –51 0.05 W m–2 median estimate from fossil fuel emissions and we adopt this our our best estimate. 52 53 For biomass burning aerosol AeroCom models give a –0.15 to +0.1 W m–2 (90% range) with a –0.01 W m–2 54 median estimate and we adopt this our our best estimate. 55 56
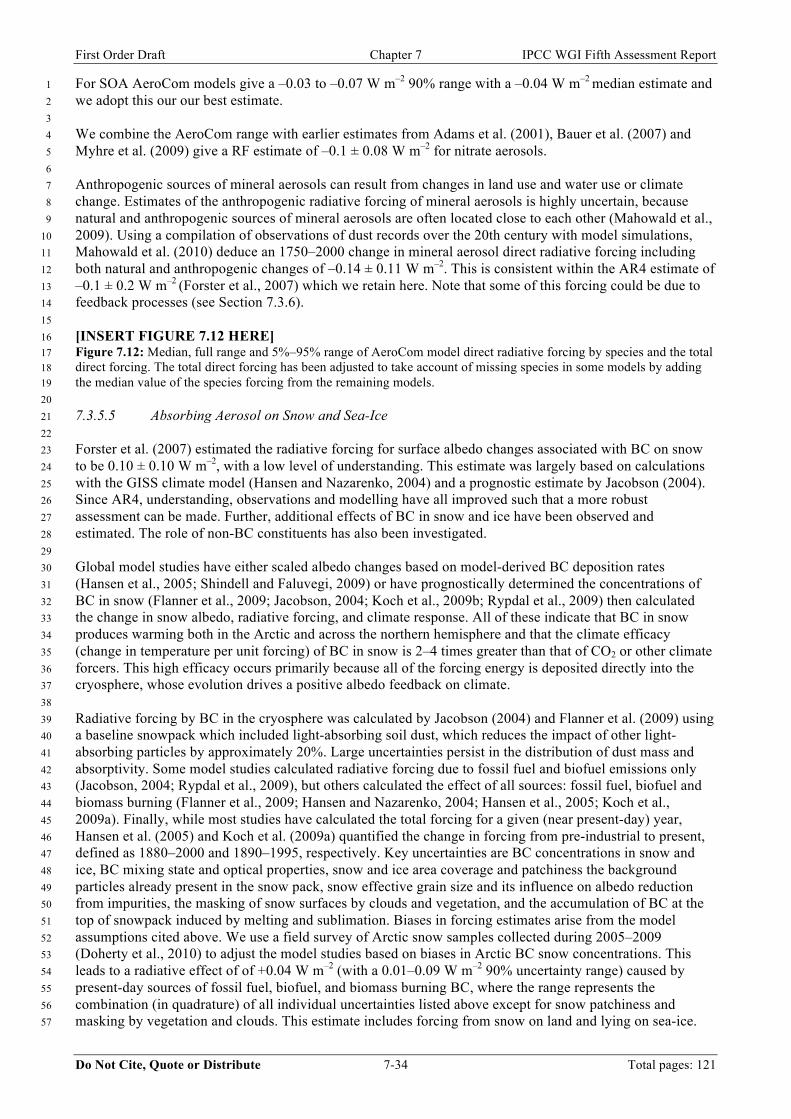
First Order Draft Chapter 7 IPCC WGI Fifth Assessment Report
Do Not Cite, Quote or Distribute 7-34 Total pages: 121
For SOA AeroCom models give a –0.03 to –0.07 W m–2 90% range with a –0.04 W m–2 median estimate and 1 we adopt this our our best estimate. 2 3 We combine the AeroCom range with earlier estimates from Adams et al. (2001), Bauer et al. (2007) and 4 Myhre et al. (2009) give a RF estimate of –0.1 ± 0.08 W m–2 for nitrate aerosols. 5 6 Anthropogenic sources of mineral aerosols can result from changes in land use and water use or climate 7 change. Estimates of the anthropogenic radiative forcing of mineral aerosols is highly uncertain, because 8 natural and anthropogenic sources of mineral aerosols are often located close to each other (Mahowald et al., 9 2009). Using a compilation of observations of dust records over the 20th century with model simulations, 10 Mahowald et al. (2010) deduce an 1750–2000 change in mineral aerosol direct radiative forcing including 11 both natural and anthropogenic changes of –0.14 ± 0.11 W m–2. This is consistent within the AR4 estimate of 12 –0.1 ± 0.2 W m–2 (Forster et al., 2007) which we retain here. Note that some of this forcing could be due to 13 feedback processes (see Section 7.3.6). 14 15 [INSERT FIGURE 7.12 HERE] 16 Figure 7.12: Median, full range and 5%–95% range of AeroCom model direct radiative forcing by species and the total 17 direct forcing. The total direct forcing has been adjusted to take account of missing species in some models by adding 18 the median value of the species forcing from the remaining models. 19 20 7.3.5.5 Absorbing Aerosol on Snow and Sea-Ice 21 22 Forster et al. (2007) estimated the radiative forcing for surface albedo changes associated with BC on snow 23 to be 0.10 ± 0.10 W m–2, with a low level of understanding. This estimate was largely based on calculations 24 with the GISS climate model (Hansen and Nazarenko, 2004) and a prognostic estimate by Jacobson (2004). 25 Since AR4, understanding, observations and modelling have all improved such that a more robust 26 assessment can be made. Further, additional effects of BC in snow and ice have been observed and 27 estimated. The role of non-BC constituents has also been investigated. 28 29 Global model studies have either scaled albedo changes based on model-derived BC deposition rates 30 (Hansen et al., 2005; Shindell and Faluvegi, 2009) or have prognostically determined the concentrations of 31 BC in snow (Flanner et al., 2009; Jacobson, 2004; Koch et al., 2009b; Rypdal et al., 2009) then calculated 32 the change in snow albedo, radiative forcing, and climate response. All of these indicate that BC in snow 33 produces warming both in the Arctic and across the northern hemisphere and that the climate efficacy 34 (change in temperature per unit forcing) of BC in snow is 2–4 times greater than that of CO2 or other climate 35 forcers. This high efficacy occurs primarily because all of the forcing energy is deposited directly into the 36 cryosphere, whose evolution drives a positive albedo feedback on climate. 37 38 Radiative forcing by BC in the cryosphere was calculated by Jacobson (2004) and Flanner et al. (2009) using 39 a baseline snowpack which included light-absorbing soil dust, which reduces the impact of other light-40 absorbing particles by approximately 20%. Large uncertainties persist in the distribution of dust mass and 41 absorptivity. Some model studies calculated radiative forcing due to fossil fuel and biofuel emissions only 42 (Jacobson, 2004; Rypdal et al., 2009), but others calculated the effect of all sources: fossil fuel, biofuel and 43 biomass burning (Flanner et al., 2009; Hansen and Nazarenko, 2004; Hansen et al., 2005; Koch et al., 44 2009a). Finally, while most studies have calculated the total forcing for a given (near present-day) year, 45 Hansen et al. (2005) and Koch et al. (2009a) quantified the change in forcing from pre-industrial to present, 46 defined as 1880–2000 and 1890–1995, respectively. Key uncertainties are BC concentrations in snow and 47 ice, BC mixing state and optical properties, snow and ice area coverage and patchiness the background 48 particles already present in the snow pack, snow effective grain size and its influence on albedo reduction 49 from impurities, the masking of snow surfaces by clouds and vegetation, and the accumulation of BC at the 50 top of snowpack induced by melting and sublimation. Biases in forcing estimates arise from the model 51 assumptions cited above. We use a field survey of Arctic snow samples collected during 2005–2009 52 (Doherty et al., 2010) to adjust the model studies based on biases in Arctic BC snow concentrations. This 53 leads to a radiative effect of of +0.04 W m–2 (with a 0.01–0.09 W m–2 90% uncertainty range) caused by 54 present-day sources of fossil fuel, biofuel, and biomass burning BC, where the range represents the 55 combination (in quadrature) of all individual uncertainties listed above except for snow patchiness and 56 masking by vegetation and clouds. This estimate includes forcing from snow on land and lying on sea-ice. 57
First Order Draft Chapter 7 IPCC WGI Fifth Assessment Report
Do Not Cite, Quote or Distribute 7-35 Total pages: 121
About 80% of this forcing is exerted on land-based snow (Flanner et al., 2007; Flanner et al., 2009). We also 1 make a crude estimate of the effect of BC within snow-free sea ice, estimating a present-day effect of +0.010 2 (0.003–0.032) W m–2, leading to a combined (snow and sea-ice) present-day cryosphere radiative effect from 3 BC of +0.05 W m–2. Finally, by scaling the forcing contributions from biomass burning, biofuel, and fossil 4 fuel BC emissions according to their 1750–2010 changes, we arrive at an industrial-era RF estimate of +0.04 5 (0.01–0.10) W m–2 for the combined influence of BC in sea-ice and in snow overlying land and sea-ice. Note 6 that not all of this RF is necessarily directly anthropogenic. 7 8 Filter measurements indicate that a large fraction of the aerosol light absorption (~30–50%) in Arctic snow is 9 due to non-BC constituents (Flanner et al., 2009). Other studies show that dust is the dominant source of 10 light absorption in some continental snowpacks (Painter et al., 2010). Moreover, Hegg et al. (2010) attribute 11 most of the non-BC light absorption in Arctic snow samples to brown carbon (BrC), with crop and biomass 12 burning identified as the primary sources. These agents also contribute a positive snow radiative forcing, 13 although some of this absorption may be implicitly accounted for in the BC emission inventories applied in 14 modelling studies. As it is not clear to which extent changes in dust emissions are anthropogenically driven 15 we refrain from providing a RF best estimate for the effect of anthropogenic dust on snow and sea-ice, but it 16 is considerably smaller than the effect of BC (Flanner et al., 2009). 17 18 In summary we assess that anthropogenic absorbing aerosols (BC/BrownC) on snow/ice are responsible for a 19 positive RF of +0.04 W m–2, with a 0.01–0.10 W m–2 5%–95% uncertainty range. It is important to note that 20 this forcing is 2–4 time more effective at causing global mean temperature changes than an equivalent 21 forcing from CO2. 22 23 7.3.6 Aerosol-Climate Feedbacks 24 25 7.3.6.1 Introduction 26 27 Changes in climate parameters can modify the sources of natural aerosols and the atmospheric lifetime of 28 anthropogenic and natural aerosols, which may in turn feedback on the climate system through their 29 interactions with radiation and cloudiness and their contribution to nutrient cycling (Carslaw et al., 2010; 30 Jickells et al., 2005, see also Chapter 6). The climate drivers of changes in aerosols can be split into physical 31 changes (temperature, humidity, precipitation, soil wetness, solar radiation, wind speed, sea ice extent, 32 etc…), chemical changes (availability of oxidants) and biological changes (vegetation cover and properties, 33 plankton abundance and speciation, etc…). The response of aerosols to climate change may constitute a 34 feedback loop whereby climate processes amplify or dampen the initial perturbation. We will assess here the 35 relevance and strength of aerosol-climate feedbacks in the context of future climate change scenarios. 36
37 7.3.6.2 Changes in Aerosol Concentrations with Climate 38 39 7.3.6.2.1 Sea salt and mineral dust 40 Climate change influence atmospheric burden of sea salt by altering emissions, transport, and deposition. 41 There is no agreement among climate models about the strength of such an effect, with estimates ranging 42 from an overall 19% reduction in global sea salt burden from the present-day to year 2100 (Liao et al., 2006) 43 because of a reduction in surface wind speed and an increase in scavenging, to little sensitivity (Mahowald et 44 al., 2006a), or a sizeable increase in Bellouin et al. (2011) because of a decrease in sea ice cover despite a 45 decrease in wind speed over most of the tropical and mid-latitude oceans (Jones et al., 2007). Given that sea 46 salt particles comprise a significant fraction of CCN concentrations over the oceans, such large changes are 47 likely to feedback on climate through changes in cloud drop number (Korhonen et al., 2010b). There is little 48 understanding on how surface wind speed may change over the ocean in a warmer climate with some 49 observations suggesting an increase in wind speed over the last two decades (Young et al., 2011) and some 50 models predicting a widespread decrease in ice-free oceanic regions. 51 52 Studies of the effects of climate change on dust loadings give a wide range of results from large increases 53 (e.g., Woodward et al. (2005) find a factor of 3 increase in 2100) to moderate (–10 to –20%) increase or 54 decrease (e.g., Liao et al., 2006; Liao et al., 2009; Tegen et al., 2004) and to large decreases (e.g., Mahowald 55 and Luo (2003) and Mahowald et al. (2006b) find a 60% decrease under double CO2 concentration). The 56 large range reflects different responses of the atmosphere and vegetation cover to climate change forcings. 57
First Order Draft Chapter 7 IPCC WGI Fifth Assessment Report
Do Not Cite, Quote or Distribute 7-36 Total pages: 121
For example, Mahowald (2007) found that the consideration of the CO2 fertilization effect is important for 1 predicting desert response to future climate change. 2
3 7.3.6.2.2 Sulfate, ammonium and nitrate aerosols 4 5 The magnitude and sign of the DMS-sulfate-cloud-climate feedback loop remain uncertain despite two 6 decades of research (see Ayers and Cainey, 2007 and Carslaw et al., 2010 for a review). It is now realized 7 that the feedback could operate in numerous ways through changes in temperature, solar radiation dose, 8 mixed layer depth and nutrient recycling, sea-ice extent, wind speed, shift in marine ecosystems due to ocean 9 acidification and climate change, atmospheric processing of DMS into CCN, and no study has included all 10 the relevant effects. There is however some consistency among Earth System models to simulate a weak 11 feedback due to i) a weak sensitivity of DMS production to climate change, and ii) a weak sensitivity of 12 CCN population to changes in DMS emissions (Carslaw et al., 2010; Woodhouse et al., 2008). However 13 regional effects could be larger (Bopp et al., 2004). 14 15 In the atmosphere chemical production of sulfate increases with temperature (Aw and Kleeman, 2003; 16 Dawson et al., 2007; Kleeman, 2008), due to faster SO2 oxidation (higher rate constants and higher oxidant 17 concentrations). Changes in O3 and H2O2 with climate also influence sulfate through in-cloud sulfate 18 formation. Most studies to date predicted a reduction of 0–9% in global sulfate burden, mainly because of 19 the future increases in precipitation (Liao et al., 2006; Pye et al., 2009; Racherla and Adams, 2006; Unger et 20 al., 2006). However Rae et al. (2007) found a small increase in global sulfate burden from 2000–2100 21 because the simulated future precipitation was reduced in regions of high sulphate abundance. 22 23 Changes in temperature have a large impact on nitrate aerosol formation by shifting of aerosol 24 thermodynamic equilibrium, because more HNO3 remains in the gas-phase in a warmer climate. There is 25 some agreement among global aerosol models that climate change will contribute to decrease nitrate 26 concentrations (Bellouin et al., 2011; Liao et al., 2006; Pye et al., 2009; Racherla and Adams, 2006) with the 27 exception of Bauer et al. (2007) who found little change in nitrate for year 2030. It should be noted however 28 that changes in precursor emissions are likely to increase nitrate concentrations in the future (Bellouin et al., 29 2011). 30
31 Changes in sulfate and nitrate influence ammonium aerosol formation. The burden of ammonium was 32 predicted to decrease by about 5% in Pye et al. (2009) from present day to 2050 under the A1B scenario. 33 Changes in ammonium in Pye et al. (2009) are milder than those predicted by Racherla and Adams (2006) 34 and likely reflect the fact that the sulfate burden is relatively insensitive to climate change under the A1B 35 scenario. 36
37 7.3.6.2.3 Carbonaceous aerosols 38 Natural emissions of carbonaceous aerosols, such as wild fires and biogenic emissions are climate sensitive. 39 There is evidence that future climate change could lead to increases in the occurrence of wildfires because of 40 changes in fuel availability, readiness of the fuel to burn and ignition sources (Kloster et al., 2010; Marlon et 41 al., 2008; Mouillot et al., 2006; Pechony and Shindell, 2010). However vegetation dynamics may also play a 42 role which is not well understood. Increased fire occurrence would increase aerosol emissions, but decrease 43 BVOC emissions. This could lead to a small positive or negative radiative effect (and feedback) depending 44 on the sign of the net impact by biomass burning aerosols (Carslaw et al., 2010). 45 46 A large fraction of secondary organic carbon aerosol form from the oxidation of isoprene, sesquiterpenes and 47 monoterpenes from biogenic sources. Emissions from vegetation can increase in a warmer atmosphere, 48 everything else being constant (Guenther et al., 2006). Global aerosol models simulate an increase in 49 isoprene emissions of 22–55% by 2100 in response to T change (Heald et al., 2008; Liao et al., 2006; 50 Sanderson et al., 2003) and a change in global SOA burden of –6% to +11% through the climate-induced 51 changes in aerosol processes and removal rates (Heald et al., 2008; Liao et al., 2006; Tsigaridis and 52 Kanakidou, 2007). Increasing CO2 concentrations are believed to inhibit BVOC emissions (Arneth et al., 53 2007) which could offset the T effect and adds significant uncertainty to future emissions. Future changes in 54 vegetation cover, whether they are natural and anthropogenic, also introduce large uncertainty, with either a 55 decrease (forest to cropland) or increase (some biofuels plantation) in emissions (Lathière et al., 2010). There 56
First Order Draft Chapter 7 IPCC WGI Fifth Assessment Report
Do Not Cite, Quote or Distribute 7-37 Total pages: 121
is little understanding on how the marine source of organic aerosol may change with climate, 1 notwithstanding the large range of emission estimates for the present day (Carslaw et al., 2010). 2 3 7.3.6.3 Synthesis 4 5 There is no robust evidence to suggest that future changes in emissions of natural aerosols (or their 6 precursors) could represent a significant climate feedback during the 21st century; the feedback factor is 7 mostly bracketed within ±0.1 W m–2 K–1 (Carslaw et al., 2010). While some models simulate large changes 8 (such as for dust emissions), these simulations are also associated with large uncertainties and there is little 9 to no agreement among models. There is conflicting evidence of the strength of the feedback associated with 10 future changes in precipitation and aerosol scavenging with one study (Liao et al., 2009) showing a 11 significant positive feedback (feedback parameter of +0.04 to +0.15 W m–2 K–1 on a global mean basis) and 12 other studies simulating smaller feedback of –0.02 to –0.08 W m–2 K–1 (Bellouin et al., 2011). However such 13 feedbacks may be important for climate at the regional scale. 14 15 7.4 Aerosol-Cloud Interactions 16 17 7.4.1 Introduction 18 19 This section assesses our understanding of aerosol-cloud-precipitation interactions, emphasizing the ways in 20 which anthropogenic aerosols may be affecting the distribution of clouds and precipitation. The idea that 21 anthropogenic aerosols are changing cloudiness, and hence the planetary albedo, and thus contribute a 22 substantial radiative forcing to the climate system is a longstanding one. For these reasons aerosol-cloud 23 interactions have been addressed to varying degrees in all of the previous assessment reports. 24 25 Since the AR4, research has continued to articulate new pathways through which the aerosol may affect the 26 radiative properties of clouds, but also (and increasingly so) patterns of precipitation (Rosenfeld et al., 2008), 27 Global-scale modelling has advanced in its ability to represent a greater diversity of aerosol-cloud 28 interactions, and with greater consistency. Observational studies continue to document strong local 29 correlations between aerosol proxies and clouds or precipitation, but have become more quantitative and are 30 increasingly identifying the methodological challenges associated with such correlations. Fine-scale 31 modelling studies have begun to be used in a systematic manner, and among other things have shown how 32 turbulent mixing, cloud and regional-scale circulations may buffer the effects of aerosol perturbations 33 (Stevens and Feingold, 2009). 34 35 Aerosol-cloud interactions are highly heterogeneous and transient, which further complicates their 36 quantification. While the top-of-atmosphere radiative effect is a well-established measure of the net impact 37 of aerosol-cloud interactions on global temperatures (Lohmann and Feichter, 2005), no similar framework 38 has yet established for addressing the hydrological and/or local effects of climatic perturbations. Global-39 mean precipitation is constrained approximately by the surface energy budget, hence an analogous 40 framework developed around the adjusted surface forcing has been suggested (Andrews et al., 2010). But 41 interest in precipitation tends to be local, where changes in horizontal energy transport within the atmosphere 42 dominate over those of the surface energy budget (Muller et al., 2011). The idea of precipitation 43 susceptibility, how the surface precipitation changes locally as a function of the aerosol burden, has been 44 developed with these interests in mind (Feingold and Siebert, 2009), and as an extension of the idea of 45 albedo susceptibility which has been used to explore the regional diversity of radiative effects stemming 46 from aerosol-cloud interactions. 47 48 The remainder of this introductory section presents an overview of the framework through which the 49 climatic effect of aerosol cloud interactions will be assessed, and highlights some of the general advances, 50 and remaining challenges that face this topic of inquiry. In the subsequent sections advancements in our 51 more specific understanding of aerosol-cloud, or aerosol-precipitation, interactions are assessed, from the 52 perspective of their overall impact on the climate system. 53 54 7.4.1.1 Overview and Classification of Hypothesized Aerosol-Cloud Interactions 55 56
First Order Draft Chapter 7 IPCC WGI Fifth Assessment Report
Do Not Cite, Quote or Distribute 7-38 Total pages: 121
Denman et al. (2007) catalogued several possible contributions to aerosol indirect effects. Given the number 1 of possible aerosol-cloud interactions, and the difficulty of isolating them individually, we see little value in 2 attempting to assess each effect in isolation especially since modelling studies suggest that the effects may 3 interact and compensate (Morrison and Grabowski, 2011; Stevens and Feingold, 2009). Instead, we group all 4 radiative consequences of aerosol-cloud interactions into two broad categories: the immediate impact on 5 radiative forcing in the absence of macrophysical changes to clouds, denoted “indirect radiative forcing” 6 (iRF), and the final result including follow-on impacts of macrophysical responses to the initial change, 7 denoted “indirect adjusted forcing” (iAF). The iRF represents the classical “Twomey” or cloud albedo effect 8 whereby greater CCN numbers increase the droplet surface area, but is extended to include ice clouds and 9 changes in the breadth of the size distribution. It is discussed further in Section 7.4.2. The iAF additionally 10 accounts for any secondary effects that result as clouds adjust to the rapid changes in their environment 11 accompanying an aerosol perturbation (Figure 7.1). Although iAF subsumes iRF, we retain an estimate of 12 iRF for continuity with prior assessments and because it is better understood than the model-dependent 13 effects determining iAF (Section 8.1.1). The iAF includes for example lifetime effects, wherein cloud 14 macrostructure adjusts to changes in cloud microstructure (Albrecht, 1989; Liou and Ou, 1989; Pincus and 15 Baker, 1994). Possible contributions to the iAF from liquid clouds are discussed in Section 7.4.3, separately 16 from those associated with adjustments by ice or mixed phase clouds, which are presented in Section 7.4.4. 17 18 7.4.1.2 Advances and Challenges in Observing Aerosol-Cloud Interactions 19 20 Since the AR4 the characterization of aerosol sources, sinks, and composition has continued to advance. The 21 on-going development of understanding of climate-relevant aerosol properties is reviewed in Section 7.3.3. 22 23 Progress has also been made in understanding how measurement artefacts affect retrievals of both aerosol 24 (Kahn et al., 2005; Tanré et al., 1996; Tanré et al., 1997) and cloud properties (Platnick et al., 2003) in 25 broken fields of clouds. Two key issues are that measurements classified as cloud-free often are not, and that 26 aerosol measured in the vicinity of clouds is significantly different than it would be were the cloud field, and 27 its proximate cause (high humidities), not present. The latter results from hydration effects on aerosol optical 28 properties (Charlson et al., 2007; Twohy et al., 2009), contamination by undetectable cloud fragments 29 (Koren et al., 2007) and the remote (non-columnar) effects of clouds on radiation through scattering (Wen et 30 al., 2007). Photons scattered by cloud edges can interact with clear-sky aerosol layers as far as 15 km away, 31 thereby biasing aerosol retrievals in ways that depend on the prevalence of clouds (Várnai and Marshak, 32 2009). 33 34 The use of active space-based remote sensing has also begun to address the coincidence problem, wherein 35 satellite retrievals using passive sensors are unable to distinguish aerosol layers above or below fields of 36 clouds from those intermingling with the cloud field (Anderson et al., 2005; Huffman et al., 2007; Stephens 37 et al., 2002). Spectral polarization and multi-angular measurements provide much needed information on the 38 phase function of particulate matter in the atmosphere, which can discriminate between clouds and aerosol 39 and thus improve estimates of aerosol loading and absorption (Deuzé et al., 2001; Mishchenko et al., 2007). 40 Field studies (Rauber et al., 2007; Wood et al., 2011) and laboratory investigations (e.g., Stratmann et al., 41 2009) of cloud aerosol interactions also continue to make important contributions to our understanding of 42 how aerosols impact cloud processes. As a result our understanding of the distribution and properties of the 43 aerosol in the vicinity of clouds, continues to improve apace with an appreciation of the limits of this 44 understanding (Anderson et al., 2009). 45 46 The observational challenge of inferring causality from correlation remains a large, and limiting, one. 47 Because the aerosol is a strong function of air-mass history and origin, and is strongly influenced by cloud 48 and precipitation processes (Anderson et al., 2009; Clarke et al., 1999; Petters et al., 2006), and both are 49 affected by meteorology (Engström and Ekman, 2010), correlations between the aerosol and cloud, or 50 precipitation, cannot be taken as generally indicating a meteorological response to the aerosol. Furthermore, 51 attempts to control for other important factors (air-mass history or cloud dynamical processes) are limited by 52 a lack of understanding of cloud controlling factors in the first place (Anderson et al., 2009; Siebesma et al., 53 2009; Stevens and Brenguier, 2009). These problems greatly undermine confidence in observationally based 54 inferences of aerosol effects on clouds and precipitation and must be considered with caution or interpreted 55 with suitable models. 56
57
First Order Draft Chapter 7 IPCC WGI Fifth Assessment Report
Do Not Cite, Quote or Distribute 7-39 Total pages: 121
7.4.1.3 Advances and Challenges in Modelling Aerosol-Cloud Interactions 1 Fine-scale models, capable of resolving cloud-scale circulations have greatly advanced as a tool for testing 2 the physical mechanisms proposed to govern aerosol-cloud-precipitation interactions (Ackerman et al., 2009; 3 vanZanten et al., 2011). Aerosol-cloud interactions in climate models have largely been introduced based on 4 simple calculations or highly idealized models (e.g., Albrecht, 1989; Pincus and Baker, 1994; Twomey, 5 1977). A general finding from explicit numerical simulations of clouds is that various aerosol impact 6 mechanisms tend to be mediated (and often buffered) by interactions across scales not included in the 7 idealized models that gave rise to the original idea (Stevens and Feingold, 2009). Specific examples involve 8 the interplay between the drop-size distribution and mixing processes that determine cloud macrostructure 9 (Ackerman et al., 2004; Bretherton et al., 2007; Small et al., 2009; Stevens et al., 1998; Wood, 2007), or the 10 dependence of precipitation development in stratiform clouds on details of the vertical structure of the cloud 11 (Wood, 2007). As a result it is more likely than not the physical system is less sensitive to aerosol 12 perturbations than are large-scale models. 13 14 The representation of aerosol effects in large-scale models has also advanced. Most global models now 15 represent an increasing number of hypothesized aerosol-cloud interactions, and through comparisons to data 16 and to other models their evaluation has greatly advanced (Quaas et al., 2009b). In particular, global models 17 are beginning to represent effects in convective, ice and mixed-phase clouds (e.g., Lohmann, 2008) and as 18 described below in more detail. In addition “superparameterisation” approaches (Section 7.2.3.5.2) hold 19 promise for treating aerosol-cloud interactions more comprehensively, but are computationally very 20 expensive and have yet to be systematically applied to this problem. 21 22 Although advances have been considerable, the challenges remain formidable. The representation of clouds 23 in large-scale models remains primitive (Section 7.2) and even if large-scale models were able to represent 24 clouds with greater fidelity, fine-scale modelling suggests that the outcome of an aerosol perturbation 25 depends on the details of the interaction of clouds, turbulence, radiation and precipitation processes on a 26 range of scales not represented by large-scale models (vanZanten et al., 2011). For this reason it is not 27 surprising that large-scale models exhibit a range of manifestations of aerosol-cloud interactions, which 28 limits quantitative inference (Quaas et al., 2009b). However, by examining the interactions between cloud 29 and large-scales in the global models, and between aerosol and turbulent processes in explicit cloud 30 simulations, some progress has been made and is likely to continue even though no single model can 31 simulate everything. 32 33 7.4.1.4 Combined Modelling and Observational Approaches 34 35 Combined approaches, which attempt to maximize the respective advantage of models and data, are 36 beginning to add to understanding of aerosol-cloud interactions. These include inversions of the observed 37 historical record using large-scale modelling studies, but also the use of reanalysis and chemical transport 38 models to help interpret satellite records (Chameides et al., 2002; Koren et al., 2010; Mauger and Norris, 39 2010), field study data to help constrain fine-scale modelling studies (Ackerman et al., 2009; vanZanten et 40 al., 2011), or satellite climatologies to constrain large-scale modelling (Quaas et al., 2009b). 41 42 7.4.2 Aerosol Effects on Liquid Cloud Albedo (Indirect Radiative Forcing – iRF) 43 44 7.4.2.1 The Physical Basis for the Indirect Forcing 45 46 The cloud albedo effect (Twomey, 1977), which here is simply called the indirect RF or iRF, is the 47 mechanism by which an increase in aerosol number concentration leads to an increase in liquid cloud albedo 48 (reflectance of incoming shortwave solar radiation) by increasing the cloud droplet number concentration 49 and hence increasing total droplet surface area, with the liquid water content and cloud geometrical thickness 50 held fixed. Although only the change in the cloud droplet concentration is considered in the original concept 51 of cloud albedo effect, a change in the shape of droplet size distribution (such as breadth), which is directly 52 induced by aerosols, may also be important (e.g., Feingold et al., 1997; Liu and Daum, 2002). Cloud albedo 53 effects may also be manifest in ice, or mixed phase clouds, but these are discussed in Section 7.4.4. 54 55 The physical basis of the indirect forcing is generally well understood with research since the AR4 generally 56 supporting the picture that had developed at that time. Detailed in-situ aircraft observations continue to show 57
First Order Draft Chapter 7 IPCC WGI Fifth Assessment Report
Do Not Cite, Quote or Distribute 7-40 Total pages: 121
that cloud droplet concentrations observed just above the cloud base generally agree with what would be 1 predicted given the aerosol observed below the cloud base (cloud droplet closure), which is the fundamental 2 link in the cloud albedo effect (e.g., Fountoukis et al., 2007). Vertical profiles of cloud effective radius also 3 agree with those predicted by models which take into account the effect of entrainment (Lu et al., 2008), 4 although uncertainties still remain in estimating the shape of the droplet size distribution (Hsieh et al., 2009), 5 and the degree of non-adiabaticity within clouds. Multi-dimensional radiative transfer calculations have also 6 been applied to estimate cloud albedo instead of using the traditional two-stream approximation to find that 7 the latter could overestimate the albedo effect under certain conditions (Duda et al., 1996; Zuidema et al., 8 2008). 9 10 7.4.2.2 Observational Evidence for the Indirect Forcing 11 12 There is ample observational evidence for increases in aerosol resulting in an increase in drop concentration 13 and decrease in drop size (for constant liquid water) and the main question is one of magnitude and spatial 14 extent. Based on simple metrics, there is a large range of physically plausible responses with aircraft 15 measurements (e.g., Lu et al., 2007; Lu et al., 2008; Twohy et al., 2005) tending to show stronger responses 16 than satellite-derived responses (McComiskey and Feingold, 2008; Nakajima and Michael, 2009). 17 18 Radiative forcing associated with the Twomey effect is impossible to observe because of the rapid 19 adjustments and further discussion is deferred to Section 7.4.3.2. 20 21 7.4.2.3 Advances in Process Level Understanding 22 23 At the heart of the albedo effect lie two fundamental issues. The first is the problem of droplet activation and 24 its sensitivity to aerosol and meteorological parameters. The primary controls on drop number concentration 25 are the aerosol number concentration (particularly at diameters > than ~ 80 nm) and updraft velocity. 26 Aerosol size distribution can play an important role under high aerosol loadings, whereas aerosol 27 composition is unimportant, except perhaps under very polluted conditions and low updraft velocities (e.g., 28 Ervens et al., 2005). The second issue is the presence of condensed water that strongly determines how much 29 energy can be reflected; there is no indirect effect unless clouds are present. Simple arguments show that the 30 amount of reflected energy is approximately two-and-a-half times more sensitive to changes in the liquid 31 water path than to changes in drop concentration. The magnitude of the indirect effect therefore rests mostly 32 on dynamical forcing such as convective strength and entrainment that controls cloud amount, and a few key 33 aerosol parameters such as aerosol number concentration and perhaps size distribution. 34 35 While observationally-based assessments of aerosol-cloud interactions have a long history, a more recent 36 development is assessment of the ability of detailed models to reproduce the radiative fingerprints of aerosol-37 cloud interactions (Schmidt et al., 2009). This involves comparison between measurements of fields such as 38 irradiance and comparison with the same fields calculated in finescale models that represent aerosol-cloud 39 interactions. Such approaches identify key forcing parameters (e.g., cloud-field properties, aerosol 40 hygroscopicity and absorption) and strengthen our understanding of the radiative forcing associated with 41 aerosol effects on cloud microphysics. 42 43 7.4.2.4 Advances in and Insights Gained from Large-Scale Modelling Studies 44 45 Despite the consolidation in our understanding of the physical basis of the indirect forcing there still remain 46 large uncertainties in quantification, because of the aforementioned difficulties in representing clouds and 47 aerosol-cloud interactions in climate models. Recent estimates of the indirect forcing using satellite 48 observations are systematically smaller than the AR4 estimates, which were derived from GCM calculations 49 based on parameterization of physical processes or in-situ observations (Lohmann and Lesins, 2002; Quaas 50 et al., 2008; Quaas et al., 2009b). The satellite data show lower susceptibility of cloud effective radius or 51 droplet number concentration to aerosol optical depth or number concentration as compared with in-situ 52 observations or detailed cloud parcel model calculations (McComiskey and Feingold, 2008), leading to the 53 differences in the estimate of the iRF. This result is at least partly due to scale-related averaging biases in 54 satellite retrievals (McComiskey and Feingold, 2011). It is also generally difficult to separate the iRF from 55 the cloud fast feedbacks and meteorological effects in both observations and fully coupled numerical model 56
First Order Draft Chapter 7 IPCC WGI Fifth Assessment Report
Do Not Cite, Quote or Distribute 7-41 Total pages: 121
calculations (e.g., George and Wood, 2010; Lohmann et al., 2010). Estimates of the iRF are given in Section 1 7.4.6. 2 3 7.4.3 Adjustments in Liquid Clouds 4 5 7.4.3.1 The Physical Basis for Adjustments in Liquid Clouds 6 7 The effect of the aerosol on cloud amount is more multi-faceted than its effect on albedo alone, leading 8 investigators to discuss such an effect in the plural. Such effects are often associated with changes in cloud 9 lifetime and in the past have been referred to as ‘lifetime’ effects. However this nomenclature is misleading 10 because it assumes a relationship between cloud lifetime and cloud amount. Moreover, the effect of the 11 aerosol on cloud amount may have nothing to do with cloud lifetime per se (e.g., Pincus and Baker, 1994). 12 13 The traditional view has been that indirect adjustment effects of CCN will add to the initial albedo increase 14 (iRF) by increasing cloud amounts. The chain of reasoning involves three steps. First that cloud droplet 15 concentrations depend on the number of available cloud condensation nuclei; second that precipitation 16 development is regulated by the cloud droplet concentration; and third that the development of precipitation 17 reduces cloud amount (Stevens and Feingold, 2009). 18 19 Of the three steps the first has ample support in both observations and theory, as reviewed in the previous 20 section. More problematic are the second two links in the chain of reasoning. The physical basis for an 21 unambiguous, and positive, dependence of cloud amount on the available cloud condensation nuclei is weak. 22 Although the idea that increased cloud droplet concentrations inhibit the initial development of precipitation 23 in single clouds is longstanding, it is not clear that such effects reduce the precipitation overall. Some 24 modelling studies suggest the opposite, wherein increased aerosol concentrations actually promote the 25 development of deeper clouds, thereby invigorating precipitation (Rosenfeld et al., 2008; Stevens and 26 Seifert, 2008, see also a more extensive discussion of this point in Section 7.4.5). The idea that cloud amount 27 is a decreasing function of precipitation efficiency is even less clear. Although the original studies that 28 hypothesized cloud amount effects (Albrecht, 1989; Liou and Ou, 1989) are often taken as demonstrative of 29 this point, there is limited unambiguous observational evidence (exceptions to be given below). Many 30 climate models assume such an effect a priori, which likely influences their forcing estimates. 31 32 A general statement of how precipitation affects cloud amount remains elusive. It appears increasingly likely 33 that cloud amount effects, which almost certainly exist locally, vary from one cloud regime to the next. As 34 such their quantification globally is a more ambitious task than originally anticipated, as it requires models to 35 correctly represent the distribution of cloud regimes evincing such effects, and knowledge of how such 36 effects manifest themselves across these regimes. Then again, because diverse effects offer the possibility of 37 compensating one another, at least globally, it seems possible that lifetime effects may be considerably less 38 important than previously thought (Stevens and Feingold, 2009). 39 40 7.4.3.2 Observational Evidence of Adjustments in Liquid Clouds 41 42 We discuss a sample of observations for which there is clear evidence of the aerosol interacting with clouds, 43 in the broader sense of iRF and iAF since the latter subsumes the former. The cloud albedo effect is best 44 manifested in so-called ship tracks, which are bright lines of clouds behind ships. As shown during the 45 Monterey Area Ship Track (MAST) experiment, many ship tracks are characterized by an increase in the 46 cloud droplet number concentration resulting from the increase in aerosol number concentration and an 47 absence of drizzle size drops, which leads to a decrease in the droplet radius and an increase in the cloud 48 albedo (Durkee et al., 2000). The global radiative forcing of visible ship tracks has been estimated from 49 satellite and found to be insignificant at 0.5 m W m–2 (Schreier et al., 2007), although there is some concern 50 that this analysis may not have identified all shiptracks. The new A-Train satellites offer the possibility to 51 study the signal of long-term degassing of low-lying volcanic aerosol on stratocumulus (Gasso, 2008) and 52 trade wind cumuli (Yuan et al., 2011). The stratocumulus respond with smaller drop sizes but ambiguous 53 changes in cloud fraction and cloud water. The trade cumuli respond with smaller droplet size, decreased 54 precipitation efficiency, increased cloud amount and higher cloud tops. 55 56
First Order Draft Chapter 7 IPCC WGI Fifth Assessment Report
Do Not Cite, Quote or Distribute 7-42 Total pages: 121
The development of precipitation in stratocumulus appears to be associated with more heterogeneous cloud 1 features, including breaks in the cloud coverage (Comstock et al., 2005; Sharon et al., 2006; vanZanten et al., 2 2005). In some cases pronounced reversals in the cellular polarity become evident, where in compact regions 3 (pockets), open cellular convection is surrounded by regions of closed cellular convection. Closed cellular 4 convection in stratocumulus is characterized by a high albedo as broad regions of mesoscale ascent are 5 covered by relatively optically thick clouds and narrow regions of mesoscale descent define the cell 6 boundaries, and are characterized by optically thin clouds or even clear air. In contrast, open cellular 7 convection in stratocumulus typically has a much lower albedo; broad regions of mesoscale descent are 8 largely cloud free, and clouds are confined principally to cell boundaries in regions of mesoscale ascent. The 9 development of pockets of open cells in broad regions of closed cellular convection appears closely linked to 10 the development of precipitation (Savic-Jovcic and Stevens, 2008; Stevens et al., 2005; Wang and Feingold, 11 2009). The lack of any apparent difference in the large-scale environment of the open cells, versus the 12 surrounding closed cellular convection, implies the existence of multiple equilibria. This raises the 13 possibility that the onset of precipitation can lead to a chain of events that leads to a large-scale reduction of 14 cloudiness, in agreement with original work from Liou and Ou (1989), Albrecht (1989) and Baker and 15 Charlson (1990). 16 17 A number of hypotheses have been advanced, and explored, to explain why precipitation initially develops in 18 regions of open cells (Rosenfeld et al., 2006; Wang et al., 2010a). If broad regions of open cells were much 19 more characteristic of the pre-industrial atmosphere it would suggest that the anthropogenic aerosol has been 20 responsible for large changes in planetary albedo. Cloud resolving modelling studies suggest however that 21 even in relatively clean air in the South East Pacific, CCN concentrations are not low enough to support 22 broad regions of open cells, hence this scenario appears unlikely. Indeed, one hypothesis for the formation of 23 pockets of open cells is that they carry the imprint of airmasses in which sustained precipitation was 24 dynamically triggered thereby leading to sufficient depletion of the aerosol to sustain the observed pockets of 25 open cells (Wang et al., 2010a). 26 27 Precipitation from shallow convection, and clouds, prove difficult to observe in the trades, as the clouds tend 28 to be small, and the small footprint of many precipitating trade-wind clouds does not lend itself well to 29 space-based remote sensing techniques. [PLACEHOLDER FOR SECOND ORDER DRAFT: CloudSat 30 reference]. However unlike stratocumulus, where more precipitation favours fewer clouds, in the much 31 broader trade wind regions cloudiness tends to increase with precipitation amount, most likely because 32 processes which favour precipitation development also favour clouds (Nuijens et al., 2009) and because 33 precipitating trade cumulus tend to regenerate through colliding outflows. 34 35 7.4.3.3 Advances in Process Level Understanding 36 37 Since the AR4, there has been progress understanding of some basic processes relevant to cloud amount 38 effects. One basic question is how susceptible precipitation is to cloud-droplet number concentrations, and 39 by inference the available aerosol. Simple models for the conversion of cloud-water into rain-water predict 40 that the rate of this process autoconversion process scales with the square of the inverse of the droplet 41 number concentration. However theoretical work, that incorporates a fuller description of rain formation 42 processes suggests that this strongly over-estimates the sensitivity of rain formation in shallow clouds 43 (Stevens and Seifert, 2008), and that rain formation scales with a critical liquid water content that increases 44 with approximately the inverse square-root of the droplet number concentration (Kostinski, 2008; Seifert and 45 Stevens, 2010). Note that thicker, liquid clouds generate rain via accretion of cloud drops by raindrops, a 46 process that is relatively insensitive to droplet concentration, and therefore to aerosol perturbations. 47 48 A number of observational studies have likewise found that the rain-rate from stratiform clouds scales with 49 the liquid-water path of the cloud layer to the 3/2 power, and with the inverse of the droplet concentration 50 (Comstock et al., 2005; Pawlowska and Brenguier, 2003; vanZanten et al., 2005). But because the 51 observations also encapsulate the tendency of liquid water and cloud condensation nuclei to be removed by 52 rain they likely over-estimate the sensitivity of rain formation to the droplet concentration, and under-53 estimate its sensitivity to liquid water. Some of the effects that reduce and even eliminate the sensitivity of 54 rain formation to the auto-conversion process have begun to be incorporated in parameterizations used by 55 large-scale models (Posselt and Lohmann, 2009). 56 57
First Order Draft Chapter 7 IPCC WGI Fifth Assessment Report
Do Not Cite, Quote or Distribute 7-43 Total pages: 121
Recent small-scale studies tend to confirm two responses of the cloud liquid water to increasing aerosol. 1 Under clean conditions when clouds are prone to precipitation, an increase in the aerosol tends to increase 2 cloud amount. Under non-precipitating conditions, clouds tend to thin in response to increasing aerosol 3 (Ackerman et al., 2004; Small et al., 2009; Xue et al., 2008). Treatment of the subtlety of these responses and 4 associated detail in small-scale cloud processes is not feasible in GCMs. 5 6 Since AR4, cloud resolving model simulation has begun to stress the importance of scale interactions when 7 addressing aerosol-cloud interactions. Large model domains (order 100 km) allow mesoscale circulations to 8 develop in response to changes in the aerosol. These dynamical responses may have a significant impact on 9 cloud morphology and radiative forcing. Examples include the dramatic changes in cloud morphology 10 associated with changes in cellular structure discussed above and the cloud-free shadows that appear 11 alongside ship tracks (Wang and Feingold, 2009). These underscore the folly of applying simplistic rules for 12 aerosol-cloud interactions. 13 14 7.4.3.4 Advances in and Insights Gained from Large-Scale Modelling Studies 15 16 Attempts to quantify cloud-mediated aerosol effects using global models suggest that lifetime effects 17 contribute between –0.3 and –1.3 W m–2 to the adjusted forcing from the anthropogenic aerosol (Lohmann 18 and Feichter, 2005). Because such studies usually neglect processes that may generate positive forcing 19 usually involving ice (e.g., Storelvmo et al., 2008a) and because models are tuned to preclude estimates of 20 the cloud-mediated aerosol radiative forcing that are too high (Hoose et al., 2009), it is difficult to use the 21 model-based estimates as an independent constraint. By using satellite data to rescale relations that emerge 22 from an ensemble of models several studies have argued for weaker cloud-mediated aerosol effects, and by 23 extension weaker cloud lifetime effects (Quaas et al., 2009b). 24 25 Regional and global models systematically misrepresent the distribution of clouds, and cloud processes, 26 especially those for shallow maritime clouds. One persistent shortcoming of global models is the tendency to 27 only treat aerosol-cloud interactions in terms of large-scale, but not convective clouds. Recent efforts to 28 consistently address both types of cloud representations represent a significant advance in large scale 29 modelling (Lohmann, 2008). Nonetheless our understanding of aerosol-cloud interactions is incomplete, and 30 what is well-understood is incompletely represented in large scale models. For these reasons, and because 31 lifetime effects depend critically on the interplay of uncertainly parameterized physical processes, global-32 model based estimates of lifetime effects remain controversial. 33
34 7.4.4 Adjustments in Cold Clouds 35 36 7.4.4.1 The Physical Basis for Adjustments in Cold Clouds 37 38 In a water-saturated environment both liquid water and ice can co-exist, at least on timescales relevant for 39 cloud processes, at temperatures between 0°C and –38°C. Clouds in which both liquid water and ice particles 40 are present are referred to as mixed-phase clouds. At warmer temperatures ice rapidly melts, whereas at 41 colder temperatures liquid water will freeze homogeneously. The formation of ice in the range of 42 temperatures between 0°C and –38°C depends on heterogeneous freezing whereby a foreign medium, 43 usually insoluble aerosol particles collectively referred to as ice nuclei (IN), initiate the freezing processes. 44 Soluble matter or physiochemical transformations can hinder glaciation by depressing the freezing 45 temperature of super-cooled drops (e.g., Baker and Peter, 2008; Girard et al., 2004). The same process can 46 occur in cirrus clouds (Crawford et al., 2011) but there the lack of natural IN in the atmosphere makes 47 homogeneous freezing the preferred pathway in cirrus clouds (Kärcher and Strom, 2003). Hence 48 anthropogenic perturbations to the aerosol have the potential to affect when and where clouds become 49 glaciated. For cirrus clouds this could inhibit homogeneous nucleation. For both mixed-phase and ice clouds, 50 anthropogenic perturbations affect cloud optical properties, and can contribute to an albedo effect. 51 52 Because the enthalpy of liquid water is larger than that of ice, freezing is associated with a transfer of 53 enthalpy from the particles to their environment. Hence glaciation affects cloud dynamics. Moreover, in a 54 cloud consisting of supercooled liquid water the equilibrium vapour pressure will correspond to water 55 saturation, which is significantly oversaturated with respect to ice. Thus the initiation of ice in a supercooled 56 liquid cloud will cause vapour to diffuse rapidly toward ice particles at the expense of the liquid water in the 57
First Order Draft Chapter 7 IPCC WGI Fifth Assessment Report
Do Not Cite, Quote or Distribute 7-44 Total pages: 121
cloud, a process known as the Bergeron-Wegener-Findeisen process. This favours the depositional growth of 1 large ice crystals, which may sediment away from the saturated region of the atmosphere, influencing the 2 subsequent evolution of the cloud. Hence the ease with which ice forms may be influenced by anthropogenic 3 perturbations to the aerosol, and in turn may regulate cloud amount (Lohmann, 2002a; Storelvmo et al., 4 2011; see also Section 7.2.2.4), or upper tropospheric humidity. 5 6 The types of aerosol particles that contribute to the distribution of IN apart from mineral dust are poorly 7 understood. For example, the role of biological particles acting as IN remains controversial. While such 8 particles have been found to be negligible for realistic concentrations of bacteria (Diehl and Wurzler, 2010; 9 Hoose et al., 2010a; 2010b; Phillips et al., 2009; Sesartic et al., 2011) some investigators (Ariya et al., 2009; 10 Sun et al., 2010) argue that biological particles even in low concentrations may still be important because 11 they can trigger ice multiplication. The presence of more soluble aerosol particles would make it harder to 12 form atmospheric ice homogeneously, but the primary production of insoluble aerosol particles could help 13 initiate ice through poorly known heterogeneous freezing mechanisms. If IN become coated with soluble 14 material they may also become less effective as IN (see Section 7.2.2.4, Hoose et al., 2008; Lohmann and 15 Hoose, 2009; Storelvmo et al., 2008a). Anthropogenic changes to the biosphere could conceivably also make 16 biological IN less prevalent. Our poor understanding of the climatology and life-cycle of aerosol particles 17 that can serve as IN complicates attempts to generally assess what constitutes an anthropogenic perturbation 18 to the IN population, let alone the effect of such a perturbation. 19 20 7.4.4.2 Observations of Aerosol Effects on Ice and Mixed-Phase Stratiform Clouds 21 22 Arctic mixed-phase clouds have received a great deal of attention since AR4, with major field programs 23 conducted in 2004 (Verlinde et al., 2007) and 2009 (Brock et al., 2011; Jacob et al., 2010; McFarquhar et al., 24 2011) in addition to longterm monitoring at Barrow, Alaska (Shupe et al., 2008). Mixed-phase Arctic clouds 25 persist for extended periods of time (days and even weeks), in spite of the inherent instability of the ice-26 water mix. We focus here on the role of the aerosol and refer to Section 7.2.1.3.3 for a discussion of 27 meteorological aspects. The subset of the aerosol that act as IN exists in concentrations of 10–5 to 10–1 cm–3, 28 i.e., only about 1 in a million particles acts as an IN. Even at such low concentrations, they have an important 29 influence on cloud persistence, with clouds tending to glaciate and disappear rapidly when IN concentrations 30 are relatively high and/or updraft velocities too small to sustain a liquid water layer. The details of the 31 heterogeneous ice-nucleation mechanism remain controversial but there is increasing evidence that ice forms 32 in Arctic stratus via the liquid phase (immersion freezing) so that the CCN population also plays an 33 important role (de Boer et al., 2011; Lance et al., 2011). If ice indeed forms via the liquid phase this 34 represents a self-regulating feedback that helps sustain the clouds: as ice forms, water is depleted, which 35 restricts further ice formation and competition for water vapour via the Bergeron-Wegener-Findeisen 36 process. 37 38 7.4.4.3 Advances in Process Level Understanding 39 40 Since the AR4 research on ice-microphysical processes has been active, to a large degree with an eye toward 41 a better representation of such processes in models. Korolev (2007) developed a theoretically based 42 parameterization of the Bergeron-Wegener-Findeisen process that has lately been employed in different 43 GCMs (Lohmann and Hoose, 2009; Storelvmo et al., 2008b). As some mixed-phase clouds have been found 44 to be long-lived, Korolev and Field (2008) derived a theoretical framework to explain this phenomenon. A 45 recent review (Morrison et al., 2012) discusses the myriad processes that create a resilient mixed-phase cloud 46 system. 47 48 An example of the level of detail associated with mixed–phase clouds that may be required for adequate 49 representation in models is that the dependence of ice particle growth by vapour diffusion depends strongly 50 on particle habit (Harrington et al., 2009) and may even have equal weight to ice nucleation mechanism vis-51 à-vis glaciation times (Ervens et al., 2011). 52 53 For the mixed phased processes where the Bergeron-Wegener-Findeisen process makes ice-initiation 54 interesting, heterogeneous freezing parameterizations employed in cloud or larger-scale models remain 55 mostly empirical (e.g., DeMott et al., 2010; Gettelman et al., 2010; Hoose et al., 2008; Lohmann and Diehl, 56 2006; Phillips et al., 2008; Salzmann et al., 2010; Storelvmo et al., 2008a), although some recent work 57
First Order Draft Chapter 7 IPCC WGI Fifth Assessment Report
Do Not Cite, Quote or Distribute 7-45 Total pages: 121
attempts to ground the development of parameterisations in concepts derived from classical nucleation 1 theory (Hoose et al., 2010b). 2 3 Ice nucleation in cirrus clouds (at temperatures less than –35°C) depends crucially on the cloud updraft 4 velocity and hence the supersaturation with respect to ice. For homogeneous nucleation, the threshold 5 relative humidities have been parameterized using results of parcel model simulations (e.g., Barahona and 6 Nenes, 2009; Sassen and Dodd, 1988), airborne measurements in cirrus or wave clouds (Heymsfield et al., 7 1998; Heymsfield and Miloshevich, 1995), extensions of classical homogeneous ice nucleation theory 8 (Khvorostyanov and Sassen, 1998; Khvorostyanov and Curry, 2009), and data from laboratory 9 measurements (e.g., Bertram et al., 2000; Friedman et al., 2011; Koop et al., 2000; Magee et al., 2006; 10 Mohler et al., 2003). If ice nuclei are present, then heterogeneous nucleation is the preferred freezing 11 pathway because it requires lower threshold relative humidities (or higher threshold temperatures) than 12 homogeneous nucleation. The threshold relative humidities (or temperatures) for heterogeneous nucleation 13 depend on the type and size of the involved ice nuclei (Figure 7.8 and Section 7.3.3.5). 14 15 7.4.4.4 Advances in and Insights Gained from Large-Scale Modelling Studies 16 17 Studies of the iAF that depend on ice microphysical pathways are considerably less advanced than those 18 involving only liquid clouds, but have come into increasing focus since the AR4. Penner et al. (2009) 19 obtained a rather large iAF of anthropogenic ice-forming aerosol on upper tropospheric clouds. However, 20 they ignore potential compensating effects on lower lying clouds and therefore should be regarded with 21 caution. The climate impact of anthropogenic lead-containing mineral dust particles, among the most 22 efficient ice-forming substances, has been investigated. In the extreme scenario in which 100% of ice-23 forming mineral dust particles in cirrus clouds contained lead, up to 0.8 W m–2 more long-wave radiation 24 was emitted to space as compared to pure mineral dust particles (Cziczo et al., 2009b). 25 26 Since the AR4 a number of studies have contributed to our ability to quantify aerosol effects on cirrus. 27 Because such clouds usually only involve ice-phase microphysical processes, the physical pathways are 28 somewhat simpler. BC can impact background cirrus by affecting ice nucleation properties but its effect 29 remains uncertain (Kärcher et al., 2007). There is some evidence of a statistically significant impact on cirrus 30 coverage (Hendricks et al., 2005). However, Liu et al. (2009) examined their role in radiative forcing of 31 cirrus clouds and found it to be very small. 32 33 7.4.5 Aerosol-Cloud Microphysical Effects on Precipitating Systems 34 35 7.4.5.1 The Physical Basis for Aerosol Effects on Precipitating Convection 36 37 Deep convective clouds arise in response to the differential heating of the surface versus the atmosphere, 38 largely as a result of radiative processes. This differential heating leads to the development of convective 39 instabilities. The enthalpy of vaporization, and the much smaller enthalpy of fusion, which is released 40 through the development of precipitation, is a primary mechanism for transporting enthalpy from the surface 41 to the atmosphere and hence consuming the column instability. Through their effect on the microphysical 42 development of clouds, for instance whether or not precipitation sized particles are readily formed, or if ice 43 is initiated, the aerosol may modify the vertical distribution of condensate, and thus modify cloud and 44 precipitation development. 45
46 Microphysically, the suppression in drop size in response to an aerosol perturbation is expected to suppress 47 drop growth and precipitation formation and favour enhanced water loading in the upper portions of the 48 cloud, which may limit cloud development, but favour the formation of convective downdrafts through more 49 ready mixing with the environment. However, the lack of precipitation may allow clouds to grow deeper and 50 help generate more precipitation (Nuijens et al., 2009). Then again, the cold pools associated with 51 precipitation may be crucial for secondary precipitation (Lee et al., 2010; Matheou et al., 2011). As a result, 52 whether more efficient precipitation production fosters or limits cloud development remains very uncertain. 53 54 Similar arguments can be extended to the ice phase. Once the cloud passes the freezing level, the effect of 55 the aerosol on ice initiation becomes important, with the ensuing complications discussed in the previous 56 section. If, however, changes in the anthropogenic aerosol make the initiation of ice less effective the 57
First Order Draft Chapter 7 IPCC WGI Fifth Assessment Report
Do Not Cite, Quote or Distribute 7-46 Total pages: 121
development of precipitation may be further retarded (Rosenfeld and Woodley, 2001), and vice versa. By 1 delaying the initiation of ice the additional enthalpy of fusion will be introduced higher in the convective 2 updraft, thereby suppressing the development of clouds initially, but promoting their development when they 3 reach the level where ice forms. Although this is a rather small effect, relative to the tenfold larger enthalpy 4 release from ongoing condensation, it has nonetheless been hypothesized to have a critical effect on cloud 5 development (Andreae et al., 2004; Rosenfeld et al., 2008). 6 7 Finally, by determining whether liquid, mixed, or ice-phase processes are dominant, perturbations to the 8 aerosol may also affect the distribution of precipitation. Studies in the southwestern Amazon region during 9 the transition from dry to wet seasons (Martins et al., 2009) invoke such mechanisms to explain why higher 10 CCN concentrations are associated with less frequent low-to-moderate rainfall rates and more frequent high 11 rainfall rates. 12 13 To date, the issue of aerosol effects on precipitation remains an open question (Levin and Cotton, 2009). 14 There are many uncertainties related to the physical mechanisms involved and to the observational and 15 numerical tools (e.g., Khain, 2009). 16 17 7.4.5.2 Observations of Aerosol Effects on Precipitating Systems 18 19 Numerous observational studies have examined the links between aerosol particles and deep convective 20 cloud properties, seeking to find robust associations between the aerosol and cloud properties that can be 21 interpreted to be a result of aerosol effects on clouds. The availability of satellite data with global coverage, 22 ever finer footprints, and a richer palette of spectral, angular, and polarization information has improved the 23 retrieval of aerosol and cloud properties, and continues to advance the field, with the major strides since the 24 AR4 coming from the use of active remote sensing, angular, and vertically, resolved data. 25 26 The analysis of satellite data, and in situ measurements, shows that an increase in aerosol loading is 27 associated on average with smaller particles, taller invigorated convective clouds with larger cloud fraction 28 and more extensive ice portions. These associations are found over the tropical Atlantic (Jenkins et al., 2008; 29 Koren et al., 2005), Europe (Devasthale et al., 2005), North and South America (Andreae et al., 2004; Bell et 30 al., 2008; Koren et al., 2008; Lin et al., 2006; Lindsey and Fromm 2008) and appear for all types of aerosol 31 particles: biomass burning smoke, urban/industrial aerosol and desert dust. These more invigorated clouds 32 would be expected to create more precipitation (Rosenfeld et al., 2008). For example an analysis of satellite 33 data over the entire Brazilian Amazon during the dry, biomass burning, season found that elevated aerosol 34 loading was associated with increased rainfall amounts and a shift to higher rainfall rates (Lin et al., 2006). 35 Likewise changes in rainfall during the week over the south-eastern portion of the United States found an 36 increase in rainfall for afternoon storms during the midweek compared to the weekend (Bell et al., 2008). 37 38 Observational studies examining the aerosol effect on precipitation of mixed phase clouds, often however 39 report rain suppression in polluted atmospheres. Satellite data measured at various geographical locations 40 suggest suppressed precipitation associated with polluted clouds (Jiang et al., 2008). Investigation of 41 orographic clouds showed a reduction in the annual precipitation over topographical barriers downwind of 42 major urban areas (Givati and Rosenfeld, 2004; Jirak and Cotton, 2006). Other studies showed no response 43 of orographic rain to pollution (Halfon et al., 2009). 44 45 However, whether these observations should be interpreted as an effect of the aerosol on clouds, vice versa, 46 or due to a third factor remains controversial. Causal pathways have been proposed that would be consistent 47 with all of the hypotheses (Rosenfeld et al., 2008; Stevens and Feingold, 2009). What is clear is that a 48 consistent picture has yet to emerge, perhaps because different pathways are active in different cloud 49 regimes, or at different stages in the life-cycle of cloud systems (Koren et al., 2008; Stevens and Seifert, 50 2008). 51 52 7.4.5.3 Advances in Process Level Understanding 53 54 Modelling studies suggest that the thermodynamic environment in which the clouds grow is an important 55 factor in the determination of the aerosol effect on the ground precipitation (Khain et al., 2005; Lynn et al., 56 2005; Tao et al., 2007). For clouds developing in dry unstable air, there is a decrease in the accumulated 57
First Order Draft Chapter 7 IPCC WGI Fifth Assessment Report
Do Not Cite, Quote or Distribute 7-47 Total pages: 121
precipitation with an increase in aerosol loading. For deep maritime clouds modelling studies suggest that 1 aerosol perturbations can lead to an increase in precipitation. The important environmental factors are 2 humidity, that influences the evaporation of cloud liquid (and sublimation of ice), and wind shear that can 3 modulate the entrainment of dry air into clouds and the transport of cloud liquid into unsaturated areas (Fan 4 et al., 2009). 5 6 Weekly cycles in aerosol properties and precipitation have emerged to tackle this problem. While all studies 7 support a weekly cycle in aerosol properties, the results for weekly cycles in precipitation are conflicting 8 (Barmet et al., 2009; Bäumer et al., 2008; Hendricks Franssen et al., 2009; Sanchez-Lorenzo et al., 2008; 9 Stjern 2011). 10 11 Recently the tools of numerical weather prediction have been applied to this problem. Looking at summer 12 season forecasts using a cloud-resolving regional model the question has been posed as to whether changes 13 to the aerosol systematically affect precipitation over large regions. Little to no systematic effect of the 14 aerosol could be documented (Seifert et al., 2011). 15 16 Cloud-resolving modelling by Lynn et al. (2007) suggests that aerosol perturbations will result in 17 precipitation being displaced to the leeward side of the mountain, with the impact of the aerosol being 18 strongest under drier conditions and weaker horizontal winds. Regional studies confirm a reduction of 19 precipitation on the windward side of a mountain barrier and a tendency for the precipitation to shift 20 downstream to the leeward side but the magnitude of this depends on the importance of the ice phase in these 21 orographic clouds (Muhlbauer and Lohmann, 2009; Zubler et al., 2011). 22 23 As computational resources have increased it has become increasingly clear that some aerosol effects appear 24 as transients in short duration simulations and that long (multi-day) simulations are necessary to get a more 25 complete picture. Moreover the need to consider cloud systems, as opposed to individual clouds, when 26 attempting to establish aerosol influences must be emphasised (Morrison and Grabowski, 2011). Parallels 27 can be drawn with shallow systems in which mesoscale organization triggered by aerosol perturbations 28 amplifies the response beyond what one might have expected from microphysical considerations alone (see 29 Section 7.4.3.3). The large-scale constraint on surface precipitation makes it much more likely that one 30 might get changes in the frequency and spatial distribution of rain, than changes in the total amounts. 31 32 7.4.5.4 Advances in and Insights Gained from Large-Scale Modelling Studies 33 34 Fast feedbacks associated with the aerosol indirect effects do not cause much change in precipitation if an 35 average over a big enough domain is considered. Slow feedbacks through aerosol-induced changes in surface 36 temperature/surface energy budget and changes in circulation can cause regional and global changes in 37 precipitation. These latter effects have been estimated in AR4. Here the decrease in the global annual mean 38 shortwave radiation at the surface since pre-industrial times due to scattering and absorbing aerosols 39 amounted to –2.3 W m–2 with a range between –1.3 to –3.3 W m–2 (Denman et al., 2007). The associated 40 change in the global mean precipitation amounts to between 0 and –0.13 mm day–1 (Denman et al., 2007). 41 42 Studies with a climate model coupled to an advanced representation of the aerosol, wherein convection is 43 parameterized, also find little evidence of a weekly cycle in precipitation (Quaas et al., 2009a). 44
45 7.4.5.5 Large-Scale Convective Systems 46 47 Several studies since the AR4 highlight the possibility of aerosol effects on Atlantic hurricane activity, either 48 by altering radiative heating or through microphysical effects on clouds. Year-to-year variations in hurricane 49 activity and prevalence of dusty Saharan air layers (SAL) are significantly anticorrelated (Dunion and 50 Velden, 2004; Evan et al., 2006). Periods of prominent SAL activity correlate with reduced sea surface 51 temperatures, which would tend to suppress strong storm activity (Lau and Kim, 2007); dust also absorbs 52 sunlight, thus warming the troposphere and further decreasing instability (Jury and Santiago, 2010; Wong et 53 al., 2009). Evan et al., (2008) estimated that one third of the increase in the hurricane power dissipation 54 index during the preceding 25 years was statistically attributable to the absence of the SAL. Since the SAL is 55 warm and dry, it would be expected to suppress convection even in the absence of any dust (Sun et al., 2008; 56 Wong and Dessler, 2005), which complicates any attribution of observed behaviour to dust. Moreover, Folz 57
First Order Draft Chapter 7 IPCC WGI Fifth Assessment Report
Do Not Cite, Quote or Distribute 7-48 Total pages: 121
and McPhaden (2008) showed that the correlation between Saharan dust and a cooler sea surface was mainly 1 because both were caused by stronger winds, rather than dust causing the cooling. Thus while it is likely that 2 dust variations have to some extent affected tropical Atlantic sea surface temperature trends and therefore 3 Atlantic hurricane activity, it remains unclear how important this is. 4 5 7.4.6 Synthesis of Aerosol Effects 6 7 There are different ways to report the iRF and the iAF at the top-of-the-atmosphere since pre-industrial 8 times. In Figure 7.13a we show estimates of the change in the net radiation if possible. If that estimate is not 9 available the next options, taken in this order, are the change in the net shortwave radiation, the change in the 10 net cloud forcing and last, the change in shortwave cloud forcing. Given that there is practically no longwave 11 signal associated with the iRF and there are no changes in the clear-sky, all estimates of the iRF are 12 comparable. However, for the iAF when fast feedbacks are included, there can be changes in the clear-sky 13 and the longwave radiation, especially if aerosol effects on mixed-phase and ice clouds are considered or if 14 local circulations respond rapidly to changes in the shortwave forcing. 15 16 Ensemble-averaged global-mean model estimates of the iRF have remained rather constant over time (Figure 17 7.13a) and amount to roughly –1 W m–2. This estimate is obtained from the average over all published 18 estimates, treating each of them as equal (one vote per model per paper). The –1 W m–2 estimate is slightly 19 stronger than the estimate of the indirect forcing in AR4 where a different weighting procedure was used 20 (Forster et al., 2007). If the iRF studies from GCMs are divided into those published prior to TAR (1993–21 2000), between TAR and AR4 (2001–2006) and since 2007, the median indirect forcing remains within 0.15 22 W m–2. It is most negative and exhibits the largest variability between 2001 and 2006 (Figure 7.13b). This 23 increase in variability reflects the increase in complexity with which aerosol-cloud interactions are 24 simulated. Whereas early models used offline three-dimensional sulphate fields, state-of-the art GCMs have 25 their own aerosol schemes and consider sea salt, mineral dust and carbonaceous aerosols in addition to 26 sulphate. There does not seem to be a systematic tendency for models that use a parameterization based on 27 cloud parcel models instead of empirical relationships between the aerosol mass/number concentration with 28 the cloud droplet number concentration to have a larger or smaller indirect aerosol effect. Sensitivity studies 29 did show that the iRF is larger if the background aerosol concentration is low (Chen and Penner, 2005) as 30 this increases the cloud susceptibility. As shown by Storelvmo et al. (2009) different empirical relationships 31 that are used to bypass cloud activation can cause a difference of 1.3 W m–2 in the iRF. The iRF also depends 32 strongly on the assumed minimum cloud droplet concentration because that determines the susceptibility of 33 the cloud (Hoose et al., 2009).The iRF is smallest (–0.4 W m–2) if model data are rescaled to conform with 34 observational constraints. 35 36 In response to the aerosol, there are multiple possible adjustments, such as changes to the cloud lifetime 37 (cloud lifetime or second indirect aerosol effect), reduction in cloud cover due to absorption of solar 38 radiation by BC or other absorbing aerosols (semi-direct effect) and aerosol effects on mixed-phase, ice and 39 convective clouds (Denman et al., 2007) that are included in the iAF. The iAF amounts to –1.5 W m–2 if 40 either changes in cloud lifetime alone or changes in cloud lifetime together with the direct and semi-direct 41 aerosol effects are included in GCMs. Note that GCMs that use autoconversion rates of cloud droplets to 42 form rain drops which depend inversely on the cloud droplet number concentration build in a cloud lifetime 43 effect. In small-scale studies this does not lead to an increase in lifetime because small droplets also 44 evaporate more readily (Jiang et al., 2006) but rapid timescale processes of this kind are not represented in 45 GCMs (Lohmann and Feichter, 2005). The iAF tends to be smaller if changes to the cloud droplet size 46 distribution (dispersion) are considered (e.g., Rotstayn and Liu, 2005) or if a prognostic equation for 47 precipitation is introduced (Posselt and Lohmann, 2009) because that shifts the emphasis from the 48 autoconversion rate to the accretion between cloud droplet and rain drops in better agreement with 49 observations (Wood, 2005). 50 51 iAF is considerably smaller if aerosol effects on mixed-phase clouds are included in addition to the above 52 mentioned adjustments in liquid clouds. The GCM average amounts to –1.1 W m–2, only slightly larger than 53 the iRF implying that the rapid adjustments (and inclusion of the direct aerosol effect) almost cancel each 54 other. The spread between the different studies in the liquid+mixed category depends on the frequency of 55 glaciation of supercooled clouds. If more IN are available in a polluted climate, supercooled clouds glaciate 56 more readily and precipitate (see Section 7.4.4.1). In these cases an additional cooling stems from more 57
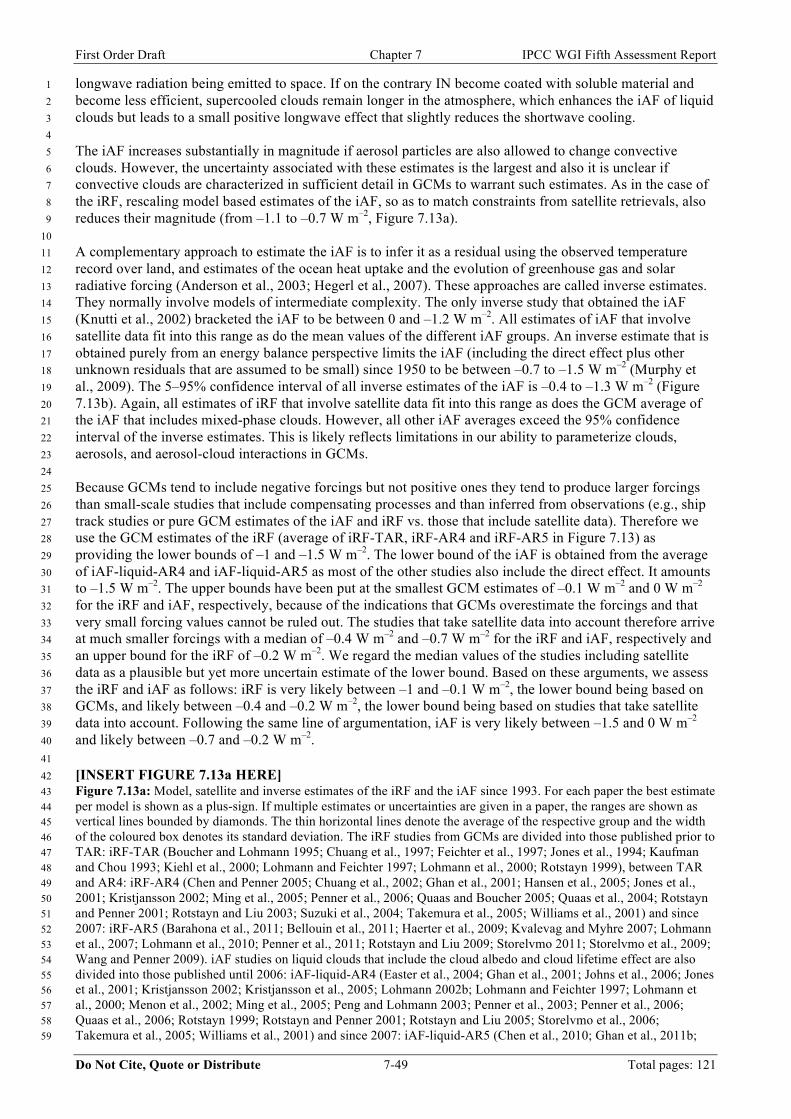
First Order Draft Chapter 7 IPCC WGI Fifth Assessment Report
Do Not Cite, Quote or Distribute 7-49 Total pages: 121
longwave radiation being emitted to space. If on the contrary IN become coated with soluble material and 1 become less efficient, supercooled clouds remain longer in the atmosphere, which enhances the iAF of liquid 2 clouds but leads to a small positive longwave effect that slightly reduces the shortwave cooling. 3 4 The iAF increases substantially in magnitude if aerosol particles are also allowed to change convective 5 clouds. However, the uncertainty associated with these estimates is the largest and also it is unclear if 6 convective clouds are characterized in sufficient detail in GCMs to warrant such estimates. As in the case of 7 the iRF, rescaling model based estimates of the iAF, so as to match constraints from satellite retrievals, also 8 reduces their magnitude (from –1.1 to –0.7 W m–2, Figure 7.13a). 9 10 A complementary approach to estimate the iAF is to infer it as a residual using the observed temperature 11 record over land, and estimates of the ocean heat uptake and the evolution of greenhouse gas and solar 12 radiative forcing (Anderson et al., 2003; Hegerl et al., 2007). These approaches are called inverse estimates. 13 They normally involve models of intermediate complexity. The only inverse study that obtained the iAF 14 (Knutti et al., 2002) bracketed the iAF to be between 0 and –1.2 W m–2. All estimates of iAF that involve 15 satellite data fit into this range as do the mean values of the different iAF groups. An inverse estimate that is 16 obtained purely from an energy balance perspective limits the iAF (including the direct effect plus other 17 unknown residuals that are assumed to be small) since 1950 to be between –0.7 to –1.5 W m–2 (Murphy et 18 al., 2009). The 5–95% confidence interval of all inverse estimates of the iAF is –0.4 to –1.3 W m–2 (Figure 19 7.13b). Again, all estimates of iRF that involve satellite data fit into this range as does the GCM average of 20 the iAF that includes mixed-phase clouds. However, all other iAF averages exceed the 95% confidence 21 interval of the inverse estimates. This is likely reflects limitations in our ability to parameterize clouds, 22 aerosols, and aerosol-cloud interactions in GCMs. 23 24 Because GCMs tend to include negative forcings but not positive ones they tend to produce larger forcings 25 than small-scale studies that include compensating processes and than inferred from observations (e.g., ship 26 track studies or pure GCM estimates of the iAF and iRF vs. those that include satellite data). Therefore we 27 use the GCM estimates of the iRF (average of iRF-TAR, iRF-AR4 and iRF-AR5 in Figure 7.13) as 28 providing the lower bounds of –1 and –1.5 W m–2. The lower bound of the iAF is obtained from the average 29 of iAF-liquid-AR4 and iAF-liquid-AR5 as most of the other studies also include the direct effect. It amounts 30 to –1.5 W m–2. The upper bounds have been put at the smallest GCM estimates of –0.1 W m–2 and 0 W m–2 31 for the iRF and iAF, respectively, because of the indications that GCMs overestimate the forcings and that 32 very small forcing values cannot be ruled out. The studies that take satellite data into account therefore arrive 33 at much smaller forcings with a median of –0.4 W m–2 and –0.7 W m–2 for the iRF and iAF, respectively and 34 an upper bound for the iRF of –0.2 W m–2. We regard the median values of the studies including satellite 35 data as a plausible but yet more uncertain estimate of the lower bound. Based on these arguments, we assess 36 the iRF and iAF as follows: iRF is very likely between –1 and –0.1 W m–2, the lower bound being based on 37 GCMs, and likely between –0.4 and –0.2 W m–2, the lower bound being based on studies that take satellite 38 data into account. Following the same line of argumentation, iAF is very likely between –1.5 and 0 W m–2 39 and likely between –0.7 and –0.2 W m–2. 40
41 [INSERT FIGURE 7.13a HERE] 42 Figure 7.13a: Model, satellite and inverse estimates of the iRF and the iAF since 1993. For each paper the best estimate 43 per model is shown as a plus-sign. If multiple estimates or uncertainties are given in a paper, the ranges are shown as 44 vertical lines bounded by diamonds. The thin horizontal lines denote the average of the respective group and the width 45 of the coloured box denotes its standard deviation. The iRF studies from GCMs are divided into those published prior to 46 TAR: iRF-TAR (Boucher and Lohmann 1995; Chuang et al., 1997; Feichter et al., 1997; Jones et al., 1994; Kaufman 47 and Chou 1993; Kiehl et al., 2000; Lohmann and Feichter 1997; Lohmann et al., 2000; Rotstayn 1999), between TAR 48 and AR4: iRF-AR4 (Chen and Penner 2005; Chuang et al., 2002; Ghan et al., 2001; Hansen et al., 2005; Jones et al., 49 2001; Kristjansson 2002; Ming et al., 2005; Penner et al., 2006; Quaas and Boucher 2005; Quaas et al., 2004; Rotstayn 50 and Penner 2001; Rotstayn and Liu 2003; Suzuki et al., 2004; Takemura et al., 2005; Williams et al., 2001) and since 51 2007: iRF-AR5 (Barahona et al., 2011; Bellouin et al., 2011; Haerter et al., 2009; Kvalevag and Myhre 2007; Lohmann 52 et al., 2007; Lohmann et al., 2010; Penner et al., 2011; Rotstayn and Liu 2009; Storelvmo 2011; Storelvmo et al., 2009; 53 Wang and Penner 2009). iAF studies on liquid clouds that include the cloud albedo and cloud lifetime effect are also 54 divided into those published until 2006: iAF-liquid-AR4 (Easter et al., 2004; Ghan et al., 2001; Johns et al., 2006; Jones 55 et al., 2001; Kristjansson 2002; Kristjansson et al., 2005; Lohmann 2002b; Lohmann and Feichter 1997; Lohmann et 56 al., 2000; Menon et al., 2002; Ming et al., 2005; Peng and Lohmann 2003; Penner et al., 2003; Penner et al., 2006; 57 Quaas et al., 2006; Rotstayn 1999; Rotstayn and Penner 2001; Rotstayn and Liu 2005; Storelvmo et al., 2006; 58 Takemura et al., 2005; Williams et al., 2001) and since 2007: iAF-liquid-AR5 (Chen et al., 2010; Ghan et al., 2011b; 59
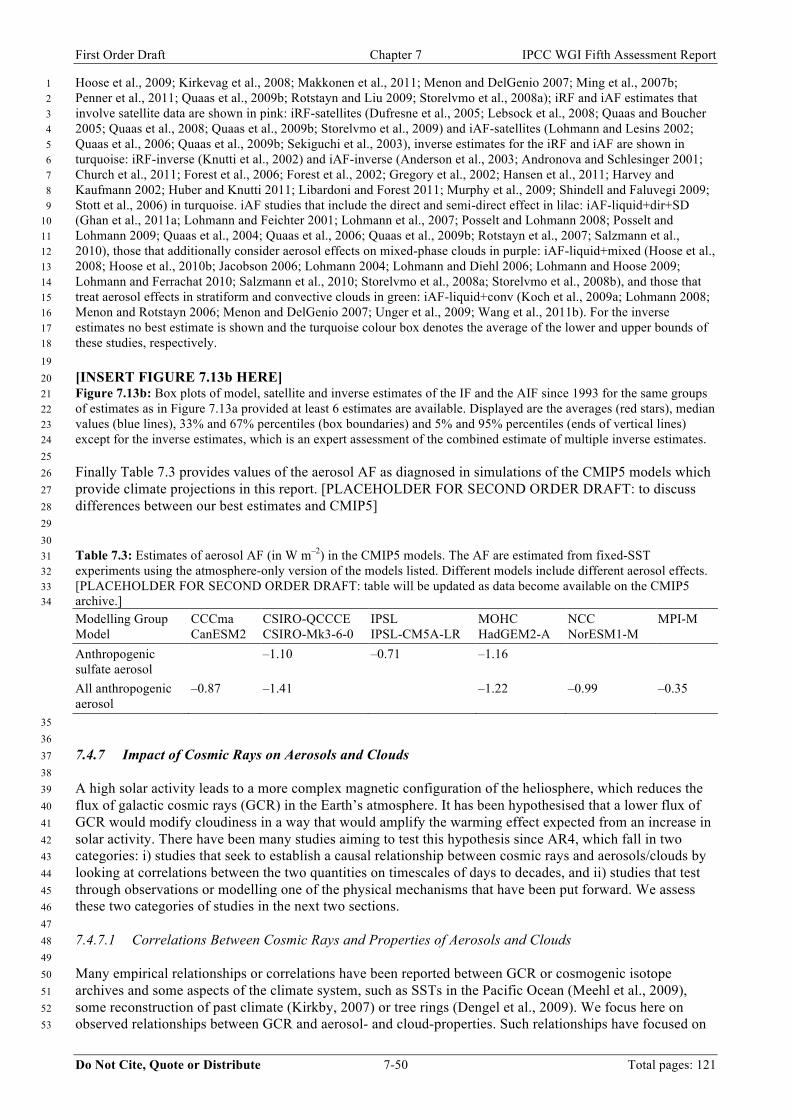
First Order Draft Chapter 7 IPCC WGI Fifth Assessment Report
Do Not Cite, Quote or Distribute 7-50 Total pages: 121
Hoose et al., 2009; Kirkevag et al., 2008; Makkonen et al., 2011; Menon and DelGenio 2007; Ming et al., 2007b; 1 Penner et al., 2011; Quaas et al., 2009b; Rotstayn and Liu 2009; Storelvmo et al., 2008a); iRF and iAF estimates that 2 involve satellite data are shown in pink: iRF-satellites (Dufresne et al., 2005; Lebsock et al., 2008; Quaas and Boucher 3 2005; Quaas et al., 2008; Quaas et al., 2009b; Storelvmo et al., 2009) and iAF-satellites (Lohmann and Lesins 2002; 4 Quaas et al., 2006; Quaas et al., 2009b; Sekiguchi et al., 2003), inverse estimates for the iRF and iAF are shown in 5 turquoise: iRF-inverse (Knutti et al., 2002) and iAF-inverse (Anderson et al., 2003; Andronova and Schlesinger 2001; 6 Church et al., 2011; Forest et al., 2006; Forest et al., 2002; Gregory et al., 2002; Hansen et al., 2011; Harvey and 7 Kaufmann 2002; Huber and Knutti 2011; Libardoni and Forest 2011; Murphy et al., 2009; Shindell and Faluvegi 2009; 8 Stott et al., 2006) in turquoise. iAF studies that include the direct and semi-direct effect in lilac: iAF-liquid+dir+SD 9 (Ghan et al., 2011a; Lohmann and Feichter 2001; Lohmann et al., 2007; Posselt and Lohmann 2008; Posselt and 10 Lohmann 2009; Quaas et al., 2004; Quaas et al., 2006; Quaas et al., 2009b; Rotstayn et al., 2007; Salzmann et al., 11 2010), those that additionally consider aerosol effects on mixed-phase clouds in purple: iAF-liquid+mixed (Hoose et al., 12 2008; Hoose et al., 2010b; Jacobson 2006; Lohmann 2004; Lohmann and Diehl 2006; Lohmann and Hoose 2009; 13 Lohmann and Ferrachat 2010; Salzmann et al., 2010; Storelvmo et al., 2008a; Storelvmo et al., 2008b), and those that 14 treat aerosol effects in stratiform and convective clouds in green: iAF-liquid+conv (Koch et al., 2009a; Lohmann 2008; 15 Menon and Rotstayn 2006; Menon and DelGenio 2007; Unger et al., 2009; Wang et al., 2011b). For the inverse 16 estimates no best estimate is shown and the turquoise colour box denotes the average of the lower and upper bounds of 17 these studies, respectively. 18
19 [INSERT FIGURE 7.13b HERE] 20 Figure 7.13b: Box plots of model, satellite and inverse estimates of the IF and the AIF since 1993 for the same groups 21 of estimates as in Figure 7.13a provided at least 6 estimates are available. Displayed are the averages (red stars), median 22 values (blue lines), 33% and 67% percentiles (box boundaries) and 5% and 95% percentiles (ends of vertical lines) 23 except for the inverse estimates, which is an expert assessment of the combined estimate of multiple inverse estimates. 24 25 Finally Table 7.3 provides values of the aerosol AF as diagnosed in simulations of the CMIP5 models which 26 provide climate projections in this report. [PLACEHOLDER FOR SECOND ORDER DRAFT: to discuss 27 differences between our best estimates and CMIP5] 28 29 30 Table 7.3: Estimates of aerosol AF (in W m–2) in the CMIP5 models. The AF are estimated from fixed-SST 31 experiments using the atmosphere-only version of the models listed. Different models include different aerosol effects. 32 [PLACEHOLDER FOR SECOND ORDER DRAFT: table will be updated as data become available on the CMIP5 33 archive.] 34
Modelling Group Model
CCCma CanESM2
CSIRO-QCCCE CSIRO-Mk3-6-0
IPSL IPSL-CM5A-LR
MOHC HadGEM2-A
NCC NorESM1-M
MPI-M
Anthropogenic sulfate aerosol
–1.10 –0.71 –1.16
All anthropogenic aerosol
–0.87 –1.41 –1.22 –0.99 –0.35
35 36 7.4.7 Impact of Cosmic Rays on Aerosols and Clouds 37 38 A high solar activity leads to a more complex magnetic configuration of the heliosphere, which reduces the 39 flux of galactic cosmic rays (GCR) in the Earth’s atmosphere. It has been hypothesised that a lower flux of 40 GCR would modify cloudiness in a way that would amplify the warming effect expected from an increase in 41 solar activity. There have been many studies aiming to test this hypothesis since AR4, which fall in two 42 categories: i) studies that seek to establish a causal relationship between cosmic rays and aerosols/clouds by 43 looking at correlations between the two quantities on timescales of days to decades, and ii) studies that test 44 through observations or modelling one of the physical mechanisms that have been put forward. We assess 45 these two categories of studies in the next two sections. 46 47 7.4.7.1 Correlations Between Cosmic Rays and Properties of Aerosols and Clouds 48 49 Many empirical relationships or correlations have been reported between GCR or cosmogenic isotope 50 archives and some aspects of the climate system, such as SSTs in the Pacific Ocean (Meehl et al., 2009), 51 some reconstruction of past climate (Kirkby, 2007) or tree rings (Dengel et al., 2009). We focus here on 52 observed relationships between GCR and aerosol- and cloud-properties. Such relationships have focused on 53
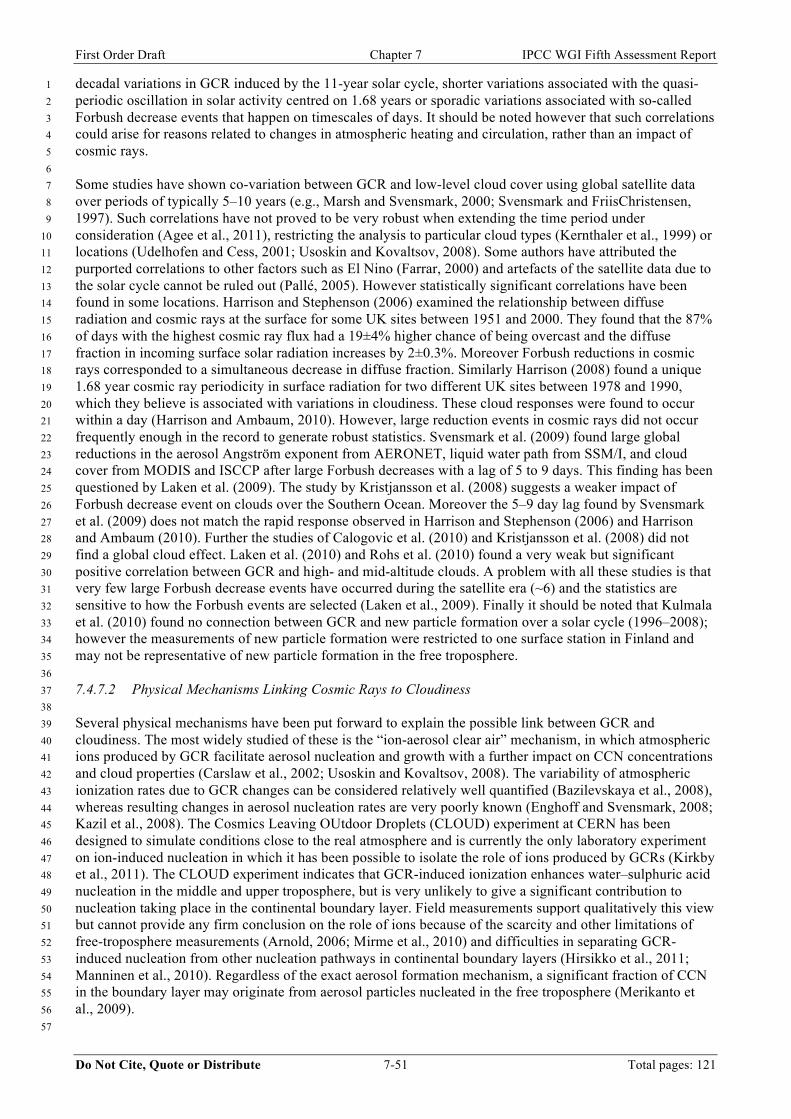
First Order Draft Chapter 7 IPCC WGI Fifth Assessment Report
Do Not Cite, Quote or Distribute 7-51 Total pages: 121
decadal variations in GCR induced by the 11-year solar cycle, shorter variations associated with the quasi-1 periodic oscillation in solar activity centred on 1.68 years or sporadic variations associated with so-called 2 Forbush decrease events that happen on timescales of days. It should be noted however that such correlations 3 could arise for reasons related to changes in atmospheric heating and circulation, rather than an impact of 4 cosmic rays. 5 6 Some studies have shown co-variation between GCR and low-level cloud cover using global satellite data 7 over periods of typically 5–10 years (e.g., Marsh and Svensmark, 2000; Svensmark and FriisChristensen, 8 1997). Such correlations have not proved to be very robust when extending the time period under 9 consideration (Agee et al., 2011), restricting the analysis to particular cloud types (Kernthaler et al., 1999) or 10 locations (Udelhofen and Cess, 2001; Usoskin and Kovaltsov, 2008). Some authors have attributed the 11 purported correlations to other factors such as El Nino (Farrar, 2000) and artefacts of the satellite data due to 12 the solar cycle cannot be ruled out (Pallé, 2005). However statistically significant correlations have been 13 found in some locations. Harrison and Stephenson (2006) examined the relationship between diffuse 14 radiation and cosmic rays at the surface for some UK sites between 1951 and 2000. They found that the 87% 15 of days with the highest cosmic ray flux had a 19±4% higher chance of being overcast and the diffuse 16 fraction in incoming surface solar radiation increases by 2±0.3%. Moreover Forbush reductions in cosmic 17 rays corresponded to a simultaneous decrease in diffuse fraction. Similarly Harrison (2008) found a unique 18 1.68 year cosmic ray periodicity in surface radiation for two different UK sites between 1978 and 1990, 19 which they believe is associated with variations in cloudiness. These cloud responses were found to occur 20 within a day (Harrison and Ambaum, 2010). However, large reduction events in cosmic rays did not occur 21 frequently enough in the record to generate robust statistics. Svensmark et al. (2009) found large global 22 reductions in the aerosol Angström exponent from AERONET, liquid water path from SSM/I, and cloud 23 cover from MODIS and ISCCP after large Forbush decreases with a lag of 5 to 9 days. This finding has been 24 questioned by Laken et al. (2009). The study by Kristjansson et al. (2008) suggests a weaker impact of 25 Forbush decrease event on clouds over the Southern Ocean. Moreover the 5–9 day lag found by Svensmark 26 et al. (2009) does not match the rapid response observed in Harrison and Stephenson (2006) and Harrison 27 and Ambaum (2010). Further the studies of Calogovic et al. (2010) and Kristjansson et al. (2008) did not 28 find a global cloud effect. Laken et al. (2010) and Rohs et al. (2010) found a very weak but significant 29 positive correlation between GCR and high- and mid-altitude clouds. A problem with all these studies is that 30 very few large Forbush decrease events have occurred during the satellite era (~6) and the statistics are 31 sensitive to how the Forbush events are selected (Laken et al., 2009). Finally it should be noted that Kulmala 32 et al. (2010) found no connection between GCR and new particle formation over a solar cycle (1996–2008); 33 however the measurements of new particle formation were restricted to one surface station in Finland and 34 may not be representative of new particle formation in the free troposphere. 35 36 7.4.7.2 Physical Mechanisms Linking Cosmic Rays to Cloudiness 37 38 Several physical mechanisms have been put forward to explain the possible link between GCR and 39 cloudiness. The most widely studied of these is the “ion-aerosol clear air” mechanism, in which atmospheric 40 ions produced by GCR facilitate aerosol nucleation and growth with a further impact on CCN concentrations 41 and cloud properties (Carslaw et al., 2002; Usoskin and Kovaltsov, 2008). The variability of atmospheric 42 ionization rates due to GCR changes can be considered relatively well quantified (Bazilevskaya et al., 2008), 43 whereas resulting changes in aerosol nucleation rates are very poorly known (Enghoff and Svensmark, 2008; 44 Kazil et al., 2008). The Cosmics Leaving OUtdoor Droplets (CLOUD) experiment at CERN has been 45 designed to simulate conditions close to the real atmosphere and is currently the only laboratory experiment 46 on ion-induced nucleation in which it has been possible to isolate the role of ions produced by GCRs (Kirkby 47 et al., 2011). The CLOUD experiment indicates that GCR-induced ionization enhances water–sulphuric acid 48 nucleation in the middle and upper troposphere, but is very unlikely to give a significant contribution to 49 nucleation taking place in the continental boundary layer. Field measurements support qualitatively this view 50 but cannot provide any firm conclusion on the role of ions because of the scarcity and other limitations of 51 free-troposphere measurements (Arnold, 2006; Mirme et al., 2010) and difficulties in separating GCR-52 induced nucleation from other nucleation pathways in continental boundary layers (Hirsikko et al., 2011; 53 Manninen et al., 2010). Regardless of the exact aerosol formation mechanism, a significant fraction of CCN 54 in the boundary layer may originate from aerosol particles nucleated in the free troposphere (Merikanto et 55 al., 2009). 56 57
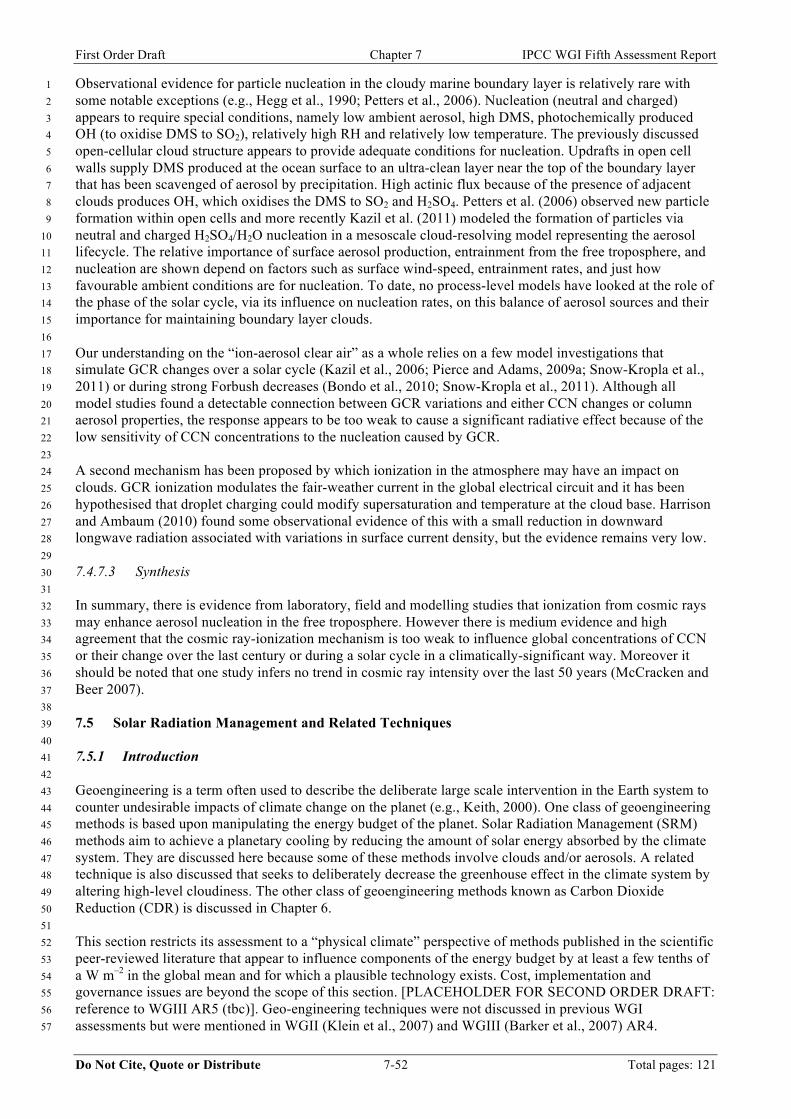
First Order Draft Chapter 7 IPCC WGI Fifth Assessment Report
Do Not Cite, Quote or Distribute 7-52 Total pages: 121
Observational evidence for particle nucleation in the cloudy marine boundary layer is relatively rare with 1 some notable exceptions (e.g., Hegg et al., 1990; Petters et al., 2006). Nucleation (neutral and charged) 2 appears to require special conditions, namely low ambient aerosol, high DMS, photochemically produced 3 OH (to oxidise DMS to SO2), relatively high RH and relatively low temperature. The previously discussed 4 open-cellular cloud structure appears to provide adequate conditions for nucleation. Updrafts in open cell 5 walls supply DMS produced at the ocean surface to an ultra-clean layer near the top of the boundary layer 6 that has been scavenged of aerosol by precipitation. High actinic flux because of the presence of adjacent 7 clouds produces OH, which oxidises the DMS to SO2 and H2SO4. Petters et al. (2006) observed new particle 8 formation within open cells and more recently Kazil et al. (2011) modeled the formation of particles via 9 neutral and charged H2SO4/H2O nucleation in a mesoscale cloud-resolving model representing the aerosol 10 lifecycle. The relative importance of surface aerosol production, entrainment from the free troposphere, and 11 nucleation are shown depend on factors such as surface wind-speed, entrainment rates, and just how 12 favourable ambient conditions are for nucleation. To date, no process-level models have looked at the role of 13 the phase of the solar cycle, via its influence on nucleation rates, on this balance of aerosol sources and their 14 importance for maintaining boundary layer clouds. 15 16 Our understanding on the “ion-aerosol clear air” as a whole relies on a few model investigations that 17 simulate GCR changes over a solar cycle (Kazil et al., 2006; Pierce and Adams, 2009a; Snow-Kropla et al., 18 2011) or during strong Forbush decreases (Bondo et al., 2010; Snow-Kropla et al., 2011). Although all 19 model studies found a detectable connection between GCR variations and either CCN changes or column 20 aerosol properties, the response appears to be too weak to cause a significant radiative effect because of the 21 low sensitivity of CCN concentrations to the nucleation caused by GCR. 22 23 A second mechanism has been proposed by which ionization in the atmosphere may have an impact on 24 clouds. GCR ionization modulates the fair-weather current in the global electrical circuit and it has been 25 hypothesised that droplet charging could modify supersaturation and temperature at the cloud base. Harrison 26 and Ambaum (2010) found some observational evidence of this with a small reduction in downward 27 longwave radiation associated with variations in surface current density, but the evidence remains very low. 28 29 7.4.7.3 Synthesis 30 31 In summary, there is evidence from laboratory, field and modelling studies that ionization from cosmic rays 32 may enhance aerosol nucleation in the free troposphere. However there is medium evidence and high 33 agreement that the cosmic ray-ionization mechanism is too weak to influence global concentrations of CCN 34 or their change over the last century or during a solar cycle in a climatically-significant way. Moreover it 35 should be noted that one study infers no trend in cosmic ray intensity over the last 50 years (McCracken and 36 Beer 2007). 37 38 7.5 Solar Radiation Management and Related Techniques 39 40 7.5.1 Introduction 41 42 Geoengineering is a term often used to describe the deliberate large scale intervention in the Earth system to 43 counter undesirable impacts of climate change on the planet (e.g., Keith, 2000). One class of geoengineering 44 methods is based upon manipulating the energy budget of the planet. Solar Radiation Management (SRM) 45 methods aim to achieve a planetary cooling by reducing the amount of solar energy absorbed by the climate 46 system. They are discussed here because some of these methods involve clouds and/or aerosols. A related 47 technique is also discussed that seeks to deliberately decrease the greenhouse effect in the climate system by 48 altering high-level cloudiness. The other class of geoengineering methods known as Carbon Dioxide 49 Reduction (CDR) is discussed in Chapter 6. 50 51 This section restricts its assessment to a “physical climate” perspective of methods published in the scientific 52 peer-reviewed literature that appear to influence components of the energy budget by at least a few tenths of 53 a W m–2 in the global mean and for which a plausible technology exists. Cost, implementation and 54 governance issues are beyond the scope of this section. [PLACEHOLDER FOR SECOND ORDER DRAFT: 55 reference to WGIII AR5 (tbc)]. Geo-engineering techniques were not discussed in previous WGI 56 assessments but were mentioned in WGII (Klein et al., 2007) and WGIII (Barker et al., 2007) AR4. 57
First Order Draft Chapter 7 IPCC WGI Fifth Assessment Report
Do Not Cite, Quote or Distribute 7-53 Total pages: 121
1 Virtually all research on SRM has followed one of two paths: i) theoretical and modelling studies and ii) a 2 search for analogues to SRM, and the impact of those phenomena to the planet (e.g., large volcanic eruptions 3 in the stratosphere such as Pinatubo, ship tracks, inadvertent climate modification from anthropogenic 4 aerosols, etc). The scientific tools required to explore SRM methods and their impact on the planet are 5 essentially the same as those needed to understand and predict the impacts of other forcing agents. The 6 predicted climate changes in response to SRM are subject to the same limitations and uncertainties as 7 predictions of future climate change. We assess geoengineering from two points of view: i) issues 8 surrounding the production of the radiative forcing and ii) the climate response and other impacts generated. 9 As with other types of climate forcing, there are serious limitations in our capability to predict regional 10 responses of the climate system to SRM. 11 12 7.5.2 Idealised Experiments 13 14 Some aspects of SRM methods can be explored in an idealised way by artificially reducing the solar constant 15 in a climate model. This results in a global cooling, albeit with a climate efficacy generally smaller than 1, 16 and a reduction in the global-mean precipitation. Earlier (Bala et al., 2008) and more recent (GeoMIP, 17 Kravitz et al., 2011) model experiments where the RF by CO2 is exactly balanced by a reduction in the solar 18 constant show some residual surface temperature changes, especially at high latitudes, and a reduction in the 19 global-mean precipitation which can be explained by arguments on the energy budget of the atmosphere 20 (Allen and Ingram, 2002; Andrews et al., 2010; Held and Soden, 2006). Figure 7.14 shows the annual-mean 21 temperature and precipitation changes produced by experiment G1 of the Geoengineering Model 22 Intercomparison Project for a subset of 4 models (GeoMIP, Kravitz et al., 2011). 23 24 [PLACEHOLDER FOR SECOND ORDER DRAFT: a more complete discussion of impacts on T, P, sea-ice 25 and soil moisture in the GeoMIP models.] 26 27 [INSERT FIGURE 7.14 HERE] 28 Figure 7.14: Multi-model mean of the residual surface temperature and precipitation changes from GeoMIP 29 simulations with a simultaneous fourfold increase in CO2 and a reduction in solar forcing which has been adjusted in 30 each model to maintain the top of atmosphere net flux imbalance within ±0.1 W m–2 (Kravitz et al., 2011). 31 32 Idealized experiments have also been conducted where solar radiation is reduced only over the ocean (e.g., to 33 mimic the effects of marine cloud seeding or increased sea foam). Bala et al. (2010) suggested that although 34 global-mean precipitation might decrease, precipitation over land might actually increase, because of 35 increased gradients in RF between land and ocean. Other studies have explored albedo changes over land 36 (e.g., to represent a surface albedo increase through plant albedo and desert regions) and over particular 37 latitudinal bands (Caldeira and Wood, 2008) or regions (Irvine et al., 2010; Irvine et al., 2011). 38 39 7.5.3 Stratospheric Aerosols 40 41 Observations in the aftermath of major volcanic eruptions like Pinatubo demonstrate that increasing 42 stratospheric aerosols will cool the planet and it has been suggested that global warming might be 43 deliberately countered with a continuous release of sulphur species (Budyko, 1974; Crutzen, 2006) to mimic 44 this. Most of the research on stratospheric aerosol SRM to date has explored the possibility of forming 45 sulphuric acid aerosols by injecting sulphur containing gases in the stratosphere, although using BC 46 (Crutzen, 2006; Keith, 2010) or metal oxides (Keith, 2010) has also been suggested. 47 48 There are many subtleties to SRM by stratospheric aerosols (Rasch et al., 2008b). The evolving size of the 49 particles in the stratosphere has profound effects on the viability of the strategy, with impacts on radiative 50 forcing by unit of injected mass, stratospheric ozone chemistry, and climate response. Initial modelling 51 studies recognized this fact but prescribed the aerosol size, assuming it would range between small sizes 52 characteristic of background conditions and the larger sizes observed soon after a major volcanic eruption 53 (Rasch et al., 2008a). Heckendorn et al. (2009) found that particle size from a continuous injection of gases 54 oxidizing to sulphuric acid particles could be very inefficient, because much of the sulphuric acid would 55 condense on particles already present from earlier SRM emissions. Particles would be likely to grow larger, 56 become less efficient per unit mass at scattering energy back to space, and sediment quicker out of the 57
First Order Draft Chapter 7 IPCC WGI Fifth Assessment Report
Do Not Cite, Quote or Distribute 7-54 Total pages: 121
stratosphere as the injection flux increases. They found that at least a four times higher injection rate would 1 be required to double the forcing for the scenario they explored. Pierce et al. (2010) have suggested a way 2 around this by introducing a source of sulphuric acid gas that immediately condenses to particles, bypassing 3 some coagulation and deposition processes that lead to particle growth from gaseous sulphur precursors. 4 5 Several modelling studies suggest that it would be possible to stabilize global average surface temperature at 6 least through a doubling of CO2 concentrations using stratospheric sulphate aerosol with many signatures 7 and planetary consequences that are similar to those found in the idealized studies, i.e., a residual warming at 8 high latitudes (assuming a more or less homogeneous distribution of stratospheric aerosols) and a reduction 9 in the global-mean precipitation. 10 11 Dispersion and lifetime of the aerosol dispersed in the stratosphere is a strong function of height and latitude 12 of the injection, with high latitude and lower injection altitudes being less effective. Local injections of 13 aerosol precursors at high latitudes will produce aerosol extending over sizable fraction of a hemisphere. 14 Early studies (Jones et al., 2010a; Rasch et al., 2008b; Robock et al., 2008) used somewhat different 15 experimental protocols and found significant disagreement in regional responses to stratospheric aerosols. It 16 is unclear whether differences in the regional responses are due to the experimental protocol, or to model 17 differences. [PLACEHOLDER FOR SECOND ORDER DRAFT: GeoMIP update] 18 19 Observations also show other impacts from volcanic eruptions like Pinatubo. There are measurable effects 20 on the hydrologic cycle (Trenberth and Dai, 2007) similar to those found in idealised experiments, impacts 21 on stratospheric ozone, and the ratio of direct to diffuse sunlight reaching the Earth’s surface. These effects 22 are also expected to occur from geoengineering with sulphate aerosols (see Rasch et al., 2008b and 23 references therein). Tilmes et al., (2009) used a model with a well resolved middle atmosphere and 24 stratospheric chemistry to explore responses to stratospheric aerosol SRM and found discernable shifts in 25 tropopause altitude (lifting by 1 km), and changes in ozone abundance (depletion at high latitudes and 26 increases in the tropics). This change is ozone might have discernable impacts on UV light reaching the 27 surface, although some earlier calculations suggest that there is some degree of compensation between 28 increases in UV associated with ozone depletion and decreases associated with attenuation by the aerosols 29 themselves (Vogelmann et al., 1992). A decrease in direct radiation and increase in diffuse radiation reaching 30 the Earth’s surface may increase photosynthesis in terrestrial ecosystems (Mercado et al., 2009; see Chapter 31 6) and impact some systems that exploit renewable solar energy [WGII Chapter xx]. 32 33 7.5.4 Cloud Brightening 34 35 Boundary layer clouds act to cool the planet, and relatively small changes in cloud albedo, lifetime, or areal 36 extent can have profound effects on the energy budget of the planet (e.g., Slingo, 1990). Latham (1990) 37 suggested that it might be possible to deliberately increase cloud albedo as a mechanism for countering 38 global warming by introducing additional sea salt particles into the marine boundary layer, to act as CCN, 39 “brightening” clouds through the aerosol-cloud indirect mechanisms described in Section 7.4. The idea has 40 been examined using models at various scales (cloud parcel models, large eddy simulations, and climate 41 models (e.g., Latham et al., 2008). Examples of cloud brightening include shiptracks produced in marine 42 stratocumulus clouds by emissions of particles from freighters and changes in trade cumulus cloud properties 43 produced by a relatively weak but continuous volcanic eruption of SO2 (Yuan et al., 2011). 44 45 Changing cloud morphology (e.g., from open to closed cells) or changing low-liquid water clouds to high 46 liquid water clouds have the potential to create large radiative forcings. Our current understanding suggests 47 that marine stratocumulus clouds are an optimal cloud type for brightening because of their relatively low 48 values of CDNC and the longer lifetime of sea-salt particles in non-precipitating environments. However 49 these clouds occupy a relatively small fraction of the planet and large RF (30–100 W m–2) would be required 50 locally to produce globally-averaged changes of the order of 1–5 W m–2. Studies cited in Section 7.4 51 highlight the importance of the details of aerosol-cloud interactions in influencing cloud albedo and lifetime 52 producing very large uncertainties about the viability of cloud brightening for SRM. Wang et al. (2011a) 53 explored the sensitivity of marine stratocumulus in various meteorological regimes and levels of background 54 aerosol amounts to aerosol injection strategies using a cloud system resolving model. That work 55 demonstrated very strong interactions between aerosol distribution, precipitation and cloud morphology and 56 differing responses in each scenario. Korhonen et al. (2010a) showed that “competition effects” between the 57
First Order Draft Chapter 7 IPCC WGI Fifth Assessment Report
Do Not Cite, Quote or Distribute 7-55 Total pages: 121
geoengineering aerosol and ambient aerosol could be important, with the ambient and SRM aerosol 1 populations competing for liquid water, sometimes reducing, rather than enhancing albedo in some 2 circumstances. 3 4 [PLACEHOLDER FOR SECOND ORDER DRAFT: contribution of geo-engineered sea-salt particles to the 5 direct effect to be discussed]. 6 7 Climate model studies (Jones et al., 2009; Latham et al., 2008; Rasch et al., 2009) that assumed 8 geoengineering would directly influence cloud drop number changed cloud albedo and produced global 9 average RF as negative as –5 W m–2. These studies also indicated some changes in regional precipitation 10 patterns, although the sign and amplitude of the changes differed between studies. 11 12 7.5.5 Surface Albedo Changes 13 14 It has also been suggested that planetary albedo can be increased by local changes to the albedo of urban 15 areas, croplands, grasslands, deserts and the ocean surfaces. 16 17 Rosenfeld et al. (1998) proposed to increase the albedo of urban areas as a way to improve air quality and 18 make cooling-energy savings in buildings especially during summertime. Hamwey (2007) estimated the 19 potential RF from whitening roofs and pavements at –0.17 W m–2 but more recent estimates accounting for 20 more realistic artificial surface area per capita and appropriate atmospheric radiative transfer suggest 21 significantly less negative values (Akbari et al., 2009; Lenton and Vaughan 2009; Oleson et al., 2010). 22 23 Hamwey (2007) further suggested that increasing the albedo of the world’s grassland (meaning open 24 shrubland, grassland and savannah) by replacing native species by other natural or bioengineered species. 25 Their RF estimate of –0.59 W m–2 (assuming the grassland albedo can be increased by 25% from an average 26 value of 0.17) has been revised to –0.5 W m–2 by Lenton and Vaughan (2009) when accounting for the 27 atmospheric absorption of the radiation reflected by the surface. Ridgwell et al. (2009) and Doughty et al. 28 (2011) extended the concept of increased surface albedo to croplands and found the maximum effect over 29 summertime mid-latitudes (e.g., 0.25 K per 0.01 increase in surface albedo in regions north of 30°N). 30 Ridgwell et al. (2009) estimated a global-mean surface cooling of 0.11 K for a +0.04 increase in cropland 31 albedo. Both studies pointed out to potential feedbacks in low-latitude regions with a reduction in soil 32 moisture, cloud cover and precipitation. The potential for increasing crop and grassland albedo across a wide 33 variety of species remains unproven. 34 35 Irvine et al. (2011) tested the impact of increasing desert albedo up to 0.80 in the HadCM3 model. This 36 cooled surface temperature by –1.1 K (versus –0.22 and –0.11 K for their largest crop and urban albedo 37 change). They also simulate significant land precipitation changes, with large reduction in rainfall over the 38 Indian and Sahel regions. 39 40 The low albedo of ocean surfaces and large areal extent mean only a small increase in albedo could be 41 sufficient to offset several W m–2 of RF by greenhouse gases. Engineering techniques (Evans et al., 2010; 42 Seitz, 2011) have been proposed to increase the fraction of the oceans covered with foam because of its large 43 albedo (Whitlock et al., 1982). However ocean foam is short-lived and artificial foam would somehow have 44 to be engineered to last longer. Neither the extent of foam generation and persistence required for a 45 significant climate impact nor the impact of artificial foam on the world’s ocean (including ocean biology, 46 air-sea fluxes of latent heat, sensible heat and trace gases, and surface emissivity) have been assessed in the 47 peer-reviewed literature. 48
49 7.5.6 Cirrus Thinning 50 51 Cirrus clouds affect both outgoing longwave radiation (OLR) and absorbed solar radiation. Thin high cirrus 52 above 300 hPa affects OLR more than incoming solar energy and thereby contribute to warming the climate 53 (see Section 7.2). Reducing the coverage or longwave opacity of these clouds would therefore contribute a 54 negative RF. Cirrus cloud coverage is sensitive to the ice fall speed which depends on ice crystal size. By 55 increasing ice crystal size in the coldest cirrus ice crystals could fall out and reduce the overall coverage 56 (Mitchell and Finnegan, 2009). Although an aerosol cloud seeding mechanism has been proposed to increase 57
First Order Draft Chapter 7 IPCC WGI Fifth Assessment Report
Do Not Cite, Quote or Distribute 7-56 Total pages: 121
crystal size, cirrus nucleation processes are not yet well enough understood to provide a firm basis to this 1 method (Section 7.4). 2 3 4 [START FAQ 7.1 HERE] 5 6 FAQ 7.1: How do Aerosols Affect Climate and Climate Change? 7 8 [INSERT FAQ 7.1, FIGURE 1 HERE] 9 FAQ 7.1, Figure 1: Overview of aerosol direct and indirect effects on climate. 10 11 It is believed that man-made variations in atmospheric aerosols are responsible for a cooling which have 12 partially masked the warming from man-made greenhouse gases. 13 14 Atmospheric aerosols are small particles suspended in the atmosphere with a typical lifetime of 1–2 weeks in 15 the troposphere and 1–2 years in the stratosphere. There are many types of aerosols, which can be of natural 16 (e.g., dust, sea-salt, some biogenic compounds) or anthropogenic (e.g., sulphates, soot, biomass burning 17 aerosols) origin. Atmospheric aerosols exhibit large variations in size, shape and chemical composition. 18 Changes in the climate can be caused either by emissions of anthropogenic aerosols and their precursors, or 19 by changes in natural aerosols which themselves respond to other changes in the climate system (e.g., 20 increase in dust due to a regional drying). 21 22 Aerosols affect climate in multiple ways. First they scatter and absorb sunlight which modifies the planet 23 radiative balance, an effect known as the aerosol direct effect (see FAQ.7.1, Figure 1). Aerosol scattering 24 generally results in a more reflective planet and a cooler global climate, while absorption results in a less 25 reflective planet and a warmer climate. Sulphate aerosols from fossil fuel burning are especially important in 26 scattering, while soot from some combustion sources is an important absorber. The balance between cooling 27 and warming depends on the aerosol properties and the environmental conditions. Many observational and 28 modelling studies have been done to quantify the global direct effect from anthropogenic and natural 29 aerosols. While these remain uncertain, studies have consistently indicated that the direct effect from 30 anthropogenic aerosols has been to cool the planet relative to what would otherwise have occurred. One of 31 the remaining uncertainties comes from aerosol absorption, which is more difficult to measure than 32 scattering and induces a specific cloud response (known as the semi-direct effect). 33 34 Since aerosols are distributed unevenly in the atmosphere, they can heat and cool the climate system in 35 patterns that can drive subtle changes to the weather, affecting cloud or rainfall amounts. These effects are 36 complex and hard to predict with current models, but several studies suggest significant effects on 37 precipitation in certain regions. 38 39 Aerosols also serve as condensation and freezing sites for cloud droplet and ice particle formation (see 40 FAQ.7.1, Figure 1). While it might seem that more condensation nuclei would increase the amount of low 41 clouds, cloud formation is largely limited by dynamical processes so that the net effect on clouds of more 42 aerosols is quite subtle and remains uncertain. A robust result is that more aerosols tend to produce liquid 43 clouds with more numerous and smaller particles, everything else being equal. This and other impacts on 44 clouds alter their reflectivity, producing what are called aerosol indirect effects on climate. Indirect effects 45 can arise through many pathways, particularly in ice or mixed liquid and ice clouds where phase changes are 46 sensitive to aerosols. Quantifying the overall impact is understandably more difficult than for the direct 47 effect, but again available studies generally indicate that the net indirect effect of anthropogenic aerosols has 48 been to further cool the climate system over the industrial period, enhancing their direct effect. 49 50 Because of their short lifetime, the abundance of aerosols and their climate effects have varied over time in 51 rough concert with anthropogenic emissions of aerosols and their gaseous precursors, and variations in 52 natural sources. Since anthropogenic emissions have increased substantially over the industrial period, this 53 has very likely counteracted some of the warming that would otherwise have occurred from increased 54 concentrations of long-lived greenhouse gases. Aerosols from volcanic eruptions such as those of the El 55 Chichón and Pinatubo have also caused sporadic cooling periods. Trends in anthropogenic aerosol emissions 56 over the last couple of decades have varied regionally (e.g., decreased emissions in industrialised countries, 57
First Order Draft Chapter 7 IPCC WGI Fifth Assessment Report
Do Not Cite, Quote or Distribute 7-57 Total pages: 121
increased emissions in developing countries) and it is difficult to assess whether the global impact has been 1 to cool or warm the planet over the recent period. It is very likely, however, that emissions of anthropogenic 2 aerosols will ultimately decrease. When this happens, decreasing aerosol emissions will begin to augment 3 greenhouse-gas induced warming. 4 5 Some studies have hypothesised that climate change could feed back on the lifecycle of atmospheric 6 aerosols, including natural aerosols such as sulphate, sea salt or biogenic aerosols. However there is 7 contradicting evidence so far whether this could be a large effect at the global scale over the coming century. 8 Moreover the sign of such a feedback is not known and could vary regionally. 9 10 [END FAQ 7.1 HERE] 11 12 13 [START FAQ 7.2 HERE] 14 15 FAQ 7.2: How do Clouds Affect Climate and Climate Change? 16 17 The importance of potential changes in cloudiness for the problem of climate change has been recognized as 18 a key factor since the 1970s. Clouds affect the climate system in a variety of ways. They produce 19 precipitation (rain and snow) that is necessary for life. They strongly affect the flows of both solar and 20 infrared radiation through the atmosphere. Finally, they are intimately associated with powerful vertical 21 motions that can carry air from near the surface to the upper troposphere in less than an hour. The strong 22 vertical currents carry energy, moisture, momentum, and various chemical constituents, including aerosols. 23 Each of the various cloud processes has the potential to change as the climate state evolves. Any change in a 24 cloud process that is caused by a climate change and in turn influences climate represents a cloud-climate 25 feedback. 26 27 Cloud feedbacks are of intense interest in the context of anthropogenic climate change. Many types of 28 possible cloud-climate feedbacks have been identified. Broadly speaking, they would occur through changes 29 in cloud amount, cloud top-height, and/or cloud optical properties. We still are not sure what types of cloud 30 feedbacks will actually occur and how significant they will be for climate change. Nevertheless, all of the 31 models used for the fourth IPCC Assessment produced either a positive or near-neutral cloud feedback. The 32 differences in cloud feedbacks among the models strongly influenced their differences in climate sensitivity. 33 34 Low clouds reflect a lot of solar radiation back to space, but have only a weak effect on the infrared radiation 35 emitted by the Earth. As a result, they tend to cool the Earth, in the present climate. In a future climate 36 warmed by increasing greenhouse gases, an increase in low cloud amount would increase the cooling, and so 37 could reduce the warming. On the other hand, a decrease in low-cloud amount would increase the warming. 38 39 Conversely, high cold clouds such as cirrus clouds are often somewhat transparent, so they do not reflect as 40 much solar radiation, but they can still absorb the infrared radiation coming from the Earth’s surface, leading 41 to a warming near the cloud-base level and reducing the energy Earth loses to space. They therefore tend to 42 warm the Earth as a whole. An increase in high cloud amount would tend to enhance greenhouse warming, 43 while a decrease would tend to reduce it. Even if the high-cloud amount remained the same, high clouds 44 could produce a positive feedback as the surface warms up, because they would prevent the extra infrared 45 energy emitted by the warmer surface from leaving the climate system. 46 47 The amount of sunlight a typical cloud would reflect in a warmer climate could be different for many 48 reasons. As an example, a warmer climate may see more clouds made of liquid drops, and fewer made of ice 49 crystals. That could lead to a change in the overall amount of light reflected. Clouds are also affected in 50 many ways by aerosols (see FAQ 7.1), which may have caused significant past changes (or may cause future 51 changes) in cloud reflectivity independent of any caused by climate change. Subtle changes in wind patterns 52 associated with transient or longer-term climate changes would also likely affect clouds. 53 54 In a climate change, there can be many different changes in the geographical patterns and seasonal 55 distributions of both high and low clouds. The net cloud feedback results from the combined effect of these 56 various changes. 57
First Order Draft Chapter 7 IPCC WGI Fifth Assessment Report
Do Not Cite, Quote or Distribute 7-58 Total pages: 121
1 For decades, climate scientists have been using observations to study how clouds change with the daily 2 weather, with the seasonal cycle, and with year-to-year changes such as those associated with El Niño. We 3 have also been working to improve the simulation of clouds in climate models. Many current models predict 4 a moderately positive net cloud feedback, in which both low and high clouds feed back positively. Work 5 continues to further evaluate and refine these results. 6 7 [PLACEHOLDER FOR SECOND ORDER DRAFT: addition of comment about confidence in current 8 models is being considered] 9 10 The net feedback from clouds on global climate, if any, will almost surely result from the net effect of many 11 diverse regional changes. This makes predicting the cloud feedback very difficult. While it would be 12 desirable to infer this long-term cloud feedback somehow from observations, there is no way to do this that 13 is broadly accepted as valid. To predict cloud phenomena comprehensively requires a global climate model; 14 these models produce cloud fields that roughly resemble those observed, but are far from perfect. Models 15 vary in how they predict clouds will change in a warmer climate, but so far no model has predicted changes 16 in clouds so large that they significantly limit global warming, and nearly all models predict that cloud 17 changes will actually amplify global warming. 18 19 [END FAQ 7.2 HERE] 20 21 22 [START FAQ 7.3 HERE] 23 24 FAQ 7.3: Could Geoengineering Counteract Climate Change and What Side-Effects Might Occur? 25 26 There are two different categories of geoengineering methods which are usually referred to as Solar 27 Radiation Management (SRM, assessed in Chapter 7) and Carbon Dioxide Removal (CDR, assessed in 28 Chapter 6). A less technical name for SRM is Sunlight Reflection Management. We discuss these in turn. 29 30 Carbon dioxide removal methods 31 32 By definition, CDR methods seek to accelerate the removal of CO2 from the atmosphere and store it in land, 33 ocean or geological reservoirs. Afforestation/reforestation, carbon sequestration in soils, bioenergy 34 associated to carbon capture and storage, ocean fertilization, accelerated weathering of silicate and carbonate 35 rocks and CO2 air capture using chemical methods are some of the proposed CDR methods (see FAQ.7.3, 36 Figure 1). 37
38 [INSERT FAQ 7.3, FIGURE 1 HERE] 39 FAQ 7.3, Figure 1: Overview of carbon dioxide removal methods. 40
41 CDR methods rely primarily on natural carbon cycle processes, either biological or chemical: enhanced 42 biological production by photosynthesis on (1) land and (2) oceans, (3) accelerated chemical weathering 43 reactions over (3) land and oceans and (4) enhanced solubility pump in the oceans. Direct air capture is an 44 exception which relies on artificial chemical methods to remove CO2 directly from air. Once captured, CO2 45 would be stored within land and ocean reservoirs or geological formations. Land storage occurs in organic 46 form but storage in oceans and geological formations is in inorganic forms. 47 48 To have a noticeable climate effect, CDR schemes should be able to remove several PgC per year from the 49 atmosphere over several decades in this century. Important scientific considerations include the storage 50 capacity and permanence of the reservoirs, and potential adverse side effects. CDR methods cause a 51 “rebound effect”: when carbon is stored in one reservoir, the concentration gradient between the atmosphere 52 and carbon reservoirs is reduced and thereby the subsequent inherent rate of removal of CO2 from the 53 atmosphere by natural reservoirs is reduced or could even be reversed. 54 55 In general, CDR methods are believed to be relatively low risk in terms of unintended climatic side effects 56 because they counter the root cause by reducing atmospheric carbon dioxide concentrations. CDR schemes 57
First Order Draft Chapter 7 IPCC WGI Fifth Assessment Report
Do Not Cite, Quote or Distribute 7-59 Total pages: 121
also reduce direct consequences of high CO2 levels including surface ocean acidification. However, proposed 1 CDR methods have limited potential to rapidly decrease the atmospheric concentration of CO2. The large 2 thermal inertia of climate system need to be also considered: many components of the earth system may 3 continue to respond for decades or centuries to the original increases in CO2 even after CDR is applied. 4 Therefore, decreases in surface temperature would lag CDR-induced decreases in atmospheric CO2 5 concentrations. 6 7 There are some potential climate or environmental effects from CDR methods. Some examples of the side 8 effects are: 1) removal of atmospheric CO2 would lead to a temporary acceleration in the global water cycle. 9 2) Implementation of CDR methods could lead to reduced plant productivity when compared to the elevated 10 level expected with high CO2 concentration. 3) Large scale biological production over land could have 11 climate consequences by altering the surface characteristics such as surface reflectivity and 12 evapotranspiration. For instance, many modelling studies have shown that afforestation in seasonally snow 13 covered regions could accelerate global warming. 4) In the case of ocean fertilization, the utilization of 14 macronutrients such as nitrogen and phosphate in the fertilized region can lead to a decrease in production 15 "downstream" from the fertilized region. 5) Ocean iron fertilization could acidify the deep ocean by storing 16 more dissolved inorganic carbon there. 6) Enhanced biological production over oceans could potentially lead 17 to expanded regions with low oxygen concentration, increased production of N2O and CH4, and possible 18 disruptions to marine ecosystems. 19 20 While the rate of removal of CO2 through accelerated weathering and direct air capture methods are limited 21 primarily by cost, energy and environmental constraints, those methods involving biological processes 22 operate much more slowly with estimates of maximum physical potential for atmospheric CO2 removal for 23 each of the more effective biological CDR strategies to be on the order of 100 Gt C (~ 50 ppmv of CO2) over 24 a century, with similar limitations from cost, energy and environmental issues. 25 26 Solar radiation management methods 27 28 The average temperature of the planet is controlled by the amount of sunlight absorbed by the Earth’s 29 atmosphere and surface, and the degree to which gases and clouds in the atmosphere hinder the escape of the 30 energy back to space. If less incoming sunlight reaches the surface (because of an increase in the reflectivity 31 of the planet) or if it becomes easier for energy to escape (because of a decrease in heat trapping gases or 32 some types of clouds), the average surface temperature will decrease. 33 34 Geoengineering methods relying on managing the Earth’s radiative budget are based on this fundamental 35 physical principle. These methods seek to increase the reflectivity of the planet by making the atmosphere, 36 clouds or the surface more reflective or by suppressing cirrus clouds that hinder the escape of energy from 37 the Earth system (see FAQ.7.3, Figure 2). 38 39 [INSERT FAQ 7.3, FIGURE 2 HERE] 40 FAQ 7.3, Figure 2: Overview of solar radiation management methods. 41 42 Basic physics tells us that if either of these changes is successful, the planet will cool. The picture is 43 complicated, however, because of the multiple complex physical processes that govern the interactions 44 between the flow of energy, the atmospheric circulation, weather and the resulting climate. While the 45 average surface temperature of the planet responds to the energy budget in a rather straightforward way, the 46 temperature at any particular location and time is influenced by many other factors. It is expected that any 47 particular geoengineering technique will cool some regions more than others: the locations where radiation 48 management cools the planet need not correspond to the locations and times where greenhouse gases 49 produce a warming. For example, a change in the amount of sunlight via radiation management will operate 50 only during daytime, but changes in greenhouse gases affect heating rates during both day and night. This 51 inexact compensation will have some influence on the diurnal cycle of surface temperature at any given 52 location, even if the average surface temperature is unchanged. This is a simple example of inexact 53 compensation but other subtle changes may also occur. 54 55 Climate is much more than surface temperature, however; it is also characterized by precipitation patterns, 56 the distribution of snowpack and sea-ice, and the frequency of occurrence of extreme events, just to name a 57

First Order Draft Chapter 7 IPCC WGI Fifth Assessment Report
Do Not Cite, Quote or Distribute 7-60 Total pages: 121
few. Both models and theory show that compensating an increased greenhouse effect with an increased 1 planetary reflectivity will not maintain both the average surface temperature and the average precipitation 2 rate. Regional changes in heating/cooling are expected to affect local precipitation rates, and other aspects of 3 climate. The imprecise compensation in regional and global climate patterns make it unlikely that solar 4 radiation management will produce a future climate that is “just like” the one we experience today, or have 5 experienced in the past. The residual climate changes from inexact compensation may increase as the 6 geoengineering effort is scaled up. 7 8 In addition, solar radiation management techniques may also have other side effects. For example, radiation 9 management by stratospheric sulphate aerosols can produce stratospheric ozone depletion, and changes in 10 the ratio of direct to diffuse sunlight reaching the surface that can affect terrestrial ecosystems. Moreover, 11 radiation management will not have any impact on ocean acidification, which is driven by the atmospheric 12 CO2 concentration. A key unanswered question is whether or not the benefits of radiation management 13 outweigh the associated risks, in light of the expected residual impacts. 14 15 [END FAQ 7.3 HERE] 16
17
First Order Draft Chapter 7 IPCC WGI Fifth Assessment Report
Do Not Cite, Quote or Distribute 7-61 Total pages: 121
References 1 2 Abbatt, J. P. D., S. Benz, D. J. Cziczo, Z. Kanji, U. Lohmann, and O. Mohler, 2006: Solid ammonium sulfate 3
aerosols as ice nuclei: A pathway for cirrus cloud formation. Science, 313, 1770-1773. 4 Abdul-Razzak, H., and S. Ghan, 2000: A parameterization of aerosol activation 2. Multiple aerosol types. J. 5
Geophys. Res., 105, 6837-6844. 6 Ackerman, A. S., M. P. Kirkpatrick, D. E. Stevens, and O. B. Toon, 2004: The impact of humidity above 7
stratiform clouds on indirect aerosol climate forcing. Nature, 432, 1014-1017. 8 Ackerman, A. S., and Coauthors, 2009: Large-eddy simulations of a drizzling, stratocumulus-topped marine 9
boundary layer. Monthly Weather Review, 137, 1083-1110. 10 Adachi, K., S. H. Chung, and P. R. Buseck, 2010: Shapes of soot aerosol particles and implications for their 11
effects on climate. Journal of Geophysical Research, 115, D15206. 12 Adams, P. J., J. H. Seinfeld, D. Koch, L. Mickley, and D. Jacob, 2001: General circulation model assessment 13
of direct radiative forcing by the sulfate-nitrate-ammonium-water inorganic aerosol system. Journal of 14 Geophysical Research, 106, 1097-1111. 15
Agee, E. M., K. Kiefer, and E. Cornett, 2011: Relationship of lower troposphere cloud cover and cosmic 16 rays:An updated perspective. Journal of Climate, early online release. 17
Ahern, H. E., K. A. Walsh, T. C. J. Hill, and B. F. Moffett, 2007: Fluorescent pseudomonads isolated from 18 Hebridean cloud and rain water produce biosurfactants but do not cause ice nucleation. 19 Biogeosciences, 4, 115-124. 20
Akbari, H., S. Menon, and A. Rosenfeld, 2009: Global cooling: increasing world-wide urban albedos to 21 offset CO2. Climatic Change, 94, 275-286. 22
Albrecht, B. A., 1989: Aerosols, cloud microphysics, and fractional cloudiness. Science, 245, 1227-1230. 23 Alexander, D. T. L., P. A. Crozier, and J. R. Anderson, 2008: Brown carbon spheres in East Asian outflow 24
and their optical properties. Science, 321, 833-836. 25 Allan, R. P., and B. J. Soden, 2008: Atmospheric warming and the amplification of precipitation extremes. 26
Science, 321, 1481-1484. 27 Allan, R. P., B. J. Soden, V. O. John, W. Ingram, and P. Good, 2010: Current changes in tropical 28
precipitation. Environmental Research Letters, 5, 025205 29 Allen, M. R., and W. J. Ingram, 2002: Constraints on future changes in climate and the hydrologic cycle. 30
Nature, 419, 224-232. 31 Allen, R. J., and S. C. Sherwood, 2010: Aerosol-cloud semi-direct effect and land-sea temperature contrast in 32
a GCM. Geophysical Research Letters, 37, L07702. 33 Anderson, T. L., R. J. Charlson, S. E. Schwartz, R. Knutti, O. Boucher, H. Rodhe, and J. Heintzenberg, 34
2003: Climate forcing by aerosols - a hazy picture. Science, 300, 1103-1104. 35 Anderson, T. L., and Coauthors, 2009: Temporal and Spatial variability of clouds and related aerosol. Clouds 36
in the Perturbed Climate System: Their Relationship to Energy Balance, Atmospheric Dynamics, and 37 Precipitation, R. J. a. H. Charlson, J., Ed., MIT Press, 127-148. 38
Anderson, T. L., and Coauthors, 2005: An "A-Train" strategy for quantifying direct climate forcing by 39 anthropogenic aerosols. Bulletin of the American Meteorological Society, 86, 1795-1809. 40
Andreae, M. O., and A. Gelencser, 2006: Black carbon or brown carbon? The nature of light-absorbing 41 carbonaceous aerosols. Atmospheric Chemistry and Physics, 6, 3131-3148. 42
Andreae, M. O., C. D. Jones, and P. M. Cox, 2005: Strong present-day aerosol cooling implies a hot future. 43 Nature, 435, 1187-1190. 44
Andreae, M. O., D. Rosenfeld, P. Artaxo, A. A. Costa, G. P. Frank, K. M. Longo, and M. A. F. Silva-Dias, 45 2004: Smoking rain clouds over the Amazon. Science, 303, 1337-1342. 46
Andrews, T., and P. M. Forster, 2008: CO2 forcing induces semi-direct effects with consequences for climate 47 feedback interpretations. Geophysical Research Letters, 35, ARTN L04802. 48
Andrews, T., P. M. Forster, O. Boucher, N. Bellouin, and A. Jones, 2010: Precipitation, radiative forcing and 49 global temperature change. Geophysical Research Letters, 37, ARTN L14701. 50
Andronova, N. G., and M. E. Schlesinger, 2001: Objective estimation of the probability density function for 51 climate sensitivity. Journal of Geophysical Research, 106, 22605-22611. 52
Ansmann, A., and Coauthors, 2008: Influence of Saharan dust on cloud glaciation in southern Morocco 53 during the Saharan Mineral Dust Experiment. Journal of Geophysical Research, 113, D04210. 54
Arakawa, A., 1975: Modeling clouds and cloud processes for use in climate models. The physical basis of 55 climate and climate modelling, ICSU/W MO, 181-197. 56
First Order Draft Chapter 7 IPCC WGI Fifth Assessment Report
Do Not Cite, Quote or Distribute 7-62 Total pages: 121
——, 2004: The cumulus parameterization problem: Past, present, and future. Journal of Climate, 17, 2493-1 2525. 2
Archuleta, C. M., P. J. DeMott, and S. M. Kreidenweis, 2005: Ice nucleation by surrogates for atmospheric 3 mineral dust and mineral dust/sulfate particles at cirrus temperatures. Atmospheric Chemistry and 4 Physics, 5, 2617-2634. 5
Ariya, P. A., J. Sun, N. A. Eltouny, E. D. Hudson, C. T. Hayes, and G. Kos, 2009: Physical and chemical 6 characterization of bioaerosols - Implications for nucleation processes. International Reviews in 7 Physical Chemistry, 28, 1-32. 8
Arneth, A., R. K. Monson, G. Schurgers, U. Niinemets, and P. I. Palmer, 2008: Why are estimates of global 9 terrestrial isoprene emissions so similar (and why is this not so for monoterpenes)? Atmospheric 10 Chemistry and Physics, 8, 4605-4620. 11
Arneth, A., P. A. Miller, M. Scholze, T. Hickler, G. Schurgers, B. Smith, and I. C. Prentice, 2007: CO2 12 inhibition of global terrestrial isoprene emissions: Potential implications for atmospheric chemistry. 13 Geophysical Research Letters, 34, ARTN L18813. 14
Arnold, F., 2006: Atmospheric aerosol and cloud condensation nuclei formation: A possible influence of 15 cosmic rays? Space Science Reviews, 125, 169-186. 16
Artaxo, P., and Coauthors, 1998: Large-scale aerosol source apportionment in Amazonia. Journal of 17 Geophysical Research, 103, 31837-31847. 18
Artaxo, P., and Coauthors, 2002: Physical and chemical properties of aerosols in the wet and dry seasons in 19 Rondônia, Amazonia. Journal of Geophysical Research, 107. 20
Aw, J., and M. J. Kleeman, 2003: Evaluating the first-order effect of intraannual temperature variability on 21 urban air pollution. Journal of Geophysical Research, 108, ARTN 4365. 22
Ayers, G. P., and J. M. Cainey, 2007: The CLAW hypothesis: a review of the major developments. 23 Environmental Chemistry, 4, 366-374. 24
Baker, M. B., and R. J. Charlson, 1990: Bistability of CCN concentrations and thermodynamics in the cloud-25 topped boundary-layer. Nature, 345, 142-145. 26
Baker, M. B., and T. Peter, 2008: Small-scale cloud processes and climate. Nature, 451, 299-300. 27 Bala, G., P. B. Duffy, and K. E. Taylor, 2008: Impact of geoengineering schemes on the global hydrological 28
cycle. Proc. Natl. Acad. Sci. U S A, 105, 7664–7669. 29 Bala, G., K. Caldeira, and R. Nemani, 2010: Fast versus slow response in climate change: implications for 30
the global hydrological cycle. Climate Dynamics, 35, 423-434. 31 Barahona, D., and A. Nenes, 2009: Parameterizing the competition between homogeneous and 32
heterogeneous freezing in ice cloud formation - polydisperse ice nuclei. Atmospheric Chemistry and 33 Physics, 9, 5933-5948. 34
Barahona, D., R. Sotiropoulou, and A. Nenes, 2011: Global distribution of cloud droplet number 35 concentration, autoconversion rate, and aerosol indirect effect under diabatic droplet activation. 36 Journal of Geophysical Research, 116, D09203. 37
Barker, T., and Coauthors, 2007: Summary for Policymakers, IPCC Fourth Assessment Report, Working 38 Group III. 36 pp. 39
Barmet, P., T. Kuster, A. Muhlbauer, and U. Lohmann, 2009: Weekly cycle in particulate matter versus 40 weekly cycle in precipitation over Switzerland. J. Geophys. Res., 114, D05206. 41
Bauer, S., E. Bierwirth, M. Esselborn, A. Petzold, A. Macke, T. Trautmann, and M. Wendisch, 2011: 42 Airborne spectral radiation measurements to derive solar radiative forcing of Saharan dust mixed with 43 biomass burning smoke particles. Tellus, 63B, 742-750. 44
Bauer, S. E., D. Koch, N. Unger, S. M. Metzger, D. T. Shindell, and D. G. Streets, 2007: Nitrate aerosols 45 today and in 2030: a global simulation including aerosols and tropospheric ozone. Atmospheric 46 Chemistry and Physics, 7, 5043-5059. 47
Bauer, S. E., and Coauthors, 2008: MATRIX (Multiconfiguration Aerosol TRacker of mIXing state): an 48 aerosol microphysical module for global atmospheric models. Atmospheric Chemistry and Physics, 8, 49 6003-6035. 50
Bäumer, D., R. Rinke, and B. Vogel, 2008: Weekly periodicities of Aerosol Optical Thickness over Central 51 Europe – evidence of an anthropogenic direct aerosol effect. Atmos. Chem. Phys., 8, 83-90. 52
Baustian, K. J., M. E. Wise, and M. A. Tolbert, 2010: Depositional ice nucleation on solid ammonium 53 sulfate and glutaric acid particles. Atmospheric Chemistry and Physics, 10, 2307-2317. 54
Bazilevskaya, G. A., and Coauthors, 2008: Cosmic ray induced ion production in the atmosphere. Space 55 Science Reviews, 137, 149-173. 56
First Order Draft Chapter 7 IPCC WGI Fifth Assessment Report
Do Not Cite, Quote or Distribute 7-63 Total pages: 121
Bechtold, P., and Coauthors, 2008: Advances in simulating atmospheric variability with the ECMWF model: 1 From synoptic to decadal time-scales. Quarterly Journal of the Royal Meteorological Society, 134, 2 1337-1351. 3
Bell, T. L., D. Rosenfeld, K.-M. Kim, J.-M. Yoo, M.-I. Lee, and M. Hahnenberger, 2008: Midweek increase 4 in US summer rain and storm heights suggests air pollution invigorates rainstorms. Journal of 5 Geophysical Research-Atmospheres, 113. 6
Bellouin, N., O. Boucher, J. Haywood, and M. S. Reddy, 2005: Global estimate of aerosol direct radiative 7 forcing from satellite measurements. Nature, 438, 1138-1141. 8
Bellouin, N., A. Jones, J. Haywood, and S. A. Christopher, 2008: Updated estimate of aerosol direct 9 radiative forcing from satellite observations and comparison against the Hadley Centre climate model. 10 Journal of Geophysical Research, 113, D10205. 11
Bellouin, N., J. Rae, C. Johnson, J. Haywood, A. Jones, and O. Boucher, 2011: Aerosol forcing in Hadley 12 Centre CMIP5 simulations and the role of nitrate. Journal of Geophysical Research, 116, D20206. 13
Bender, F. A.-M., V. Ramanathan, and G. Tselioudis, 2011: Changes in extratropical storm track cloudiness 14 1983–2008: observational support for a poleward shift. Climate Dynamics, Published online. 15
Benedetti, A., and Coauthors, 2009: Aerosol analysis and forecast in the ECMWF Integrated Forecast 16 System. Part II : Data assimilation. Journal of Geophysical Research, 114, D13205. 17
Benedict, J. J., and D. A. Randall, 2009: Structure of the Madden-Julian Oscillation in the 18 Superparameterized CAM. Journal of the Atmospheric Sciences, 66 3277-3296. 19
Benson, D. R., J. H. Yu, A. Markovich, and S. H. Lee, 2011: Ternary homogeneous nucleation of H2SO4, 20 NH3, and H2O under conditions relevant to the lower troposphere. Atmospheric Chemistry and 21 Physics, 11, 4755-4766. 22
Berg, P., J. O. Haerter, P. Thejll, C. Piani, S. Hagemann, and J. H. Christensen, 2009: Seasonal 23 characteristics of the relationship between daily precipitation intensity and surface temperature. 24 Journal of Geophysical Research, 114, D18102. 25
Bergamo, A., A. M. Tafuro, S. Kinne, F. De Tomasi, and M. R. Perrone, 2008: Monthly-averaged 26 anthropogenic aerosol direct radiative forcing over the Mediterranian based on AERONET aerosol 27 properties. Atmospheric Chemistry and Physics, 8, 6995-7014. 28
Berndt, T., and Coauthors, 2010: Laboratory study on new particle formation from the reaction OH + SO2: 29 influence of experimental conditions, H2O vapour, NH3 and the amine tert-butylamine on the overall 30 process. Atmospheric Chemistry and Physics, 10, 7101-7116. 31
Bertram, A. K., T. Koop, L. T. Molina, and M. J. Molina, 2000: Ice formation in (NH4)2SO4-H2O particles. 32 Journal of Physical Chemistry A, 104, 584-588. 33
Bi, X., and Coauthors, 2011: Mixing state of biomass burning particles by single particle aerosol mass 34 spectrometer in the urban area of PRD, China. Atmospheric Environment, 45, 3447-3453. 35
Blossey, P. N., C. S. Bretherton, and M. C. Wyant, 2009: Subtropical low cloud response to a warmer 36 climate in a superparameterized climate model: Part II, Column modeling with a cloud resolving 37 model. J. Adv. Modeling Earth Syst., 1, 8. 38
Bond, T. C., and R. W. Bergstrom, 2006: Light absorption by carbonaceous particles: An investigative 39 review. Aerosol Science and Technology, 40, 27-67. 40
Bondo, T., M. B. Enghoff, and H. Svensmark, 2010: Model of optical response of marine aerosols to 41 Forbush decreases. Atmospheric Chemistry and Physics, 10, 2765-2776. 42
Bony, S., and J. L. Dufresne, 2005: Marine boundary layer clouds at the heart of tropical cloud feedback 43 uncertainties in climate models. Geophysical Research Letters, 32. 44
Bony, S., J. L. Dufresne, H. Le Treut, J. J. Morcrette, and C. Senior, 2004: On dynamic and thermodynamic 45 components of cloud changes. Climate Dynamics, 22, 71-86. 46
Bony, S., and Coauthors, 2006: How well do we understand and evaluate climate change feedback 47 processes? Journal of Climate, 19, 3445-3482. 48
Bopp, L., O. Boucher, O. Aumont, S. Belviso, J. L. Dufresne, M. Pham, and P. Monfray, 2004: Will marine 49 dimethylsulfide emissions amplify or alleviate global warming? A model study. Canadian Journal of 50 Fisheries and Aquatic Sciences, 61, 826-835. 51
Boucher, O., 1999: Air traffic may increase cirrus cloudiness. Nature, 30-31. 52 Boucher, O., and U. Lohmann, 1995: The sulfate-CCN-cloud albedo effect - A sensitivity study with 2 53
general circulation models. Tellus, 47B, 281-300. 54 Boucher, O., and M. Pham, 2002: History of sulfate aerosol radiative forcings. Geophysical Research 55
Letters, ARTN 1308. 56
First Order Draft Chapter 7 IPCC WGI Fifth Assessment Report
Do Not Cite, Quote or Distribute 7-64 Total pages: 121
Boucher, O., G. Myhre, and A. Myhre, 2004: Direct influence of irrigation on atmospheric water vapour and 1 climate. Climate Dynamics, 22, 597–603. 2
Bourotte, C., A.-P. Curi-Amarante, M.-C. Forti, L. A. A. Pereira, A. L. Braga, and P. A. Lotufo, 2007: 3 Association between ionic composition of fine and coarse aerosol soluble fraction and peak expiratory 4 flow of asthmatic patients in Sao Paulo city (Brazil). Atmospheric Environment, 41, 2036–2048. 5
Brenninkmeijer, C. A. M., and Coauthors, 2007: Civil Aircraft for the regular investigation of the 6 atmosphere based on an instrumented container: The new CARIBIC system. Atmospheric Chemistry 7 and Physics, 7, 4953-4976. 8
Bretherton, C., and S. Park, 2009: A New Moist Turbulence Parameterization in the Community Atmosphere 9 Model. Journal of Climate, 3422-3448. 10
Bretherton, C. S., P. N. Blossey, and J. Uchida, 2007: Cloud droplet sedimentation, entrainment efficiency, 11 and subtropical stratocumulus albedo. Geophysical Research Letters, 34, L03813. 12
Brioude, J., and Coauthors, 2009: Effect of biomass burning on marine stratocumulus clouds off the 13 California coast. Atmospheric Chemistry and Physics, 9, 8841-8856. 14
Brock, C. A., and Coauthors, 2011: Characteristics, sources, and transport of aerosols measured in spring 15 2008 during the aerosol, radiation, and cloud processes affecting Arctic Climate (ARCPAC) Project. 16 Atmospheric Chemistry and Physics, 11, 2423-2453. 17
Budyko, M. I., 1974: Izmeniya Klimata. Gidrometeoizdat. 18 Bundke, U., B. Nillius, R. Jaenicke, T. Wetter, H. Klein, and H. Bingemer, 2008: The fast Ice Nucleus 19
chamber FINCH. Atmospheric Research, 90, 180-186. 20 Burkhardt, U., and B. Kärcher, 2009: Process-based simulation of contrail cirrus in a global climate model. 21
J. Geophys. Res., 114, D16201. 22 Burkhardt, U., and B. Kärcher, 2011: Global radiative forcing from contrail cirrus. Nature Climate Change, 23
1, 54-58. 24 Caldeira, K., and L. Wood, 2008: Global and Arctic climate engineering: numerical model studies. 25
Philosophical Transactions of the Royal Society a-Mathematical Physical and Engineering Sciences, 26 366, 4039-4056. 27
Caldwell, P., and C. S. Bretherton, 2009: Response of a subtropical stratocumulus-capped mixed layer to 28 climate and aerosol changes. Journal of Climate, 22, 20-38 29
Calogovic, J., C. Albert, F. Arnold, J. Beer, L. Desorgher, and E. O. Flueckiger, 2010: Sudden cosmic ray 30 decreases: No change of global cloud cover. Geophysical Research Letters, 37, L03802. 31
Cao, L., G. Bala, and K. Caldeira, 2011: Why is there a short-term increase in global precipitation in 32 response to diminished CO2 forcing? Geophys. Res. Lett., 38, L06703. 33
Carrico, C. M., M. H. Bergin, A. B. Shrestha, J. E. Dibb, L. Gomes, and J. M. Harris, 2003: The importance 34 of carbon and mineral dust to seasonal aerosol properties in the Nepal Himalaya. Atmospheric 35 Environment, 37, 2811-2824. 36
Carslaw, K., O. Boucher, D. Spracklen, G. Mann, J. Rae, S. Woodward, and M. Kulmala, 2010: A review of 37 natural aerosol interactions and feedbacks within the Earth system. Atmospheric Chemistry and 38 Physics, 10, 1701-1737. 39
Carslaw, K. S., R. G. Harrison, and J. Kirkby, 2002: Cosmic rays, clouds, and climate. Science, 298, 1732-40 1737. 41
Celis, J. E., J. R. Morales, C. A. Zarorc, and J. C. Inzunza, 2004: A study of the particulate matter PM10 42 composition in the atmosphere of Chillán, Chile. Chemosphere, 54, 541-550. 43
Cess, R. D., and Coauthors, 1989: Interpretation of cloud-climate feedbacks as produced by 14 atmospheric 44 general circulation models. Science, 245, 513-516. 45
Chae, J. H., and S. C. Sherwood, 2010: Insights into cloud-top height and dynamics from the seasonal cycle 46 of cloud-top heights observed by MISR in the West Pacific region. Journal of the Atmospheric 47 Sciences, 67, 248-261. 48
Chakraborty, A., and T. Gupta, 2010: Chemical characterization and source apportionment of submicron 49 (PM1) aerosol in Kanpur region, India. Aerosol and Air Quality Research, 10, 433-445. 50
Chameides, W. L., C. Luo, R. Saylor, D. Streets, Y. Huang, M. Bergin, and F. Giorgi, 2002: Correlation 51 between model-calculated anthropogenic aerosols and satellite-derived cloud optical depths: 52 Indication of indirect effect? Journal of Geophysical Research, 107. 53
Chan, Y. C., R. W. Simpson, G. H. Mctainsh, P. D. Vowles, D. D. Cohen, and G. M. Bailey, 1997: 54 Characterisation of chemical species in PM2.5 and PM10 aerosols in Brisbane, Australia. Atmospheric 55 Environment, 31, 3773-3785. 56
First Order Draft Chapter 7 IPCC WGI Fifth Assessment Report
Do Not Cite, Quote or Distribute 7-65 Total pages: 121
Chand, D., R. Wood, T. L. Anderson, S. K. Satheesh, and R. J. Charlson, 2009: Satellite-derived direct 1 radiative effect of aerosols dependent on cloud cover. Nature Geoscience, 2, 181-184. 2
Chang, F., and J. Coakley, 2007: Relationships between marine stratus cloud optical depth and temperature: 3 Inferences from AVHRR observations. Journal of Climate, 2022-2036. 4
Charlson, R. J., A. S. Ackerman, F. A. M. Bender, T. L. Anderson, and Z. Liu, 2007: On the climate forcing 5 consequences of the albedo continuum between cloudy and clear air. Tellus, 59B, 715-727. 6
Charney, J. G., 1979: Carbon dioxide and climate: A scientific assessment, 33 pp. pp. 7 Chen, L., G. Shi, S. Qin, S. Yang, and P. Zhang, 2011: Direct radiative forcing of anthropogenic aerosols 8
over oceans from satellite observations. Advances in Atmospheric Sciences, 28, 973-984. 9 Chen, W. T., Y. H. Lee, P. J. Adams, A. Nenes, and J. H. Seinfeld, 2010: Will black carbon mitigation 10
dampen aerosol indirect forcing? Geophysical Research Letters, ARTN L09801. 11 Chen, Y., and J. E. Penner, 2005: Uncertainty analysis for estimates of the first indirect aerosol effect. 12
Atmospheric Chemistry and Physics, 5, 2935-2948. 13 Chen, Y., Q. Li, R. A. Kahn, J. T. Randerson, and D. J. Diner, 2009: Quantifying aerosol direct radiative 14
effect with Multiangle Imaging Spectroradiometer observations: Top-of-atmosphere albedo change by 15 aerosols based on land surface types. Journal of Geophysical Research, 114, D02109. 16
Cheng, T., Y. Peng, J. Feichter, and I. Tegen, 2008: An improvement on the dust emission scheme in the 17 global aerosol-climate model ECHAM5-HAM. Atmospheric Chemistry and Physics, 8, 1105-1117. 18
Cheng, Z. L., K. S. Lam, L. Y. Chan, and K. K. Cheng, 2000: Chemical characteristics of aerosols at coastal 19 station in Hong Kong. I. Seasonal variation of major ions, halogens and mineral dusts between 1995 20 and 1996. Atmospheric Environment, 34, 2771-2783. 21
Chernoff, D. I., and A. K. Bertram, 2010: Effects of sulfate coatings on the ice nucleation properties of a 22 biological ice nucleus and several types of minerals. Journal of Geophysical Research, 115, D20205. 23
Chikira, M., and M. Sugiyama, 2010: A cumulus parameterization with state-dependent entrainment rate. 24 Part I: Description and sensitivity to temperature and humidity profiles. Journal of the Atmospheric 25 Sciences, 67, 2171-2193. 26
Choi, Y. S., R. S. Lindzen, C. H. Ho, and J. Kim, 2010: Space observations of cold-cloud phase change. 27 Proceedings of the National Academy of Sciences of the United States of America, 107, 11211-11216. 28
Chow, J. C., J. G. Waston, D. H. Lowenthal, P. A. Solomon, K. L. Magliano, S. D. Ziman, and L. W. 29 Richards, 1993: PM10 and PM2.5 compositions in California's San Joaquin Valley. Aerosol Science and 30 Technology, 18, 105-128. 31
Chuang, C. C., J. E. Penner, K. E. Taylor, A. S. Grossman, and J. J. Walton, 1997: An assessment of the 32 radiative effects of anthropogenic sulfate. Journal of Geophysical Research-Atmospheres, 102, 3761-33 3778. 34
Chuang, C. C., J. E. Penner, J. M. Prospero, K. E. Grant, G. H. Rau, and K. Kawamoto, 2002: Cloud 35 susceptibility and the first aerosol indirect forcing: Sensitivity to black carbon and aerosol 36 concentrations. Journal of Geophysical Research, 107, 4564. 37
Church, J. A., and Coauthors, 2011: Revisiting the Earth's sea-level and energy budgets from 1961 to 2008. 38 Geophysical Research Letters, 38, L18601. 39
Clarke, A. D., V. N. Kapustin, F. L. Eisele, R. J. Weber, and P. H. McMurry, 1999: Particle production near 40 marine clouds: Sulfuric acid and predictions from classical binary nucleation. Geophysical Research 41 Letters, 26, 2425-2428. 42
Clement, A. C., R. Burgman, and J. R. Norris, 2009: Observational and model evidence for positive low-43 level cloud feedback. Science, 325, 460-464. 44
Colman, R. A., and B. J. McAvaney, 2011: On tropospheric adjustment to forcing and climate feedbacks. 45 Climate Dynamics, 36, 1649-1658. 46
Comstock, K. K., C. S. Bretherton, and S. E. Yuter, 2005: Mesoscale variability and drizzle in Southeast 47 Pacific stratocumulus. Journal of the Atmospheric Sciences, 62, 3792-3807. 48
Connolly, P. J., O. Mohler, P. R. Field, H. Saathoff, R. Burgess, T. Choularton, and M. Gallagher, 2009: 49 Studies of heterogeneous freezing by three different desert dust samples. Atmospheric Chemistry and 50 Physics, 9, 2805-2824. 51
Cozic, J., and Coauthors, 2008: Black carbon enrichment in atmospheric ice particle residuals observed in 52 lower tropospheric mixed phase clouds. Journal of Geophysical Research, 113, D15209. 53
Crawford, I., and Coauthors, 2011: Studies of propane flame soot acting as heterogeneous ice nuclei in 54 conjunction with single particle soot photometer measurements. Atmospheric Chemistry and Physics, 55 11, 9549-9561. 56
First Order Draft Chapter 7 IPCC WGI Fifth Assessment Report
Do Not Cite, Quote or Distribute 7-66 Total pages: 121
Cross, E. S., and Coauthors, 2010: Soot Particle Studies—Instrument Inter-Comparison—Project Overview. 1 Aerosol Science and Technology, 44, 592-611. 2
Crucifix, M., 2006: Does the Last Glacial Maximum constrain climate sensitivity? Geophysical Research 3 Letters, 33, L18701. 4
Crutzen, P. J., 2006: Albedo enhancement by stratospheric sulfur injections: A contribution to resolve a 5 policy dilemma? Climatic Change, 77, 211-220. 6
Cziczo, D. J., K. D. Froyd, S. J. Gallavardin, O. Moehler, S. Benz, H. Saathoff, and D. M. Murphy, 2009a: 7 Deactivation of ice nuclei due to atmospherically relevant surface coatings. Environmental Research 8 Letters, 4. 9
Cziczo, D. J., and Coauthors, 2009b: Inadvertent climate modification due to anthropogenic lead. Nature 10 Geoscience, 2, 333-336. 11
Darmenova, K., I. N. Sokolik, Y. P. Shao, B. Marticorena, and G. Bergametti, 2009: Development of a 12 physically based dust emission module within the Weather Research and Forecasting (WRF) model: 13 Assessment of dust emission parameterizations and input parameters for source regions in Central and 14 East Asia. Journal of Geophysical Research, 114, ARTN D14201. 15
Dawson, J. P., P. J. Adams, and S. N. Pandis, 2007: Sensitivity of PM2.5 to climate in the Eastern US: a 16 modeling case study. Atmospheric Chemistry and Physics, 7, 4295-4309. 17
de Boer, G., H. Morrison, M. D. Shupe, and R. Hildner, 2011: Evidence of liquid dependent ice nucleation in 18 high-latitude stratiform clouds from surface remote sensors. Geophysical Research Letters, 38, 19 L01803. 20
de Gouw, J. A., and Coauthors, 2005: Budget of organic carbon in a polluted atmosphere: Results from the 21 New England Air Quality Study in 2002. Journal of Geophysical Research, 110, ARTN D16305. 22
de Leeuw, G., and Coauthors, 2011: Production flux of sea spray aerosol. Reviews of Geophysics, 49, 23 RG2001. 24
Deboudt, K., P. Flament, M. Choel, A. Gloter, S. Sobanska, and C. Colliex, 2010: Mixing state of aerosols 25 and direct observation of carbonaceous and marine coatings on African dust by individual particle 26 analisys. Journal of Geophysical Research, 115, D24207. 27
Decesari, S., and Coauthors, 2010: Chemical composition of PM10 and PM1 at the high-altitude Himalayan 28 station Nepal Climate Observatory-Pyramid (NCO-P) (5079 m.a.s.l.). Atmospheric Chemistry and 29 Physics, 10, 4583-4596. 30
DeMott, C. A., C. Stan, D. A. Randall, J. L. Kinter III, and M. Khairoutdinov, 2011: The Asian Monsoon in 31 the super-parameterized CCSM and its relation to tropical wave activity. Journal of Climate, 24, 32 5134–5156. 33
DeMott, P. J., 1990: An exploratory study of ice nucleation by soot aerosols. Journal of Applied 34 Meteorology, 29, 1072-1079. 35
DeMott, P. J., Y. Chen, S. M. Kreidenweis, D. C. Rogers, and D. E. Sherman, 1999: Ice formation by black 36 carbon particles. Geophysical Research Letters, 26, 2429-2432. 37
DeMott, P. J., M. D. Petters, A. J. Prenni, C. M. Carrico, S. M. Kreidenweis, J. L. Collett, and H. 38 Moosmuller, 2009: Ice nucleation behavior of biomass combustion particles at cirrus temperatures. 39 Journal of Geophysical Research, 114, D16205. 40
DeMott, P. J., and Coauthors, 2003: African dust aerosols as atmospheric ice nuclei. Geophysical Research 41 Letters, 30, 1732. 42
DeMott, P. J., and Coauthors, 2010: Predicting global atmospheric ice nuclei distributions and their impacts 43 on climate. Proceedings of the National Academy of Sciences of the United States of America, 107, 44 11217-11222. 45
Dengel, S., D. Aeby, and J. Grace, 2009: A relationship between galactic cosmic radiation and tree rings. 46 New Phytologist, 184, 545-551. 47
Denman, K. L., and Coauthors, 2007: Couplings Between Changes in the Climate System and 48 Biogeochemistry. Climate Change 2007: The Physical Science Basis. Contribution of Working Group 49 I to the Fourth Assessment Report of the Intergovernmental Panel on Climate Change, Cambridge 50 University Press. 51
Derbyshire, S. H., A. V. Maidens, S. F. Milton, R. A. Stratton, and M. R. Willett, 2011: Adaptive 52 detrainment in a convective parametrization. Q. J. Royal Met. Society, 137, 1856–1871. 53
Derevianko, G. J., C. Deutsch, and A. Hall, 2009: On the relationship between ocean DMS and solar 54 radiation. Geophysical Research Letters, 36, L17606. 55
Dessler, A. E., 2010: A determination of the cloud feedback from climate variations over the past decade. 56 Science, 330, 1523-1527. 57
First Order Draft Chapter 7 IPCC WGI Fifth Assessment Report
Do Not Cite, Quote or Distribute 7-67 Total pages: 121
——, 2011: Cloud variations and the Earth's energy budget. Geophysical Research Letters, 38, L19701. 1 Deuzé, J.-L., and Coauthors, 2001: Remote sensing of aerosols over land surfaces from POLDER-ADEOS-1 2
polarized measurements. Journal of Geophysical Research, 106, 4913-4926. 3 Devasthale, A., O. Kruger, and H. Graßl, 2005: Change in cloud-top temperatures over Europe. IEEE 4
Geoscience and Remote Sensing Letters, 2, 333-336. 5 Di Biagio, C., A. di Sarra, and D. Meloni, 2010: Large atmospheric shortwave radiative forcing by 6
Mediterranean aerosols derived from simultaneous ground-based and spaceborne observations and 7 dependence on the aerosol type and single scattering albedo. Journal of Geophysical Research, 115, 8 ARTN D10209. 9
Diehl, K., and S. K. Mitra, 1998: A laboratory study of the effects of a kerosene-burner exhaust on ice 10 nucleation and the evaporation rate of ice crystals. Atmospheric Environment, 32, 3145-3151. 11
Diehl, K., and S. Wurzler, 2010: Air parcel model simulations of a convective cloud: Bacteria acting as 12 immersion ice nuclei. Atmospheric Environment, 44, 4622-4628. 13
Diehl, K., C. Quick, S. Matthias-Maser, S. K. Mitra, and R. Jaenicke, 2001: The ice nucleating ability of 14 pollen - Part I: Laboratory studies in deposition and condensation freezing modes. Atmospheric 15 Research, 58, 75-87. 16
Doherty, S. J., S. G. Warren, T. C. Grenfell, A. D. Clarke, and R. E. Brandt, 2010: Light-absorbing 17 impurities in Arctic snow. Atmospheric Chemistry and Physics, 10, 11647-11680. 18
Donahue, N. M., S. A. Epstein, S. N. Pandis, and A. L. Robinson, 2011: A two-dimensional volatility basis 19 set: 1. Organic-aerosol mixing thermodynamics. Atmospheric Chemistry and Physics, 11, 3303-3318. 20
Donner, L. J., and Coauthors, 2011: The dynamical core, physical parameterizations, and basic simulation 21 characteristics of the atmospheric component AM3 of the GFDL global coupled model CM3. Journal 22 of Climate, 24, 3484–3519 23
Doughty, C. E., C. B. Field, and A. M. S. McMillan, 2011: Can crop albedo be increased through the 24 modification of leaf trichomes, and could this cool regional climate? Climatic Change, 104, 379-387. 25
Dubovik, O., and Coauthors, 2011: Statistically optimized inversion algorithm for enhanced retrieval of 26 aerosol properties from spectral multi-angle polarimetric satellite observations. Atmospheric 27 Measurement Techniques, 4, 975-1018. 28
Dubovik, O., and Coauthors, 2006: Application of spheroid models to account for aerosol particle 29 nonsphericity in remote sensing of desert dust. Journal of Geophysical Research, 111, D11208. 30
Duda, D. P., G. L. Stephens, B. Stevens, and W. R. Cotton, 1996: Effects of aerosol and horizontal 31 inhomogeneity on the broadband albedo of marine stratus: Numerical simulations. Journal of the 32 Atmospheric Sciences, 53, 3757-3769. 33
Dufresne, J.-L., J. Quaas, O. Boucher, S. Denvil, and L. Fairhead, 2005: Contrasts in the effects on climate 34 of anthropogenic sulfate aerosols between the 20th and the 21st century. Geophysical Research 35 Letters, 32, ARTN L21703. 36
Dufresne, J. L., and S. Bony, 2008: An assessment of the primary sources of spread of global warming 37 estimates from coupled atmosphere-ocean models. Journal of Climate, 21, 5135-5144. 38
Dunion, J. P., and C. S. Velden, 2004: The impact of the Saharan air layer on Atlantic tropical cyclone 39 activity. Bulletin of the American Meteorological Society, 85, 353-365. 40
Duplissy, J., and Coauthors, 2008: Cloud forming potential of secondary organic aerosol under near 41 atmospheric conditions. Geophysical Research Letters, 35, L03818. 42
Durkee, P. A., K. J. Noone, and R. T. Bluth, 2000: The Monterey Area Ship Track experiment. Journal of 43 the Atmospheric Sciences, 57, 2523-2541. 44
Dusek, U., and Coauthors, 2006: Size matters more than chemistry for cloud-nucleating ability of aerosol 45 particles. Science, 312, 1375-1378. 46
Dymarska, M., B. J. Murray, L. M. Sun, M. L. Eastwood, D. A. Knopf, and A. K. Bertram, 2006: Deposition 47 ice nucleation on soot at temperatures relevant for the lower troposphere. Journal of Geophysical 48 Research, 111, D04204. 49
Easter, R. C., and Coauthors, 2004: MIRAGE: Model description and evaluation of aerosols and trace gases. 50 Journal of Geophysical Research, 109, ARTN D20210. 51
Eastman, R., and S. G. Warren, 2010: Interannual variations of Arctic cloud types in relation to sea ice. 52 Journal of Climate, 23, 4216-4232. 53
Eastwood, M. L., S. Cremel, M. Wheeler, B. J. Murray, E. Girard, and A. K. Bertram, 2009: Effects of 54 sulfuric acid and ammonium sulfate coatings on the ice nucleation properties of kaolinite particles. 55 Geophysical Research Letters, 36, L02811. 56
First Order Draft Chapter 7 IPCC WGI Fifth Assessment Report
Do Not Cite, Quote or Distribute 7-68 Total pages: 121
Eitzen, Z. A., K. M. Xu, and T. Wong, 2009: Cloud and radiative characteristics of tropical deep convective 1 systems in extended cloud objects from CERES observations. Journal of Climate, 22, 5983-6000. 2
Eitzen, Z. A., K.-M. Xu, and T. Wong, 2011: An estimate of low-cloud feedbacks from variations of cloud 3 radiative and physical properties with sea surface temperature on interannual time scales. Journal of 4 Climate, 24, 1106-1121. 5
Enghoff, M. B., and H. Svensmark, 2008: The role of atmospheric ions in aerosol nucleation - a review. 6 Atmospheric Chemistry and Physics, 8, 4911-4923. 7
Engström, A., and A. M. L. Ekman, 2010: Impact of meteorological factors on the correlation between 8 aerosol optical depth and cloud fraction. Geophys. Res. Lett., 37, L18814. 9
Ervens, B., G. Feingold, and S. M. Kreidenweis, 2005: Influence of water-soluble organic carbon on cloud 10 drop number concentration. Journal of Geophysical Research, 110, D18211. 11
Ervens, B., G. Feingold, K. Sulia, and J. Harrington, 2011: The impact of microphysical parameters, ice 12 nucleation mode, and habit growth on the ice/liquid partitioning in mixed-phase Arctic clouds. Journal 13 of Geophysical Research, 116, D17205. 14
Evan, A. T., J. Dunion, J. A. Foley, A. K. Heidinger, and C. S. Velden, 2006: New evidence for a 15 relationship between Atlantic tropical cyclone activity and African dust outbreaks. Geophysical 16 Research Letters, 33, L19813. 17
Evan, A. T., and Coauthors, 2008: Ocean temperature forcing by aerosols across the Atlantic tropical 18 cyclone development region. Geochemistry Geophysics Geosystems, 9, Q05v04. 19
Evans, J. R. G., E. P. J. Stride, M. J. Edirisinghe, D. J. Andrews, and R. R. Simons, 2010: Can oceanic foams 20 limit global warming? Climate Research, 42, 155-160. 21
Fan, J., R. Zhang, G. Li, J. Nielsen-Gammon, and Z. Li, 2005: Simulations of fine particulate matter (PM2.5) 22 in Houston, Texas. Journal of Geophysical Research, 110, D16203. 23
Fan, J., and Coauthors, 2009: Dominant role by vertical wind shear in regulating aerosol effects on deep 24 convective clouds. Journal of Geophysical Research-Atmospheres, 114. 25
Farina, S. C., P. J. Adams, and S. N. Pandis, 2010: Modeling global secondary organic aerosol formation and 26 processing with the volatility basis set: Implications for anthropogenic secondary organic aerosol. 27 Journal of Geophysical Research, 115, ARTN D09202. 28
Farrar, P. D., 2000: Are cosmic rays influencing oceanic cloud coverage – or is it only El Niño? Climatic 29 Change, 47, 7-15. 30
Favez, O., H. Cachier, J. Sciarea, S. C. Alfaro, T. M. El-Araby, M. A. Harhash, and Magdy M. Abdelwahab, 31 2008: Seasonality of major aerosol species and their transformations in Cairo megacity. Atmospheric 32 Environment, 42, 1503–1516. 33
Feichter, J., U. Lohmann, and I. Schult, 1997: The atmospheric sulfur cycle in ECHAM-4 and its impact on 34 the shortwave radiation. Climate Dynamics, 13, 235-246. 35
Feingold, G., and H. Siebert, 2009: Cloud-aerosol interactions from the micro to the cloud scale. Clouds in 36 the Perturbed Climate System: Their Relationship to Energy Balance, Atmospheric Dynamics, and 37 Precipitation, J. Heintzenberg, and R. J. Charlson, Eds., MIT Press, 319-338. 38
Feingold, G., H. L. Jiang, and J. Y. Harrington, 2005: On smoke suppression of clouds in Amazonia. 39 Geophysical Research Letters, 32, ARTN L02804. 40
Feingold, G., R. Boers, B. Stevens, and W. R. Cotton, 1997: A modeling study of the effect of drizzle on 41 cloud optical depth and susceptibility. Journal of Geophysical Research, 102, 13527-13534. 42
Feldpausch, P., M. Fiebig, L. Fritzsche, and A. Petzold, 2006: Measurement of ultrafine aerosol size 43 distributions by a combination of diffusion screen separators and condensation particle counters. 44 Journal of Aerosol Science, 37, 577-597. 45
Feng, J., 2008: A size-resolved model and a four-mode parameterization of dry deposition of atmospheric 46 aerosols. Journal of Geophysical Research, 113, D12201. 47
Field, P. R., and Coauthors, 2006: Some ice nucleation characteristics of Asian and Saharan desert dust. 48 Atmospheric Chemistry and Physics, 6, 2991-3006. 49
Flanner, M. G., C. S. Zender, J. T. Randerson, and P. J. Rasch, 2007: Present-day climate forcing and 50 response from black carbon in snow. Journal of Geophysical Research, 112, D11202. 51
Flanner, M. G., C. S. Zender, P. G. Hess, N. M. Mahowald, T. H. Painter, V. Ramanathan, and P. J. Rasch, 52 2009: Springtime warming and reduced snow cover from carbonaceous particles. Atmospheric 53 Chemistry and Physics, 9, 2481-2497. 54
Fletcher, N. H., 1962: Surface structure of water and ice. Philosophical Magazine, 7, 255-269. 55 Flowers, B. A., M. K. Dubey, C. Mazzoleni, E. A. Stone, J. J. Schauer, S. W. Kim, and S. C. Yoon, 2010: 56
Optical-chemical-microphysical relationships and closure studies for mixed carbonaceous aerosols 57
First Order Draft Chapter 7 IPCC WGI Fifth Assessment Report
Do Not Cite, Quote or Distribute 7-69 Total pages: 121
observed at Jeju Island; 3-laser photoacoustic spectrometer, particle sizing, and filter analysis. 1 Atmospheric Chemistry and Physics, 10, 10387-10398. 2
Foltz, G. R., and M. J. McPhaden, 2008: Impact of Saharan dust on tropical North Atlantic SST. Journal of 3 Climate, 21, 5048-5060. 4
Forest, C. E., P. H. Stone, and A. P. Sokolov, 2006: Estimated PDFs of climate system properties including 5 natural and anthropogenic forcings. Geophysical Research Letters, 33, L01705. 6
Forest, C. E., P. H. Stone, A. P. Sokolov, M. R. Allen, and M. D. Webster, 2002: Quantifying uncertainties 7 in climate system properties with the use of recent climate observations. Science, 295, 113-117. 8
Fornea, A. P., S. D. Brooks, J. B. Dooley, and A. Saha, 2009: Heterogeneous freezing of ice on atmospheric 9 aerosols containing ash, soot, and soil. Journal of Geophysical Research-Atmospheres, 114. 10
Forster, P., and Coauthors, 2007: Changes in Atmospheric Constituents and in Radiative Forcing. Climate 11 Change 2007: The Physical Science Basis. Contribution of Working Group I to the Fourth Assessment 12 Report of the Intergovernmental Panel on Climate Change, Cambridge University Press. 13
Forster, P. M. D., and J. M. Gregory, 2006: The climate sensitivity and its components diagnosed from Earth 14 Radiation Budget data. Journal of Climate, 19, 39-52. 15
Fountoukis, C., and Coauthors, 2007: Aerosol-cloud drop concentration closure for clouds sampled during 16 the International Consortium for Atmospheric Research on Transport and Transformation 2004 17 campaign. Journal of Geophysical Research, 112, D10S30. 18
Fowler, L. D., and D. A. Randall, 2002: Interactions between cloud microphysics and cumulus convection in 19 a general circulation model. Journal of the Atmospheric Sciences, 59, 3074-3098. 20
Freney, E. J., K. Adachi, and P. R. Buseck, 2010: Internally mixed atmospheric aerosol particles: 21 Hygroscopic growth and light scattering. Journal of Geophysical Research, 115, ARTN D19210. 22
Fridlind, A. M., and Coauthors, 2007: Ice properties of single-layer stratocumulus during the Mixed-Phase 23 Arctic Cloud Experiment: 2. Model results. Journal of Geophysical Research, 112, D24202. 24
Friedman, B., G. Kulkarni, J. Beranek, A. Zelenyuk, J. A. Thornton, and D. J. Cziczo, 2011: Ice nucleation 25 and droplet formation by bare and coated soot particles. Journal of Geophysical Research-26 Atmospheres, 116, D17203. 27
Frömming, C., M. Ponater, U. Burkhardt, A. Stenke, S. Pechtl, and R. Sausen, 2011: Sensitivity of contrail 28 coverage and contrail radiative forcing to selected key parameters. Atmospheric Environment, 45, 29 1483-1490. 30
Fuentes, E., H. Coe, D. Green, and G. McFiggans, 2011: On the impacts of phytoplankton-derived organic 31 matter on the properties of the primary marine aerosol - Part 2: Composition, hygroscopicity and cloud 32 condensation activity. Atmospheric Chemistry and Physics, 11, 2585-2602. 33
Fuzzi, S., and Coauthors, 2007: Overview of the inorganic and organic composition of size-segregated 34 aerosol in Rondonia, Brazil, from the biomass-burning period to the onset of the wet season. Journal 35 of Geophysical Research, 112, D01201. 36
Gagen, M., and Coauthors, 2011: Cloud response to summer temperatures in Fennoscandia over the last 37 thousand years. Geophysical Research Letters, 38, 5. 38
Gao, R. S., and Coauthors, 2007: A novel method for estimating light-scattering properties of soot aerosols 39 using a modified single-particle soot photometer. Aerosol Science and Technology, 41, 125-135. 40
Garcia, O. E., F. J. Exposito, J. P. Diaz, and A. M. Diaz, 2011: Radiative forcing under mixed aerosol 41 conditions. Journal of Geophysical Research, 116, ARTN D01201. 42
Gasso, S., 2008: Satellite observations of the impact of weak volcanic activity on marine clouds. Journal of 43 Geophysical Research, 113, D14s19. 44
Geogdzhayev, I. V., M. I. Mishchenko, W. B. Rossow, B. Cairns, and A. A. Lacis, 2002: Global two-channel 45 AVHRR retrievals of aerosol properties over the ocean for the period of NOAA-9 observations and 46 preliminary retrievals using NOAA-7 and NOAA-11 data. Journal of the Atmospheric Sciences, 59, 47 262-278. 48
George, R. C., and R. Wood, 2010: Subseasonal variability of low cloud radiative properties over the 49 southeast Pacific Ocean. Atmospheric Chemistry and Physics, 10, 4047-4063. 50
Gerasopoulos, E., and Coauthors, 2007: Size-segregated mass distributions of aerosols over Eastern 51 Mediterranean: seasonal variability and comparison with AERONET columnar size-distributions. 52 Atmospheric Chemistry and Physics, 7, 2551-2561. 53
Gettelman, A., J. T. Fasullo, and J. E. Kay, 2011a: Constraining simulated climate sensitivity with cloud 54 microphysics submitted. 55
Gettelman, A., J. E. Kay, and K. M. Shell, 2011b: The evolution of climate sensitivity and climate feedbacks 56 in the Community Atmosphere Model. Journal of Climate, Submitted. 57
First Order Draft Chapter 7 IPCC WGI Fifth Assessment Report
Do Not Cite, Quote or Distribute 7-70 Total pages: 121
Gettelman, A., and Coauthors, 2010: Global simulations of ice nucleation and ice supersaturation with an 1 improved cloud scheme in the Community Atmosphere Model. Journal of Geophysical Research, 115, 2 ARTN D18216. 3
Ghan, S., R. Easter, J. Hudson, and F. M. Bréon, 2001: Evaluation of aerosol indirect radiative forcing in 4 MIRAGE. Journal of Geophysical Research, 106, 5317-5334. 5
Ghan, S. J., X. Liu, R. C. Easter, R. Zaveri, P. J. Rasch, and J.-H. Yoon, 2011a: Toward a minimal 6 representation of aerosol direct, semi-direct and indirect effects: Comparative decomposition. Journal 7 of Climate, subm. to. 8
Ghan, S. J., H. Abdul-Razzak, A. Nenes, Y. Ming, X. Liu, and M. Ovchinnikov, 2011b: Droplet nucleation: 9 Physically-based parameterizations and comparative evaluation. Journal of Advances in Modeling 10 Earth Systems, 3, M10001. 11
Gioda, A., B. S. Amaral, I. L. GoncalvesMonteiro, and T. D. Saint'Pierre, 2011: Chemical composition, 12 sources, solubility, and transport of aerosol trace elements in a tropical region. Journal of 13 Environmental Monitoring, 13, 2134-2142. 14
Girard, E., J.-P. Blanchet, and Y. Dubois, 2004: Effects of arctic sulphuric acid aerosols on wintertime low-15 level atmospheric ice crystals, humidity and temperature at Alert, Nunavut. Atmospheric Research, 73, 16 131-148. 17
Givati, A., and D. Rosenfeld, 2004: Quantifying precipitation suppression due to air pollution. Journal of 18 Applied Meteorology, 43, 1038-1056. 19
Good, N., and Coauthors, 2010: Consistency between parameterisations of aerosol hygroscopicity and CCN 20 activity during the RHaMBLe discovery cruise. Atmospheric Chemistry and Physics, 10, 3189-3203. 21
Gorbunov, B., A. Baklanov, N. Kakutkina, H. L. Windsor, and R. Toumi, 2001: Ice nucleation on soot 22 particles. Journal of Aerosol Science, 32, 199-215. 23
Gordon, N. D., and J. R. Norris, 2010: Cluster analysis of midlatitude oceanic cloud regimes: mean 24 properties and temperature sensitivity. Atmospheric Chemistry and Physics, 10, 6435-6459. 25
Graber, E. R., and Y. Rudich, 2006: Atmospheric HULIS: How humic-like are they? A comprehensive and 26 critical review. Atmospheric Chemistry and Physics, 6, 729-753. 27
Grabowski, W. W., 2001: Coupling cloud processes with the large-scale dynamics using the Cloud-28 Resolving Convection Parameterization (CRCP). Journal of the Atmospheric Sciences, 58, 978-997. 29
Grabowski, W. W., and P. K. Smolarkiewicz, 1999: CRCP: a Cloud Resolving Convection Parameterization 30 for modeling the tropical convecting atmosphere. Physica D, 133, 171-178. 31
Granier, C., and Coauthors, 2011: Evolution of anthropogenic and biomass burning emissions of air 32 pollutants at global and regional scales during the 1980-2010 period. Climatic Change, 109, 163-190. 33
Gregory, J., and M. Webb, 2008: Tropospheric adjustment induces a cloud component in CO2 forcing. 34 Journal of Climate, 58-71. 35
Gregory, J. M., R. J. Stouffer, S. C. B. Raper, P. A. Stott, and N. A. Rayner, 2002: An observationally based 36 estimate of the climate sensitivity. Journal of Climate, 15, 3117-3121. 37
Grote, R., and U. Niinemets, 2008: Modeling volatile isoprenoid emissions - a story with split ends. Plant 38 Biology, 10, 8-28. 39
Guenther, A., T. Karl, P. Harley, C. Wiedinmyer, P. I. Palmer, and C. Geron, 2006: Estimates of global 40 terrestrial isoprene emissions using MEGAN (Model of Emissions of Gases and Aerosols from 41 Nature). Atmospheric Chemistry and Physics, 6, 3181-3210. 42
Gullu, H. G., I. Ölmez, and G. Tuncel, 2000: Temporal variability of atmospheric trace element 43 concentrations over the eastern Mediterranean Sea. Spectrochimica Acta, B55, 1135-1150. 44
Haerter, J. O., E. Roeckner, L. Tomassini, and J. S. von Storch, 2009: Parametric uncertainty effects on 45 aerosol radiative forcing. Geophysical Research Letters, 36, L15707. 46
Hagler, G. S. W., and Coauthors, 2006: Source areas and chemical composition of fine particulate matter in 47 the Pearl River Delta region of China. Atmospheric Environment, 40, 3802-3815. 48
Halfon, N., Z. Levin, and P. Alpert, 2009: Temporal rainfall fluctuations in Israel and their possible link to 49 urban and air pollution effects. Environmental Research Letters, 4, 025001. 50
Hallquist, M., and Coauthors, 2009: The formation, properties and impact of secondary organic aerosol: 51 current and emerging issues. Atmospheric Chemistry and Physics, 9, 5155-5236. 52
Hamwey, R. M., 2007: Active amplification of the terrestrial albedo to mitigate climate change: An 53 exploratory study. Mitigation and Adaptation Strategies for Global Change, 12, 419-439. 54
Han, Y.-J., T.-S. Kim, and H. Kim, 2008: Ionic constituents and source analysis of PM2.5 in three Korean 55 cities. Atmospheric Environment, 42, 4735–4746. 56
First Order Draft Chapter 7 IPCC WGI Fifth Assessment Report
Do Not Cite, Quote or Distribute 7-71 Total pages: 121
Hand, V. L., G. Capes, D. J. Vaughan, P. Formenti, J. M. Haywood, and H. Coe, 2010: Evidence of internal 1 mixing of African dust and biomass burning particles by individual particle analysis using electron 2 beam techniques. Journal of Geophysical Research-Atmospheres, 115, D13301. 3
Hansen, J., and L. Nazarenko, 2004: Soot climate forcing via snow and ice albedos. Proceedings of the 4 National Academy of Sciences of the United States of America, 101, 423-428. 5
Hansen, J., M. Sato, P. Kharecha, and K. von Schuckmann, 2011: Earth's energy imbalance and implications. 6 Atmospheric Chemistry and Physics Discussion, 11, 27031-27105. 7
Hansen, J., and Coauthors, 2005: Efficacy of climate forcings. Journal of Geophysical Research, 110, ARTN 8 D18104. 9
Harrington, J. Y., D. Lamb, and R. Carver, 2009: Parameterization of surface kinetic effects for bulk 10 microphysical models: Influences on simulated cirrus dynamics and structure. Journal of Geophysical 11 Research, 114, D06212. 12
Harrison, R. G., 2008: Discrimination between cosmic ray and solar irradiance effects on clouds, and 13 evidence for geophysical modulation of cloud thickness. Proceedings of the Royal Society A, 464, 14 2575-2590. 15
Harrison, R. G., and D. B. Stephenson, 2006: Empirical evidence for a nonlinear effect of galactic cosmic 16 rays on clouds. Proceedings of the Royal Society A, 462, 1221-1233. 17
Harrison, R. G., and M. H. P. Ambaum, 2010: Observing Forbush decreases in cloud at Shetland. Journal of 18 Atmospheric and Solar-Terrestrial Physics, 72, 1408-1414. 19
Hartmann, D. L., and K. Larson, 2002: An important constraint on tropical cloud - climate feedback. 20 Geophysical Research Letters, 29, 1951. 21
Harvey, L. D. D., and R. K. Kaufmann, 2002: Simultaneously constraining climate sensitivity and aerosol 22 radiative forcing. Journal of Climate, 15, 2837-2861. 23
Haywood, J., and O. Boucher, 2000: Estimates of the direct and indirect radiative forcing due to tropospheric 24 aerosols: A review. Reviews of Geophysics, 38, 513-543. 25
Haywood, J., and M. Schulz, 2007: Causes of the reduction in uncertainty in the anthropogenic radiative 26 forcing of climate between IPCC (2001) and IPCC (2007). Geophysical Research Letters, 34, ARTN 27 L20701. 28
Haywood, J. M., and Coauthors, 2009: A case study of the radiative forcing of persistent contrails evolving 29 into contrail-induced cirrus. Journal of Geophysical Research, 114, D24201. 30
Haywood, J. M., and Coauthors, 2011: Motivation, rationale and key results from the GERBILS Saharan 31 dust measurement campaign. Quarterly Journal of the Royal Meteorological Society, 137, 1106-1116. 32
Heald, C. L., D. A. Ridley, S. M. Kreidenweis, and E. E. Drury, 2010: Satellite observations cap the 33 atmospheric organic aerosol budget. Geophysical Research Letters, 37, L24808. 34
Heald, C. L., and Coauthors, 2005: A large organic aerosol source in the free troposphere missing from 35 current models. Geophysical Research Letters, ARTN L18809. 36
Heald, C. L., and Coauthors, 2008: Predicted change in global secondary organic aerosol concentrations in 37 response to future climate, emissions, and land use change. Journal of Geophysical Research, 113, 38 ARTN D05211. 39
Heckendorn, P., and Coauthors, 2009: The impact of geoengineering aerosols on stratospheric temperature 40 and ozone. Environmental Research Letters, 4, ARTN 045108. 41
Hegerl, G. C., T. J. Crowley, M. Allen, W. T. Hyde, H. N. Pollack, J. Smerdon, and E. Zorita, 2007: 42 Detection of human influence on a new, validated 1500-year temperature reconstruction. Journal of 43 Climate, 20, 650-666. 44
Hegg, D. A., L. F. Radke, and P. V. Hobbs, 1990: Particle production associated with marine clouds. Journal 45 of Geophysical Research, 95, 13917-13926. 46
Hegg, D. A., S. G. Warren, T. C. Grenfell, S. J. Doherty, and A. D. Clarke, 2010: Sources of light-absorbing 47 aerosol in Arctic snow and their seasonal variation. Atmospheric Chemistry and Physics, 10, 10923-48 10938. 49
Heintzenberg, J., D. C. Covert, and R. Van Dingenen, 2000: Size distribution and chemical composition of 50 marine aerosols: a compilation and review. Tellus, 52, 1104-1122. 51
Held, I. M., and B. J. Soden, 2006: Robust responses of the hydrological cycle to global warming. Journal of 52 Climate, 19, 5686-5699. 53
Hendricks Franssen, H. J., T. Kuster, P. Barmet, and U. Lohmann, 2009: Comment on “Winter ‘weekend 54 effect’ in southern Europe and its connection with periodicities in atmospheric dynamics” by A. 55 Sanchez-Lorenzo et al., Geophys. Res. Lett., 36, L13706. 56
First Order Draft Chapter 7 IPCC WGI Fifth Assessment Report
Do Not Cite, Quote or Distribute 7-72 Total pages: 121
Hendricks, J., B. Karcher, U. Lohmann, and M. Ponater, 2005: Do aircraft black carbon emissions affect 1 cirrus clouds on the global scale? Geophysical Research Letters, 32, L12814. 2
Heymsfield, A., D. Baumgardner, P. DeMott, P. Forster, K. Gierens, and B. Karcher, 2010: Contrail 3 microphysics. Bulletin of the American Meteorological Society, 465-+. 4
Heymsfield, A. J., and L. M. Miloshevich, 1995: Relative humidity and temperature influences on cirrus 5 formation and evolution: Observations from wave clouds and FIRE II. Journal of the Atmospheric 6 Sciences, 52, 4302-4326. 7
Heymsfield, A. J., and Coauthors, 1998: Cloud properties leading to highly reflective tropical cirrus: 8 Interpretations from CEPEX, TOGA COARE, and Kwajalein, Marshall Islands. Journal of 9 Geophysical Research-Atmospheres, 103, 8805-8812. 10
Hill, A. A., and S. Dobbie, 2008: The impact of aerosols on non-precipitating marine stratocumulus. II: The 11 semi-direct effect. Quarterly Journal of the Royal Meteorological Society, 134, 1155-1165. 12
Hirsikko, A., and Coauthors, 2011: Atmospheric ions and nucleation: a review of observations. Atmospheric 13 Chemistry and Physics, 11, 767-798. 14
Hjellbrekke, A. G., 2001: Data report 1999, Acidifying and eutrophying compounds, Part 1, Annual 15 summaries, 95 pp. pp. 16
Holben, B. N., and Coauthors, 1998: AERONET - A federated instrument network and data archive for 17 aerosol characterization. Remote Sensing of Environment, 66, 1-16. 18
Holben, B. N., and Coauthors, 2001: An emerging ground-based aerosol climatology: Aerosol optical depth 19 from AERONET. Journal of Geophysical Research, 106, 12067-12097. 20
Holloway, C. E., and J. D. Neelin, 2009: Moisture Vertical Structure, Column Water Vapor, and Tropical 21 Deep Convection. Journal of the Atmospheric Sciences, 66, 1665-1683. 22
Hoose, C., J. E. Kristjansson, and S. M. Burrows, 2010a: How important is biological ice nucleation in 23 clouds on a global scale? Environmental Research Letters, 5, 024009. 24
Hoose, C., U. Lohmann, R. Erdin, and I. Tegen, 2008: The global influence of dust mineralogical 25 composition on heterogeneous ice nucleation in mixed-phase clouds. Environmental Research Letters, 26 3, 025003. 27
Hoose, C., J. E. Kristjansson, J. P. Chen, and A. Hazra, 2010b: A classical-theory-based parameterization of 28 heterogeneous ice nucleation by mineral dust, soot, and biological particles in a global climate model. 29 Journal of the Atmospheric Sciences, 67, 2483-2503. 30
Hoose, C., J. E. Kristjansson, T. Iversen, A. Kirkevag, O. Seland, and A. Gettelman, 2009: Constraining 31 cloud droplet number concentration in GCMs suppresses the aerosol indirect effect. Geophysical 32 Research Letters, 36, L12807. 33
Houze, R. A., Jr., 1993: Climate Dynamics. Academic Press. 34 Hsieh, W. C., A. Nenes, R. C. Flagan, J. H. Seinfeld, G. Buzorius, and H. Jonsson, 2009: Parameterization of 35
cloud droplet size distributions: Comparison with parcel models and observations. J. Geophys. Res., 36 114, D11205. 37
Hu, M., L. Y. He, Y. H. Zhang, M. Wang, Y. Pyo Kim, and K. C. Moon, 2002: Seasonal variation of ionic 38 species in fine particles at Qingdao. Atmospheric Environment, 36, 5853-5859. 39
Huber, M., and R. Knutti, 2011: Probabilistic climate projections with an intermediate complexity model. 40 Part II: Application to observational datasets. Climate Dynamics, subm. to. 41
Huebert, B. J., and Coauthors, 2010: Linearity of DMS transfer coefficient with both friction velocity and 42 wind speed in the moderate wind speed range. Geophysical Research Letters, ARTN L01605. 43
Hueglin, C., R. Gehrig, U. Baltensperger, M. Gysel, C. Monn, and H. Vonmont, 2005: Chemical 44 characterisation of PM2.5, PM10 and coarse particles at urban, near-city and rural sites in Switzerland. 45 Atmospheric Environment, 39, 637-651. 46
Huffman, G. J., and Coauthors, 2007: The TRMM multisatellite precipitation analysis (TMPA): Quasi-47 global, multiyear, combined-sensor precipitation estimates at fine scales. Journal of 48 Hydrometeorology, 8, 38-55. 49
Huneeus, N., F. Chevallier, and O. Boucher, 2011a: Estimating aerosol emissions by assimilating observed 50 aerosol optical depth in a global aerosol model. Journal of Geophysical Research, submitted. 51
Huneeus, N., and Coauthors, 2011b: Global dust model intercomparison in AeroCom phase I, 11, 7781-52 7816. 53
Iannone, R., D. I. Chernoff, A. Pringle, S. T. Martin, and A. K. Bertram, 2011: The ice nucleation ability of 54 one of the most abundant types of fungal spores found in the atmosphere. Atmospheric Chemistry and 55 Physics, 11, 1191-1201. 56
First Order Draft Chapter 7 IPCC WGI Fifth Assessment Report
Do Not Cite, Quote or Distribute 7-73 Total pages: 121
Iga, S., H. Tomita, Y. Tsushima, and M. Satoh, 2010: Sensitivity of Hadley Circulation to physical 1 parameters and resolution through changing upper-tropospheric ice clouds using a global cloud-system 2 resolving model. Journal of Climate, 24, 2666-2679. 3
Inoue, T., M. Satoh, Y. Hagihara, H. Miura, and J. Schmetz, 2010: Comparison of high-level clouds 4 represented in a global cloud system-resolving model with CALIPSO/CloudSat and geostationary 5 satellite observations. Journal of Geophysical Research, 115, D00H22. 6
IPCC, 2001: Climate Change 2001: The Scientific Basis. Contribution of Working Group I to the Third 7 Assessment Report of the Intergovernmental Panel on Climate Change. Cambridge University Press, 8 881 pp. 9
——, 2007: Climate Change 2007: The Physical Science Basis. Contribution of Working Group I to the 10 Fourth Assessment Report of the Intergovernmental Panel on Climate Change (IPCC). Cambridge 11 University Press, 996 pp. 12
Irvine, P. J., A. Ridgwell, and D. J. Lunt, 2010: Assessing the regional disparities in geoengineering impacts. 13 Geophysical Research Letters, 37, L18702. 14
Irvine, P. J., A. Ridgwell, and D. J. Lunt, 2011: Climatic effects of surface albedo geoengineering. Journal of 15 Geophysical Research, in press. 16
Irwin, M., N. Good, J. Crosier, T. W. Choularton, and G. McFiggans, 2010: Reconciliation of measurements 17 of hygroscopic growth and critical supersaturation of aerosol particles in central Germany. 18 Atmospheric Chemistry and Physics, 10, 11737-11752. 19
Ito, K., N. Xue, and G. Thurston, 2004: Spatial variation of PM2.5 chemical species and source-apportioned 20 mass concentrations in New York City. Atmospheric Environment, 38, 5269-5282. 21
Jacob, D. J., and Coauthors, 2003: Transport and Chemical Evolution over the Pacific (TRACE-P) aircraft 22 mission: Design, execution, and first results. Journal of Geophysical Research, 108, 1-19. 23
Jacob, D. J., and Coauthors, 2010: The Arctic Research of the Composition of the Troposphere from Aircraft 24 and Satellites (ARCTAS) mission: design, execution, and first results. Atmospheric Chemistry and 25 Physics, 10, 5191-5212. 26
Jacobson, M. Z., 2001: Strong radiative heating due to the mixing state of black carbon in atmospheric 27 aerosols. Nature, 409, 695-697. 28
——, 2004: Climate response of fossil fuel and biofuel soot, accounting for soot’s feedback to snow and sea 29 ice albedo and emissivity. Journal of Geophysical Research, 109, D21201. 30
——, 2006: Effects of externally-through-internally-mixed soot inclusions within clouds and precipitation on 31 global climate. Journal of Physical Chemistry A, 110, 6860-6873. 32
Jaegle, L., P. K. Quinn, T. S. Bates, B. Alexander, and J. T. Lin, 2011: Global distribution of sea salt 33 aerosols: new constraints from in situ and remote sensing observations. Atmospheric Chemistry and 34 Physics, 11, 3137-3157. 35
Jakob, C., and C. Schumacher, 2008: Precipitation and latent heating characteristics of the major tropical 36 western Pacific cloud regimes. Journal of Climate, 21, 4348-4364. 37
Jakob, C., G. Tselioudis, and T. Hume, 2005: The radiative, cloud, and thermodynamic properties of the 38 major tropical western Pacific cloud regimes. Journal of Climate, 18, 1203-1215. 39
Jenkins, G. S., A. S. Pratt, and A. Heymsfield, 2008: Possible linkages between Saharan dust and tropical 40 cyclone rain band invigoration in the eastern Atlantic during NAMMA-06. Geophysical Research 41 Letters, 35, 7. 42
Jeong, M. J., and Z. Q. Li, 2005: Quality, compatibility, and synergy analyses of global aerosol products 43 derived from the Advanced Very High Resolution Radiometer and Total Ozone Mapping 44 Spectrometer. Journal of Geophysical Research, 110, ARTN D10S08. 45
Jethva, H., S. K. Satheesh, J. Srinivasan, and K. K. Moorthy, 2009: How good is the assumption about 46 visible surface reflectance in MODIS aerosol retrieval over land? A comparison with aircraft 47 measurements over an urban site in India. IEEE Transactions on Geoscience and Remote Sensing, 47, 48 1990-1998. 49
Jiang, H. L., H. W. Xue, A. Teller, G. Feingold, and Z. Levin, 2006: Aerosol effects on the lifetime of 50 shallow cumulus. Geophysical Research Letters, 33, L14806. 51
Jiang, J. H., H. Su, M. Schoeberl, S. T. Massie, P. Colarco, S. Platnick, and N. J. Livesey, 2008: Clean and 52 polluted clouds: relationships among pollution, ice cloud and precipitation in South America. 53 Geophys. Res. Lett., 35, L14804. 54
Jickells, T. D., and Coauthors, 2005: Global iron connections between desert dust, ocean biogeochemistry, 55 and climate. Science, 308, 67-71. 56
First Order Draft Chapter 7 IPCC WGI Fifth Assessment Report
Do Not Cite, Quote or Distribute 7-74 Total pages: 121
Jimenez, J. L., and Coauthors, 2009: Evolution of organic aerosols in the atmosphere. Science, 326, 1525-1 1529. 2
Jirak, I. L., and W. R. Cotton, 2006: Effect of air pollution on precipitation along the front range of the 3 Rocky Mountains. Journal of Applied Meteorology and Climatology, 45, 236-245. 4
Johns, T. C., and Coauthors, 2006: The new Hadley Centre Climate Model (HadGEM1): Evaluation of 5 coupled simulations. Journal of Climate, 19, 1327-1353. 6
Johnson, B. T., 2005: The semidirect aerosol effect: Comparison of a single-column model with large eddy 7 simulation for marine stratocumulus. Journal of Climate, 18, 119-130. 8
Johnson, B. T., K. P. Shine, and P. M. Forster, 2004: The semi-direct aerosol effect: Impact of absorbing 9 aerosols on marine stratocumulus. Quarterly Journal of the Royal Meteorological Society, 130, 1407-10 1422. 11
Johnson, N. C., and S. P. Xie, 2010: Changes in the sea surface temperature threshold for tropical 12 convection. Nature Geoscience, 3, 842-845. 13
Jones, A., D. L. Roberts, and A. Slingo, 1994: A climate model study of indirect radiative forcing by 14 anthropogenic sulfate aerosols. Nature, 370, 450-453. 15
Jones, A., J. M. Haywood, and O. Boucher, 2007: Aerosol forcing, climate response and climate sensitivity 16 in the Hadley Centre climate model. Journal of Geophysical Research, 112, ARTN D20211. 17
Jones, A., J. Haywood, and O. Boucher, 2009: Climate impacts of geoengineering marine stratocumulus 18 clouds. Journal of Geophysical Research, 114, ARTN D10106. 19
Jones, A., D. L. Roberts, M. J. Woodage, and C. E. Johnson, 2001: Indirect sulphate aerosol forcing in a 20 climate model with an interactive sulphur cycle. Journal of Geophysical Research, 106, 20293-20310. 21
Jones, A., J. Haywood, O. Boucher, B. Kravitz, and A. Robock, 2010a: Geoengineering by stratospheric SO2 22 injection: results from the Met Office HadGEM(2) climate model and comparison with the Goddard 23 Institute for Space Studies ModelE. Atmospheric Chemistry and Physics, 10, 5999-6006. 24
Jones, R. H., S. Westra, and A. Sharma, 2010b: Observed relationships between extreme sub-daily 25 precipitation, surface temperature, and relative humidity. Geophysical Research Letters, 37. 26
Jury, M. R., and M. J. Santiago, 2010: Composite analysis of dust impacts on African easterly waves in the 27 Moderate Resolution Imaging Spectrometer era. Journal of Geophysical Research-Atmospheres, 115, 28 11. 29
Kahn, R. A., B. J. Gaitley, J. V. Martonchik, D. J. Diner, K. A. Crean, and B. Holben, 2005: Multiangle 30 Imaging Spectroradiometer (MISR) global aerosol optical depth validation based on 2 years of 31 coincident Aerosol Robotic Network (AERONET) observations. Journal of Geophysical Research, 32 110, D10s04. 33
Kahn, R. A., and Coauthors, 2007: Satellite-derived aerosol optical depth over dark water from MISR and 34 MODIS: Comparisons with AERONET and implications for climatological studies. Journal of 35 Geophysical Research, 112, D18205. 36
Kanakidou, M., and Coauthors, 2005: Organic aerosol and global climate modelling: a review. Atmospheric 37 Chemistry and Physics, 5, 1053-1123. 38
Kanji, Z. A., and J. P. D. Abbatt, 2006: Laboratory studies of ice formation via deposition mode nucleation 39 onto mineral dust and n-hexane soot samples. Journal of Geophysical Research, 111, D16204. 40
Kanji, Z. A., O. Florea, and J. P. D. Abbatt, 2008: Ice formation via deposition nucleation on mineral dust 41 and organics: dependence of onset relative humidity on total particulate surface area. Environmental 42 Research Letters, 3, 025004. 43
Kanji, Z. A., P. J. DeMott, O. Mohler, and J. P. D. Abbatt, 2011: Results from the University of Toronto 44 continuous flow diffusion chamber at ICIS 2007: instrument intercomparison and ice onsets for 45 different aerosol types. Atmospheric Chemistry and Physics, 11, 31-41. 46
Kärcher, B., and U. Lohmann, 2003: A parameterization of cirrus cloud formation: Heterogeneous freezing. 47 Journal of Geophysical Research, 108, 4402. 48
Kärcher, B., and J. Strom, 2003: The roles of dynamical variability and aerosols in cirrus cloud formation. 49 Atmospheric Chemistry and Physics, 3, 823-838. 50
Kärcher, B., U. Burkhardt, M. Ponater, and C. Frömming, 2010: Importance of representing optical depth 51 variability for estimates of global line-shaped contrail radiative forcing Proc. National Academy of 52 Science of the USA, 107, 19181–19184. 53
Kärcher, B., O. Mohler, P. J. DeMott, S. Pechtl, and F. Yu, 2007: Insights into the role of soot aerosols in 54 cirrus cloud formation. Atmospheric Chemistry and Physics, 7, 4203-4227. 55
First Order Draft Chapter 7 IPCC WGI Fifth Assessment Report
Do Not Cite, Quote or Distribute 7-75 Total pages: 121
Karl, M., A. Gross, C. Leck, and L. Pirjola, 2007: Intercomparison of dimethylsulfide oxidation mechanisms 1 for the marine boundary layer: Gaseous and particulate sulfur constituents. Journal of Geophysical 2 Research, 112, ARTN D15304. 3
Kaufman, Y. J., and M. D. Chou, 1993: Model simulations of the competing climatic effects of SO2 and 4 CO2. Journal of Climate, 6, 1241-1252. 5
Kay, J. E., and A. Gettelman, 2009: Cloud influence on and response to seasonal Arctic sea ice loss. Journal 6 of Geophysical Research, 114, D18204. 7
Kay, J. E., K. Raeder, A. Gettelman, and J. Anderson, 2011: The boundary layer response to recent Arctic 8 sea ice loss and implications for high-latitude climate feedbacks. Journal of Climate, 24, 428-447. 9
Kazil, J., R. G. Harrison, and E. R. Lovejoy, 2008: Tropospheric new particle formation and the role of ions. 10 Space Science Reviews, 137, 241-255. 11
Kazil, J., E. Lovejoy, M. Barth, and K. O'Brien, 2006: Aerosol nucleation over oceans and the role of 12 galactic cosmic rays. Atmospheric Chemistry and Physics, 6, 4905-4924. 13
Kazil, J., H. Wang, G. Feingold, A. D. Clarke, J. R. Snider, and A. R. Bandy, 2011: Modeling chemical and 14 aerosol processes in the transition from closed to open cells during VOCALS-REx. Atmospheric 15 Chemistry and Physics, 11, 7491-7514. 16
Kazil, J., and Coauthors, 2010: Aerosol nucleation and its role for clouds and Earth's radiative forcing in the 17 aerosol-climate model ECHAM5-HAM. Atmospheric Chemistry and Physics, 10, 10733-10752. 18
Keene, W. C., and Coauthors, 2007: Chemical and physical characteristics of nascent aerosols produced by 19 bursting bubbles at a model air-sea interface. Journal of Geophysical Research, 112, ARTN D21202. 20
Keith, D. W., 2000: Geoengineering the climate: History and prospect. Annual Review of Energy 21 Environment, 25, 245-284. 22
——, 2010: Photophoretic levitation of engineered aerosols for geoengineering. Proceedings of the National 23 Academy of Sciences of the United States of America, 107, 16428-16431. 24
Kerkweg, A., J. Buchholz, L. Ganzeveld, A. Pozzer, H. Tost, and P. Jöckel, 2006: Technical Note: An 25 implementation of the dry removal processes DRY DEPositionand SEDImentation in the Modular 26 Earth Submodel System (MESSy). Atmospheric Chemistry and Physics, 6, 4617–4632. 27
Kerminen, V. M., and Coauthors, 2010: Atmospheric nucleation: highlights of the EUCAARI project and 28 future directions. Atmospheric Chemistry and Physics, 10, 10829-10848. 29
Kernthaler, S. C., R. Toumi, and J. D. Haigh, 1999: Some doubts concerning a link between cosmic ray 30 fluxes and global cloudiness. Geophysical Research Letters, 26, 863-865. 31
Khain, A., D. Rosenfeld, and A. Pokrovsky, 2005: Aerosol impact on the dynamics and microphysics of 32 deep convective clouds. Quarterly Journal of the Royal Meteorological Society, 131, 2639-2663. 33
Khain, A. P., 2009: Notes on state-of-the-art investigations of aerosol effects on precipitation: a critical 34 review. Environmental Research Letters, 4, ARTN 015004. 35
Khairoutdinov, M., D. Randall, and C. DeMott, 2005: Simulations of the atmospheric general circulation 36 using a cloud-resolving model as a superparameterization of physical processes. Journal of the 37 Atmospheric Sciences, 62, 2136-2154. 38
Khairoutdinov, M. F., and D. A. Randall, 2001: A cloud resolving model as a cloud parameterization in the 39 NCAR Community Climate System Model: Preliminary results. Geophysical Research Letters, 28, 40 3617-3620. 41
Khairoutdinov, M. F., S. K. Krueger, C.-H. Moeng, P. A. Bogenschutz, and D. A. Randall, 2009: Large-eddy 42 simulation of maritime deep tropical convection. Journal of Advances in Modeling Earth Systems, 1, 43 15. 44
Khan, M. F., Y. Shirasuna, K. Hirano, and S. Masunaga, 2010: Characterization of PM2.5, PM2.5–10 and 45 PMN10 in ambient air, Yokohama, Japan. Atmospheric Research, 96, 159–172. 46
Khare, P., and B. P. Baruah, 2010: Elemental characterization and source identification of PM2.5 using 47 multivariate analysis at the suburban site of North-East India. Atmospheric Research, 98, 148-162. 48
Khvorostyanov, V., and K. Sassen, 1998: Toward the theory of homogeneous nucleation and its 49 parameterization for cloud models. Geophysical Research Letters, 25, 3155-3158. 50
Khvorostyanov, V.I., and J.A. Curry, 2009: Critical humidities of homogeneous and heterogeneous ice 51 nucleation: Inferences from extended classical nucleation theory. Journal of the Geophysical 52 Research, 114, Do4207, doi:10.1029/2008JD011197. 53
Khvorostyanov, V. I., and J. A. Curry, 2005: Fall velocities of hydrometeors in the atmosphere: Refinements 54 to a continuous analytical power law. Journal of the Atmospheric Sciences, 62, 4343-4357. 55
Kiehl, J. T., 1994: On the observed near cancellation between longwave and shortwave cloud forcing in 56 tropical regions. Journal of Climate, 7, 559-565. 57
First Order Draft Chapter 7 IPCC WGI Fifth Assessment Report
Do Not Cite, Quote or Distribute 7-76 Total pages: 121
Kiehl, J. T., 2007: Twentieth century climate model response and climate sensitivity. Geophysical Research 1 Letters, 34, L22710. 2
Kiehl, J. T., T. L. Schneider, P. J. Rasch, M. C. Barth, and J. Wong, 2000: Radiative forcing due to sulfate 3 aerosols from simulations with the National Center for Atmospheric Research Community Climate 4 Model, Version 3. Journal of Geophysical Research, 105, 1441-1457. 5
Kim, B. M., S. Teffera, and M. D. Zeldin, 2000: Characterization of PM2.5 and PM10 in the South Coast air 6 basin of Southern California: Part 1- Spatial variations. Journal of the Air & Waste Management 7 Association, 50, 2034-2044. 8
Kim, H.-S., J.-B. Huh, P. K. Hopke, T. M. Holsen, and S.-M. Yi, 2007: Characteristics of the major chemical 9 constituents of PM2.5 and smog events in Seoul, Korea in 2003 and 2004. Atmospheric Environment, 10 41, 6762-6770. 11
Kim, J. M., and Coauthors, 2010: Enhanced production of oceanic dimethylsulfide resulting from CO2-12 induced grazing activity in a high CO2 world. Environmental Science & Technology, 44, 8140-8143. 13
King, S. M., and Coauthors, 2010: Cloud droplet activation of mixed organic-sulfate particles produced by 14 the photooxidation of isoprene. Atmospheric Chemistry and Physics, 10, 3953-3964. 15
Kinne, S., and Coauthors, 2006: An AeroCom initial assessment - optical properties in aerosol component 16 modules of global models. Atmospheric Chemistry and Physics, 6, 1815-1834. 17
Kirchstetter, T. W., T. Novakov, and P. V. Hobbs, 2004: Evidence that the spectral dependence of light 18 absorption by aerosols is affected by organic carbon. Journal of Geophysical Research, 109, D21208. 19
Kirkby, J., 2007: Cosmic rays and climate. Surveys in Geophysics, 28, 333-375. 20 Kirkby, J., and Coauthors, 2011: Role of sulphuric acid, ammonia and galactic cosmic rays in atmospheric 21
aerosol nucleation. Nature, 476, 429-433. 22 Kirkevag, A., T. Iversen, O. Seland, J. B. Debernard, T. Storelvmo, and J. E. Kristjansson, 2008: Aerosol-23
cloud-climate interactions in the climate model CAM-Oslo. Tellus Series a-Dynamic Meteorology and 24 Oceanography, 60, 492-512. 25
Kleeman, M. J., 2008: A preliminary assessment of the sensitivity of air quality in California to global 26 change. Climatic Change, 87, S273-S292. 27
Kleidman, R. G., A. Smirnov, R. C. Levy, S. Mattoo, and D. Tanré, 2011: Evaluation and wind speed 28 dependence of MODIS aerosol retrievals over open ocean. IEEE Transactions on Geoscience and 29 Remote Sensing, PP, 1-7. 30
Klein, R. J. T., S. Huq, F. Denton, T. E. Downing, R. G. Richels, J. B. Robinson, and F. L. Toth, 2007: Inter-31 relationships between adaptation and mitigation. Climate Change 2007: Impacts, Adaptation and 32 Vulnerability. Contribution of Working Group II to the Fourth Assessment Report of the 33 Intergovernmental Panel on Climate Change,, 745-777 pp. 34
Klein, S. A., and D. L. Hartmann, 1993: The seasonal cycle of low stratiform clouds. Journal of Climate, 6, 35 1587-1606. 36
Klein, S. A., and Coauthors, 2009: Intercomparison of model simulations of mixed-phase clouds observed 37 during the ARM Mixed-Phase Arctic Cloud Experiment. I: Single-layer cloud. Quarterly Journal of 38 the Royal Meteorological Society, 135, 979-1002. 39
Kloster, S., and Coauthors, 2010: Fire dynamics during the 20th century simulated by the Community Land 40 Model. Biogeosciences, 7, 1877-1902. 41
Knopf, D. A., and T. Koop, 2006: Heterogeneous nucleation of ice on surrogates of mineral dust. Journal of 42 Geophysical Research, 111, D12201. 43
Knopf, D. A., P. A. Alpert, B. Wang, and J. Y. Aller, 2011: Stimulation of ice nucleation by marine diatoms. 44 Nature Geoscience, 4, 88-90. 45
Knutti, R., T. F. Stocker, F. Joos, and G. K. Plattner, 2002: Constraints on radiative forcing and future 46 climate change from observations and climate model ensembles. Nature, 416, 719-723. 47
Kocak, M., N. Mihalopoulos, and N. Kubilay, 2007: Chemical composition of the fine and coarse fraction of 48 aerosols in the northeastern Mediterranean. Atmospheric Environment, 41, 7351-7368. 49
Koch, D., and A. D. Del Genio, 2010: Black carbon semi-direct effects on cloud cover: review and synthesis. 50 Atmospheric Chemistry and Physics, 10, 7685-7696. 51
Koch, D., S. Menon, A. D. Genio, R. Ruedy, I. Alienov, and G. A. Schmidt, 2009a: Distinguishing aerosol 52 impacts on climate over the past century. Journal of Climate, 22, 2659–2677. 53
Koch, D., and Coauthors, 2009b: Evaluation of black carbon estimations in global aerosol models. 54 Atmospheric Chemistry and Physics, 9, 9001-9026. 55
First Order Draft Chapter 7 IPCC WGI Fifth Assessment Report
Do Not Cite, Quote or Distribute 7-77 Total pages: 121
Koehler, K. A., S. M. Kreidenweis, P. J. DeMott, M. D. Petters, A. J. Prenni, and O. Mohler, 2010: 1 Laboratory investigations of the impact of mineral dust aerosol on cold cloud formation. Atmospheric 2 Chemistry and Physics, 10, 11955-11968. 3
Koehler, K. A., and Coauthors, 2009: Cloud condensation nuclei and ice nucleation activity of hydrophobic 4 and hydrophilic soot particles. Physical Chemistry Chemical Physics, 11, 7906-7920. 5
Koffi, B., and Coauthors, 2011: Application of the CALIOP Layer Product to evaluate the vertical 6 distribution of aerosols estimated by global models: Part 1. AeroCom phase I results, submitted. 7
Köhler, M., M. Ahlgrimm, and A. Beljaars, 2011: Unified treatment of dry convective and stratocumulus-8 topped boundary layers in the ECMWF model. Quarterly Journal of the Royal Meteorological 9 Society, 137, 43-57. 10
Kok, J. F., 2011: A scaling theory for the size distribution of emitted dust aerosols suggests climate models 11 underestimate the size of the global dust cycle. Proceedings of the National Academy of Sciences of 12 the United States of America, 108, 1016-1021. 13
Kokhanovsky, A. A., and Coauthors, 2010: The inter-comparison of major satellite aerosol retrieval 14 algorithms using simulated intensity and polarization characteristics of reflected light. Atmospheric 15 Measurement Techniques, 3, 909-932. 16
Kondo, Y., and Coauthors, 2011: Emissions of black carbon, organic, and inorganic aerosols from biomass 17 burning in North America and Asia in 2008. Journal of Geophysical Research, 116, D08204. 18
Koop, T., B. P. Luo, A. Tsias, and T. Peter, 2000: Water activity as the determinant for homogeneous ice 19 nucleation in aqueous solutions. Nature, 406, 611-614. 20
Koren, I., G. Feingold, and L. A. Remer, 2010: The invigoration of deep convective clouds over the Atlantic: 21 aerosol effect, meteorology or retrieval artifact? Atmospheric Chemistry and Physics, 10, 8855-8872. 22
Koren, I., Y. Kaufman, L. Remer, and J. Martins, 2004: Measurement of the effect of Amazon smoke on 23 inhibition of cloud formation. Science, 303, 1342-1345. 24
Koren, I., J. V. Martins, L. A. Remer, and H. Afargan, 2008: Smoke invigoration versus inhibition of clouds 25 over the Amazon. Science, 321, 946-949. 26
Koren, I., Y. J. Kaufman, D. Rosenfeld, L. A. Remer, and Y. Rudich, 2005: Aerosol invigoration and 27 restructuring of Atlantic convective clouds. Geophysical Research Letters, 32, L14828. 28
Koren, I., L. A. Remer, Y. J. Kaufman, Y. Rudich, and J. V. Martins, 2007: On the twilight zone between 29 clouds and aerosols. Geophysical Research Letters, 34, L08805. 30
Korhonen, H., K. S. Carslaw, and S. Romakkaniemi, 2010a: Enhancement of marine cloud albedo via 31 controlled sea spray injections: a global model study of the influence of emission rates, microphysics 32 and transport. Atmospheric Chemistry and Physics, 4133-4143. 33
Korhonen, H., K. S. Carslaw, D. V. Spracklen, G. W. Mann, and M. T. Woodhouse, 2008: Influence of 34 oceanic dimethyl sulfide emissions on cloud condensation nuclei concentrations and seasonality over 35 the remote Southern Hemisphere oceans: A global model study. Journal of Geophysical Research, 36 113, ARTN D15204. 37
Korhonen, H., K. S. Carslaw, P. M. Forster, S. Mikkonen, N. D. Gordon, and H. Kokkola, 2010b: Aerosol 38 climate feedback due to decadal increases in Southern Hemisphere wind speeds. Geophysical 39 Research Letters, ARTN L02805. 40
Korolev, A., 2007: Limitations of the Wegener-Bergeron-Findeisen mechanism in the evolution of mixed-41 phase clouds. Journal of the Atmospheric Sciences, 64, 3372-3375. 42
Korolev, A., and P. R. Field, 2008: The effect of dynamics on mixed-phase clouds: Theoretical 43 considerations. Journal of the Atmospheric Sciences, 65, 66-86. 44
Kostinski, A. B., 2008: Drizzle rates versus cloud depths for marine stratocumuli. Environmental Research 45 Letters, 3, 045019. 46
Kravitz, B., A. Robock, O. Boucher, H. Schmidt, K. Talylor, G. Stinchikov, and M. Schulz, 2011: The 47 Geoengineering Model Intercomparison Project (GeoMIP). Atmospheric Science Letters, 12, 162-167. 48
Kristjansson, J. E., 2002: Studies of the aerosol indirect effect from sulfate and black carbon aerosols. 49 Journal of Geophysical Research, 107, 4246. 50
Kristjansson, J. E., T. Iversen, A. Kirkevag, O. Seland, and J. Debernard, 2005: Response of the climate 51 system to aerosol direct and indirect forcing: Role of cloud feedbacks. Journal of Geophysical 52 Research, 110, D24206. 53
Kristjánsson, J. E., C. W. Stjern, F. Stordal, A. M. Fjæraa, G. Myhre, and K. Jónasson, 2008: Cosmic rays, 54 cloud condensation nuclei and clouds – a reassessment using MODIS data. Atmospheric Chemistry 55 and Physics, 8, 7373-7387. 56
First Order Draft Chapter 7 IPCC WGI Fifth Assessment Report
Do Not Cite, Quote or Distribute 7-78 Total pages: 121
Kroll, J. H., and J. H. Seinfeld, 2008: Chemistry of secondary organic aerosol: Formation and evolution of 1 low-volatility organics in the atmosphere. Atmospheric Environment, 42, 3593-3624. 2
Kuang, C., P. H. McMurry, A. V. McCormick, and F. L. Eisele, 2008: Dependence of nucleation rates on 3 sulfuric acid vapor concentration in diverse atmospheric locations. Journal of Geophysical Research, 4 113, ARTN D10209. 5
Kuang, Z., and D. Hartmann, 2007: Testing the fixed anvil temperature hypothesis in a cloud-resolving 6 model. Journal of Climate, 20, 2051-2057. 7
Kubar, T. L., D. L. Hartmann, and R. Wood, 2007: Radiative and convective driving of tropical high clouds. 8 Jounal of Climate, 20, 5510–5526. 9
Kueppers, L. M., M. A. Snyder, and L. C. Sloan, 2007: Irrigation cooling effect: Regional climate forcing by 10 land-use change. Geophys. Res. Lett., 34, L03703. 11
Kulkarni, G., and S. Dobbie, 2010: Ice nucleation properties of mineral dust particles: determination of onset 12 RH(i), IN active fraction, nucleation time-lag, and the effect of active sites on contact angles. 13 Atmospheric Chemistry and Physics, 10, 95-105. 14
Kulmala, M., and V. M. Kerminen, 2008: On the formation and growth of atmospheric nanoparticles. 15 Atmospheric Research, 90, 132-150. 16
Kulmala, M., and Coauthors, 2010: Atmospheric data over a solar cycle: no connection between galactic 17 cosmic rays and new particle formation. Atmospheric Chemistry and Physics, 10, 1885-1898. 18
Kumar, R., S. S. Srivastava, and K. M. Kumari, 2007: Characteristics of aerosols over suburban and urban 19 site of semiarid region in India: Seasonal and spatial variations. Aerosol and Air Quality Research, 7, 20 531-549. 21
Kurten, T., V. Loukonen, H. Vehkamaki, and M. Kulmala, 2008: Amines are likely to enhance neutral and 22 ion-induced sulfuric acid-water nucleation in the atmosphere more effectively than ammonia. 23 Atmospheric Chemistry and Physics, 8, 4095-4103. 24
Kvalevag, M. M., and G. Myhre, 2007: Human impact on direct and diffuse solar radiation during the 25 industrial era. Journal of Climate, 20, 4874-4883. 26
Laken, B., A. Wolfendale, and D. Kniveton, 2009: Cosmic ray decreases and changes in the liquid water 27 cloud fraction over the oceans. Geophysical Research Letters, 36, L23803. 28
Laken, B. A., D. R. Kniveton, and M. R. Frogley, 2010: Cosmic rays linked to rapid mid-latitude cloud 29 changes. Atmospheric Chemistry and Physics, 10, 10941–10948. 30
Lamarque, J.-F., and Coauthors, 2010: Historical (1850-2000) gridded anthropogenic and biomass burning 31 emissions of reactive gases and aerosols: methodology and application. Atmospheric Chemistry and 32 Physics, 10, 7017-7039. 33
Lambert, F. H., and M. R. Allen, 2009: Are changes in global precipitation constrained by the tropospheric 34 energy budget? Journal of Climate, 22, 499-517. 35
Lambert, F. H., M. J. Webb, and M. M. Joshi, 2011: The relationship between land–ocean surface 36 temperature contrast and radiative forcing. Journal of Climate, 24, 3239-3256. 37
Lana, A., and Coauthors, 2011: An updated climatology of surface dimethlysulfide concentrations and 38 emission fluxes in the global ocean. Global Biogeochemical Cycles, 25, ARTN GB1004. 39
Lance, S., and Coauthors, 2011: Cloud condensation nuclei as a modulator of ice processes in Arctic mixed-40 phase clouds. Atmospheric Chemistry and Physics, 11, 8003-8015. 41
Lanz, V. A., M. R. Alfarra, U. Baltensperger, B. Buchmann, C. Hueglin, and A. S. H. Prévôt, 2007: Source 42 apportionment of submicron organic aerosols at an urban site by factor analytical modelling of aerosol 43 mass spectra. Atmospheric Chemistry and Physics, 7, 1503-1522. 44
Latham, J., 1990: Control of global warming? Nature, 347, 339-340. 45 Latham, J., and Coauthors, 2008: Global temperature stabilization via controlled albedo enhancement of 46
low-level maritime clouds. Philosophical Transactions Royal Society London, 366, 3969-3987. 47 Lathière, J., C. N. Hewitt, and D. J. Beerling, 2010: Sensitivity of isoprene emissions from the terrestrial 48
biosphere to 20th century changes in atmospheric CO2 concentration, climate, and land use. Global 49 Biogeochemical Cycles, 24, GB1004. 50
Lau, K. M., and K. M. Kim, 2007: Cooling of the Atlantic by Saharan dust. Geophys. Res. Lett., 34, L23811. 51 Lauer, A., K. Hamilton, Y. Q. Wang, V. T. J. Phillips, and R. Bennartz, 2010: The impact of global warming 52
on marine boundary layer clouds over the Eastern Pacific - A regional model study. Journal of 53 Climate, 23, 5844-5863. 54
Le Clainche, Y., and Coauthors, 2010: A first appraisal of prognostic ocean DMS models and prospects for 55 their use in climate models. Global Biogeochemical Cycles, 24, GB3021. 56
First Order Draft Chapter 7 IPCC WGI Fifth Assessment Report
Do Not Cite, Quote or Distribute 7-79 Total pages: 121
Lebsock, M. D., G. L. Stephens, and C. Kummerow, 2008: Multisensor satellite observations of aerosol 1 effects on warm clouds. Journal of Geophysical Research, 113, D15205. 2
Lee, D., and Coauthors, 2009: Aviation and global climate change in the 21st century. Atmospheric 3 Environment, 3520-3537. 4
Lee, H. S., and B. W. Kang, 2001: Chemical characteristics of principal PM2.5 species in Chongju, South 5 Korea. Atmospheric Environment, 35, 739-749. 6
Lee, L. A., K. S. Carslaw, K. Pringle, G. W. Mann, and D. V. Spracklen, 2011: Emulation of a complex 7 global aerosol model to quantify sensitivity to uncertain parameters. Atmospheric Chemistry and 8 Physics Discussions, 11, 20433-20485. 9
Lee, S. S., L. J. Donner, and J. E. Penner, 2010: Thunderstorm and stratocumulus: how does their contrasting 10 morphology affect their interactions with aerosols? Atmospheric Chemistry and Physics, 10, 6819-11 6837. 12
Lenderink, G., and E. Van Meijgaard, 2008: Increase in hourly precipitation extremes beyond expectations 13 from temperature changes. Nature Geoscience, 1, 511-514. 14
——, 2010: Linking increases in hourly precipitation extremes to atmospheric temperature and moisture 15 changes. Environmental Research Letters, 5. 16
Lenschow, P., H. J. Abraham, K. Kutzner, M. Lutz, J. D. Preu, and W. Reichenbacher, 2001: Some ideas 17 about the sources of PM10. Atmospheric Environment, 35, 23-33. 18
Lenton, T. M., and N. E. Vaughan, 2009: The radiative forcing potential of different climate geoengineering 19 options. Atmospheric Chemistry and Physics, 9, 5539-5561. 20
Levin, Z., and W. R. Cotton, 2009: Aerosol Pollution Impact on Precipitation: A Scientific Review. Springer 21 Verlag, 386 pp. pp. 22
Levy, R. C., L. A. Remer, S. Mattoo, E. F. Vermote, and Y. J. Kaufman, 2007: Second-generation 23 operational algorithm: Retrieval of aerosol properties over land from inversion of Moderate Resolution 24 Imaging Spectroradiometer spectral reflectance. Journal of Geophysical Research, 112, D13211. 25
Levy, R. C., L. A. Remer, R. G. Kleidman, S. Mattoo, C. Ichoku, R. Kahn, and T. F. Eck, 2010: Global 26 evaluation of the Collection 5 MODIS dark-target aerosol products over land. Atmospheric Chemistry 27 and Physics, 10, 10399-10420. 28
Li, J., M. Pósfai, P. V. Hobbs, and P. R. Buseck, 2003: Individual aerosol particles from biomass burning in 29 southern Africa: 2, Compositions and aging of inorganic particles. Journal of Geophysical Research, 30 108, 8484. 31
Li, Z., K.-H. Lee, Y. Wang, J. Xin, and W.-M. Hao, 2010: First observation-based estimates of cloud-free 32 aerosol radiative forcing across China. Journal of Geophysical Research-Atmospheres, 115, D00K18. 33
Liao, H., W. T. Chen, and J. H. Seinfeld, 2006: Role of climate change in global predictions of future 34 tropospheric ozone and aerosols. Journal of Geophysical Research, 111, D12304. 35
Liao, H., Y. Zhang, W. T. Chen, F. Raes, and J. H. Seinfeld, 2009: Effect of chemistry-aerosol-climate 36 coupling on predictions of future climate and future levels of tropospheric ozone and aerosols. Journal 37 of Geophysical Research, 114, D10306. 38
Libardoni, A. G., and C. E. Forest, 2011: Sensitivity of distributions of climate system properties to the 39 surface temperature dataset. Geophysical Research Letters, online. 40
Liepert, B. G., and M. Previdi, 2009: Do models and observations disagree on the rainfall response to global 41 warming? Journal of Climate, 22, 3156-3166. 42
Lin, J. C., T. Matsui, R. A. S. Pielke, and C. Kummerow, 2006: Effects of biomass burning-derived aerosols 43 on precipitation and clouds in the Amazon Basin: A satellite-based empirical study. J. Geophys. Res., 44 111, D19204. 45
Lindsey, D. T., and M. Fromm, 2008: Evidence of the cloud lifetime effect from wildfire-induced 46 thunderstorms. Geophysical Research Letters, 35, L22809. 47
Lindzen, R. S., and Y.-S. Choi, 2011: On the observational determination of climate sensitivity and its 48 implications. Asia-Pacific Journal of Atmospheric Sciences, 47, 377-390. 49
Lintner, B. R., C. E. Holloway, and J. D. Neelin, 2011: Column Water Vapor Statistics and Their 50 Relationship to Deep Convection, Vertical and Horizontal Circulation, and Moisture Structure at 51 Nauru. Journal of Climate, 24, 5454-5466. 52
Liou, K. N., and S. C. Ou, 1989: The role of cloud microphysical processes in climate - An assessment from 53 a one-dimensional perspective. Journal of Geophysical Research, 94, 8599-8607. 54
Liu, W., Y. Wang, A. Russell, and E. S. Edgerton, 2005a: Atmospheric aerosol over two urban-rural pairs in 55 the southeastern United States: Chemical composition and possible sources. Atmospheric 56 Environment, 39, 4453-4470. 57
First Order Draft Chapter 7 IPCC WGI Fifth Assessment Report
Do Not Cite, Quote or Distribute 7-80 Total pages: 121
Liu, X., J. Penner, S. Ghan, and M. Wang, 2007: Inclusion of ice microphysics in the NCAR community 1 atmospheric model version 3 (CAM3). Journal of Climate, 4526-4547. 2
Liu, X. H., J. E. Penner, and M. Herzog, 2005b: Global modeling of aerosol dynamics: Model description, 3 evaluation, and interactions between sulfate and nonsulfate aerosols. Journal of Geophysical 4 Research, D18206. 5
Liu, X. H., J. E. Penner, and M. H. Wang, 2009: Influence of anthropogenic sulfate and black carbon on 6 upper tropospheric clouds in the NCAR CAM3 model coupled to the IMPACT global aerosol model. 7 Journal of Geophysical Research, 114, D03204. 8
Liu, Y., and P. H. Daum, 2002: Anthropogenic aerosols: Indirect warming effect from dispersion forcing. 9 Nature, 419, 580-581. 10
Liu, Y., J. R. Key, and X. Wang, 2008: The influence of changes in cloud cover on recent surface 11 temperature trends in the Arctic. Journal of Climate, 21, 705-715. 12
Lobell, D., G. Bala, A. Mirin, T. Phillips, R. Maxwell, and D. Rotman, 2009: Regional differences in the 13 influence of irrigation on climate. J. Climate, 22, 2248–2255. 14
Lodhi, A., B. Ghauri, M. R. Khan, S. Rahmana, and S. Shafiquea, 2009: Particulate matter (PM2.5) 15 concentration and source apportionment in Lahore. Journal of the Brazilian Chemical Society, 20, 16 1811-1820. 17
Loeb, N. G., and N. Manalo-Smith, 2005: Top-of-atmosphere direct radiative effect of aerosols over global 18 oceans from merged CERES and MODIS observations. Journal of Climate, 18, 3506-3526. 19
Loeb, N. G., and W. Y. Su, 2010: Direct aerosol radiative forcing uncertainty based on a radiative 20 perturbation analysis. Journal of Climate, 23, 5288-5293. 21
Loeb, N. G., and Coauthors, 2009: Toward optimal closure of the Earth's top-of-atmosphere radiation 22 budget. Journal of Climate, 22, 748-766. 23
Lohmann, U., 2002a: A glaciation indirect aerosol effect caused by soot aerosols. Geophysical Research 24 Letters, 29, 1052. 25
——, 2002b: Possible aerosol effects on ice clouds via contact nucleation. Journal of the Atmospheric 26 Sciences, 59, 647-656. 27
——, 2004: Can anthropogenic aerosols decrease the snowfall rate? Journal of the Atmospheric Sciences, 28 61, 2457-2468. 29
——, 2008: Global anthropogenic aerosol effects on convective clouds in ECHAM5-HAM. Atmospheric 30 Chemistry and Physics, 8, 2115-2131. 31
Lohmann, U., and J. Feichter, 1997: Impact of sulfate aerosols on albedo and lifetime of clouds: A sensitivity 32 study with the ECHAM4 GCM. Journal of Geophysical Research, 102, 13685-13700. 33
——, 2001: Can the direct and semi-direct aerosol effect compete with the indirect effect on a global scale? 34 Geophysical Research Letters, 28, 159-161. 35
Lohmann, U., and G. Lesins, 2002: Stronger constraints on the anthropogenic indirect aerosol effect. 36 Science, 298, 1012-1015. 37
Lohmann, U., and B. Kärcher, 2002: First interactive simulations of cirrus clouds formed by homogeneous 38 freezing in the ECHAM general circulation model. Journal of Geophysical Research, 107, 4105. 39
Lohmann, U., and J. Feichter, 2005: Global indirect aerosol effects: a review. Atmospheric Chemistry and 40 Physics, 5, 715-737. 41
Lohmann, U., and K. Diehl, 2006: Sensitivity studies of the importance of dust ice nuclei for the indirect 42 aerosol effect on stratiform mixed-phase clouds. Journal of the Atmospheric Sciences, 63, 968-982. 43
Lohmann, U., and C. Hoose, 2009: Sensitivity studies of different aerosol indirect effects in mixed-phase 44 clouds. Atmospheric Chemistry and Physics, 9, 8917-8934. 45
Lohmann, U., and S. Ferrachat, 2010: Impact of parametric uncertainties on the present-day climate and on 46 the anthropogenic aerosol effect. Atmospheric Chemistry and Physics, 10, 11373-11383. 47
Lohmann, U., J. Feichter, J. Penner, and R. Leaitch, 2000: Indirect effect of sulfate and carbonaceous 48 aerosols: A mechanistic treatment. Journal of Geophysical Research, 105, 12193-12206. 49
Lohmann, U., P. Stier, C. Hoose, S. Ferrachat, S. Kloster, E. Roeckner, and J. Zhang, 2007: Cloud 50 microphysics and aerosol indirect effects in the global climate model ECHAM5-HAM. Atmospheric 51 Chemistry and Physics, 7, 3425-3446. 52
Lohmann, U., and Coauthors, 2010: Total aerosol effect: radiative forcing or radiative flux perturbation? 53 Atmospheric Chemistry and Physics, 10, 3235-3246. 54
Lonati, G., M. Giugliano, P. Butelli, L. Romele, and R. Tardivo, 2005: Major chemical components of PM2.5 55 in Milan (Italy). Atmospheric Environment, 39, 1925-1934. 56
First Order Draft Chapter 7 IPCC WGI Fifth Assessment Report
Do Not Cite, Quote or Distribute 7-81 Total pages: 121
Lu, M.-L., W. C. Conant, H. H. Jonsson, V. Varutbangkul, R. C. Flagan, and J. H. Seinfeld, 2007: The 1 marine stratus/stratocumulus experiment (MASE): aerosol-cloud relationships in marine 2 stratocumulus. Journal of Geophysical Research, 112, D10209. 3
Lu, M.-L., G. Feingold, H. H. Jonsson, P. Y. Chuang, H. Gates, R. C. Flagan, and J. H. Seinfeld, 2008: 4 Aerosol-cloud relationships in continental shallow cumulus. Journal of Geophysical Research, 113, 5 D15201. 6
Lüönd, F., O. Stetzer, A. Welti, and U. Lohmann, 2010: Experimental study on the ice nucleation ability of 7 size-selected kaolinite particles in the immersion mode. Journal of Geophysical Research, 115, 8 D14201. 9
Lynn, B., A. Khain, D. Rosenfeld, and W. L. Woodley, 2007: Effects of aerosols on precipitation from 10 orographic clouds. Journal of Geophysical Research-Atmospheres, 112. 11
Lynn, B. H., A. P. Khain, J. Dudhia, D. Rosenfeld, A. Pokrovsky, and A. Seifert, 2005: Spectral (Bin) 12 microphysics coupled with a mesoscale model (MM5). Part II: Simulation of a CaPE rain event with a 13 squall line. Monthly Weather Review, 133, 59-71. 14
Maenhaut, W., I. Salma, and J. Cafrneyer, 1996: Regional atmospheric aerosol composition and sources in 15 the eastern Transvaal, South Africa, and impact of biomass burning. Journal of Geophysical Research, 16 101, 23613-23650. 17
Maenhaut, W., M.-T. Fernandez-Jimenez, J. L. Vanderzalm, B. Hooper, M. A. Hooper, and N. J. Tapper, 18 2000: Aerosol composition at Jabiru, Australia, and impact of biomass burning. Journal of Aerosol 19 Science, 31, 745-746. 20
Magee, N., A. M. Moyle, and D. Lamb, 2006: Experimental determination of the deposition coefficient of 21 small cirrus-like ice crystals near -50°C. Geophysical Research Letters, 33, L17813. 22
Mahowald, N. M., 2007: Anthropocene changes in desert area: Sensitivity to climate model predictions. 23 Geophysical Research Letters, 34, L18817. 24
Mahowald, N. M., and C. Luo, 2003: A less dusty future? Geophysical Research Letters, 30, 1903. 25 Mahowald, N. M., J. F. Lamarque, X. X. Tie, and E. Wolff, 2006a: Sea-salt aerosol response to climate 26
change: Last Glacial Maximum, preindustrial, and doubled carbon dioxide climates. Journal of 27 Geophysical Research, 111, D05303. 28
Mahowald, N. M., D. R. Muhs, S. Levis, P. J. Rasch, M. Yoshioka, C. S. Zender, and C. Luo, 2006b: 29 Change in atmospheric mineral aerosols in response to climate: Last glacial period, preindustrial, 30 modern, and doubled carbon dioxide climates. Journal of Geophysical Research, 111, D10202. 31
Mahowald, N. M., and Coauthors, 2009: Atmospheric iron deposition: Global distribution, variability, and 32 human perturbations. Annual Review of Marine Science, 1, 245-278. 33
Mahowald, N. M., and Coauthors, 2010: Observed 20th century desert dust variability: impact on climate 34 and biogeochemistry. Atmospheric Chemistry and Physics, 10, 10875-10893. 35
Makkonen, R., A. Asmi, V.-M. Kerminen, M. Boy, A. Arneth, P. Hari, and M. Kulmala, 2011: Air pollution 36 control and decreasing new particle formation lead to strong climate warming. Atmospheric Chemistry 37 and Physics Discussion, 11, 25991-26007. 38
Malm, W. C., and B. A. Schichtel, 2004: Spatial and monthly trends in speciated fine particle concentration 39 in the United States. Journal of Geophysical Research, 109, D03306. 40
Malm, W. C., J. F. Sisler, D. Huffman, R. A. Eldred, and T. A. Cahill, 1994: Spatial and seasonal trends in 41 particle concentration and optical extinction in the United States. Journal of Geophysical Research, 42 99, 1347-1370. 43
Mangold, A., and Coauthors, 2005: Experimental investigation of ice nucleation by different types of 44 aerosols in the aerosol chamber AIDA: implications to microphysics of cirrus clouds. Meteorologische 45 Zeitschrift, 14, 485-497. 46
Mann, G. W., and Coauthors, 2010: Description and evaluation of GLOMAP-mode: a modal global aerosol 47 microphysics model for the UKCA composition-climate model. Geoscientific Model Development, 3, 48 519-551. 49
Manninen, H. E., and Coauthors, 2010: EUCAARI ion spectrometer measurements at 12 European sites - 50 analysis of new particle formation events. Atmospheric Chemistry and Physics, 10, 7907-7927. 51
Mapes, B., J. Bacmeister, M. Khairoutdinov, C. Hannay, and M. Zhao, 2009: Virtual Field Campaigns on 52 Deep Tropical Convection in Climate Models. Journal of Climate, 22, 244-257. 53
Marchand, R., T. Ackerman, M. Smyth, and W. B. Rossow, 2010: A review of cloud top height and optical 54 depth histograms from MISR, ISCCP, and MODIS. Journal of Geophysical Research, 115, D16206. 55
First Order Draft Chapter 7 IPCC WGI Fifth Assessment Report
Do Not Cite, Quote or Distribute 7-82 Total pages: 121
Mariani, R. L., and W. Z. d. Mello, 2007: PM2.5–10, PM2.5 and associated water-soluble inorganic species 1 at a coastal urban site in the metropolitan region of Rio de Janeiro. Atmospheric Environment, 41, 2 2887–2892. 3
Markowicz, K. M., and M. L. Witek, 2011: Simulations of contrail optical properties and radiative forcing 4 for various crystal shapes. J. Appl. Meteor. Climatol., 50, 1740–1755. 5
Marlon, J. R., and Coauthors, 2008: Climate and human influences on global biomass burning over the past 6 two millennia. Nature Geoscience, 1, 697-702. 7
Marsh, N. D., and H. Svensmark, 2000: Low cloud properties influenced by cosmic rays. Physical Review 8 Letters, 85, 5004-5007. 9
Martin, S. T., and Coauthors, 2010: Sources and properties of Amazonian aerosol particles. Review of 10 Geophysics, 48, RG2002. 11
Martins, J. A., M. A. F. S. Dias, and F. L. T. Goncalves, 2009: Impact of biomass burning aerosols on 12 precipitation in the Amazon: A modeling case study. Journal of Geophysical Research-Atmospheres, 13 114. 14
Matheou, G., D. Chung, L. Nuijens, B. Stevens, and J. Teixeira, 2011: On the fidelity of large-eddy 15 simulation of shallow precipitating cumulus convection. Monthly Weather Review, 139, 2918-2939. 16
Mauger, G. S., and J. R. Norris, 2010: Assessing the impact of meteorological history on subtropical cloud 17 fraction. Journal of Climate, 23, 2926-2940. 18
May, P. T., J. H. Mather, G. Vaughan, C. Jakob, G. M. McFarquhar, K. N. Bower, and G. G. Mace, 2008: 19 The tropical warm pool international cloud experiment. Bulletin of the American Meteorological 20 Society, 89, 629-645. 21
McComiskey, A., and G. Feingold, 2008: Quantifying error in the radiative forcing of the first aerosol 22 indirect effect. Geophysical Research Letters, 35, L02810. 23
McComiskey, A., and G. Feingold, 2011: The scale problem in quantifying aerosol indirect effects. Atmos. 24 Chem. Phys. Discuss., 11, 26741-26789. 25
McConnell, J. R., and Coauthors, 2007: 20th-century industrial black carbon emissions altered arctic climate 26 forcing. Science, 317, 1381-1384. 27
McCracken, K. G., and J. Beer, 2007: Long-term changes in the cosmic ray intensity at Earth, 1428–2005. J. 28 Geophys. Res. , 112, A10101. 29
McFarquhar, G. M., and Coauthors, 2011: Indirect and semi-direct aerosol campaign: The impact of Arctic 30 aerosols on clouds. Bulletin of the American Meteorological Society, 92, 183-201. 31
McMeeking, G. R., and Coauthors, 2010: Black carbon measurements in the boundary layer over western 32 and northern Europe. Atmospheric Chemistry and Physics, 10, 9393-9414. 33
Medeiros, B., B. Stevens, I. M. Held, M. Zhao, D. L. Williamson, J. G. Olson, and C. S. Bretherton, 2008: 34 Aquaplanets, climate sensitivity, and low clouds. Journal of Climate, 21, 4974-4991. 35
Meehl, G. A., J. M. Arblaster, K. Matthes, F. Sassi, and H. van Loon, 2009: Amplifying the Pacific climate 36 system response to a small 11-year solar cycle forcing. Science, 325, 1114-1118. 37
Meehl, G. A., and Coauthors, 2007: Global Climate Projections. Climate Change 2007: The Physical 38 Science Basis. Contribution of Working Group I to the Fourth Assessment Report of the 39 Intergovernmental Panel on Climate Change, Cambridge University Press. 40
Menon, S., and L. Rotstayn, 2006: The radiative influence of aerosol effects on liquid-phase cumulus and 41 stratiform clouds based on sensitivity studies with two climate models. Climate Dynamics, 27, 345-42 356. 43
Menon, S., and A. DelGenio, 2007: Evaluating the impacts of carbonaceous aerosols on clouds and climate. 44 Human-Induced Climate Change: An Interdisciplinary Assessment, S. M. E., H. S. Kheshgi, J. Smith, 45 F. C. de la Chesnaye, J. M. Reilly, T. Wilson, and C. Kolstad, Eds., Cambridge University Press. 46
Menon, S., A. D. Del Genio, D. Koch, and G. Tselioudis, 2002: GCM Simulations of the aerosol indirect 47 effect: Sensitivity to cloud parameterization and aerosol burden. Journal of the Atmospheric Sciences, 48 59, 692-713. 49
Mercado, L. M., N. Bellouin, S. Sitch, O. Boucher, C. Huntingford, M. Wild, and P. M. Cox, 2009: Impact 50 of changes in diffuse radiation on the global land carbon sink. Nature, 458, 1014-1017. 51
Merikanto, J., D. V. Spracklen, G. W. Mann, S. J. Pickering, and K. S. Carslaw, 2009: Impact of nucleation 52 on global CCN. Atmospheric Chemistry and Physics, 9, 8601-8616. 53
Metzger, A., and Coauthors, 2010: Evidence for the role of organics in aerosol particle formation under 54 atmospheric conditions. Proceedings of the National Academy of Sciences of the United States of 55 America, 107, 6646-6651. 56
First Order Draft Chapter 7 IPCC WGI Fifth Assessment Report
Do Not Cite, Quote or Distribute 7-83 Total pages: 121
Meyers, M. P., P. J. Demott, and W. R. Cotton, 1992: New primary ice-nucleation parametrizations in an 1 explicit cloud model. Journal of Applied Meteorology, 31, 708-721. 2
Ming, J., D. Zhang, S. Kang, and W. Tian, 2007a: Aerosol and fresh snow chemistry in the East Rongbuk 3 Glacier on the northern slope of Mt. Qomolangma (Everest). Journal of Geophysical Research, 112, 4 D15307. 5
Ming, Y., V. Ramaswamy, P. A. Ginoux, L. W. Horowitz, and L. M. Russell, 2005: Geophysical Fluid 6 Dynamics Laboratory general circulation model investigation of the indirect radiative effects of 7 anthropogenic sulfate aerosol. Journal of Geophysical Research, 110, D22206. 8
Ming, Y., V. Ramaswamy, L. J. Donner, V. T. J. Phillips, S. A. Klein, P. A. Ginoux, and L. W. Horowitz, 9 2007b: Modeling the interactions between aerosols and liquid water clouds with a self-consistent 10 cloud scheme in a general circulation model. Journal of the Atmospheric Sciences, 64, 1189-1209. 11
Mirme, S., A. Mirme, A. Minikin, A. Petzold, U. Horrak, V. M. Kerminen, and M. Kulmala, 2010: 12 Atmospheric sub-3 nm particles at high altitudes. Atmospheric Chemistry and Physics, 10, 437-451. 13
Mishchenko, M. I., and Coauthors, 2007: Accurate monitoring of terrestrial aerosols and total solar 14 irradiance - Introducing the glory mission. Bulletin of the American Meteorological Society, 88, 677-15 691. 16
Mitchell, D. L., and W. Finnegan, 2009: Modification of cirrus clouds to reduce global warming. 17 Environmental Research Letters, 4, 045102. 18
Mitchell, D. L., R. P. d'Entremont, and R. P. Lawson, 2010: Inferring Cirrus Size Distributions through 19 Satellite Remote Sensing and Microphysical Databases. Journal of the Atmospheric Sciences, 67, 20 1106-1125. 21
Miura, H., H. Tomita, T. Nasuno, S. Iga, M. Satoh, and T. Matsuno, 2005: A climate sensitivity test using a 22 global cloud resolving model under an aqua planet condition. Geophysical Research Letters, ARTN 23 L19717, DOI 10.1029/2005GL023672. 24
Mkoma, S. L., 2008: Physico-chemical characterisation of atmospheric aerosol in Tanzania, with emphasis 25 on the carbonaceous aerosol components and on chemical mass closure, Department of Analytical 26 Chemistry, Ghent University. 27
Mkoma, S. L., W. Maenhaut, X. G. Chi, W. Wang, and N. Raes, 2009a: Characterisation of PM10 28 atmospheric aerosols for the wet season 2005 at two sites in East Africa. Atmospheric Environment, 29 43, 631–639. 30
Mkoma, S. L., W. Maenhaut, X. Chi, W. Wang, and N. Raes, 2009b: Chemical composition and mass 31 closure for PM10 aerosols during the 2005 dry season at a rural site in Morogoro, Tanzania. X-Ray 32 Spectrom, 38, 293–300. 33
Mohler, O., and Coauthors, 2008: Heterogeneous ice nucleation activity of bacteria: new laboratory 34 experiments at simulated cloud conditions. Biogeosciences, 5, 1425-1435. 35
Mohler, O., and Coauthors, 2005: Effect of sulfuric acid coating on heterogeneous ice nucleation by soot 36 aerosol particles. Journal of Geophysical Research, 110, D11210. 37
Mohler, O., and Coauthors, 2006: Efficiency of the deposition mode ice nucleation on mineral dust particles. 38 Atmospheric Chemistry and Physics, 6, 3007-3021. 39
Mohler, O., and Coauthors, 2003: Experimental investigation of homogeneous freezing of sulphuric acid 40 particles in the aerosol chamber AIDA. Atmospheric Chemistry and Physics, 3, 211-223. 41
Morales, J. A., D. Pirela, M. G. d. Nava, B. S. d. Borrego, H. Velasquez, and J. Duran, 1998: Inorganic water 42 soluble ions in atmospheric particles over Maracaibo Lake Basin in the western region of Venezuela. 43 Atmospheric Research, 46, 307–320. 44
Morrison, H., and A. Gettelman, 2008: A new two-moment bulk stratiform cloud microphysics scheme in 45 the community atmosphere model, version 3 (CAM3). Part I: Description and numerical tests. Journal 46 of Climate, 3642-3659. 47
Morrison, H., and W. W. Grabowski, 2011: Cloud-system resolving model simulations of aerosol indirect 48 effects on tropical deep convection and its thermodynamic environment. Atmos. Chem. Phys., 11, 49 10503-10523. 50
Morrison, H., P. Zuidema, G. M. McFarquhar, A. Bansemer, and A. J. Heymsfield, 2011: Snow 51 microphysical observations in shallow mixed-phase and deep frontal Arctic cloud systems. Quarterly 52 Journal of the Royal Meteorological Society, 137, 1589-1601. 53
Morrison, H., G. DeBoer, G. Feingold, J. Y. Harrington, M. Shupe, and K. Sulia, 2012: Resilience of 54 persistent Arctic mixed-phase clouds. Nature Geoscience, in press. 55
Mortazavi, R., C. T. Hayes, and P. A. Ariya, 2008: Ice nucleation activity of bacteria isolated from snow 56 compared with organic and inorganic substrates. Environmental Chemistry, 5, 373-381. 57
First Order Draft Chapter 7 IPCC WGI Fifth Assessment Report
Do Not Cite, Quote or Distribute 7-84 Total pages: 121
Moteki, N., and Y. Kondo, 2010: Dependence of laser-induced incandescence on physical properties of 1 black carbon aerosols: Measurements and theoretical interpretation. Aerosol Science and Technology, 2 44, 663-675. 3
Moteki, N., Y. Kondo, N. Takegawa, and S. Nakamura, 2009: Directional dependence of thermal emission 4 from nonspherical carbon particles. Journal of Aerosol Science, 40, 790-801. 5
Moteki, N., and Coauthors, 2007: Evolution of mixing state of black carbon particles: Aircraft measurements 6 over the western Pacific in March 2004. Geophysical Research Letters, L11803. 7
Mouillot, F., A. Narasimha, Y. Balkanski, J. F. Lamarque, and C. B. Field, 2006: Global carbon emissions 8 from biomass burning in the 20th century. Geophysical Research Letters, 33, L01801. 9
Muhlbauer, A., and U. Lohmann, 2009: Sensitivity studies of aerosol-cloud interactions in mixed-phase 10 orographic precipitation. Journal of the Atmospheric Sciences, 66, 2517-2538. 11
Muller, C. J., P. A. O'Gorman, and L. E. Back, 2011: Intensification of precipitation extremes with warming 12 in a cloud-resolving model. Journal of Climate, 24, 2784-2800. 13
Muller, G., and A. Chlond, 1996: Three-dimensional numerical study of cell broadening during cold-air 14 outbreaks. Boundary-Layer Meteorology, 81, 289-323. 15
Muller, J., and Coauthors, 2008: Global isoprene emissions estimated using MEGAN, ECMWF analyses and 16 a detailed canopy environment model. Atmospheric Chemistry and Physics, 8, 1329-1341. 17
Murphy, D. M., S. Solomon, R. W. Portmann, K. H. Rosenlof, P. M. Forster, and T. Wong, 2009: An 18 observationally based energy balance for the Earth since 1950. Journal of Geophysical Research, 114, 19 D17107. 20
Murray, B. J., S. L. Broadley, T. W. Wilson, J. D. Atkinson, and R. H. Wills, 2011: Heterogeneous freezing 21 of water droplets containing kaolinite particles. Atmospheric Chemistry and Physics, 11, 4191-4207. 22
Myhre, G., 2009: Consistency between satellite-derived and modeled estimates of the direct aerosol effect. 23 Science, 325, 187-190. 24
Myhre, G., and Coauthors, 2007: Comparison of the radiative properties and direct radiative effect of 25 aerosols from a global aerosol model and remote sensing data over ocean. Tellus B, 59, 115-129. 26
Myhre, G., and Coauthors, 2009: Modelled radiative forcing of the direct aerosol effect with multi-27 observation evaluation. Atmospheric Chemistry and Physics, 9, 1365-1392. 28
Nakajima, T., and S. Michael, 2009: What do we know about large scale changes of aerosols, clouds, and the 29 radiative budget? Clouds in the Perturbed Climate System: Their Relationship to Energy Balance, 30 Atmospheric Dynamics, and Precipitation, R. J. Charlson, and J. Heintzenberg, Eds., MIT Press. 31
Neale, R. B., J. H. Richter, and M. Jochum, 2008: The impact of convection on ENSO: From a delayed 32 oscillator to a series of events. Journal of Climate, 21, 5904-5924. 33
Neelin, J. D., M. Münnich, H. Su, J. E. Meyerson, and C. E. Holloway, 2006: Tropical drying trends in 34 global warming models and observations. Proc. Natl. Acad. Science of the USA, 103, 6110-6115. 35
Neggers, R. A. J., 2009: A dual mass flux framework for boundary layer convection. Part II: Clouds. Journal 36 of the Atmospheric Sciences, 66, 1489-1506. 37
Neggers, R. A. J., M. Kohler, and A. C. M. Beljaars, 2009: A dual mass flux framework for boundary layer 38 convection. Part I: Transport. Journal of the Atmospheric Sciences, 66, 1465-1487. 39
Nenes, A., and J. H. Seinfeld, 2003: Parameterization of cloud droplet formation in global climate models. J. 40 Geophys. Res., 108, 4415. 41
Nenes, A., S. N. Pandis, and C. Pilinis, 1998: ISORROPIA: A new thermodynamic equilibrium model for 42 multiphase multicomponent inorganic aerosols. Aquatic Geochemistry, 4, 123–152. 43
Niedermeier, D., and Coauthors, 2010: Heterogeneous freezing of droplets with immersed mineral dust 44 particles - measurements and parameterization. Atmospheric Chemistry and Physics, 10, 3601-3614. 45
Niemand, M., and Coauthors, 2011: Parameterization of immersion freezing on mineral dust particles: An 46 application in a regional scale model. Journal of the Atmospheric Science, subm. to. 47
Norris, J. R., and S. F. Iacobellis, 2005: North Pacific cloud feedbacks inferred from synoptic-scale dynamic 48 and thermodynamic relationships. Journal of Climate, 18, 4862-4878. 49
Nuijens, L., B. Stevens, and A. P. Siebesma, 2009: The environment of precipitating shallow cumulus 50 convection. Journal of the Atmospheric Sciences, 66, 1962-1979. 51
Nyanganyura, D., W. Maenhaut, M. Mathuthu, A. Makarau, and F. X. Meixner, 2007: The chemical 52 composition of tropospheric aerosols and their contributing sources to a continental background site in 53 northern Zimbabwe from 1994 to 2000. Atmospheric Environment, 41, 2644–2659. 54
O'Dowd, C., C. Monahan, and M. Dall'Osto, 2010: On the occurrence of open ocean particle production and 55 growth events. Geophysical Research Letters, 37, L19805. 56
First Order Draft Chapter 7 IPCC WGI Fifth Assessment Report
Do Not Cite, Quote or Distribute 7-85 Total pages: 121
O'Gorman, P., and T. Schneider, 2009: The physical basis for increases in precipitation extremes in 1 simulations of 21st-century climate change. Proceedings of the National Academy of Sciences of the 2 United States of America, 106, 14773-14777. 3
Oanh, N. T. K., and Coauthors, 2006: Particulate air pollution in six Asian cities: Spatial and temporal 4 distributions, and associated sources. Atmospheric Environment, 40, 3367-3380. 5
Oleson, K. W., G. B. Bonan, and J. Feddema, 2010: Effects of white roofs on urban temperature in a global 6 climate model. Geophysical Research Letters, 37, L03701. 7
Omar, A. H., and Coauthors, 2009: The CALIPSO automated aerosol classification and lidar ratio selection 8 algorithm. Journal of Atmospheric and Oceanic Technology, 26, 1994-2014. 9
Oouchi, K., A. T. Noda, M. Satoh, B. Wang, S. P. Xie, H. G. Takahashi, and T. Yasunari, 2009: Asian 10 summer monsoon simulated by a global cloud-system-resolving model: Diurnal to intra-seasonal 11 variability. Geophysical Research Letters, 36, L11815. 12
Osborne, S. R., A. J. Barana, B. T. Johnson, J. M. Haywood, E. Hesse, and S. NeW man, 2011: Short-wave 13 and long-wave radiative properties of Saharan dust aerosol. Quarterly Journal of the Royal 14 Meteorological Society, 137, 1149-1167. 15
Oshima, N., and Coauthors, 2011: Wet removal of black carbon in Asian outflow: Aerosol Radiative Forcing 16 in East Asia (A-FORCE) aircraft campaign. Journal of Geophysical Research-Atmospheres, 17 submitted. 18
Ovadnevaite, J., C. O'Dowd, M. Dall'Osto, D. Ceburnis, D. R. Worsnop, and H. Berresheim, 2011: Detecting 19 high contributions of primary organic matter to marine aerosol: A case study. Geophysical Research 20 Letters, 38, L02807. 21
Paasonen, P., and Coauthors, 2010: On the roles of sulphuric acid and low-volatility organic vapours in the 22 initial steps of atmospheric new particle formation. Atmospheric Chemistry and Physics, 10, 11223-23 11242. 24
Pacifico, F., S. P. Harrison, C. D. Jones, and S. Sitch, 2009: Isoprene emissions and climate. Atmospheric 25 Environment, 43, 6121-6135. 26
Painter, T. H., J. S. Deems, J. Belnap, A. F. Hamlet, C. C. Landry, and B. Udall, 2010: Response of 27 Colorado River runoff to dust radiative forcing in snow. Proceedings of the National Academy of 28 Sciences of the United States of America, 107, 17125-17130. 29
Pallé, E., 2005: Possible satellite perspective effects on the reported correlations between solar activity and 30 clouds. Geophysical Research Letters, 32, L03802. 31
Palm, S. P., S. T. Strey, J. Spinhirne, and T. Markus, 2010: Influence of Arctic sea ice extent on polar cloud 32 fraction and vertical structure and implications for regional climate. Journal of Geophysical Research-33 Atmospheres, 115, 9. 34
Park, S., and C. S. Bretherton, 2009: The University of Washington shallow convection and moist turbulence 35 schemes and their impact on climate simulations with the Community Atmosphere Model. Journal of 36 Climate, 22, 3449-3469. 37
Pawlowska, H., and J. L. Brenguier, 2003: An observational study of drizzle formation in stratocumulus 38 clouds for general circulation model (GCM) parameterizations. Journal of Geophysical Research, 108, 39 8630. 40
Pechony, O., and D. T. Shindell, 2010: Driving forces of global wildfires over the past millennium and the 41 forthcoming century. Proceedings of the National Academy of Sciences of the United States of 42 America, 107, 19167-19170. 43
Peng, Y. R., and U. Lohmann, 2003: Sensitivity study of the spectral dispersion of the cloud droplet size 44 distribution on the indirect aerosol effect. Geophysical Research Letters, 30, 1507. 45
Penner, J. E., S. Y. Zhang, and C. C. Chuang, 2003: Soot and smoke aerosol may not warm climate. Journal 46 of Geophysical Research, 108, 4657. 47
Penner, J. E., L. Xu, and M. H. Wang, 2011: Satellite methods underestimate indirect climate forcing by 48 aerosols. Proceedings of the National Academy of Sciences of the United States of America, 108, 49 13404-13408. 50
Penner, J. E., Y. Chen, M. Wang, and X. Liu, 2009: Possible influence of anthropogenic aerosols on cirrus 51 clouds and anthropogenic forcing. Atmospheric Chemistry and Physics, 9, 879-896. 52
Penner, J. E., and Coauthors, 2006: Model intercomparison of indirect aerosol effects. Atmospheric 53 Chemistry and Physics, 6, 3391-3405. 54
Penner, J. E., and Coauthors, 2001: Aerosols, their direct and indirect effects. Climate Change 2001: The 55 Scientific Basis. Contribution of Working Group I to the Third Assessment Report of the 56 Intergovernmental Panel on Climate Change, Cambridge University Press. 57
First Order Draft Chapter 7 IPCC WGI Fifth Assessment Report
Do Not Cite, Quote or Distribute 7-86 Total pages: 121
Perez, N., J. Pey, X. Querol, A. Alastuey, J. M. Lopez, and M. Viana, 2008: Partitioning of major and trace 1 components in PM10-PM2.5-PM1 at an urban site in Southern Europe. Atmospheric Environment, 42, 2 1677-1691. 3
Peters, K., J. Quaas, and N. Bellouin, 2011: Effects of absorbing aerosols in cloudy skies: a satellite study 4 over the Atlantic Ocean. Atmospheric Chemistry and Physics, 11, 1393-1404. 5
Petroff, A., and L. Zhang, 2010: Development and validation of a size-resolved particle dry deposition 6 scheme for application in aerosol transport models. Geoscientific Model Development, 3, 753-769. 7
Petters, M. D., and S. M. Kreidenweis, 2007: A single parameter representation of hygroscopic growth and 8 cloud condensation nucleus activity. Atmospheric Chemistry and Physics, 7, 1961-1971. 9
Petters, M. D., J. R. Snider, B. Stevens, G. Vali, I. Faloona, and L. M. Russell, 2006: Accumulation mode 10 aerosol, pockets of open cells, and particle nucleation in the remote subtropical Pacific marine 11 boundary layer. Journal of Geophysical Research-Atmospheres, 111. 12
Petters, M. D., and Coauthors, 2009: Ice nuclei emissions from biomass burning. Journal of Geophysical 13 Research, 114, D07209. 14
Phillips, T. J., and Coauthors, 2004: Evaluating parameterizations in General Circulation Models: Climate 15 simulation meets weather prediction. Bulletin of the American Meteorological Society, 85, 1903-1915. 16
Phillips, V. T. J., P. J. DeMott, and C. Andronache, 2008: An empirical parameterization of heterogeneous 17 ice nucleation for multiple chemical species of aerosol. Journal of the Atmospheric Sciences, 65, 18 2757-2783. 19
Phillips, V. T. J., and Coauthors, 2009: Potential impacts from biological aerosols on ensembles of 20 continental clouds simulated numerically. Biogeosciences, 6, 987-1014. 21
Pierce, J. R., and P. J. Adams, 2009a: Can cosmic rays affect cloud condensation nuclei by altering new 22 particle formation rates? Geophysical Research Letters, 36, L09820. 23
——, 2009b: Uncertainty in global CCN concentrations from uncertain aerosol nucleation and primary 24 emission rates. Atmospheric Chemistry and Physics, 9, 1339-1356. 25
Pierce, J. R., D. K. Weisenstein, P. Heckendorn, T. Peter, and D. W. Keith, 2010: Efficient formation of 26 stratospheric aerosol for climate engineering by emission of condensible vapor from aircraft. 27 Geophysical Research Letters, 37, L18805. 28
Pincus, R., and M. B. Baker, 1994: Effect of precipitation on the albedo susceptibility of clouds in the marine 29 boundary-layer. Nature, 372, 250-252. 30
Platnick, S., M. D. King, S. A. Ackerman, W. P. Menzel, B. A. Baum, J. C. Riedi, and R. A. Frey, 2003: The 31 MODIS cloud products: Algorithms and examples from Terra. IEEE Transactions on Geoscience and 32 Remote Sensing, 41, 459-473. 33
Ponater, M., S. Marquart, R. Sausen, and U. Schumann, 2005: On contrail climate sensitivity. Geophys. Res. 34 Lett., 32, L10706. 35
Pósfai, M., R. Simonics, J. Li, P. Hobbs, and P. Buseck, 2003: Individual aerosol particles from biomass 36 burning in southern Africa: 1. Compositions and size distributions of carbonaceous particles. Journal 37 of Geophysical Research-Atmospheres, ARTN 8483, DOI 10.1029/2002JD002291. 38
Posselt, R., and U. Lohmann, 2008: Influence of giant CCN on warm rain processes in the ECHAM5 GCM. 39 Atmospheric Chemistry and Physics, 8, 3769-3788. 40
Posselt, R., and U. Lohmann, 2009: Sensitivity of the total anthropogenic aerosol effect to the treatment of 41 rain in a global climate model. Geophysical Research Letters, 36, L02805. 42
Pratt, K. A., and K. A. Prather, 2010: Aircraft measurements of vertical profiles of aerosol mixing states. 43 Journal of Geophysical Research, 115, D11305. 44
Pratt, K. A., and Coauthors, 2009: In situ detection of biological particles in cloud ice-crystals. Nature 45 Geoscience, 2, 397-400. 46
Prenni, A. J., and Coauthors, 2007: Can ice-nucleating aerosols affect arctic seasonal climate? Bulletin of the 47 American Meteorological Society, 88, 541-+. 48
Prenni, A. J., and Coauthors, 2009: Relative roles of biogenic emissions and Saharan dust as ice nuclei in the 49 Amazon basin. Nature Geoscience, 2, 401-404. 50
Pringle, K., H. Tost, A. Pozzer, U. Poschl, and J. Lelieveld, 2010: Global distribution of the effective aerosol 51 hygroscopicity parameter for CCN activation. Atmospheric Chemistry and Physics, 5241-5255. 52
Prisle, N. L., T. Raatikainen, A. Laaksonen, and M. Bilde, 2010: Surfactants in cloud droplet activation: 53 mixed organic-inorganic particles. Atmospheric Chemistry and Physics, 10, 5663-5683. 54
Prisle, N. L., T. Raatikainen, R. Sorjamaa, B. Svenningsson, A. Laaksonen, and M. Bilde, 2008: Surfactant 55 partitioning in cloud droplet activation: a study of C8, C10, C12 and C14 normal fatty acid sodium 56 salts. Tellus Series B-Chemical and Physical Meteorology, 60, 416-431. 57
First Order Draft Chapter 7 IPCC WGI Fifth Assessment Report
Do Not Cite, Quote or Distribute 7-87 Total pages: 121
Pritchard, M. S., and R. C. J. Somerville, 2010: Assessing the diurnal cycle of precipitation in a multi-scale 1 climate model. J. Adv. Model. Earth Syst., 1, Art. #12. 2
Puma, M. J., and B. I. Cook, 2010: Effects of irrigation on global climate during the 20th century. J. 3 Geophys. Res., 115, D16120. 4
Putaud, J.-P., and Coauthors, 2004: European aerosol phenomenology-2: chemical characteristics of 5 particulate matter at kerbside, urban, rural and background sites in Europe. Atmospheric Environment, 6 2579-2595. 7
Puxbaum, H., and Coauthors, 2004: A dual site study of PM2.5 and PM10 aerosol chemistry in the larger 8 region of Vienna, Austria. Atmos. Environ., 38, 3949-3958. 9
Pye, H., H. Liao, S. Wu, L. Mickley, D. Jacob, D. Henze, and J. Seinfeld, 2009: Effect of changes in climate 10 and emissions on future sulfate-nitrate-ammonium aerosol levels in the United States. Journal of 11 Geophysical Research-Atmospheres, 114, -. 12
Qu, W. J., X. Y. Zhang, R. Arimoto, D. Wang, Y. Q. Wang, L. W. Yan, and Y. Li, 2008: Chemical 13 composition of the background aerosol at two sites in southwestern and northwestern China: potential 14 influences of regional transport. Tellus, 60B, 657-673. 15
Quaas, J., and O. Boucher, 2005: Constraining the first aerosol indirect radiative forcing in the LMDZ GCM 16 using POLDER and MODIS satellite data. Geophysical Research Letters, 32, L17814. 17
Quaas, J., O. Boucher, and F. M. Bréon, 2004: Aerosol indirect effects in POLDER satellite data and the 18 Laboratoire de Meteorologie Dynamique-Zoom (LMDZ) general circulation model. Journal of 19 Geophysical Research, 109, D08205. 20
Quaas, J., O. Boucher, and U. Lohmann, 2006: Constraining the total aerosol indirect effect in the LMDZ 21 and ECHAM4 GCMs using MODIS satellite data. Atmospheric Chemistry and Physics, 6, 947-955. 22
Quaas, J., O. Boucher, N. Bellouin, and S. Kinne, 2008: Satellite-based estimate of the direct and indirect 23 aerosol climate forcing. Journal of Geophysical Research-Atmospheres, D05204, DOI 24 10.1029/2007JD008962. 25
Quaas, J., O. Boucher, A. Jones, G. Weedon, J. Kieser, and H. Joos, 2009a: Exploiting the weekly cycle as 26 observed over Europe to analyse aerosol indirect effects in two climate models. Atmospheric 27 Chemistry and Physics, 9, 8493-8501. 28
Quaas, J., and Coauthors, 2009b: Aerosol indirect effects - general circulation model intercomparison and 29 evaluation with satellite data. Atmospheric Chemistry and Physics, 9, 8697-8717. 30
Querol, X., and Coauthors, 2001: PM10 and PM2.5 source apportionment in the Barcelona Metropolitan 31 Area, Catalonia, Spain. Atmospheric Environment, 35/36, 6407-6419. 32
Querol, X., and Coauthors, 2006: Immobilization of heavy metals in polluted soils by the addition of zeolitic 33 material synthesized from coal fly ash. Chemosphere, 62, 171–180. 34
Querol, X., and Coauthors, 2009: Variability in regional background aerosols within the Mediterranean. 35 Atmos. Chem. Phys., 9, 4575-4591. 36
Querol, X., and Coauthors, 2004: Speciation and origin of PM10 and PM2.5 in selected European cities. 37 Atmospheric Environment, 38, 6547-6555. 38
Querol, X., and Coauthors, 2008: Spatial and temporal variations in airborne particulate matter (PM10 and 39 PM2.5) across Spain 1999-2005. Atmospheric Environment. 40
Racherla, P., and P. Adams, 2006: Sensitivity of global tropospheric ozone and fine particulate matter 41 concentrations to climate change. Journal of Geophysical Research-Atmospheres, 111, -. 42
Radhi, M., M. A. Box, G. P. Box, R. M. Mitchell, D. D. Cohen, E. Stelcer, and M. D. Keywood, 2010: 43 Optical, physical and chemical characteristics of Australian continental aerosols: results from a field 44 experiment. Atmos. Chem. Phys., 10, 5925–5942. 45
Rae, J. G. L., C. E. Johnson, N. Bellouin, O. Boucher, J. M. Haywood, and A. Jones, 2007: Sensitivity of 46 global sulphate aerosol production to changes in oxidant concentrations and climate. Journal of 47 Geophysical Research, 112, D10312. 48
Ram, K., M. M. Sarin, and P. Hegde, 2010: Long-term record of aerosol optical properties and chemical 49 composition from a high-altitude site (Manora Peak) in Central Himalaya. Atmos. Chem. Phys., 10, 50 11791-11803. 51
Raman, R. S., S. Ramachandran, and N. Rastogi, 2010: Source identification of ambient aerosols over an 52 urban region in western India. Journal of Environmental Monitoring, 12, 1330-1340. 53
Ramanathan, V., and G. Carmichael, 2008: Global and regional climate changes due to black carbon. Nature 54 Geoscience, 1, 221-227. 55
First Order Draft Chapter 7 IPCC WGI Fifth Assessment Report
Do Not Cite, Quote or Distribute 7-88 Total pages: 121
Ramaswamy, V., and Coauthors, 2001: Radiative Forcing of Climate Change. Climate Change 2001: The 1 Scientific Basis. Contribution of Working Group I to the Third Assessment Report of the 2 Intergovernmental Panel on Climate Change, Cambridge University Press. 3
Randall, D. A., 1989: Cloud parameterization for climate models: Status and prospects. Atmospheric 4 Research, 23, 345-362. 5
Randall, D. A., and Coauthors, 2007: Climate Models and Their Evaluation. Climate Change 2007: The 6 Physical Science Basis. Contribution of Working Group I to the Fourth Assessment Report of the 7 Intergovernmental Panel on Climate Change, Cambridge University Press. 8
Rap, A., P. Forster, J. Haywood, A. Jones, and O. Boucher, 2010a: Estimating the climate impact of linear 9 contrails using the UK Met Office climate model. Geophysical Research Letters, ARTN L20703, DOI 10 10.1029/2010GL045161. 11
Rap, A., P. Forster, A. Jones, O. Boucher, J. Haywood, N. Bellouin, and R. De Leon, 2010b: 12 Parameterization of contrails in the UK Met Office Climate Model. Journal of Geophysical Research-13 Atmospheres, 115, D10205. 14
Rasch, P. J., P. J. Crutzen, and D. B. Coleman, 2008a: Exploring the geoengineering of climate using 15 stratospheric sulfate aerosols: The role of particle size. Geophysical Research Letters, 35, L02809. 16
Rasch, P. J., C. C. Chen, and J. L. Latham, 2009: Geo-engineering by cloud seeding: influence on sea-ice 17 and the climate system. Environmental Research Letters, 4, 045112. 18
Rasch, P. J., and Coauthors, 2008b: An overview of geoengineering of climate using stratospheric sulphate 19 aerosols. Philosophical Transactions Royal Society London A, 366, 4007-4037. 20
Rastogi, N., and M. M. Sarin, 2005: Long-term characterization of ionic species in aerosols from urban and 21 high-altitude sites in western India: Role of mineral dust and anthropogenic sources. Atmospheric 22 Environment, 39, 5541-5554. 23
Rauber, R. M., and Coauthors, 2007: Rain in shallow cumulus over the ocean - The RICO campaign. 24 Bulletin of the American Meteorological Society, 88, 1912-1928. 25
Reddy, M. S., O. Boucher, Y. Balkanski, and M. Schulz, 2005: Aerosol optical depths and direct radiative 26 perturbations by species and source type. Geophysical Research Letters, 32. 27
Remer, L. A., and Coauthors, 2005: The MODIS aerosol algorithm, products, and validation. Journal of the 28 Atmospheric Sciences, 62, 947-973. 29
Rengarajan, R., M. M. Sarin, and A. K. Sudheer, 2007: Carbonaceous and inorganic species in atmospheric 30 aerosols during wintertime over urban and high-altitude sites in North India. J. Geophysical Research, 31 112. 32
Richter, J. H., and P. J. Rasch, 2008: Effects of convective momentum transport on the atmospheric 33 circulation in the community atmosphere model, version 3. Journal of Climate, 21, 1487-1499. 34
Ridgwell, A., J. Singarayer, A. Hetherington, and P. Valdes, 2009: Tackling regional climate change by leaf 35 albedo bio-geoengineering. Current Biology, 19, 146-150. 36
Riipinen, I., and Coauthors, 2011: Organic condensation: a vital link connecting aerosol formation to cloud 37 condensation nuclei (CCN) concentrations. Atmospheric Chemistry and Physics, 11, 3865-3878. 38
Ringer, M. A., and Coauthors, 2006: Global mean cloud feedbacks in idealized climate change experiments. 39 Geophysical Research Letters, 33, L07718. 40
Roberts, G. C., and Coauthors, 2010: Characterization of particle cloud droplet activity and composition in 41 the free troposphere and the boundary layer during INTEX-B. Atmospheric Chemistry and Physics, 42 10, 6627-6644. 43
Roberts, P., and J. Hallett, 1968: A LABORATORY STUDY OF ICE NUCLEATING PROPERTIES OF 44 SOME MINERAL PARTICULATES. Quarterly Journal of the Royal Meteorological Society, 94, 25-45 &. 46
Robinson, A., and Coauthors, 2007: Rethinking organic aerosols: Semivolatile emissions and photochemical 47 aging. Science, 1259-1262. 48
Robock, A., L. Oman, and G. Stenchikov, 2008: Regional climate responses to geoengineering with tropical 49 and Arctic SO2 injections. Journal of Geophysical Research, 113, D16101. 50
Rodriguez, S., X. Querol, A. Alastuey, and F. Plana, 2002: Sources and processes affecting levels and 51 composition of atmospheric aerosol in the western Mediterranean. Journal of Geophysical Research, 52 107, 4777. 53
Rodrıguez, S., X. Querol, A. Alastuey, M. M. Viana, M. Alarcon, E. Mantilla, and C. R. Ruiz, 2004: 54 Comparative PM10-PM2.5 source contribution study at rural, urban and industrial sites during PM 55 episodes in Eastern Spain. Sci. Total Environ., 328, 95-113. 56
Roe, J. H., and M. B. Baker, 2007: Why is climate sensitivity so unpredictable? Science, 318, 629-632. 57
First Order Draft Chapter 7 IPCC WGI Fifth Assessment Report
Do Not Cite, Quote or Distribute 7-89 Total pages: 121
Rohs, S., R. Spang, F. Rohrer, C. Schiller, and H. Vos, 2010: A correlation study of high‐altitude and 1
midaltitude clouds and galactic cosmic rays by MIPAS-Envisat. J. Geophys. Res., 115. 2 Romps, D. M., 2011: Response of tropical precipitation to global warming. Journal of the Atmospheric 3
Sciences, 68, 123-138. 4 Rondanelli, R., and R. S. Lindzen, 2010: Can thin cirrus clouds in the tropics provide a solution to the faint 5
young Sun paradox? Journal of Geophysical Research-Atmospheres, 115, 12. 6 Roosli, M., and Coauthors, 2001: Temporal and spatial variation of the chemical composition of PM10 at 7
urban and rural sites in the Basel area, Switzerland. Atmospheric Environment, 35, 3701-3713. 8 Rose, D., and Coauthors, 2011: Cloud condensation nuclei in polluted air and biomass burning smoke near 9
the mega-city Guangzhou, China -Part 2: Size-resolved aerosol chemical composition, diurnal cycles, 10 and externally mixed weakly CCN-active soot particles. Atmospheric Chemistry and Physics, 11, 11 2817-2836. 12
Rosenfeld, A., H. Akbari, J. Romm, and M. Pomerantz, 1998: Cool communities: strategies for heat island 13 mitigation and smog reduction. Energy and Buildings, 28, 51-62. 14
Rosenfeld, D., and W. L. Woodley, 2001: Pollution and clouds. Physics World, 14, 33-37. 15 Rosenfeld, D., Y. J. Kaufman, and I. Koren, 2006: Switching cloud cover and dynamical regimes from open 16
to closed Benard cells in response to the suppression of precipitation by aerosols. Atmospheric 17 Chemistry and Physics, 6, 2503-2511. 18
Rosenfeld, D., and Coauthors, 2008: Flood or drought: How do aerosols affect precipitation? Science, 321, 19 1309-1313. 20
Rotstayn, L. D., 1999: Indirect forcing by anthropogenic aerosols: A global climate model calculation of the 21 effective-radius and cloud-lifetime effects. Journal of Geophysical Research-Atmospheres, 104, 9369-22 9380. 23
Rotstayn, L. D., and J. E. Penner, 2001: Indirect aerosol forcing, quasi forcing, and climate response. Journal 24 of Climate, 14, 2960-2975. 25
Rotstayn, L. D., and Y. G. Liu, 2003: Sensitivity of the first indirect aerosol effect to an increase of cloud 26 droplet spectral dispersion with droplet number concentration. Journal of Climate, 16, 3476-3481. 27
——, 2005: A smaller global estimate of the second indirect aerosol effect. Geophysical Research Letters, 28 32. 29
——, 2009: Cloud droplet spectral dispersion and the indirect aerosol effect: Comparison of two treatments 30 in a GCM. Geophysical Research Letters, 36. 31
Rotstayn, L. D., and Coauthors, 2007: Have Australian rainfall and cloudiness increased due to the remote 32 effects of Asian anthropogenic aerosols? Journal of Geophysical Research-Atmospheres, 112. 33
Russell, M., and D. Allen, 2005: Predicting secondary organic aerosol formation rates in southeast Texas. 34 Journal of Geophysical Research-Atmospheres, ARTN D07S17, DOI 10.1029/2004JD004722. 35
Rypdal, K., N. Rive, T. K. Berntsen, Z. Klimont, T. K. Mideksa, G. Myhre, and R. B. Skeie, 2009: Costs and 36 global impacts of black carbon abatement strategies. Tellus, 61B, 625-641. 37
Sacks, W. J., B. I. Cook, N. Buenning, S. Levis, and J. H. Helkowski, 2009: Effects of global irrigation on 38 the near-surface climate. Climate Dynamics, 33, 159–175. 39
Safai, P. D., K. B. Budhavant, P. S. P. Rao, K. Ali, and A. Sinha, 2010: Source characterization for aerosol 40 constituents and changing roles of calcium and ammonium aerosols in the neutralization of aerosol 41 acidity at a semi-urban site in SW India. Atmospheric Research, 98, 78-88. 42
Sakaeda, N., R. Wood, and P. Rasch, 2011: Direct and semidirect aerosol effects of southern African 43 biomass burning aerosol. Journal of Geophysical Research-Atmospheres, 116. 44
Salam, A., U. Lohmann, and G. Lesins, 2007: Ice nucleation of ammonia gas exposed montmorillonite 45 mineral dust particles. Atmospheric Chemistry and Physics, 7, 3923-3931. 46
Salam, A., and Coauthors, 2006: Ice nucleation studies of mineral dust particles with a new continuous flow 47 diffusion chamber. Aerosol Science and Technology, 40, 134-143. 48
Salvador, P., B. Artınano, X. Querol, A. Alastuey, and M. Costoya, 2007: Characterisation of local and 49 external contributions of atmospheric particulate matter at a background coastal site. Atmospheric 50 Environment, 41, 1-17. 51
Salzmann, M., and Coauthors, 2010: Two-moment bulk stratiform cloud microphysics in the GFDL AM3 52 GCM: description, evaluation, and sensitivity tests. Atmospheric Chemistry and Physics, 8037-8064. 53
Sanchez-Lorenzo, A., J. Calbó, J. Martin‐Vide, A. Garcia‐Manuel, G. García‐Soriano, and C. Beck, 54
2008: Winter “weekend effect” in southern Europe and its connections with periodicities in 55
atmospheric dynamics. Geophys. Res. Lett., 35, L15711. 56
First Order Draft Chapter 7 IPCC WGI Fifth Assessment Report
Do Not Cite, Quote or Distribute 7-90 Total pages: 121
Sanderson, M., C. Jones, W. Collins, C. Johnson, and R. Derwent, 2003: Effect of climate change on 1 isoprene emissions and surface ozone levels. Geophysical Research Letters, 30, -. 2
Sassen, K., and G. C. Dodd, 1988: Homogeneous nucleation rate for highly supercooled cirrus cloud 3 droplets. Journal of the Atmospheric Sciences, 45, 1357-1369. 4
Sassen, K., P. J. DeMott, J. M. Prospero, and M. R. Poellot, 2003: Saharan dust storms and indirect aerosol 5 effects on clouds: CRYSTAL-FACE results. Geophysical Research Letters, 30. 6
Satheesh, S. K., and K. K. Moorthy, 2005: Radiative effects of natural aerosols: A review. Atmospheric 7 Environment, 39, 2089-2110. 8
Sato, T., H. Miura, M. Satoh, Y. Takayabu, and Y. Wang, 2009: Diurnal cycle of precipitation in the Tropics 9 simulated in a global cloud-resolving model. Journal of Climate, 22, 4809-4826. 10
Savic-Jovcic, V., and B. Stevens, 2008: The structure and mesoscale organization of precipitating 11 stratocumulus. Journal of the Atmospheric Sciences, 65, 1587-1605. 12
Sawant, A. A., K. Na, X. Zhu, and D. R. Cocker III, 2004: Chemical characterization of outdoor PM2.5 and 13 gas-phase compounds in Mira Loma, California. Atmospheric Environment, 38, 5517-5528. 14
Schaller, R. C., and N. Fukuta, 1979: Ice nucleation by aerosol particles - Experimental studies using a 15 wedge-shaped ice thermal-diffusion chamber. Journal of the Atmospheric Sciences, 36, 1788-1802. 16
Scheff, J., and D. Frierson, 2011: 21st-century multi-model subtropical precipitation declines are mostly 17 mid-latitude shifts. Journal of Climate, Submitted. 18
Schmidt, K. S., G. Feingold, P. Pilewskie, H. Jiang, O. Coddington, and M. Wendisch, 2009: Irradiance in 19 polluted cumulus fields: Measured and modeled cloud-aerosol effects. Geophysical Research Letters, 20 36. 21
Schreier, M., H. Mannstein, V. Eyring, and H. Bovensmann, 2007: Global ship track distribution and 22 radiative forcing from 1 year of AATSR data. Geophysical Research Letters, 34. 23
Schwarz, J., and Coauthors, 2008: Coatings and their enhancement of black carbon light absorption in the 24 tropical atmosphere. Journal of Geophysical Research-Atmospheres, ARTN D03203, DOI 25 10.1029/2007JD009042. 26
Schwarz, J. P., and Coauthors, 2010: Global-scale black carbon profiles observed in the remote atmosphere 27 and compared to models. Geophysical Research Letters, 37, L18812. 28
Schwarz, J. P., and Coauthors, 2006: Single-particle measurements of midlatitude black carbon and light-29 scattering aerosols from the boundary layer to the lower stratosphere. Journal of Geophysical 30 Research, 111, D16207. 31
Seifert, A., and B. Stevens, 2010: Microphysical scaling relations in a kinematic model of isolated shallow 32 cumulus clouds. Journal of the Atmospheric Sciences, 67, 1575-1590. 33
Seifert, A., C. Köhler, and K. D. Beheng, 2011: Aerosol-cloud-precipitation effects over Germany as 34 simulated by a convective-scale numerical weather prediction model. Atmos. Chem. Phys. Discuss., 35 11, 20203-20243. 36
Seifert, P., and Coauthors, 2010: Saharan dust and heterogeneous ice formation: Eleven years of cloud 37 observations at a central European EARLINET site. Journal of Geophysical Research-Atmospheres, 38 115. 39
Seitz, R., 2011: Bright water: hydrosols, water conservation and climate change. Climatic Change, 105, 365-40 381. 41
Sekiguchi, M., and Coauthors, 2003: A study of the direct and indirect effects of aerosols using global 42 satellite data sets of aerosol and cloud parameters. Journal of Geophysical Research-Atmospheres, 43 108. 44
Senior, C. A., and J. F. B. Mitchell, 1993: Carbon dioxide and climate: The impact of cloud 45 parameterization. Journal of Climate, 6, 393-418. 46
——, 2000: The time-dependence of climate sensitivity. Geophysical Research Letters, 27, 2685-2688. 47 Sesartic, A., U. Lohmann, and T. Storelvmo, 2011: Bacteria in the ECHAM5-HAM global climate model. 48
Atmospheric Chemistry Physics Discussion, 11, 1457-1488. 49 Sharon, T. M., and Coauthors, 2006: Aerosol and cloud microphysical characteristics of rifts and gradients in 50
maritime stratocumulus clouds. Journal of the Atmospheric Sciences, 63, 983-997. 51 Shaw, R. A., A. J. Durant, and Y. Mi, 2005: Heterogeneous surface crystallization observed in undercooled 52
water. Journal of Physical Chemistry B, 109, 9865-9868. 53 Shaw, S. B., A. A. Royem, and S. J. Riha, 2011: The relationship between extreme hourly precipitation and 54
surface temperature in different hydroclimatic regions of the United States. Journal of 55 Hydrometeorology, 12, 319-325. 56
First Order Draft Chapter 7 IPCC WGI Fifth Assessment Report
Do Not Cite, Quote or Distribute 7-91 Total pages: 121
Sherwood, S. C., W. Ingram, Y. Tsushima, M. Satoh, M. Roberts, P. L. Vidale, and P. A. O'Gorman, 2010: 1 Relative humidity changes in a warmer climate. Journal of Geophysical Research, 115, D09104. 2
Shilling, J. E., T. J. Fortin, and M. A. Tolbert, 2006: Depositional ice nucleation on crystalline organic and 3 inorganic solids. Journal of Geophysical Research-Atmospheres, 111. 4
Shindell, D., and G. Faluvegi, 2009: Climate response to regional radiative forcing during the twentieth 5 century. Nature Geoscience, 2, 294-300. 6
Shiraiwa, M., and Coauthors, 2008: Radiative impact of mixing state of black carbon aerosol in Asian 7 outflow. Journal of Geophysical Research, 113, D24210. 8
Shresth, A. B., C. P. Wake, J. E. Dibb, P. A. Mayewski, S. I. Whitlow, G. R. Carmichael, and M. Ferm, 9 2000: Seasonal variations in aerosol concentrations and compositions in the Nepal Himalaya. 10 Atmospheric Environment, 34, 3349-3363. 11
Shupe, M. D., and Coauthors, 2008: A focus on mixed-phase clouds. The status of ground-based 12 observational methods. Bulletin of the American Meteorological Society, 89, 1549-1562. 13
Siebesma, A. P., P. M. M. Soares, and J. Teixeira, 2007: A combined eddy-diffusivity mass-flux approach 14 for the convective boundary layer. Journal of the Atmospheric Sciences, 64, 1230-1248. 15
Siebesma, A. P., and Coauthors, 2009: Cloud-controlling factors. Clouds in the Perturbed Climate System: 16 Their Relationship to Energy Balance, Atmospheric Dynamics, and Precipitation, J. Heintzenberg, and 17 R. J. Charlson, Eds., MIT Press, 269-290. 18
Singh, H. B., W. H. Brune, J. H. Crawford, D. J. Jacob, and P. B. Russell, 2006: Overview of the summer 19 2004 Intercontinental Chemical Transport Experiment–North America (INTEX-A). J. Geophys. Res., 20 111. 21
Sipila, M., and Coauthors, 2010: The role of sulfuric acid in atmospheric nucleation. Science, 327, 1243-22 1246. 23
Slingo, A., 1990: Sensitivity of the Earth?s radiation budget to changes in low clouds. Nature, 343, 49-51. 24 Small, J. D., P. Y. Chuang, G. Feingold, and H. Jiang, 2009: Can aerosol decrease cloud lifetime? 25
Geophysical Research Letters, 36. 26 Smirnov, A., and Coauthors, 2011: Maritime aerosol network as a component of AERONET - first results 27
and comparison with global aerosol models and satellite retrievals. Atmospheric Measurement 28 Techniques, 4, 583-597. 29
Smith, J., and Coauthors, 2010: Observations of aminium salts in atmospheric nanoparticles and possible 30 climatic implications. Proceedings of the National Academy of Sciences of the United States of 31 America, 107, 6634-6639. 32
Snow-Kropla, E., J. Pierce, D. Westervelt, and W. Trivitayanurak, 2011: Cosmic rays, aerosol formation and 33 cloud-condensation nuclei: sensitivities to model uncertainties. Atmospheric Chemistry and Physics, 34 11, 4001-4013. 35
Soden, B. J., and I. M. Held, 2006: An assessment of climate feedbacks in coupled ocean-atmosphere 36 models. Journal of Climate, 19, 3354-3360. 37
Soden, B. J., and G. A. Vecchi, 2011: The vertical distribution of cloud feedback in coupled ocean-38 atmosphere models. Geophysical Research Letters, 38, L12704. 39
Song, X., and G. J. Zhang, 2011: Microphysics parameterization for convective clouds in a global climate 40 model: Description and single-column model tests. Journal of Geophysical Research, 116, D02201. 41
Souza, P. A. d., W. Z. d. Mello, L. MarianiRauda, and M. SellaSilvia, 2010: Caracterization of fine and 42 coarse particulate matter and composition of the water-soluble inorganic fraction in São José dos 43 Campos (SP). Quím. Nova, 33. 44
Spencer, R. W., and W. D. Braswell, 2008: Potential Biases in Feedback Diagnosis from Observational Data: 45 A Simple Model Demonstration. Journal of Climate, 21, 5624-5628. 46
Spencer, R. W., and W. D. Braswell, 2010: On the diagnosis of radiative feedback in the presence of 47 unknown radiative forcing. Journal of Geophysical Research-Atmospheres, 115. 48
Spracklen, D., K. Pringle, K. Carslaw, M. Chipperfield, and G. Mann, 2005a: A global off-line model of 49 size-resolved aerosol microphysics: II. Identification of key uncertainties. Atmospheric Chemistry and 50 Physics, 3233-3250. 51
——, 2005b: A global off-line model of size-resolved aerosol microphysics: I. Model development and 52 prediction of aerosol properties. Atmospheric Chemistry and Physics, 2227-2252. 53
Spracklen, D., K. Carslaw, M. Kulmala, V. Kerminen, G. Mann, and S. Sihto, 2006: The contribution of 54 boundary layer nucleation events to total particle concentrations on regional and global scales. 55 Atmospheric Chemistry and Physics, 6, 5631-5648. 56
First Order Draft Chapter 7 IPCC WGI Fifth Assessment Report
Do Not Cite, Quote or Distribute 7-92 Total pages: 121
Spracklen, D., and Coauthors, 2008: Contribution of particle formation to global cloud condensation nuclei 1 concentrations. Geophysical Research Letters, ARTN L06808, DOI 10.1029/2007GL033038. 2
Spracklen, D., and Coauthors, 2010: Explaining global surface aerosol number concentrations in terms of 3 primary emissions and particle formation. Atmospheric Chemistry and Physics, 4775-4793. 4
Spracklen, D. V., and Coauthors, 2011: Aerosol mass spectrometer constraint on the global secondary 5 organic aerosol budget. Atmos. Chem. Phys. Discuss., 11, 5699-5755. 6
Stan, C., and Coauthors, 2010: An ocean-atmosphere climate simulation with an embedded cloud resolving 7 model. Geophysical Research Letters, 37, L01702. 8
Stephens, G., and T. Ellis, 2008: Controls of global-mean precipitation increases in global warming GCM 9 experiments. Journal of Climate, 21, 6141-6155. 10
Stephens, G. L., and C. D. Kummerow, 2007: The remote sensing of clouds and precipitation from space: A 11 review. Journal of the Atmospheric Sciences, 64, 3742-3765. 12
Stephens, G. L., and Coauthors, 2002: The Cloudsat mission and the A-train - A new dimension of space-13 based observations of clouds and precipitation. Bulletin of the American Meteorological Society, 83, 14 1771-1790. 15
Stevens, B., and A. Seifert, 2008: Understanding macrophysical outcomes of microphysical choices in 16 simulations of shallow cumulus convection. Journal of the Meteorological Society of Japan, 86, 143-17 162. 18
Stevens, B., and G. Feingold, 2009: Untangling aerosol effects on clouds and precipitation in a buffered 19 system. Nature, 461, 607-613. 20
Stevens, B., and J.-L. Brenguier, 2009: Cloud-controlling factors: Low clouds. Clouds in the Perturbed 21 Climate System: Their Relationship to Energy Balance, Atmospheric Dynamics, and Precipitation, J. 22 Heintzenberg, and R. J. Charlson, Eds., MIT Press, 173-196. 23
Stevens, B., W. R. Cotton, G. Feingold, and C.-H. Moeng, 1998: Large-eddy simulations of strongly 24 precipitating, shallow, stratocumulus-topped boundary layers. Journal of the Atmospheric Sciences, 25 55, 3616-3638. 26
Stevens, B., and Coauthors, 2005: Pockets of open cells and drizzle in marine stratocumulus. Bulletin of the 27 American Meteorological Society, 86, 51-57. 28
Stier, P., J. Feichter, S. Kloster, E. Vignati, and J. Wilson, 2006a: Emission-induced nonlinearities in the 29 global aerosol system: Results from the ECHAM5-HAM aerosol-climate model. Journal of Climate, 30 19, 3845-3862. 31
Stier, P., J. H. Seinfeld, S. Kinne, J. Feichter, and O. Boucher, 2006b: Impact of nonabsorbing anthropogenic 32 aerosols on clear-sky atmospheric absorption. Journal of Geophysical Research, 111, D18201. 33
Stier, P., and Coauthors, 2005: The aerosol-climate model ECHAM5-HAM. Atmospheric Chemistry and 34 Physics, 1125-1156. 35
Stjern, C. W., 2011: Weekly cycles in precipitation and other meteorological variables in a polluted region of 36 Europe. Atmos. Chem. Phys., 11, 4095-4104. 37
Stone, E., J. Schauer, T. A. Quraishi, and A. Mahmood, 2010: Chemical characterization and source 38 apportionment of fine and coarse particulate matter in Lahore, Pakistan. Atmospheric Environment, 44, 39 1062-1070. 40
Stone, R. S., and Coauthors, 2008: Radiative impact of boreal smoke in the Arctic: Observed and modeled. 41 Journal of Geophysical Research-Atmospheres, 113. 42
Storelvmo, T., 2011: Uncertainties in aerosol direct and indirect effects attributed to uncertainties in 43 convective transport parametrizations. Atmospheric Research, in press. 44
Storelvmo, T., J. E. Kristjansson, and U. Lohmann, 2008a: Aerosol influence on mixed-phase clouds in 45 CAM-Oslo. Journal of the Atmospheric Sciences, 65, 3214-3230. 46
Storelvmo, T., U. Lohmann, and R. Bennartz, 2009: What governs the spread in shortwave forcings in the 47 transient IPCC AR4 models? Geophysical Research Letters, 36, L01806. 48
Storelvmo, T., C. Hoose, and P. Eriksson, 2011: Global modeling of mixed-phase clouds: The albedo and 49 lifetime effects of aerosols. Journal of Geophysical Research-Atmospheres, 116. 50
Storelvmo, T., J. E. Kristjansson, S. J. Ghan, A. Kirkevag, O. Seland, and T. Iversen, 2006: Predicting cloud 51 droplet number concentration in Community Atmosphere Model (CAM)-Oslo. Journal of Geophysical 52 Research-Atmospheres, 111. 53
Storelvmo, T., J. E. Kristjansson, U. Lohmann, T. Iversen, A. Kirkevag, and O. Seland, 2008b: Modeling of 54 the Wegener-Bergeron-Findeisen process-implications for aerosol indirect effects. Environmental 55 Research Letters, 3, 045001. 56
First Order Draft Chapter 7 IPCC WGI Fifth Assessment Report
Do Not Cite, Quote or Distribute 7-93 Total pages: 121
Stott, P. A., J. F. B. Mitchell, M. R. Allen, T. L. Delworth, J. M. Gregory, G. A. Meehl, and B. D. Santer, 1 2006: Observational constraints on past attributable warming and predictions of future global 2 warming. Journal of Climate, 19, 3055-3069. 3
Stramler, K., A. D. Del Genio, and W. B. Rossow, 2011: Synoptically driven Arctic winter states. Journal of 4 Climate, 24, 1747-1762. 5
Stratmann, F., O. Moehler, R. Shaw, and W. Heike, 2009: Laboratory cloud simulation: Capabilities and 6 future directions. Clouds in the Perturbed Climate System: Their Relationship to Energy Balance, 7 Atmospheric Dynamics, and Precipitation, J. Heintzenberg, and R. J. Charlson, Eds., MIT Press, 149-8 172. 9
Stuber, N., and P. Forster, 2007: The impact of diurnal variations of air traffic on contrail radiative forcing. 10 Atmospheric Chemistry and Physics, 3153-3162. 11
Sullivan, R. C., L. Minambres, P. J. DeMott, A. J. Prenni, C. M. Carrico, E. J. T. Levin, and S. M. 12 Kreidenweis, 2010a: Chemical processing does not always impair heterogeneous ice nucleation of 13 mineral dust particles. Geophysical Research Letters, 37, L24805. 14
Sullivan, R. C., and Coauthors, 2010b: Irreversible loss of ice nucleation active sites in mineral dust particles 15 caused by sulphuric acid condensation. Atmospheric Chemistry and Physics, 10, 11471-11487. 16
Sun, D. L., K. M. Lau, and M. Kafatos, 2008: Contrasting the 2007 and 2005 hurricane seasons: Evidence of 17 possible impacts of Saharan dry air and dust on tropical cyclone activity in the Atlantic basin. 18 Geophysical Research Letters, 35, L15405. 19
Sun, J. M., P. A. Ariya, H. G. Leighton, and M. K. Yau, 2010: Mystery of ice multiplication in warm-based 20 precipitating shallow cumulus clouds. Geophysical Research Letters, 37, L10802. 21
Suzuki, K., T. Nakajima, A. Numaguti, T. Takemura, K. Kawamoto, and A. Higurashi, 2004: A study of the 22 aerosol effect on a cloud field with simultaneous use of GCM modeling and satellite observation. 23 Journal of the Atmospheric Sciences, 61, 179-194. 24
Svensmark, H., and E. FriisChristensen, 1997: Variation of cosmic ray flux and global cloud coverage - A 25 missing link in solar-climate relationships. Journal of Atmospheric and Solar-Terrestrial Physics, 26 1225-1232. 27
Svensmark, H., T. Bondo, and J. Svensmark, 2009: Cosmic ray decreases affect atmospheric aerosols and 28 clouds. Geophysical Research Letters, ARTN L15101, DOI 10.1029/2009GL038429. 29
Takahashi, K., 2009: The global hydrological cycle and atmospheric shortwave absorption in climate models 30 under CO2 forcing. Journal of Climate, 22, 5667-5675. 31
Takemura, T., T. Nozawa, S. Emori, T. Y. Nakajima, and T. Nakajima, 2005: Simulation of climate response 32 to aerosol direct and indirect effects with aerosol transport-radiation model. Journal of Geophysical 33 Research, 110, D02202. 34
Tanré, D., M. Herman, and Y. J. Kaufman, 1996: Information on aerosol size distribution contained in solar 35 reflected spectral radiances. Journal of Geophysical Research-Atmospheres, 101, 19043-19060. 36
Tanré, D., Y. Kaufman, M. Herman, and S. Mattoo, 1997: Remote sensing of aerosol properties over oceans 37 using the MODIS/EOS spectral radiances. Journal of Geophysical Research-Atmospheres, 16971-38 16988. 39
Tanré, D., and Coauthors, 2011: Remote sensing of aerosols by using polarized, directional and spectral 40 measurements within the A-Train: the PARASOL mission. Atmospheric Measurement Techniques, 4, 41 1383-1395. 42
Tao, W.-K., R. J. Houze, and E. Smith, 2007: The fourth TRMM Latent Heating Workshop. Bull. Amer. 43 Meteor. Soc., 88, 1255-1259. 44
Tao, W.-K., and Coauthors, 2009: A Multiscale Modeling System: Developments, applications, and critical 45 issues. Bull Amer. Meteor. Soc., 90, 515-534. 46
Targino, A. C., and Coauthors, 2009: Influence of particle chemical composition on the phase of cold clouds 47 at a high-alpine site in Switzerland. Journal of Geophysical Research-Atmospheres, 114. 48
Tegen, I., M. Werner, S. Harrison, and K. Kohfeld, 2004: Relative importance of climate and land use in 49 determining present and future global soil dust emission. Geophysical Research Letters, 31, -. 50
Theodosi, C., U. Im, A. Bougiatioti, P. Zarmpas, O. Yenigun, and N. Mihalopoulos, 2010: Aerosol chemical 51 composition over Istanbul. Science of the Total Environment, 408, 2482-2491. 52
Thomas, M. A., and Coauthors, 2010: Quantification of DMS aerosol-cloud-climate interactions using the 53 ECHAM5-HAMMOZ model in a current climate scenario. Atmospheric Chemistry and Physics, 10, 54 7425-7438. 55
Tilmes, S., R. R. Garcia, E. D. Kinnison, A. Gettelman, and P. J. Rasch, 2009: Impact of geo-engineered 56 aerosols on troposphere and stratosphere. Journal of Geophysical Research, 114, D12305. 57
First Order Draft Chapter 7 IPCC WGI Fifth Assessment Report
Do Not Cite, Quote or Distribute 7-94 Total pages: 121
Tomita, H., H. Miura, S. Iga, T. Nasuno, and M. Satoh, 2005: A global cloud-resolving simulation: 1 Preliminary results from an aqua planet experiment. Geophysical Research Letters, -. 2
Tompkins, A. M., K. Gierens, and G. Radel, 2007: Ice supersaturation in the ECMWF integrated forecast 3 system. Quarterly Journal of the Royal Meteorological Society, 133, 53-63. 4
Torres, O., P. K. Bhartia, J. R. Herman, Z. Ahmad, and J. Gleason, 1998: Derivation of aerosol properties 5 from satellite measurements of backscattered ultraviolet radiation: Theoretical basis. Journal of 6 Geophysical Research, 103, 17099-17110. 7
Torres, O., P. K. Bhartia, J. R. Herman, A. Sinyuk, P. Ginoux, and B. Holben, 2002: A long-term record of 8 aerosol optical depth from TOMS observations and comparison to AERONET measurements. Journal 9 of the Atmospheric Sciences, 59, 398-413. 10
Trenberth, K. E., and A. Dai, 2007: Effects of Mount Pinatubo volcanic eruption on the hydrological cycle as 11 an analog of geoengineering. Geophysical Research Letters, 34, L15702. 12
Trenberth, K. E., and J. T. Fasullo, 2009: Global warming due to increasing absorbed solar radiation. 13 Geophysical Research Letters, 36, L07706. 14
——, 2010: Simulation of present-day and twenty-first-century energy budgets of the Southern Oceans. 15 Journal of Climate, 23, 440-454. 16
Tselioudis, G., and W. B. Rossow, 2006: Climate feedback implied by observed radiation and precipitation 17 changes with midlatitude storm strength and frequency. Geophysical Research Letters, 33, 5. 18
Tsigaridis, K., and M. Kanakidou, 2003: Global modelling of secondary organic aerosol in the troposphere: a 19 sensitivity analysis. Atmospheric Chemistry and Physics, 1849-1869. 20
——, 2007: Secondary organic aerosol importance in the future atmosphere. Atmospheric Environment, 21 4682-4692. 22
Tsushima, Y., and Coauthors, 2006: Importance of the mixed-phase cloud distribution in the control 23 climatefor assessing the response of clouds to carbon dioxide increase:a multi-model study. Climate 24 Dynamics, 27, 113–126. 25
Twohy, C. H., J. A. Coakley, Jr., and W. R. Tahnk, 2009: Effect of changes in relative humidity on aerosol 26 scattering near clouds. Journal of Geophysical Research-Atmospheres, 114. 27
Twohy, C. H., and Coauthors, 2005: Evaluation of the aerosol indirect effect in marine stratocumulus clouds: 28 Droplet number, size, liquid water path, and radiative impact. J. Geophys. Res., 110, D08203. 29
Twohy, C. H., and Coauthors, 2010: Relationships of biomass-burning aerosols to ice in orographic wave 30 clouds. Journal of the Atmospheric Sciences, 67, 2437-2450. 31
Twomey, S., 1977: Influence of pollution on shortwave albedo of clouds. Journal of the Atmospheric 32 Sciences, 34, 1149-1152. 33
Udelhofen, P., and R. Cess, 2001: Cloud cover variations over the United States: An influence of cosmic 34 rays or solar variability? Geophysical Research Letters, 28, 2617-2620. 35
Ulbrich, I., M. Canagaratna, Q. Zhang, D. Worsnop, and J. Jimenez, 2009: Interpretation of organic 36 components from Positive Matrix Factorization of aerosol mass spectrometric data. Atmospheric 37 Chemistry and Physics, 2891-2918. 38
Unger, N., S. Menon, D. M. Koch, and D. T. Shindell, 2009: Impacts of aerosol-cloud interactions on past 39 and future changes in tropospheric composition. Atmospheric Chemistry and Physics, 9, 4115-4129. 40
Unger, N., D. Shindell, D. Koch, M. Amann, J. Cofala, and D. Streets, 2006: Influences of man-made 41 emissions and climate changes on tropospheric ozone, methane, and sulfate at 2030 from a broad 42 range of possible futures. Journal of Geophysical Research-Atmospheres, 111, -. 43
Usoskin, I., and G. Kovaltsov, 2008: Cosmic rays and climate of the Earth: Possible connection. Comptes 44 Rendus Geoscience, 340, 441-450. 45
Vali, G., 2008: Repeatability and randomness in heterogeneous freezing nucleation. Atmospheric Chemistry 46 and Physics, 8, 5017-5031. 47
vanZanten, M. C., B. Stevens, G. Vali, and D. H. Lenschow, 2005: Observations of drizzle in nocturnal 48 marine stratocumulus. Journal of the Atmospheric Sciences, 62, 88-106. 49
vanZanten, M. C., and Coauthors, 2011: Controls on precipitation and cloudiness in simulations of trade-50 wind cumulus as observed during RICO. Journal of Advances in Modeling Earth Systems, 3, 13 pp. 51
Várnai, T., and A. Marshak, 2009: MODIS observations of enhanced clear sky reflectance near clouds. 52 Geophysical Research Letters, 36. 53
Vavrus, S., M. M. Holland, and D. A. Bailey, 2011: Changes in Arctic clouds during intervals of rapid sea 54 ice loss. Climate Dynamics, 36, 1475-1489. 55
First Order Draft Chapter 7 IPCC WGI Fifth Assessment Report
Do Not Cite, Quote or Distribute 7-95 Total pages: 121
Vavrus, S., D. Waliser, A. Schweiger, and J. Francis, 2009: Simulations of 20th and 21st century Arctic 1 cloud amount in the global climate models assessed in the IPCC AR4. Climate Dynamics, 33, 1099-2 1115. 3
Verlinde, J., and Coauthors, 2007: The mixed-phase Arctic cloud experiment. Bulletin of the American 4 Meteorological Society, 88, 205-221. 5
Viana, M., W. Maenhaut, X. Chi, X. Querol, and A. lastuey, 2007: Comparative chemical mass closure of 6 fine and coarse aerosols at two sites in South and West Europe: implications for EU air pollution 7 policies. Atmospheric Environment, 41, 315-326. 8
Viana, M., X. Chi, W. Maenhaut, X. Querol, A. Alastuey, P. Mikuska, and Z. Vecera, 2006: Organic and 9 elemental carbon concentrations during summer and winter sampling campaigns in Barcelona, Spain. 10 Atmospheric Environment, 40, 2180-2193. 11
Viana, M., and Coauthors, 2008: Characterising exposure to PM aerosols for an epidemiological study. 12 Atmos. Environ., 42, 1552-1568. 13
Vignati, E., M. Karl, M. Krol, J. Wilson, P. Stier, and F. Cavalli, 2010: Sources of uncertainties in modelling 14 black carbon at the global scale. Atmospheric Chemistry and Physics, 2595-2611. 15
Vlahos, P., and E. Monahan, 2009: A generalized model for the air-sea transfer of dimethyl sulfide at high 16 wind speeds. Geophysical Research Letters, ARTN L21605, DOI 10.1029/2009GL040695. 17
Vogelmann, A. M., T. P. Ackerman, and R. P. Turco, 1992: Enhancements in biologically effective 18 ultraviolet radiation following volcanic eruptions. Nature, 359, 47-49. 19
Volkamer, R., and Coauthors, 2006: Secondary organic aerosol formation from anthropogenic air pollution: 20 Rapid and higher than expected. Geophysical Research Letters, ARTN L17811, DOI 21 10.1029/2006GL026899. 22
Volodin, E. M., 2008: Relation between temperature sensitivity to doubled carbon dioxide and the 23 distribution of clouds in current climate models. Izvestiya Atmospheric and Oceanic Physics, 44, 288-24 299. 25
von Blohn, N., S. K. Mitra, K. Diehl, and S. Borrmann, 2005: The ice nucleating ability of pollen: Part III: 26 New laboratory studies in immersion and contact freezing modes including more pollen types. 27 Atmospheric Research, 78, 182-189. 28
Wagner, R., O. Mohler, H. Saathoff, M. Schnaiter, and T. Leisner, 2010: High variability of the 29 heterogeneous ice nucleation potential of oxalic acid dihydrate and sodium oxalate. Atmospheric 30 Chemistry and Physics, 10, 7617-7641. 31
——, 2011: New cloud chamber experiments on the heterogeneous ice nucleation ability of oxalic acid in 32 the immersion mode. Atmospheric Chemistry and Physics, 11, 2083-2110. 33
Wang, B. B., and D. A. Knopf, 2011: Heterogeneous ice nucleation on particles composed of humic-like 34 substances impacted by O(3). Journal of Geophysical Research-Atmospheres, 116. 35
Wang, G., H. Wang, Y. Yu, S. Gao, J. Feng, S. Gao, and L. Wang, 2003: Chemical characterization of 36 water-soluble components of PM10 and PM2.5 atmospheric aerosols in five locations of Nanjing, 37 China. Atmospheric Environment, 37, 2893-2902. 38
Wang, H., and D. Shooter, 2001: Water soluble ions of atmospheric aerosols in three NewZealand cities: 39 seasonal changes and sources. Atmospheric Environment, 35. 40
Wang, H., and G. Feingold, 2009: Modeling mesoscale cellular structures and drizzle in marine 41 stratocumulus. Part II: The microphysics and dynamics of the boundary region between open and 42 closed cells. Journal of the Atmospheric Sciences, 66, 3257-3275. 43
Wang, H., K. Kawamuraa, and D. Shooter, 2005a: Carbonaceous and ionic components in wintertime 44 atmospheric aerosols from two New Zealand cities: Implications for solid fuel combustion. 45 Atmospheric Environment, 39, 5865–5875. 46
Wang, H., P. J. Rasch, and G. Feingold, 2011a: Manipulating marine stratocumulus cloud amount and 47 albedo: a process-modelling study of aerosol-cloud-precipitation interactions in response to injection 48 of cloud condensation nuclei. Atmos. Chem. Phys., 11, 4237-4249. 49
Wang, H., G. Feingold, R. Wood, and J. Kazil, 2010a: Modelling microphysical and meteorological controls 50 on precipitation and cloud cellular structures in Southeast Pacific stratocumulus. Atmospheric 51 Chemistry and Physics, 10, 6347-6362. 52
Wang, L., A. Khalizov, J. Zheng, W. Xu, Y. Ma, V. Lal, and R. Zhang, 2010b: Atmospheric nanoparticles 53 formed from heterogeneous reactions of organics. Nature Geoscience, 3, 238-242. 54
Wang, M., and J. Penner, 2009: Aerosol indirect forcing in a global model with particle nucleation. 55 Atmospheric Chemistry and Physics, 9, 239-260. 56
First Order Draft Chapter 7 IPCC WGI Fifth Assessment Report
Do Not Cite, Quote or Distribute 7-96 Total pages: 121
Wang, M., J. Penner, and X. Liu, 2009: Coupled IMPACT aerosol and NCAR CAM3 model: Evaluation of 1 predicted aerosol number and size distribution. Journal of Geophysical Research-Atmospheres, ARTN 2 D06302, DOI 10.1029/2008JD010459. 3
Wang, M., and Coauthors, 2011b: Aerosol indirect effects in a multi-scale aerosol-climate model PNNL-4 MMF. Atmospheric Chemistry and Physics, 11, 5431-5455. 5
Wang, Y., G. Zhuang, A. Tang, H. Yuan, Y. Sun, S. Chen, and A. Zheng, 2005b: The ion chemistry and the 6 source of PM 2.5 aerosol in Beijing. Atmospheric Environment, 39, 3771-3784. 7
Wang, Y., and Coauthors, 2006: The ion chemistry, seasonal cycle, and sources of PM2.5 and TSP aerosol in 8 Shanghai. Atmospheric Environment, 40, 2935-2952. 9
Waquet, F., J. Riedi, L. Labonnote, P. Goloub, B. Cairns, J. Deuzé, and D. Tanré, 2009: Aerosol Remote 10 Sensing over Clouds Using A-Train Observations. Journal of the Atmospheric Sciences, 66, 2468-11 2480. 12
Warneke, C., and Coauthors, 2009: Biomass burning in Siberia and Kazakhstan as an important source for 13 haze over the Alaskan Arctic in April 2008. Geophysical Research Letters, ARTN L02813, DOI 14 10.1029/2008GL036194. 15
Warneke, C., and Coauthors, 2010: An important contribution to springtime Arctic aerosol from biomass 16 burning in Russia. Geophysical Research Letters, ARTN L01801, DOI 10.1029/2009GL041816. 17
Webb, M., F. H. Lambert, and J. Gregory, 2012: Origins of differences in climate sensitivity, forcing and 18 feedback in climate models., Manuscript submitted to Climate Dynamics, 2 November 2011. ed. 19
Weinstein, J. P., S. R. Hedges, and S. Kimbrough, 2010: Characterization and aerosol mass balance of 20 PM2.5 and PM10 collected in Conakry, Guinea during the 2004 Harmattan period. Chemosphere, 78, 21 980–988. 22
Welti, A., F. Lüönd, O. Stetzer, and U. Lohmann, 2009: Influence of particle size on the ice nucleating 23 ability of mineral dusts. Atmospheric Chemistry and Physics, 9, 6705-6715. 24
Wen, G., A. Marshak, R. F. Cahalan, L. A. Remer, and R. G. Kleidman, 2007: 3-D aerosol-cloud radiative 25 interaction observed in collocated MODIS and ASTER images of cumulus cloud fields. Journal of 26 Geophysical Research-Atmospheres, 112. 27
Wetherald, R. T., and S. Manabe, 1980: Cloud cover and climate sensitivity. Journal of the Atmospheric 28 Sciences, 37, 1485-1510. 29
Wex, H., G. McFiggans, S. Henning, and F. Stratmann, 2010: Influence of the external mixing state of 30 atmospheric aerosol on derived CCN number concentrations. Geophysical Research Letters, 37, -. 31
Wexler, A. S., and S. L. Clegg, 2002: Atmospheric aerosol models for systems including the ions H+, NH4+, 32
Na+, SO42-, NO3
-, Cl-, Br-, and H2O. Journal of Geophysical Research, 107, 4207. 33 Whitlock, C., D. Bartlett, and E. Gurganus, 1982: Sea foam reflectance and influence on optimum 34
wavelength for remote-sensing of ocean aerosols. Geophysical Research Letters, 9, 719-722. 35 Wilcox, E. M., 2010: Stratocumulus cloud thickening beneath layers of absorbing smoke aerosol. 36
Atmospheric Chemistry and Physics, 10, 11769-11777. 37 Wild, M., and B. Liepert, 2010: The Earth radiation balance as driver of the global hydrological cycle. 38
Environ. Res. Lett., 5, 025203. 39 Williams, K. D., and G. Tselioudis, 2007: GCM intercomparison of global cloud regimes: present-day 40
evaluation and climate change response. Climate Dynamics, 29, 231-250. 41 Williams, K. D., and M. J. Webb, 2009: A quantitative performance assessment of cloud regimes in climate 42
models. Climate Dynamics, 33, 141-157. 43 Williams, K. D., A. Jones, D. L. Roberts, C. A. Senior, and M. J. Woodage, 2001: The response of the 44
climate system to the indirect effects of anthropogenic sulfate aerosol. Climate Dynamics, 17, 845-45 856. 46
Williams, K. D., and Coauthors, 2006: Evaluation of a component of the cloud response to climate change in 47 an intercomparison of climate models. Climate Dynamics, 26, 145-165. 48
Winker, D. M., and Coauthors, 2009: Overview of the CALIPSO mission and CALIOP data processing 49 algorithms. Journal of Atmospheric and Oceanic Technology, 26, 2310-2323. 50
Wise, M. E., K. J. Baustian, and M. A. Tolbert, 2009: Laboratory studies of ice formation pathways from 51 ammonium sulfate particles. Atmospheric Chemistry and Physics, 9, 1639-1646. 52
Wise, M. E., K. J. Baustian, and M. A. Tolbert, 2010: Internally mixed sulfate and organic particles as 53 potential ice nuclei in the tropical tropopause region. Proceedings of the National Academy of 54 Sciences of the United States of America, 107, 6693-6698. 55
First Order Draft Chapter 7 IPCC WGI Fifth Assessment Report
Do Not Cite, Quote or Distribute 7-97 Total pages: 121
Wolters, E. L. A., H. M. Deneke, B. van den Hurk, J. F. Meirink, and R. A. Roebeling, 2010: Broken and 1 inhomogeneous cloud impact on satellite cloud particle effective radius and cloud-phase retrievals. 2 Journal of Geophysical Research-Atmospheres, 115, 14. 3
Wong, S., and A. E. Dessler, 2005: Suppression of deep convection over the tropical North Atlantic by the 4 Saharan Air Layer. Geophysical Research Letters, 32, L09808. 5
Wong, S., A. E. Dessler, N. M. Mahowald, P. Yang, and Q. Feng, 2009: Maintenance of lower tropospheric 6 temperature inversion in the Saharan Air Layer by dust and dry anomaly. Journal of Climate, 22, 7 5149-5162. 8
Wood, R., 2005: Drizzle in stratiform boundary layer clouds. Part II: Microphysical aspects. Journal of the 9 Atmospheric Sciences, 62, 3034-3050. 10
Wood, R., 2007: Cancellation of aerosol indirect effects in marine stratocumulus through cloud thinning. 11 Journal of the Atmospheric Sciences, 64, 2657-2669. 12
Wood, R., and C. S. Bretherton, 2006: On the relationship between stratiform low cloud cover and lower-13 tropospheric stability. Journal of Climate, 19, 6425-6432. 14
Wood, R., and Coauthors, 2011: The VAMOS Ocean-Cloud-Atmosphere-Land Study Regional Experiment 15 (VOCALS-REx): goals, platforms, and field operations. Atmospheric Chemistry and Physics, 11, 627-16 654. 17
Woodhouse, M., G. Mann, K. Carslaw, and O. Boucher, 2008: New Directions: The impact of oceanic iron 18 fertilisation on cloud condensation nuclei. Atmospheric Environment, 5728-5730. 19
Woodhouse, M., K. Carslaw, G. Mann, S. Vallina, M. Vogt, P. Halloran, and O. Boucher, 2010: Low 20 sensitivity of cloud condensation nuclei to changes in the sea-air flux of dimethyl-sulphide. 21 Atmospheric Chemistry and Physics, 7545-7559. 22
Woodward, S., D. Roberts, and R. Betts, 2005: A simulation of the effect of climate change-induced 23 desertification on mineral dust aerosol. Geophysical Research Letters, ARTN L18810, DOI 24 10.1029/2005GL023482. 25
Wyant, M. C., C. S. Bretherton, and P. N. Blossey, 2009: Subtropical low cloud response to a warmer 26 climate in a superparameterized climate model: Part I, Regime sorting and physical mechanisms. J. 27 Adv. Modeling Earth Syst., 1, 7. 28
Wyant, M. C., C. S. Bretherton, P. N. Blossey, and M. Khairoutdinov, 2011: Fast cloud adjustment to 29 increasing CO2 in a superparameterized climate model. J. Adv. Model. Earth Systems, in press. 30
Wyant, M. C., and Coauthors, 2006: A comparison of low-latitude cloud properties and their response to 31 climate change in three AGCMs sorted into regimes using mid-tropospheric vertical velocity. Climate 32 Dynamics, 27, 261-279. 33
Xiao, H.-Y., and C.-Q. Liu, 2004: Chemical characteristics of water-soluble components in TSP over 34 Guiyang, SW China, 2003. Atmospheric Environment, 38, 6297–6306. 35
Xu, K. M., A. N. Cheng, and M. H. Zhang, 2010: Cloud-resolving simulation of low-cloud feedback to an 36 increase in sea surface temperature. Journal of the Atmospheric Sciences, 67, 730-748. 37
Xue, H., G. Feingold, and B. Stevens, 2008: Aerosol effects on clouds, precipitation, and the organization of 38 shallow cumulus convection. Journal of the Atmospheric Sciences, 65, 392-406. 39
Yankofsky, S. A., Z. Levin, T. Bertold, and N. Sandlerman, 1981: Some basic characteristics of bacterial 40 freezing nuclei. Journal of Applied Meteorology, 20, 1013-1019. 41
Yao, X., and Coauthors, 2002: The water-soluble ionic composition of PM2.5 in Shanghai and Beijing, 42 China. Atmospheric Environment, 36, 4223-4234. 43
Ye, B., and Coauthors, 2003: Concentration and chemical composition of PM2. 5 in Shanghai for a 1-year 44 period. Atmospheric Environment, 37, 499-510. 45
Yin, J., and R. M. Harrison, 2008: Pragmatic mass closure study for PM1.0, PM2.5 and PM10 at roadside, 46 urban background and rural sites. Atmos. Environ., 42, 980-988. 47
Yin, J. H., 2005: A consistent poleward shift of the storm tracks in simulations of 21st century climate. 48 Geophysical Research Letters, 32, 4. 49
Yokohata, T., M. J. Webb, M. Collins, K. D. Williams, M. Yoshimori, J. C. Hargreaves, and J. D. Annan, 50 2010: Structural similarities and differences in climate responses to CO2 increase between two 51 perturbed physics ensembles. Journal of Climate, 23, 1392-1410. 52
Yokohata, T., and Coauthors, 2008: Comparison of equilibrium and transient responses to CO2 increase in 53 eight state-of-the-art climate models. Tellus, 60A, 946-961. 54
Yoshimori, M., and A. J. Broccoli, 2008: Equilibrium response of an atmosphere-mixed layer ocean model 55 to different radiative forcing agents: Global and zonal mean response. Journal of Climate, 21, 4399-56 4423. 57
First Order Draft Chapter 7 IPCC WGI Fifth Assessment Report
Do Not Cite, Quote or Distribute 7-98 Total pages: 121
Yoshimori, M., T. Yokohata, and A. Abe-Ouchi, 2009: A comparison of climate feedback strength between 1 CO2 doubling and LGM experiments. Journal of Climate, 22, 3374-3395. 2
Young, I. R., S. Zieger, and A. V. Babanin, 2011: Global trends in wind speed and wave height. Science, 3 332, 451-455. 4
Yttri, K. E., 2007: Concentrations of particulate matter (PM10, PM2.5) in Norway. Annual and seasonal 5 trends and spatial variabilityAnnex A, EMEP Particulate Matter Assessment Report, Part B, report 6 EMEP/CCC-Report 8/2007, 292-307, ref. O-7726. 7
Yu, F., 2010: Ion-mediated nucleation in the atmosphere: Key controlling parameters, implications, and 8 look-up table. Journal of Geophysical Research-Atmospheres, ARTN D03206, DOI 9 10.1029/2009JD012630. 10
Yu, F., and G. Luo, 2009: Simulation of particle size distribution with a global aerosol model: contribution 11 of nucleation to aerosol and CCN number concentrations. Atmospheric Chemistry and Physics, 7691-12 7710. 13
Yu, F., and Coauthors, 2010a: Spatial distributions of particle number concentrations in the global 14 troposphere: Simulations, observations, and implications for nucleation mechanisms. Journal of 15 Geophysical Research-Atmospheres, ARTN D17205, DOI 10.1029/2009JD013473. 16
Yu, H., M. Chin, D. Winker, A. Omar, Z. Liu, C. Kittaka, and T. Diehl, 2010b: Global view of aerosol 17 vertical distributions from CALIPSO lidar measurements and GOCART simulations: Regional and 18 seasonal variations. Journal of Geophysical Research-Atmospheres, ARTN D00H30, DOI 19 10.1029/2009JD013364-. 20
Yu, H., and Coauthors, 2006: A review of measurement-based assessments of the aerosol direct radiative 21 effect and forcing. Atmospheric Chemistry and Physics, 613-666. 22
Yuan, T., L. A. Remer, and H. Yu, 2011: Microphysical, macrophysical and radiative signatures of volcanic 23 aerosols in trade wind cumulus observed by the A-Train. Atmos. Chem. Phys., 11, 7119-7132. 24
Zarzycki, C. M., and T. C. Bond, 2010: How much can the vertical distribution of black carbon affect its 25 global direct radiative forcing? Geophys. Res. Lett., 37, L20807. 26
Zaveri, R. A., R. C. Easter, J. D. Fast, and L. K. Peters, 2008: Model for Simulating Aerosol Interactions and 27 Chemistry (MOSAIC). Journal of Geophysical Research, 113, D13204. 28
Zelinka, M. D., and D. L. Hartmann, 2010: Why is longwave cloud feedback positive? Journal of 29 Geophysical Research, 115, D16117. 30
Zelinka, M. D., S. A. Klein, and D. L. Hartmann, 2011a: Computing and partitioning cloud feedbacks using 31 cloud property histograms. Part I: Cloud radiative kernels. J. Climate, in press. 32
——, 2011b: Computing and partitioning cloud feedbacks using cloud property histograms. Part II: 33 Attribution to changes in cloud amount, altitude, and optical depth. Journal of Climate, in press. 34
Zhang, G. J., A. M. Vogelmann, M. P. Jensen, W. D. Collins, and E. P. Luke, 2010a: Relating satellite-35 observed cloud properties from MODIS to meteorological conditions for marine boundary layer 36 clouds. Journal of Climate, 23, 1374-1391. 37
Zhang, K., H. Wan, B. Wang, M. Zhang, J. Feichter, and X. Liu, 2010b: Tropospheric aerosol size 38 distributions simulated by three online global aerosol models using the M7 microphysics module. 39 Atmospheric Chemistry and Physics, 10, 6409-6434. 40
Zhang, M. H., and C. Bretherton, 2008: Mechanisms of low cloud-climate feedback in idealized single-41 column simulations with the Community Atmospheric Model, version 3 (CAM3). Journal of Climate, 42 21, 4859-4878. 43
Zhang, Q., D. R. Worsnop, M. R. Canagaratna, and J. L. Jimenez, 2005a: Hydrocarbon-like and oxygenated 44 organic aerosols in Pittsburgh: insights into sources and processes of organic aerosols. Atmospheric 45 Chemistry and Physics, 5, 3289-3311. 46
Zhang, Q., M. R. Alfarra, D. R. Worsnop, J. D. Allan, H. Coe, M. R. Canagaratna, and J. L. Jimenez, 2005b: 47 Deconvolution and quantification of hydrocarbon-like and oxygenated organic aerosols based on 48 aerosol mass spectrometry. Environmental Science and Technology, 39, 4938-4952. 49
Zhang, Q., and Coauthors, 2007: Ubiquity and dominance of oxygenated species in organic aerosols in 50 anthropogenically-influenced Northern Hemisphere midlatitudes. Geophysical Research Letters, 51 ARTN L13801, DOI 10.1029/2007GL029979. 52
Zhang, X. Y., R. Arimoto, Z. S. An, J. J. Cao, and D. Wang, 2001: Atmospheric dust aerosol over the 53 Tibetian Plateau. Journal of Geophysical Research, 106, 18471-18476. 54
Zhang, X. Y., Y. Q. Wang, X. C. Zhang, W. Guo, and S. L. Gong, 2008: Carbonaceous aerosol composition 55 over various regions of China during 2006. J. Geophys. Res, 113, D14111. 56
First Order Draft Chapter 7 IPCC WGI Fifth Assessment Report
Do Not Cite, Quote or Distribute 7-99 Total pages: 121
Zhang, X. Y., J. J. Cao, L. M. Li, R. Arimoto, Y. Cheng, B. Huebert, and D. Wang, 2002: Characterization 1 of atmospheric aerosol over Xian in the south margin of the loess plateau, China. Atmospheric 2 Environment, 36, 4189-4199. 3
Zhang, X. Y., Y. Q. Wang, T. Niu, X. C. Zhang, S. L. Gong, Y. M. Zhang, and J. Y. Sun, 2011a: 4 Atmospheric aerosols in China: spatial/temporal variability, chemical signature, regional haze 5 distribution and comparisons with global aerosols. Atmos. Chem. Phys. Discuss., 11, 26571-26615. 6
Zhang, Y., and Coauthors, 2004: Development and application of the Model of Aerosol Dynamics, Reaction, 7 ionization, and Dissolution (MADRID). Journal of Geophysical Research, 109, D01202. 8
Zhang, Y. M., X. Y. Zhang, J. Y. Sun, W. L. Lin, S. L. Gong, X. J. Shen, and S. Yang, 2011b: 9 Characterization of new particle and secondary aerosol formation during summertime in Beijing, 10 China. Tellus, 63B, 382-394. 11
Zhao, T. L., S. L. Gong, X. Y. Zhang, A. A. Mawgoud, and Y. P. Shao, 2006: An assessment of dust 12 emission schemes in modeling east Asian dust storms. Journal of Geophysical Research, 111, 13 D05S90. 14
Zhao, T. X. P., H. B. Yu, I. Laszlo, M. Chin, and W. C. Conant, 2008: Derivation of component aerosol 15 direct radiative forcing at the top of atmosphere for clear-sky oceans. Journal of Quantitative 16 Spectroscopy & Radiative Transfer, 109, 1162-1186. 17
Zhuang, B., L. Liu, F. Shen, T. Wang, and Y. Han, 2010: Semidirect radiative forcing of internal mixed 18 black carbon cloud droplet and its regional climatic effect over China. Journal of Geophysical 19 Research-Atmospheres, 115, -. 20
Zimmermann, F., S. Weinbruch, L. Schutz, H. Hofmann, M. Ebert, K. Kandler, and A. Worringen, 2008: Ice 21 nucleation properties of the most abundant mineral dust phases. Journal of Geophysical Research-22 Atmospheres, 113. 23
Zobrist, B., T. Koop, B. P. Luo, C. Marcolli, and T. Peter, 2007: Heterogeneous ice nucleation rate 24 coefficient of water droplets coated by a nonadecanol monolayer. Journal of Physical Chemistry C, 25 111, 2149-2155. 26
Zobrist, B., and Coauthors, 2006: Oxalic acid as a heterogeneous ice nucleus in the upper troposphere and its 27 indirect aerosol effect. Atmospheric Chemistry and Physics, 6, 3115-3129. 28
Zuberi, B., A. K. Bertram, C. A. Cassa, L. T. Molina, and M. J. Molina, 2002: Heterogeneous nucleation of 29 ice in (NH4)2SO4-H2O particles with mineral dust immersions. Geophysical Research Letters, 29. 30
Zubler, E. M., U. Lohmann, D. Lüthi, C. Schär, and A. Muhlbauer, 2011: Statistical analysis of aerosol 31 effects on simulated mixed-phase clouds and precipitation in the Alps. J. Atmos. Sci., 68, 1474-1492. 32
Zuidema, P., H. Xue, and G. Feingold, 2008: Shortwave radiative impacts from aerosol effects on marine 33 shallow cumuli. Journal of the Atmospheric Sciences, 65, 1979-1990. 34
35 36
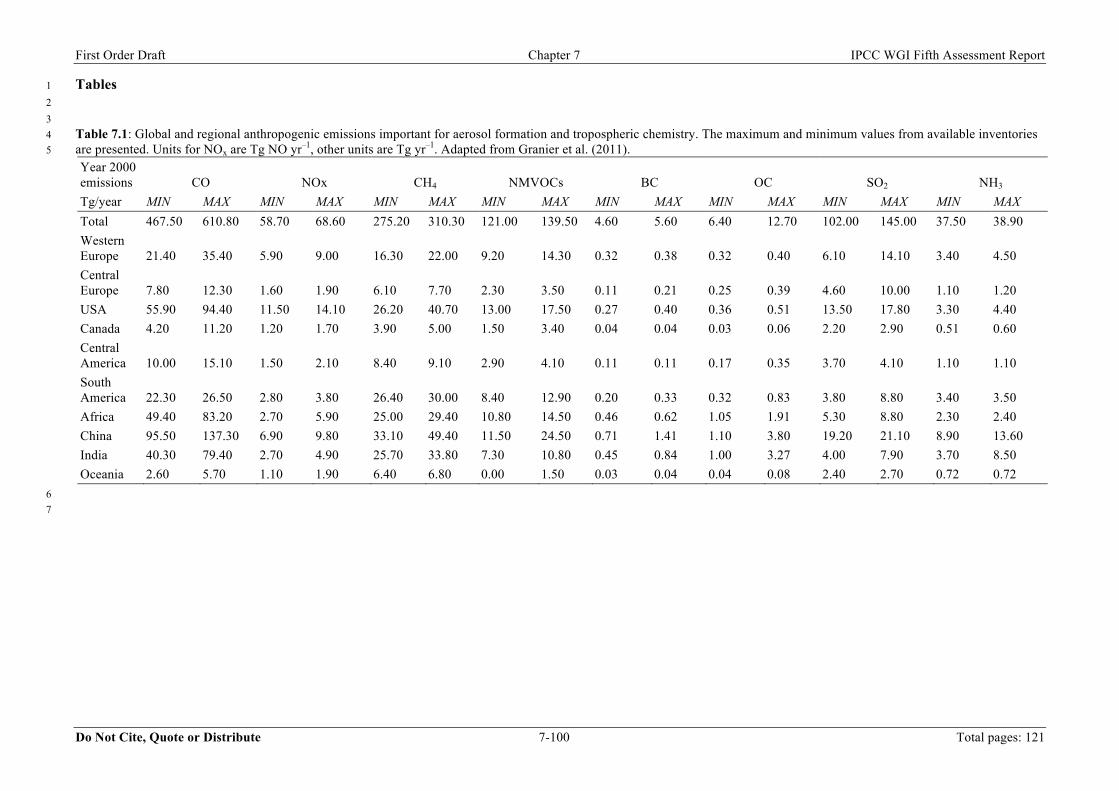
First Order Draft Chapter 7 IPCC WGI Fifth Assessment Report
Do Not Cite, Quote or Distribute 7-100 Total pages: 121
Tables 1 2 3 Table 7.1: Global and regional anthropogenic emissions important for aerosol formation and tropospheric chemistry. The maximum and minimum values from available inventories 4 are presented. Units for NOx are Tg NO yr–1, other units are Tg yr–1. Adapted from Granier et al. (2011). 5
Year 2000 emissions CO NOx CH4 NMVOCs BC OC SO2 NH3 Tg/year MIN MAX MIN MAX MIN MAX MIN MAX MIN MAX MIN MAX MIN MAX MIN MAX Total 467.50 610.80 58.70 68.60 275.20 310.30 121.00 139.50 4.60 5.60 6.40 12.70 102.00 145.00 37.50 38.90 Western Europe 21.40 35.40 5.90 9.00 16.30 22.00 9.20 14.30 0.32 0.38 0.32 0.40 6.10 14.10 3.40 4.50 Central Europe 7.80 12.30 1.60 1.90 6.10 7.70 2.30 3.50 0.11 0.21 0.25 0.39 4.60 10.00 1.10 1.20 USA 55.90 94.40 11.50 14.10 26.20 40.70 13.00 17.50 0.27 0.40 0.36 0.51 13.50 17.80 3.30 4.40 Canada 4.20 11.20 1.20 1.70 3.90 5.00 1.50 3.40 0.04 0.04 0.03 0.06 2.20 2.90 0.51 0.60 Central America 10.00 15.10 1.50 2.10 8.40 9.10 2.90 4.10 0.11 0.11 0.17 0.35 3.70 4.10 1.10 1.10 South America 22.30 26.50 2.80 3.80 26.40 30.00 8.40 12.90 0.20 0.33 0.32 0.83 3.80 8.80 3.40 3.50 Africa 49.40 83.20 2.70 5.90 25.00 29.40 10.80 14.50 0.46 0.62 1.05 1.91 5.30 8.80 2.30 2.40 China 95.50 137.30 6.90 9.80 33.10 49.40 11.50 24.50 0.71 1.41 1.10 3.80 19.20 21.10 8.90 13.60 India 40.30 79.40 2.70 4.90 25.70 33.80 7.30 10.80 0.45 0.84 1.00 3.27 4.00 7.90 3.70 8.50 Oceania 2.60 5.70 1.10 1.90 6.40 6.80 0.00 1.50 0.03 0.04 0.04 0.08 2.40 2.70 0.72 0.72
6 7
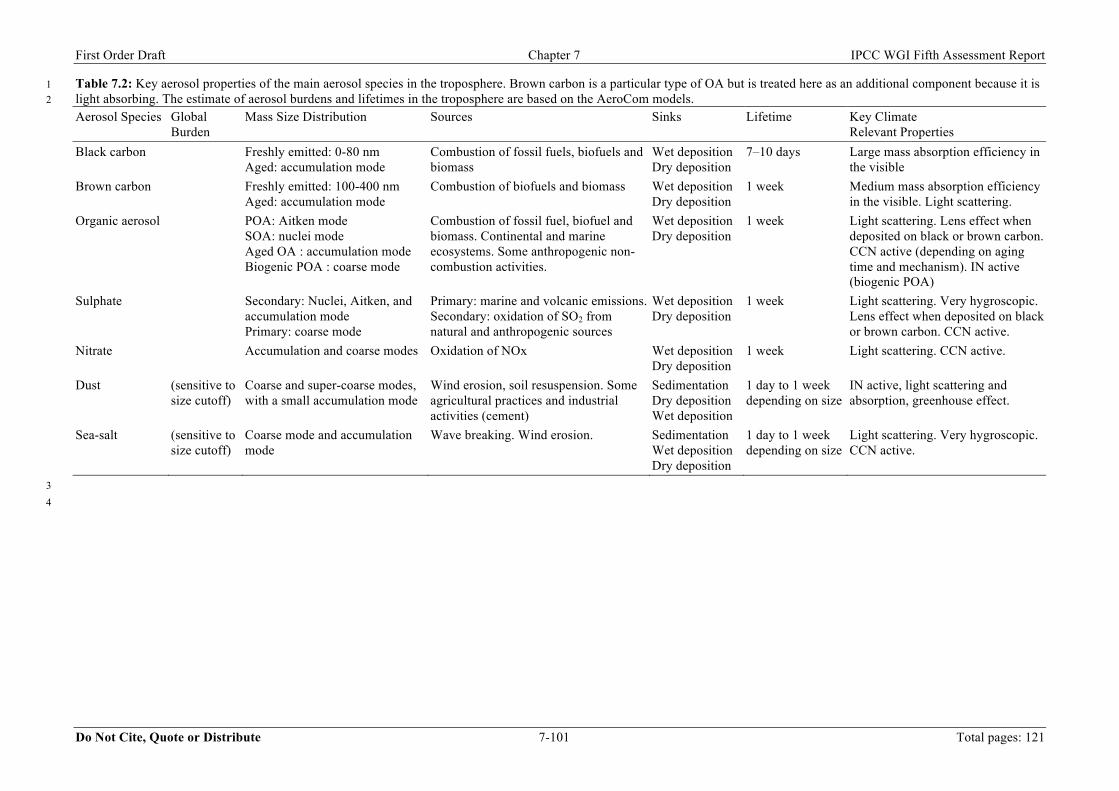
First Order Draft Chapter 7 IPCC WGI Fifth Assessment Report
Do Not Cite, Quote or Distribute 7-101 Total pages: 121
Table 7.2: Key aerosol properties of the main aerosol species in the troposphere. Brown carbon is a particular type of OA but is treated here as an additional component because it is 1 light absorbing. The estimate of aerosol burdens and lifetimes in the troposphere are based on the AeroCom models. 2
Aerosol Species Global Burden
Mass Size Distribution Sources Sinks Lifetime Key Climate Relevant Properties
Black carbon Freshly emitted: 0-80 nm Aged: accumulation mode
Combustion of fossil fuels, biofuels and biomass
Wet deposition Dry deposition
7–10 days Large mass absorption efficiency in the visible
Brown carbon Freshly emitted: 100-400 nm Aged: accumulation mode
Combustion of biofuels and biomass Wet deposition Dry deposition
1 week Medium mass absorption efficiency in the visible. Light scattering.
Organic aerosol POA: Aitken mode SOA: nuclei mode Aged OA : accumulation mode Biogenic POA : coarse mode
Combustion of fossil fuel, biofuel and biomass. Continental and marine ecosystems. Some anthropogenic non-combustion activities.
Wet deposition Dry deposition
1 week Light scattering. Lens effect when deposited on black or brown carbon. CCN active (depending on aging time and mechanism). IN active (biogenic POA)
Sulphate Secondary: Nuclei, Aitken, and accumulation mode Primary: coarse mode
Primary: marine and volcanic emissions. Secondary: oxidation of SO2 from natural and anthropogenic sources
Wet deposition Dry deposition
1 week Light scattering. Very hygroscopic. Lens effect when deposited on black or brown carbon. CCN active.
Nitrate Accumulation and coarse modes Oxidation of NOx Wet deposition Dry deposition
1 week Light scattering. CCN active.
Dust (sensitive to size cutoff)
Coarse and super-coarse modes, with a small accumulation mode
Wind erosion, soil resuspension. Some agricultural practices and industrial activities (cement)
Sedimentation Dry deposition Wet deposition
1 day to 1 week depending on size
IN active, light scattering and absorption, greenhouse effect.
Sea-salt (sensitive to size cutoff)
Coarse mode and accumulation mode
Wave breaking. Wind erosion. Sedimentation Wet deposition Dry deposition
1 day to 1 week depending on size
Light scattering. Very hygroscopic. CCN active.
3 4
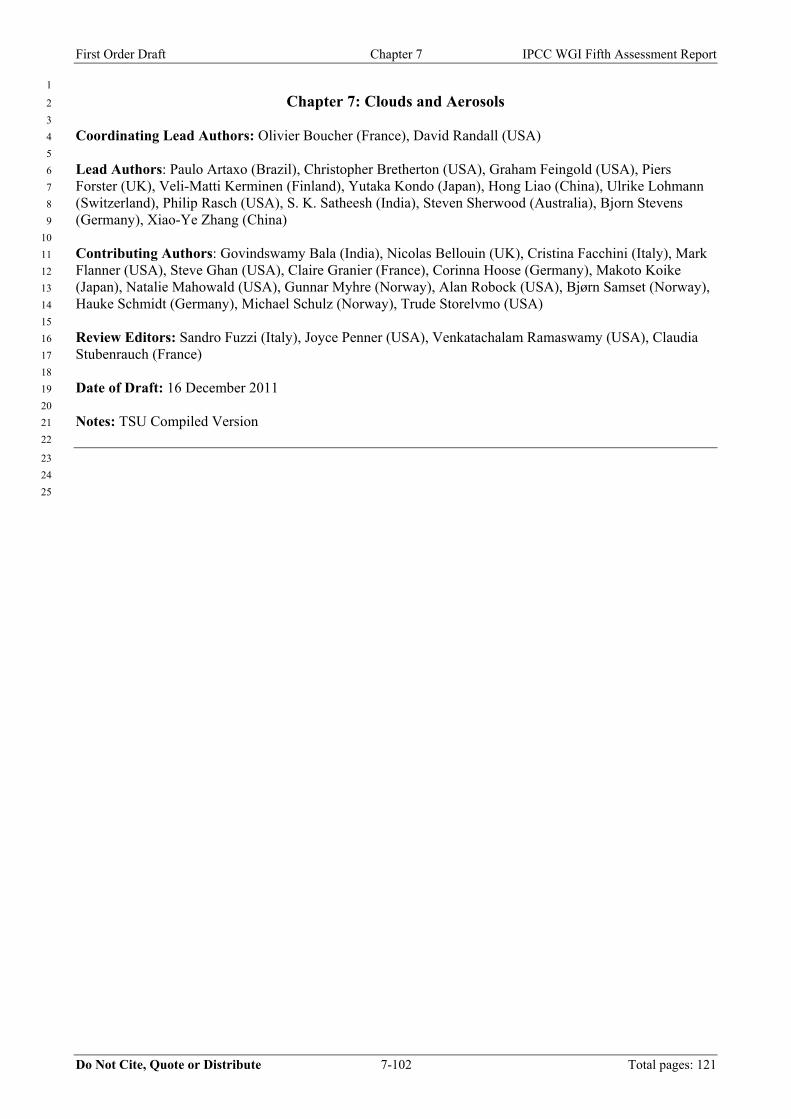
First Order Draft Chapter 7 IPCC WGI Fifth Assessment Report
Do Not Cite, Quote or Distribute 7-102 Total pages: 121
1
Chapter 7: Clouds and Aerosols 2
3
Coordinating Lead Authors: Olivier Boucher (France), David Randall (USA) 4
5
Lead Authors: Paulo Artaxo (Brazil), Christopher Bretherton (USA), Graham Feingold (USA), Piers 6
Forster (UK), Veli-Matti Kerminen (Finland), Yutaka Kondo (Japan), Hong Liao (China), Ulrike Lohmann 7
(Switzerland), Philip Rasch (USA), S. K. Satheesh (India), Steven Sherwood (Australia), Bjorn Stevens 8
(Germany), Xiao-Ye Zhang (China) 9
10
Contributing Authors: Govindswamy Bala (India), Nicolas Bellouin (UK), Cristina Facchini (Italy), Mark 11
Flanner (USA), Steve Ghan (USA), Claire Granier (France), Corinna Hoose (Germany), Makoto Koike 12
(Japan), Natalie Mahowald (USA), Gunnar Myhre (Norway), Alan Robock (USA), Bjørn Samset (Norway), 13
Hauke Schmidt (Germany), Michael Schulz (Norway), Trude Storelvmo (USA) 14
15
Review Editors: Sandro Fuzzi (Italy), Joyce Penner (USA), Venkatachalam Ramaswamy (USA), Claudia 16
Stubenrauch (France) 17
18
Date of Draft: 16 December 2011 19
20
Notes: TSU Compiled Version 21
22
23
24
25
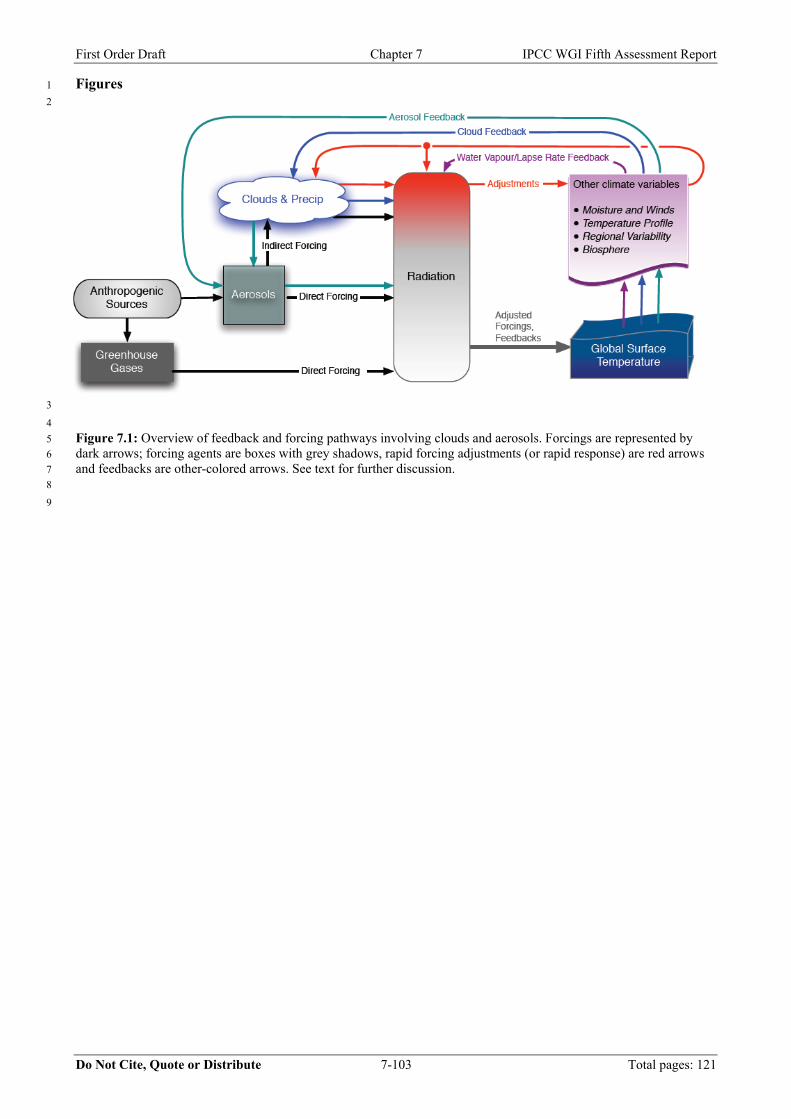
First Order Draft Chapter 7 IPCC WGI Fifth Assessment Report
Do Not Cite, Quote or Distribute 7-103 Total pages: 121
Figures 1
2
3
4
Figure 7.1: Overview of feedback and forcing pathways involving clouds and aerosols. Forcings are represented by 5
dark arrows; forcing agents are boxes with grey shadows, rapid forcing adjustments (or rapid response) are red arrows 6
and feedbacks are other-colored arrows. See text for further discussion. 7
8
9
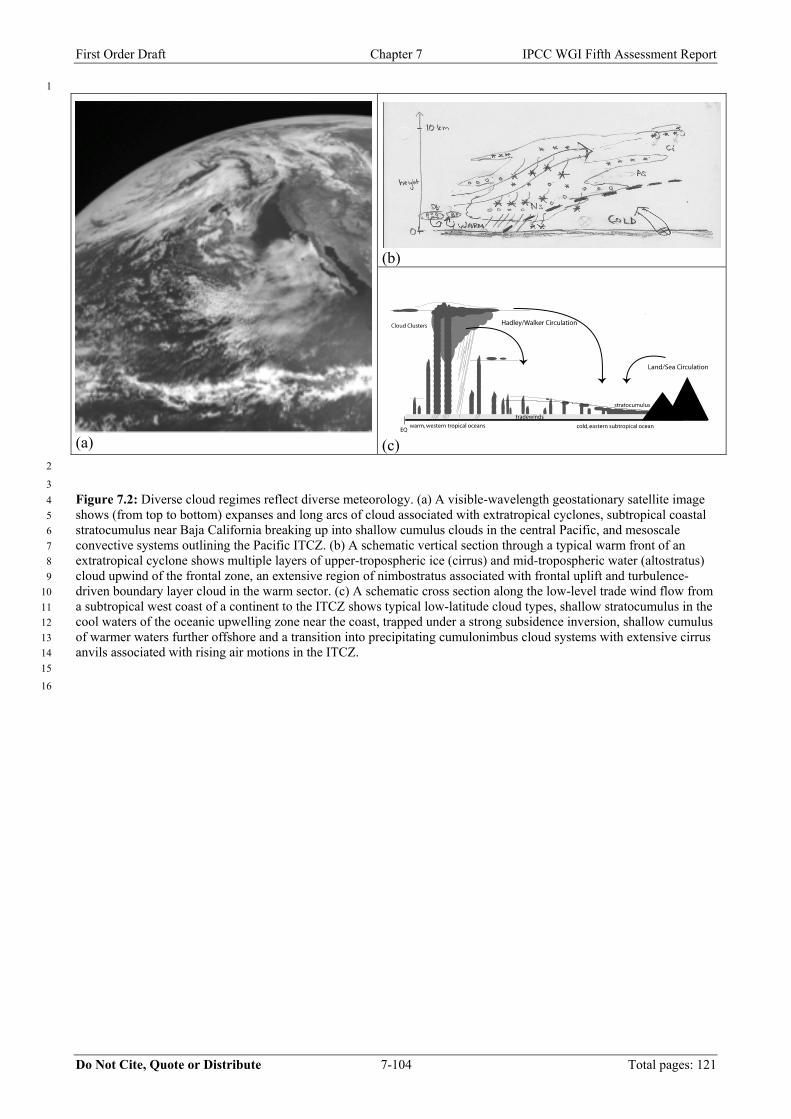
First Order Draft Chapter 7 IPCC WGI Fifth Assessment Report
Do Not Cite, Quote or Distribute 7-104 Total pages: 121
1
(a)
(b)
(c) 2
3
Figure 7.2: Diverse cloud regimes reflect diverse meteorology. (a) A visible-wavelength geostationary satellite image 4
shows (from top to bottom) expanses and long arcs of cloud associated with extratropical cyclones, subtropical coastal 5
stratocumulus near Baja California breaking up into shallow cumulus clouds in the central Pacific, and mesoscale 6
convective systems outlining the Pacific ITCZ. (b) A schematic vertical section through a typical warm front of an 7
extratropical cyclone shows multiple layers of upper-tropospheric ice (cirrus) and mid-tropospheric water (altostratus) 8
cloud upwind of the frontal zone, an extensive region of nimbostratus associated with frontal uplift and turbulence-9
driven boundary layer cloud in the warm sector. (c) A schematic cross section along the low-level trade wind flow from 10
a subtropical west coast of a continent to the ITCZ shows typical low-latitude cloud types, shallow stratocumulus in the 11
cool waters of the oceanic upwelling zone near the coast, trapped under a strong subsidence inversion, shallow cumulus 12
of warmer waters further offshore and a transition into precipitating cumulonimbus cloud systems with extensive cirrus 13
anvils associated with rising air motions in the ITCZ. 14
15
16

First Order Draft Chapter 7 IPCC WGI Fifth Assessment Report
Do Not Cite, Quote or Distribute 7-105 Total pages: 121
1
(a) (b) 2
3
Figure 7.3: Annual-mean cloud fractional occurrence based on four years of satellite observations (June 2006-February 4
2011) from CloudSat and Calipso (Kay et al., 2011; COSP simulator). (a) Geographical mean, with thin cloud (SR < 5) 5
removed; (b) latitude-height section of zonal mean cloud cover. [PLACEHOLDER FOR SECOND ORDER DRAFT: 6
further graphical refinement.] 7
8
9
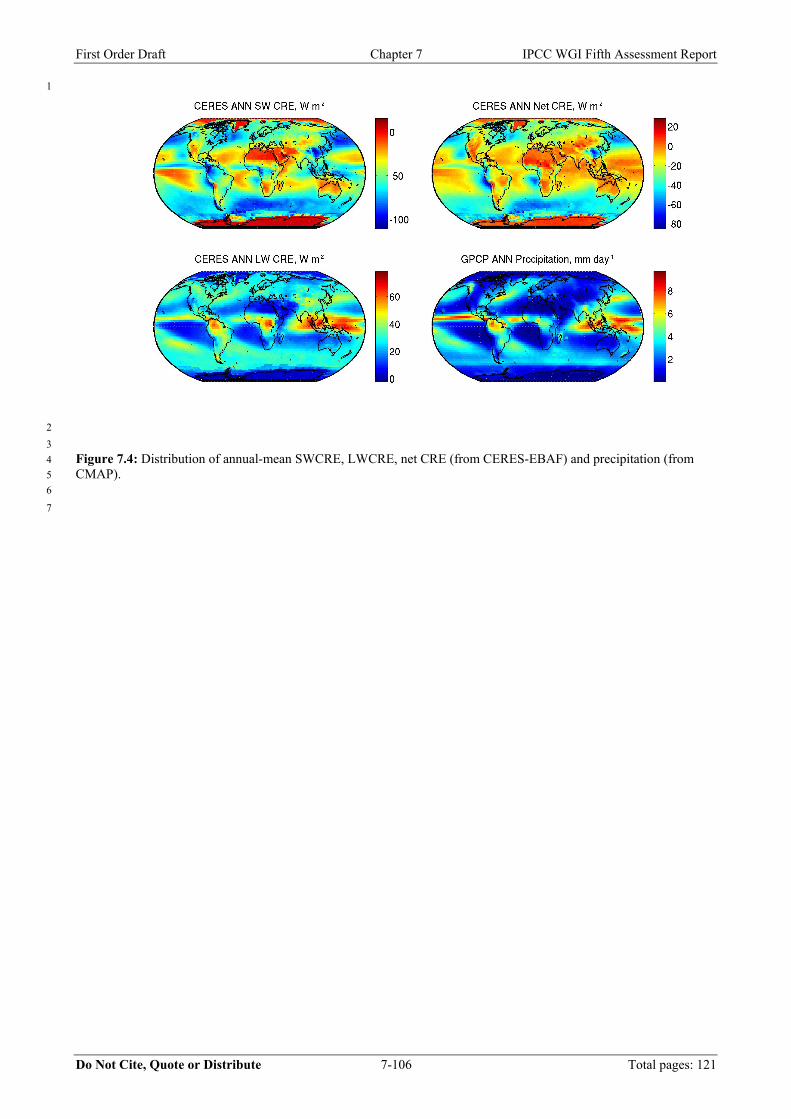
First Order Draft Chapter 7 IPCC WGI Fifth Assessment Report
Do Not Cite, Quote or Distribute 7-106 Total pages: 121
1
2
3
Figure 7.4: Distribution of annual-mean SWCRE, LWCRE, net CRE (from CERES-EBAF) and precipitation (from 4
CMAP). 5
6
7
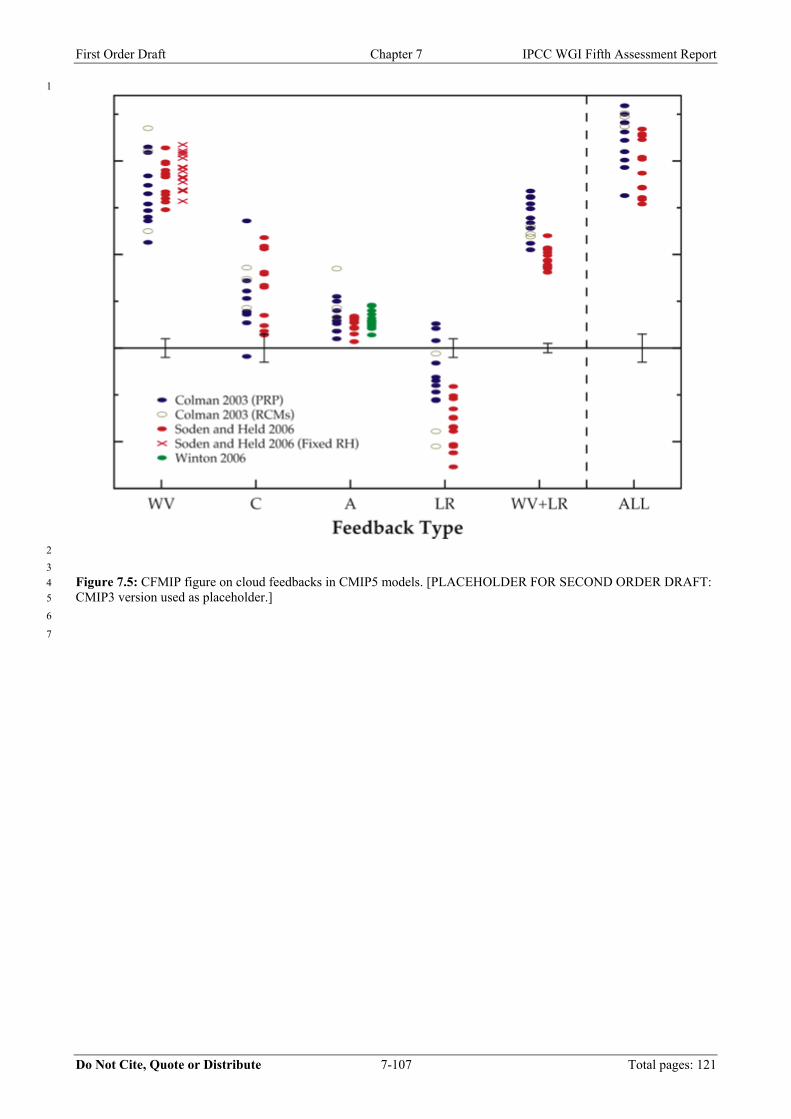
First Order Draft Chapter 7 IPCC WGI Fifth Assessment Report
Do Not Cite, Quote or Distribute 7-107 Total pages: 121
1
2
3
Figure 7.5: CFMIP figure on cloud feedbacks in CMIP5 models. [PLACEHOLDER FOR SECOND ORDER DRAFT: 4
CMIP3 version used as placeholder.] 5
6
7
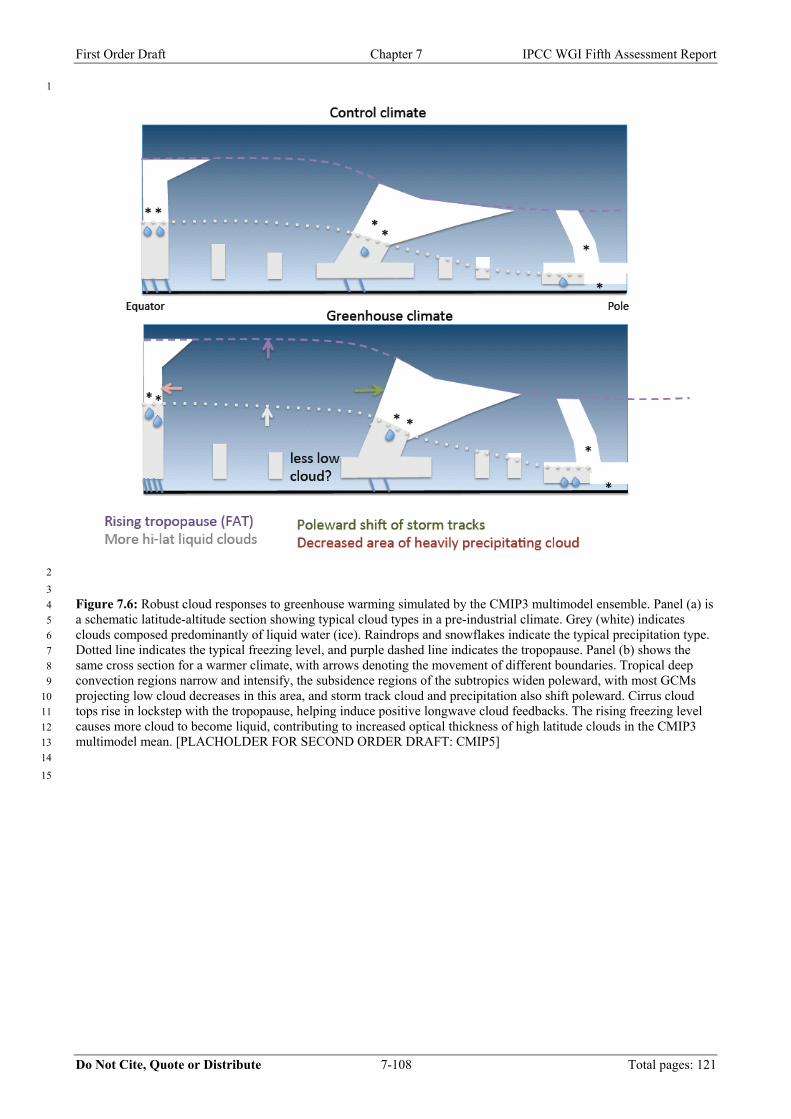
First Order Draft Chapter 7 IPCC WGI Fifth Assessment Report
Do Not Cite, Quote or Distribute 7-108 Total pages: 121
1
2
3
Figure 7.6: Robust cloud responses to greenhouse warming simulated by the CMIP3 multimodel ensemble. Panel (a) is 4
a schematic latitude-altitude section showing typical cloud types in a pre-industrial climate. Grey (white) indicates 5
clouds composed predominantly of liquid water (ice). Raindrops and snowflakes indicate the typical precipitation type. 6
Dotted line indicates the typical freezing level, and purple dashed line indicates the tropopause. Panel (b) shows the 7
same cross section for a warmer climate, with arrows denoting the movement of different boundaries. Tropical deep 8
convection regions narrow and intensify, the subsidence regions of the subtropics widen poleward, with most GCMs 9
projecting low cloud decreases in this area, and storm track cloud and precipitation also shift poleward. Cirrus cloud 10
tops rise in lockstep with the tropopause, helping induce positive longwave cloud feedbacks. The rising freezing level 11
causes more cloud to become liquid, contributing to increased optical thickness of high latitude clouds in the CMIP3 12
multimodel mean. [PLACHOLDER FOR SECOND ORDER DRAFT: CMIP5] 13
14
15
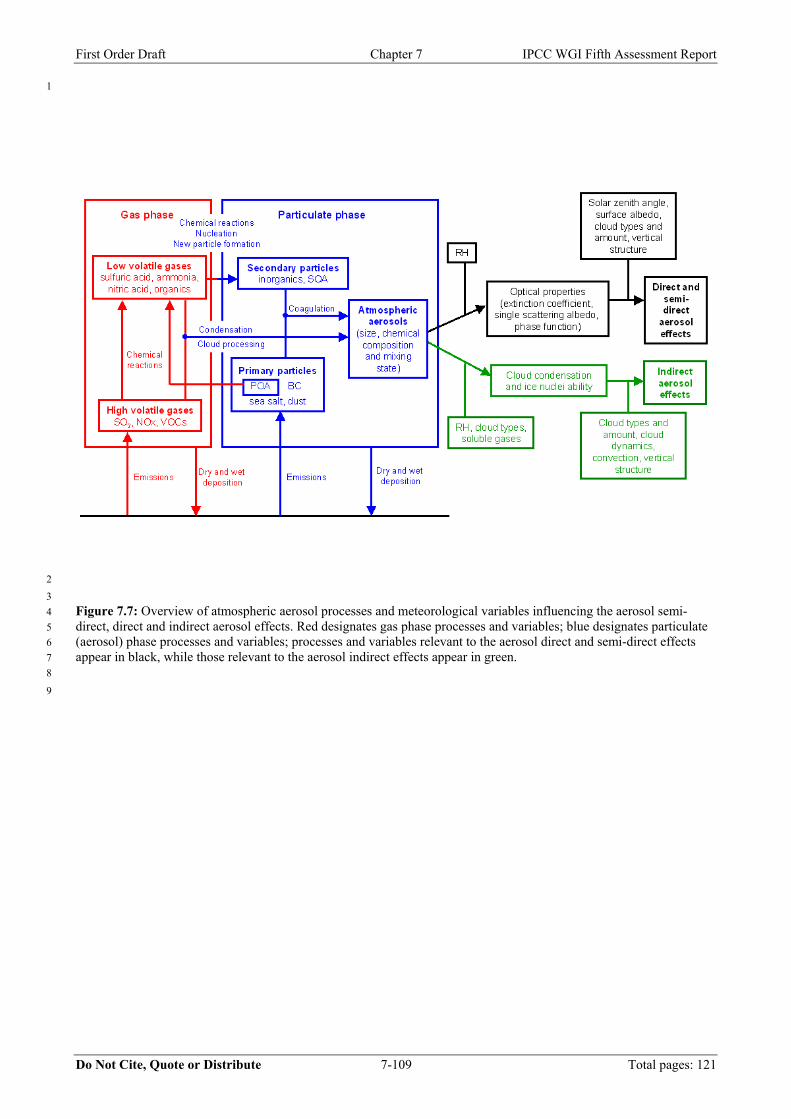
First Order Draft Chapter 7 IPCC WGI Fifth Assessment Report
Do Not Cite, Quote or Distribute 7-109 Total pages: 121
1
2
3
Figure 7.7: Overview of atmospheric aerosol processes and meteorological variables influencing the aerosol semi-4
direct, direct and indirect aerosol effects. Red designates gas phase processes and variables; blue designates particulate 5
(aerosol) phase processes and variables; processes and variables relevant to the aerosol direct and semi-direct effects 6
appear in black, while those relevant to the aerosol indirect effects appear in green. 7
8
9
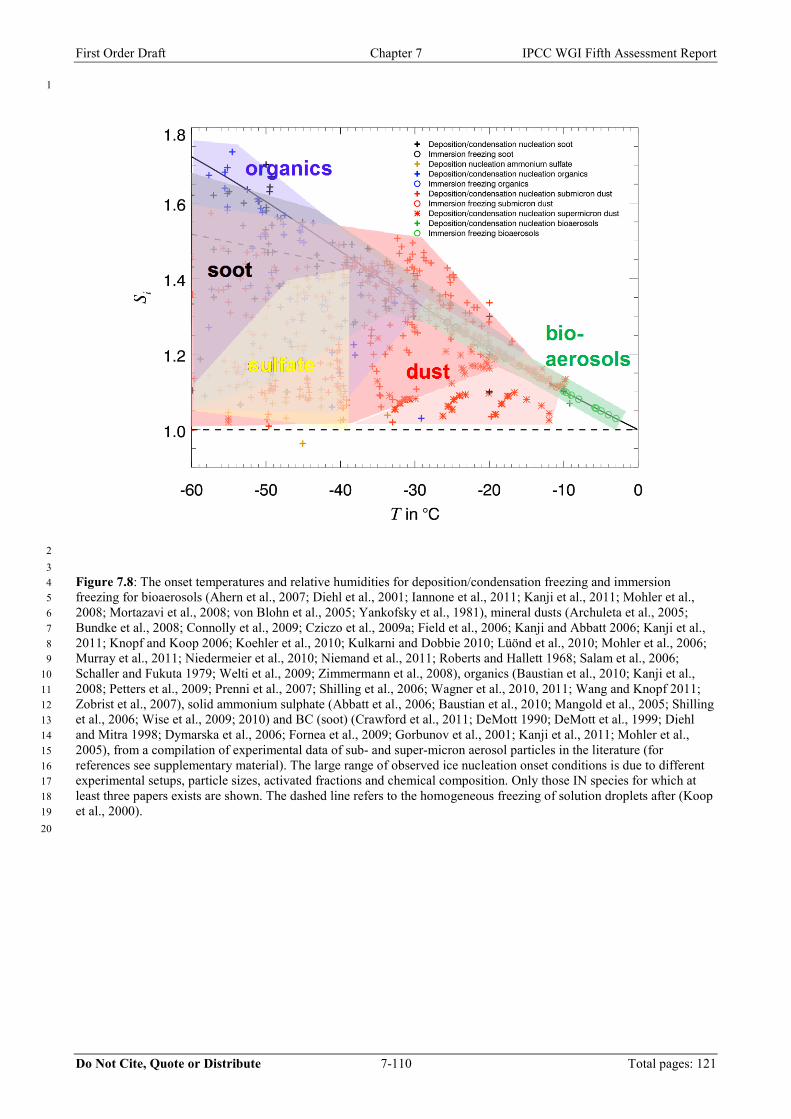
First Order Draft Chapter 7 IPCC WGI Fifth Assessment Report
Do Not Cite, Quote or Distribute 7-110 Total pages: 121
1
2 3 Figure 7.8: The onset temperatures and relative humidities for deposition/condensation freezing and immersion 4 freezing for bioaerosols (Ahern et al., 2007; Diehl et al., 2001; Iannone et al., 2011; Kanji et al., 2011; Mohler et al., 5 2008; Mortazavi et al., 2008; von Blohn et al., 2005; Yankofsky et al., 1981), mineral dusts (Archuleta et al., 2005; 6 Bundke et al., 2008; Connolly et al., 2009; Cziczo et al., 2009a; Field et al., 2006; Kanji and Abbatt 2006; Kanji et al., 7 2011; Knopf and Koop 2006; Koehler et al., 2010; Kulkarni and Dobbie 2010; Lüönd et al., 2010; Mohler et al., 2006; 8 Murray et al., 2011; Niedermeier et al., 2010; Niemand et al., 2011; Roberts and Hallett 1968; Salam et al., 2006; 9 Schaller and Fukuta 1979; Welti et al., 2009; Zimmermann et al., 2008), organics (Baustian et al., 2010; Kanji et al., 10 2008; Petters et al., 2009; Prenni et al., 2007; Shilling et al., 2006; Wagner et al., 2010, 2011; Wang and Knopf 2011; 11 Zobrist et al., 2007), solid ammonium sulphate (Abbatt et al., 2006; Baustian et al., 2010; Mangold et al., 2005; Shilling 12 et al., 2006; Wise et al., 2009; 2010) and BC (soot) (Crawford et al., 2011; DeMott 1990; DeMott et al., 1999; Diehl 13 and Mitra 1998; Dymarska et al., 2006; Fornea et al., 2009; Gorbunov et al., 2001; Kanji et al., 2011; Mohler et al., 14 2005), from a compilation of experimental data of sub- and super-micron aerosol particles in the literature (for 15 references see supplementary material). The large range of observed ice nucleation onset conditions is due to different 16 experimental setups, particle sizes, activated fractions and chemical composition. Only those IN species for which at 17 least three papers exists are shown. The dashed line refers to the homogeneous freezing of solution droplets after (Koop 18 et al., 2000). 19
20
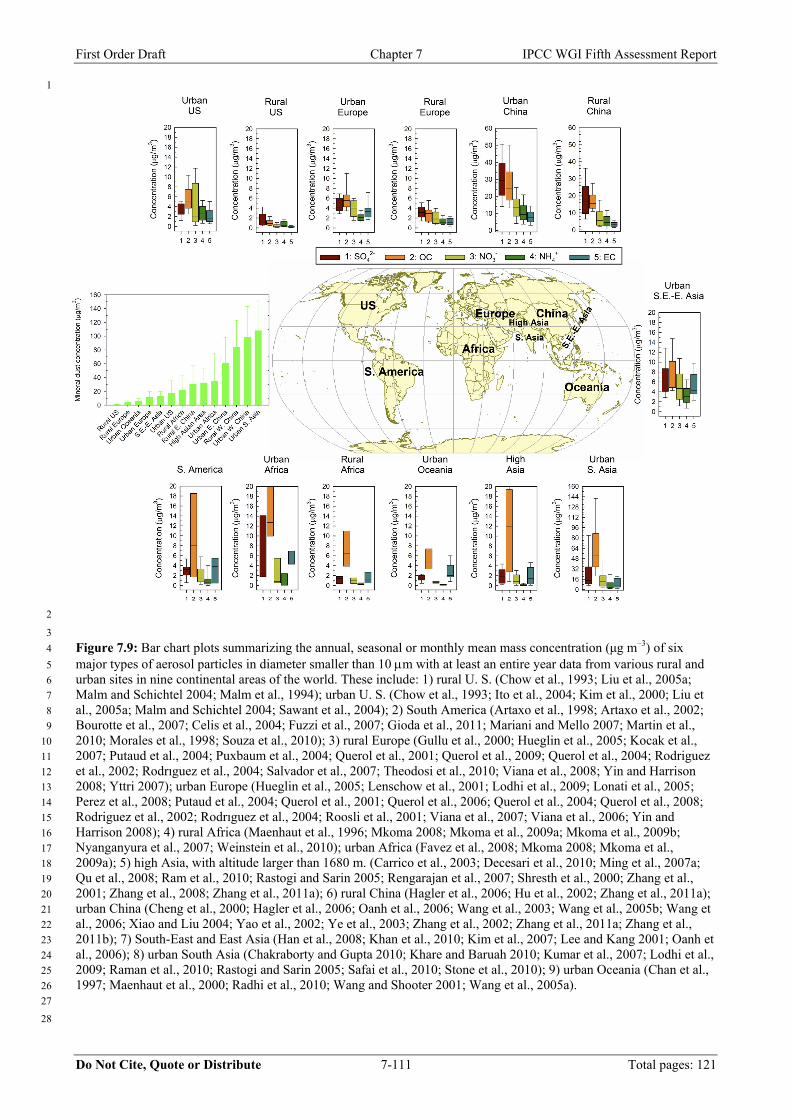
First Order Draft Chapter 7 IPCC WGI Fifth Assessment Report
Do Not Cite, Quote or Distribute 7-111 Total pages: 121
1
2
3
Figure 7.9: Bar chart plots summarizing the annual, seasonal or monthly mean mass concentration (μg m–3) of six 4
major types of aerosol particles in diameter smaller than 10 m with at least an entire year data from various rural and 5
urban sites in nine continental areas of the world. These include: 1) rural U. S. (Chow et al., 1993; Liu et al., 2005a; 6
Malm and Schichtel 2004; Malm et al., 1994); urban U. S. (Chow et al., 1993; Ito et al., 2004; Kim et al., 2000; Liu et 7
al., 2005a; Malm and Schichtel 2004; Sawant et al., 2004); 2) South America (Artaxo et al., 1998; Artaxo et al., 2002; 8
Bourotte et al., 2007; Celis et al., 2004; Fuzzi et al., 2007; Gioda et al., 2011; Mariani and Mello 2007; Martin et al., 9
2010; Morales et al., 1998; Souza et al., 2010); 3) rural Europe (Gullu et al., 2000; Hueglin et al., 2005; Kocak et al., 10
2007; Putaud et al., 2004; Puxbaum et al., 2004; Querol et al., 2001; Querol et al., 2009; Querol et al., 2004; Rodriguez 11
et al., 2002; Rodrıguez et al., 2004; Salvador et al., 2007; Theodosi et al., 2010; Viana et al., 2008; Yin and Harrison 12
2008; Yttri 2007); urban Europe (Hueglin et al., 2005; Lenschow et al., 2001; Lodhi et al., 2009; Lonati et al., 2005; 13
Perez et al., 2008; Putaud et al., 2004; Querol et al., 2001; Querol et al., 2006; Querol et al., 2004; Querol et al., 2008; 14
Rodriguez et al., 2002; Rodrıguez et al., 2004; Roosli et al., 2001; Viana et al., 2007; Viana et al., 2006; Yin and 15
Harrison 2008); 4) rural Africa (Maenhaut et al., 1996; Mkoma 2008; Mkoma et al., 2009a; Mkoma et al., 2009b; 16
Nyanganyura et al., 2007; Weinstein et al., 2010); urban Africa (Favez et al., 2008; Mkoma 2008; Mkoma et al., 17
2009a); 5) high Asia, with altitude larger than 1680 m. (Carrico et al., 2003; Decesari et al., 2010; Ming et al., 2007a; 18
Qu et al., 2008; Ram et al., 2010; Rastogi and Sarin 2005; Rengarajan et al., 2007; Shresth et al., 2000; Zhang et al., 19
2001; Zhang et al., 2008; Zhang et al., 2011a); 6) rural China (Hagler et al., 2006; Hu et al., 2002; Zhang et al., 2011a); 20
urban China (Cheng et al., 2000; Hagler et al., 2006; Oanh et al., 2006; Wang et al., 2003; Wang et al., 2005b; Wang et 21
al., 2006; Xiao and Liu 2004; Yao et al., 2002; Ye et al., 2003; Zhang et al., 2002; Zhang et al., 2011a; Zhang et al., 22
2011b); 7) South-East and East Asia (Han et al., 2008; Khan et al., 2010; Kim et al., 2007; Lee and Kang 2001; Oanh et 23
al., 2006); 8) urban South Asia (Chakraborty and Gupta 2010; Khare and Baruah 2010; Kumar et al., 2007; Lodhi et al., 24
2009; Raman et al., 2010; Rastogi and Sarin 2005; Safai et al., 2010; Stone et al., 2010); 9) urban Oceania (Chan et al., 25
1997; Maenhaut et al., 2000; Radhi et al., 2010; Wang and Shooter 2001; Wang et al., 2005a). 26
27
28
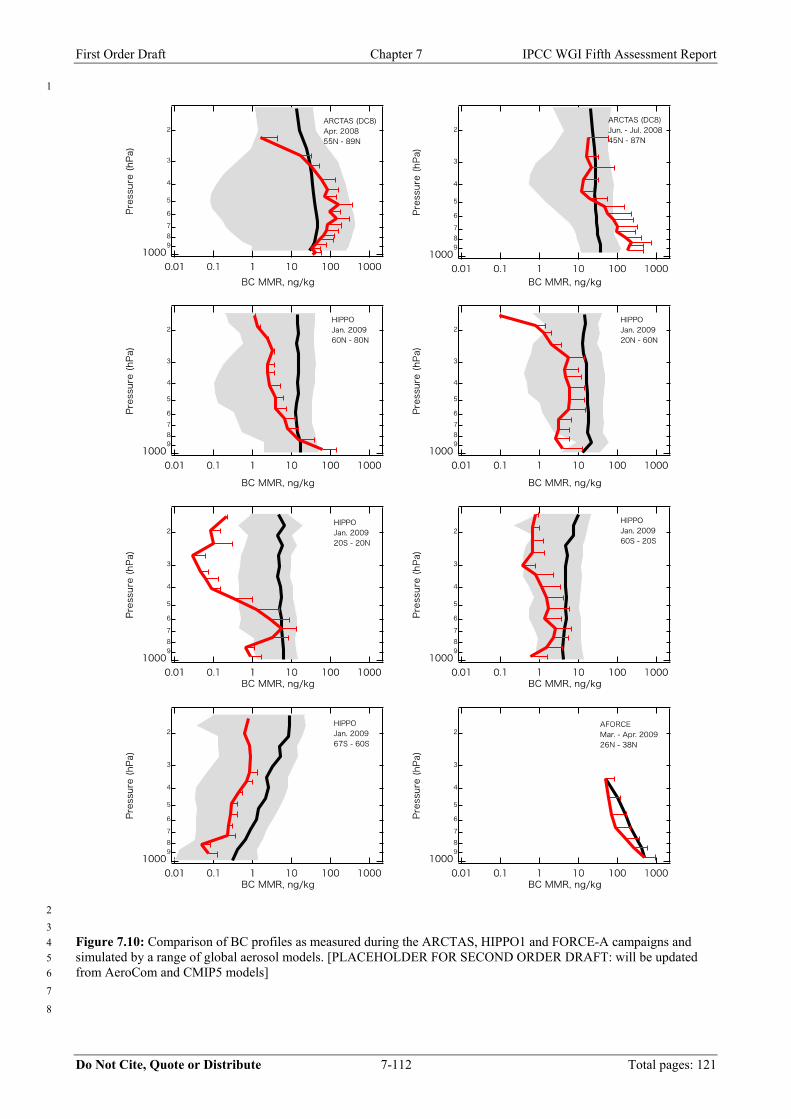
First Order Draft Chapter 7 IPCC WGI Fifth Assessment Report
Do Not Cite, Quote or Distribute 7-112 Total pages: 121
1
2
3
Figure 7.10: Comparison of BC profiles as measured during the ARCTAS, HIPPO1 and FORCE-A campaigns and 4
simulated by a range of global aerosol models. [PLACEHOLDER FOR SECOND ORDER DRAFT: will be updated 5
from AeroCom and CMIP5 models] 6
7
8
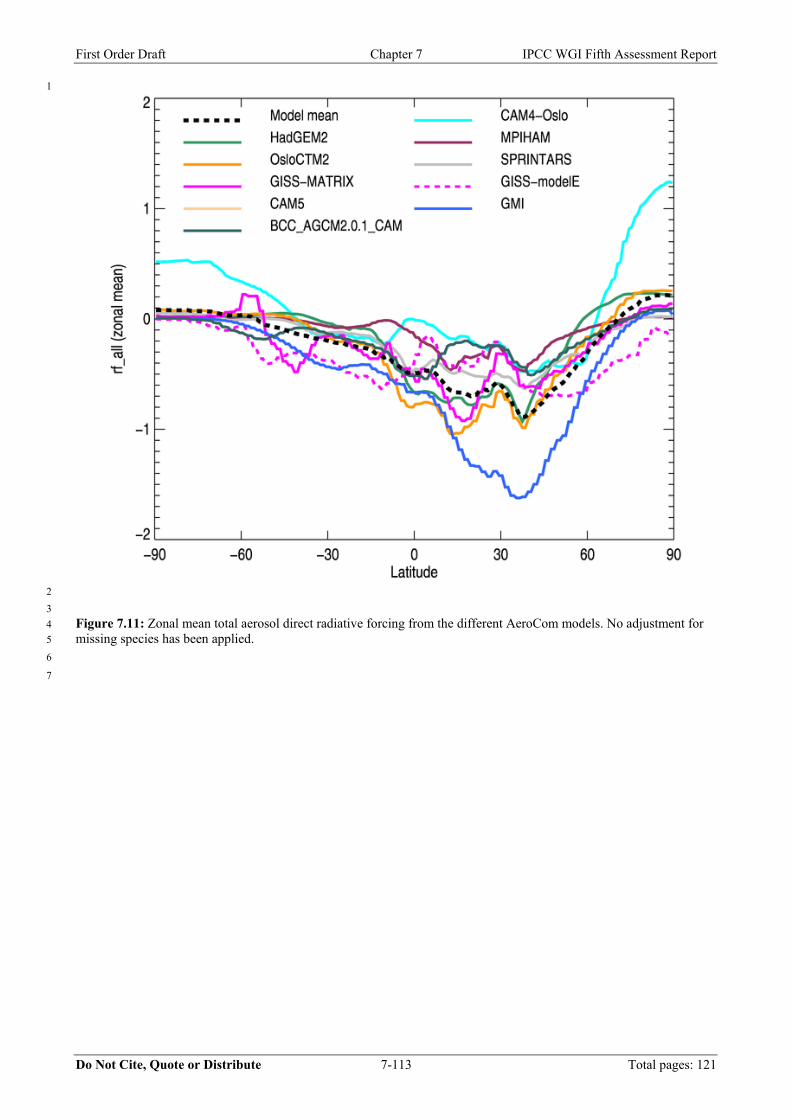
First Order Draft Chapter 7 IPCC WGI Fifth Assessment Report
Do Not Cite, Quote or Distribute 7-113 Total pages: 121
1
2
3
Figure 7.11: Zonal mean total aerosol direct radiative forcing from the different AeroCom models. No adjustment for 4
missing species has been applied. 5
6
7
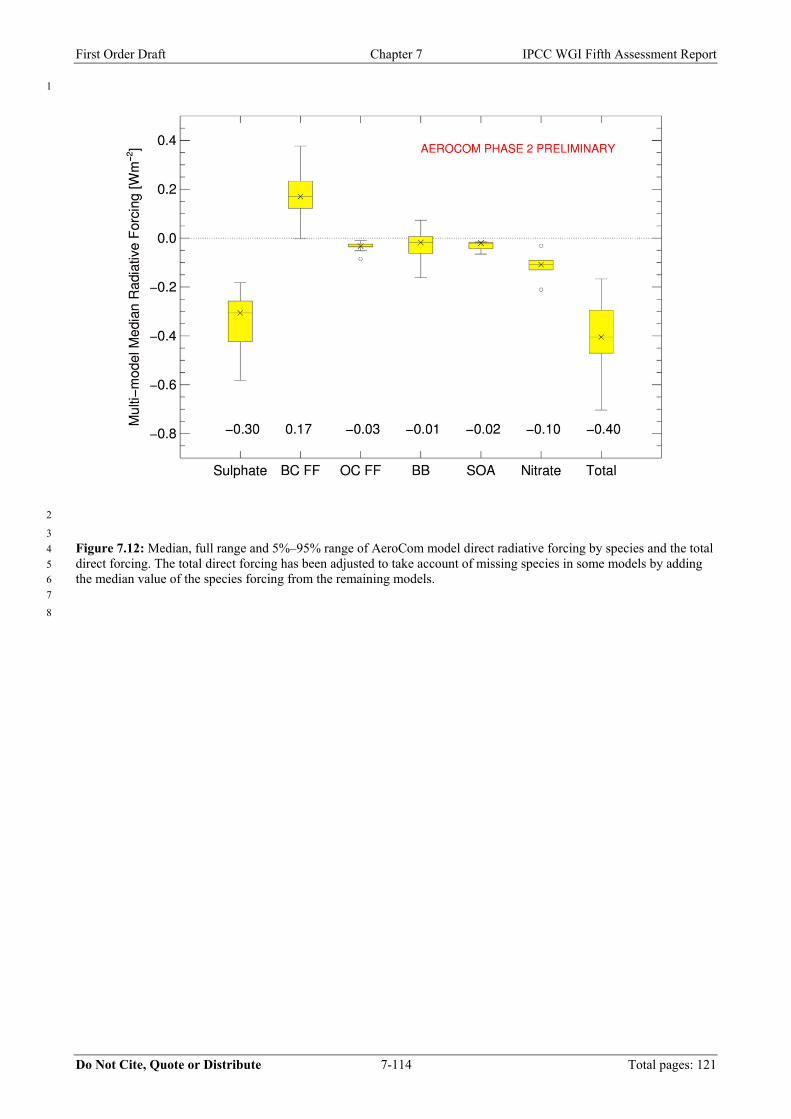
First Order Draft Chapter 7 IPCC WGI Fifth Assessment Report
Do Not Cite, Quote or Distribute 7-114 Total pages: 121
1
2
3
Figure 7.12: Median, full range and 5%–95% range of AeroCom model direct radiative forcing by species and the total 4
direct forcing. The total direct forcing has been adjusted to take account of missing species in some models by adding 5
the median value of the species forcing from the remaining models. 6
7
8
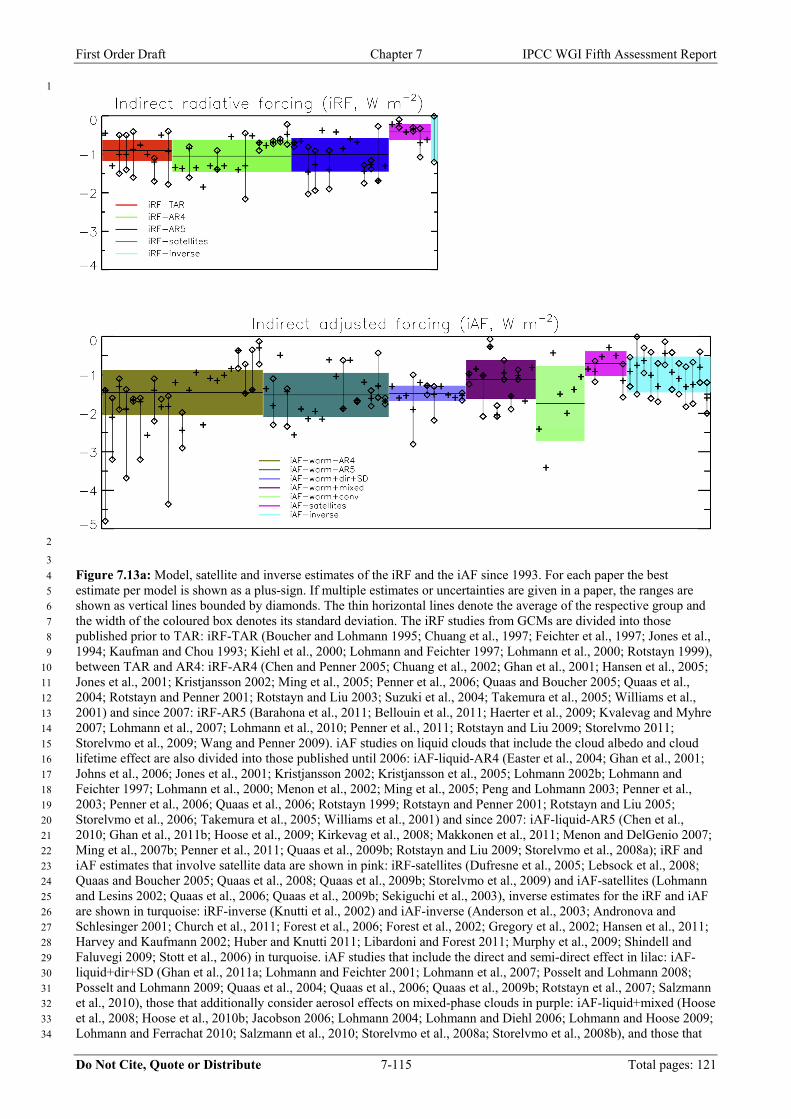
First Order Draft Chapter 7 IPCC WGI Fifth Assessment Report
Do Not Cite, Quote or Distribute 7-115 Total pages: 121
1
2
3
Figure 7.13a: Model, satellite and inverse estimates of the iRF and the iAF since 1993. For each paper the best 4
estimate per model is shown as a plus-sign. If multiple estimates or uncertainties are given in a paper, the ranges are 5
shown as vertical lines bounded by diamonds. The thin horizontal lines denote the average of the respective group and 6
the width of the coloured box denotes its standard deviation. The iRF studies from GCMs are divided into those 7
published prior to TAR: iRF-TAR (Boucher and Lohmann 1995; Chuang et al., 1997; Feichter et al., 1997; Jones et al., 8
1994; Kaufman and Chou 1993; Kiehl et al., 2000; Lohmann and Feichter 1997; Lohmann et al., 2000; Rotstayn 1999), 9
between TAR and AR4: iRF-AR4 (Chen and Penner 2005; Chuang et al., 2002; Ghan et al., 2001; Hansen et al., 2005; 10
Jones et al., 2001; Kristjansson 2002; Ming et al., 2005; Penner et al., 2006; Quaas and Boucher 2005; Quaas et al., 11
2004; Rotstayn and Penner 2001; Rotstayn and Liu 2003; Suzuki et al., 2004; Takemura et al., 2005; Williams et al., 12
2001) and since 2007: iRF-AR5 (Barahona et al., 2011; Bellouin et al., 2011; Haerter et al., 2009; Kvalevag and Myhre 13
2007; Lohmann et al., 2007; Lohmann et al., 2010; Penner et al., 2011; Rotstayn and Liu 2009; Storelvmo 2011; 14
Storelvmo et al., 2009; Wang and Penner 2009). iAF studies on liquid clouds that include the cloud albedo and cloud 15
lifetime effect are also divided into those published until 2006: iAF-liquid-AR4 (Easter et al., 2004; Ghan et al., 2001; 16
Johns et al., 2006; Jones et al., 2001; Kristjansson 2002; Kristjansson et al., 2005; Lohmann 2002b; Lohmann and 17
Feichter 1997; Lohmann et al., 2000; Menon et al., 2002; Ming et al., 2005; Peng and Lohmann 2003; Penner et al., 18
2003; Penner et al., 2006; Quaas et al., 2006; Rotstayn 1999; Rotstayn and Penner 2001; Rotstayn and Liu 2005; 19
Storelvmo et al., 2006; Takemura et al., 2005; Williams et al., 2001) and since 2007: iAF-liquid-AR5 (Chen et al., 20
2010; Ghan et al., 2011b; Hoose et al., 2009; Kirkevag et al., 2008; Makkonen et al., 2011; Menon and DelGenio 2007; 21
Ming et al., 2007b; Penner et al., 2011; Quaas et al., 2009b; Rotstayn and Liu 2009; Storelvmo et al., 2008a); iRF and 22
iAF estimates that involve satellite data are shown in pink: iRF-satellites (Dufresne et al., 2005; Lebsock et al., 2008; 23
Quaas and Boucher 2005; Quaas et al., 2008; Quaas et al., 2009b; Storelvmo et al., 2009) and iAF-satellites (Lohmann 24
and Lesins 2002; Quaas et al., 2006; Quaas et al., 2009b; Sekiguchi et al., 2003), inverse estimates for the iRF and iAF 25
are shown in turquoise: iRF-inverse (Knutti et al., 2002) and iAF-inverse (Anderson et al., 2003; Andronova and 26
Schlesinger 2001; Church et al., 2011; Forest et al., 2006; Forest et al., 2002; Gregory et al., 2002; Hansen et al., 2011; 27
Harvey and Kaufmann 2002; Huber and Knutti 2011; Libardoni and Forest 2011; Murphy et al., 2009; Shindell and 28
Faluvegi 2009; Stott et al., 2006) in turquoise. iAF studies that include the direct and semi-direct effect in lilac: iAF-29
liquid+dir+SD (Ghan et al., 2011a; Lohmann and Feichter 2001; Lohmann et al., 2007; Posselt and Lohmann 2008; 30
Posselt and Lohmann 2009; Quaas et al., 2004; Quaas et al., 2006; Quaas et al., 2009b; Rotstayn et al., 2007; Salzmann 31
et al., 2010), those that additionally consider aerosol effects on mixed-phase clouds in purple: iAF-liquid+mixed (Hoose 32
et al., 2008; Hoose et al., 2010b; Jacobson 2006; Lohmann 2004; Lohmann and Diehl 2006; Lohmann and Hoose 2009; 33
Lohmann and Ferrachat 2010; Salzmann et al., 2010; Storelvmo et al., 2008a; Storelvmo et al., 2008b), and those that 34

First Order Draft Chapter 7 IPCC WGI Fifth Assessment Report
Do Not Cite, Quote or Distribute 7-116 Total pages: 121
treat aerosol effects in stratiform and convective clouds in green: iAF-liquid+conv (Koch et al., 2009a; Lohmann 2008; 1
Menon and Rotstayn 2006; Menon and DelGenio 2007; Unger et al., 2009; Wang et al., 2011b). For the inverse 2
estimates no best estimate is shown and the turquoise colour box denotes the average of the lower and upper bounds of 3
these studies, respectively. 4
5
6
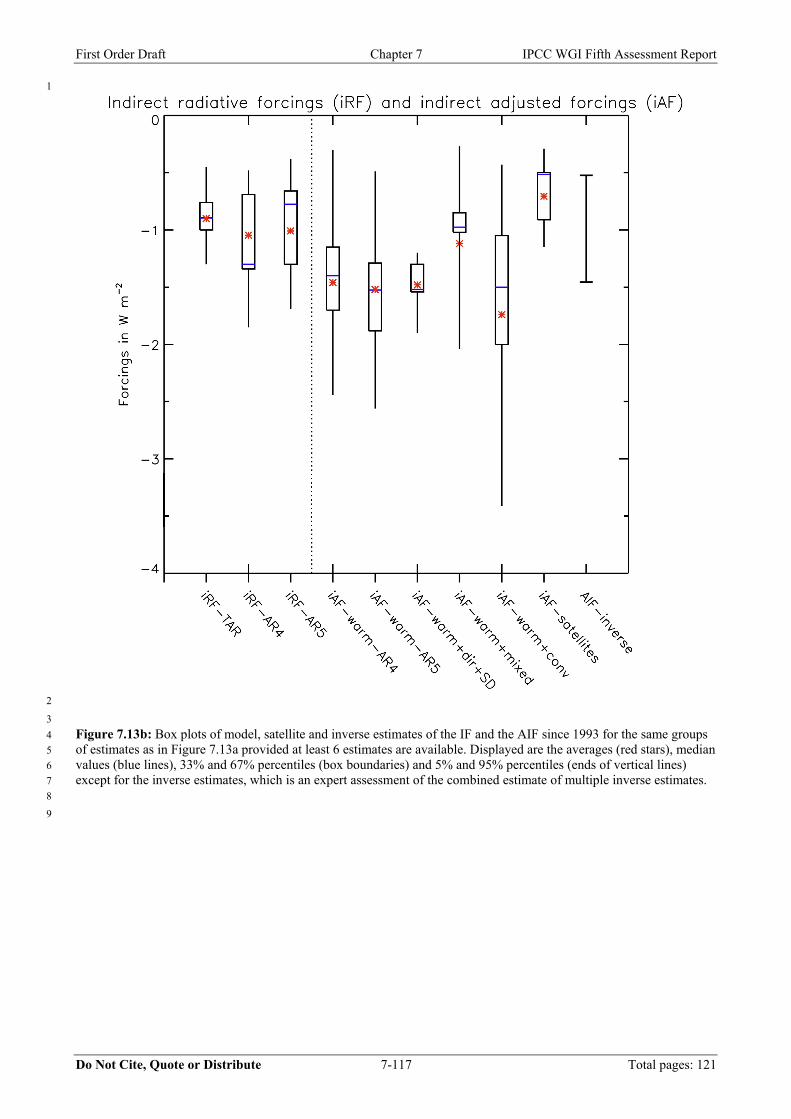
First Order Draft Chapter 7 IPCC WGI Fifth Assessment Report
Do Not Cite, Quote or Distribute 7-117 Total pages: 121
1
2
3
Figure 7.13b: Box plots of model, satellite and inverse estimates of the IF and the AIF since 1993 for the same groups 4
of estimates as in Figure 7.13a provided at least 6 estimates are available. Displayed are the averages (red stars), median 5
values (blue lines), 33% and 67% percentiles (box boundaries) and 5% and 95% percentiles (ends of vertical lines) 6
except for the inverse estimates, which is an expert assessment of the combined estimate of multiple inverse estimates. 7
8
9
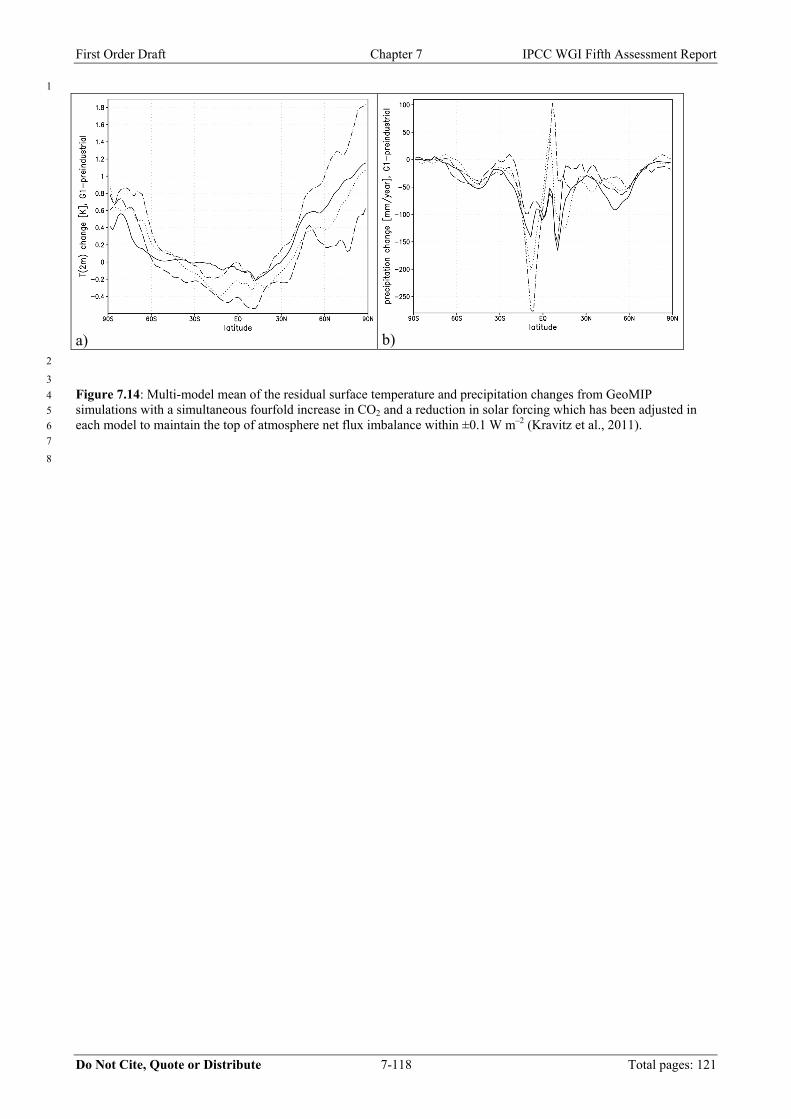
First Order Draft Chapter 7 IPCC WGI Fifth Assessment Report
Do Not Cite, Quote or Distribute 7-118 Total pages: 121
1
a) b) 2
3
Figure 7.14: Multi-model mean of the residual surface temperature and precipitation changes from GeoMIP 4
simulations with a simultaneous fourfold increase in CO2 and a reduction in solar forcing which has been adjusted in 5
each model to maintain the top of atmosphere net flux imbalance within ±0.1 W m–2 (Kravitz et al., 2011). 6
7
8
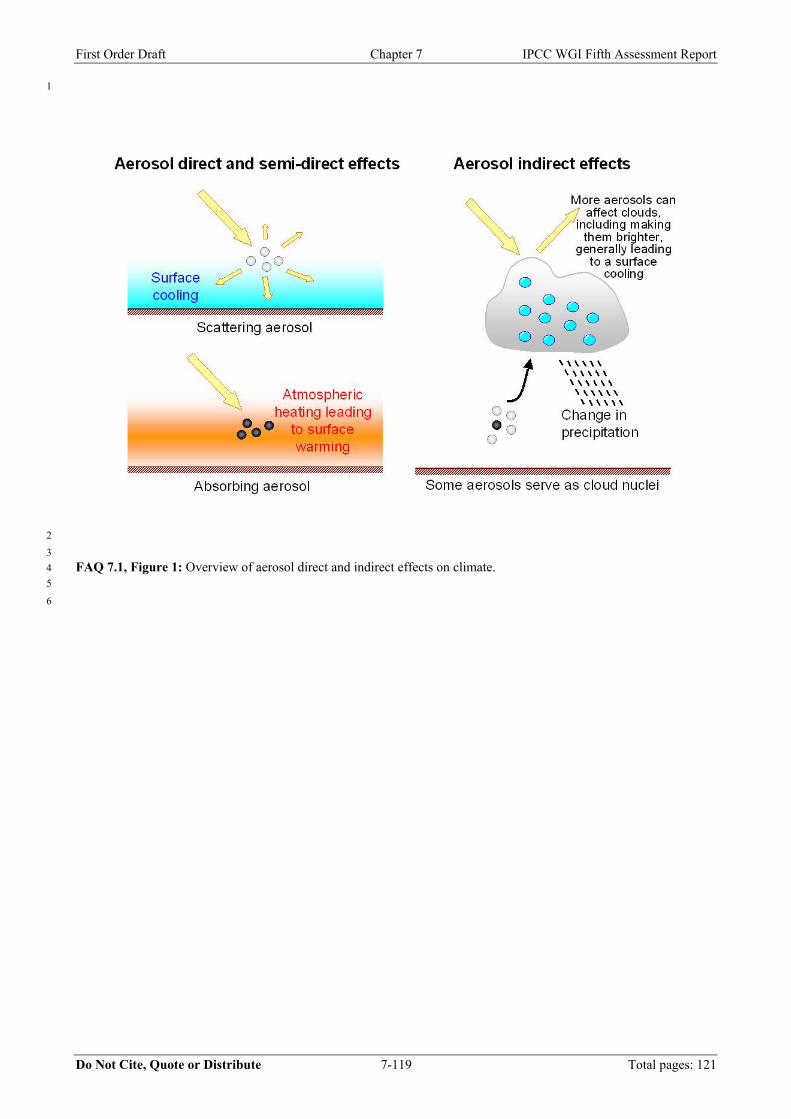
First Order Draft Chapter 7 IPCC WGI Fifth Assessment Report
Do Not Cite, Quote or Distribute 7-119 Total pages: 121
1
2
3
FAQ 7.1, Figure 1: Overview of aerosol direct and indirect effects on climate. 4
5
6
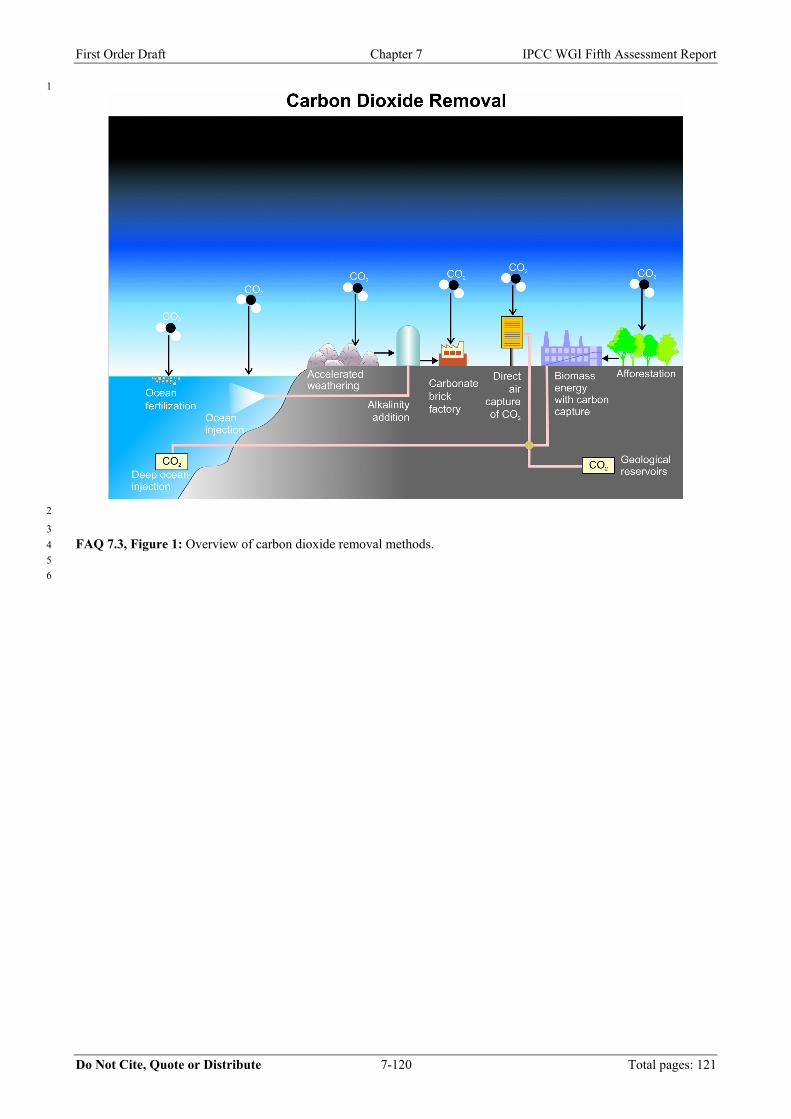
First Order Draft Chapter 7 IPCC WGI Fifth Assessment Report
Do Not Cite, Quote or Distribute 7-120 Total pages: 121
1
2
3
FAQ 7.3, Figure 1: Overview of carbon dioxide removal methods. 4
5
6
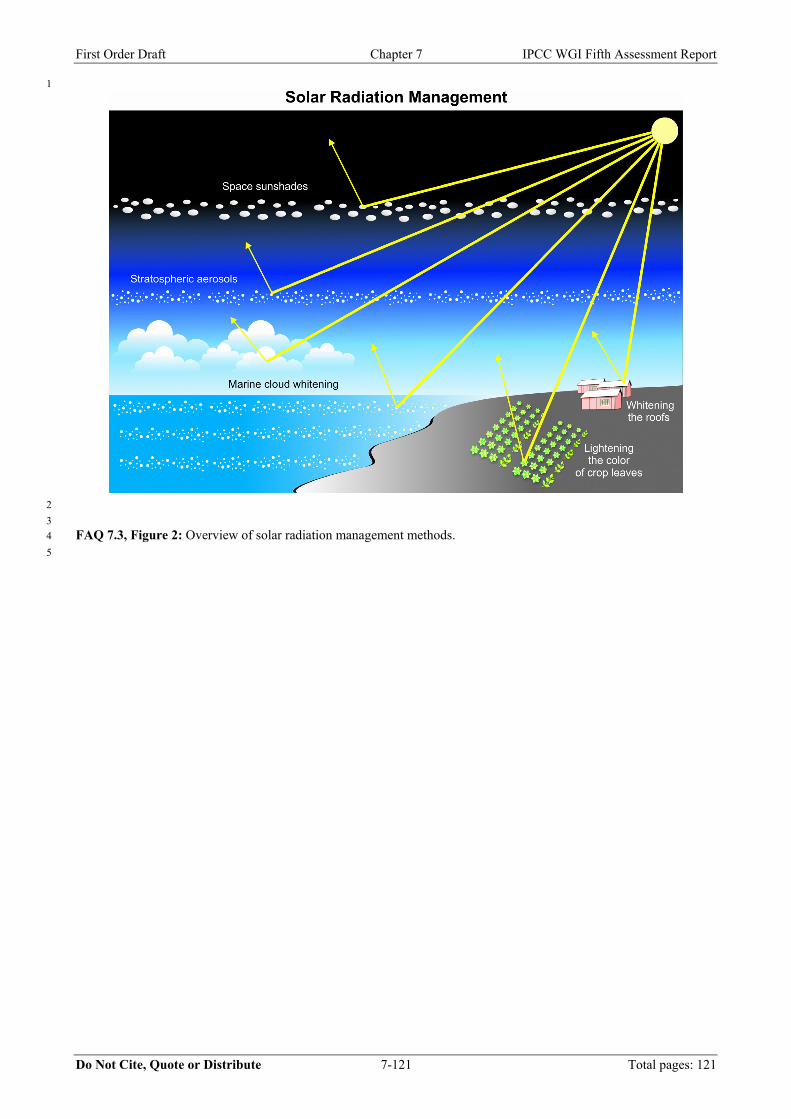
First Order Draft Chapter 7 IPCC WGI Fifth Assessment Report
Do Not Cite, Quote or Distribute 7-121 Total pages: 121
1
2
3
FAQ 7.3, Figure 2: Overview of solar radiation management methods. 4
5