CHAPTER 7 5. Freight Element
26
GREENSBORO URBAN AREA 2040 Metropolitan Transportation Plan Freight Element 7-1 CHAPTER 7 Freight Element In recognition of the key role that freight transportation plays in the Piedmont Triad region the Burlington- Graham, Greensboro, High Point, and Winston-Salem Metropolitan Planning Organizations (MPOs) are undertaking a Regional approach to the Metropolitan Transportation Plan (MTP) to develop a framework for an integrated freight planning document in their respective areas. Over the last several years, the Piedmont Triad has become increasingly focused on freight transportation planning since the loss of textile manufacturing and a shift to major Freight and Goods Movement Industry. The goals guiding regional freight planning and investment are: • Provide a safe freight transportation system that sustains or improves existing levels of freight access and mobility; • Support the region’s economic well-being, while remaining sensitive to environmental needs and concerns; and • Achieve efficiency in operations and investments in the freight transportation system. Freight movement is critical to an advanced industrial economy and the ease of freight movement is fundamental to a region’s economic competitiveness. Freight movement affects a region’s quality of life, particularly when ensuring truck traffic has suitable routes to and from the national highway or rail networks that avoid established residential areas. Federal legislation emphasizes freights role’ in regional transportation planning. Freight must be considered both in its own right and as a supporting element of an area’s economic vitality and competitiveness. The Journal of Commerce recommends that Congress and the President improve our national freight policy with the following actions: 1. Clearly define national goals with respect to all transportation; 2. Begin work on strategic performance measures for freight; 3. Create a competitive freight discretionary grant program; 4. Strengthen and diversify freight funding sources; 5. Better define the national freight system; 6. Strengthen the freight component of the planning process; 7. Develop a plan for the reorganization of the DOT; 8. The marine transportation and ports need a stronger voice to speak to their needs in the national interest; 9. Embrace private sector participation; 10. Raise revenue (10 Steps to an Effective National Freight Policy, 2012). This chapter describes existing conditions and trends for the nation, state, and Piedmont Triad study area and identifies their current and future issues. NC ports and airports are included, followed by a summary of key points and a list of recommendations. The chapter discusses both highway freight and rail freight. Many of the issues and trends differ between the highway mode and the rail freight mode and are discussed separately. However, the two modes are closely linked and there are cross-cutting issues. Relevance to the Transportation System and the Plan Since NCDOT issued its previous State Transportation Plan (STP), “Charting a New Direction for NCDOT” in 2004, several initiatives have highlighted the importance of freight and logistics in relation to economic health and growth. In North Carolina, freight and logistics have emerged as a state priority that can affect economic development and competitiveness. In North Carolina, this topic relates to the movement of raw goods and materials as well as finished goods and products, between their origins and destinations including in- state distribution to businesses and consumers and out-of-state markets. As a result, freight and logistics touch all aspects of the state’s economic development targets including agriculture, biomedical, education, manufacturing, military, and tourism. The Governor’s 25 Year Vision, the Strategic Transportation Investments program, and the Transportation Strategic Corridor framework are all elements of this new focus on freight flows. Underlying this effort is the recognition of the intimate relationship between freight flows and economic development. In recognition of the diverse needs of the state with respect to transportation, the 25 year strategic plan has divided the state into four fundamental regions (Western, Central, Eastern and Coastal) and
Transcript of CHAPTER 7 5. Freight Element

GREENSBORO URBAN AREA 2040 Metropolitan Transportation Plan
Freight Element 7-1
CHAPTER 7Freight Element
In recognition of the key role that freight transportation plays in the Piedmont Triad region the Burlington-Graham, Greensboro, High Point, and Winston-Salem Metropolitan Planning Organizations (MPOs) are undertaking a Regional approach to the Metropolitan Transportation Plan (MTP) to develop a framework for an integrated freight planning document in their respective areas.
Over the last several years, the Piedmont Triad has become increasingly focused on freight transportation planning since the loss of textile manufacturing and a shift to major Freight and Goods Movement Industry. The goals guiding regional freight planning and investment are:
• Provide a safe freight transportation system that sustains or improves existing levels of freight access and mobility;
• Support the region’s economic well-being, while remaining sensitive to environmental needs and concerns; and
• Achieve efficiency in operations and investments in the freight transportation system.
Freight movement is critical to an advanced industrial economy and the ease of freight movement is fundamental to a region’s economic competitiveness. Freight movement affects a region’s quality of life, particularly when ensuring truck traffic has suitable routes to and from the national highway or rail networks that avoid established residential areas.
Federal legislation emphasizes freights role’ in regional transportation planning. Freight must be considered both in its own right and as a supporting element of an area’s economic vitality and competitiveness.
The Journal of Commerce recommends that Congress and the President improve our national freight policy with the following actions:
1. Clearly define national goals with respect to all transportation;
2. Begin work on strategic performance measures for freight;
3. Create a competitive freight discretionary grant program;
4. Strengthen and diversify freight funding sources;
5. Better define the national freight system;
6. Strengthen the freight component of the planning process;
7. Develop a plan for the reorganization of the DOT;
8. The marine transportation and ports need a stronger voice to speak to their needs in the national interest;
9. Embrace private sector participation;
10. Raise revenue (10 Steps to an Effective National Freight Policy, 2012).
This chapter describes existing conditions and trends for the nation, state, and Piedmont Triad study area and identifies their current and future issues. NC ports and airports are included, followed by a summary of key points and a list of recommendations. The chapter discusses both highway freight and rail freight. Many of the issues and trends differ between the highway mode and the rail freight mode and are discussed separately. However, the two modes are closely linked and there are cross-cutting issues.
Relevance to the Transportation System and the PlanSince NCDOT issued its previous State Transportation Plan (STP), “Charting a New Direction for NCDOT” in 2004, several initiatives have highlighted the importance of freight and logistics in relation to economic health and growth. In North Carolina, freight and logistics have emerged as a state priority that can affect economic development and competitiveness. In North Carolina, this topic relates to the movement of raw goods and materials as well as finished goods and products, between their origins and destinations including in- state distribution to businesses and consumers and out-of-state markets. As a result, freight and logistics touch all aspects of the state’s economic development targets including agriculture, biomedical, education, manufacturing, military, and tourism.
The Governor’s 25 Year Vision, the Strategic Transportation Investments program, and the Transportation Strategic Corridor framework are all elements of this new focus on freight flows. Underlying this effort is the recognition of the intimate relationship between freight flows and economic development. In recognition of the diverse needs of the state with respect to transportation, the 25 year strategic plan has divided the state into four fundamental regions (Western, Central, Eastern and Coastal) and

GREENSBORO URBAN AREA 2040 Metropolitan Transportation Plan
Freight Element 7-2
developed different long-term initiatives and goals for each region. In addition to this, some statewide goals and initiatives have been developed such as improving public transportation to include passenger rail and supporting greater broadband connectivity through existing Right of Way.
The Central North Carolina region stretches from Charlotte to Research Triangle Park and includes the Piedmont Triad. The report recognizes the Central region as a center for high-tech industry, life science industry, and higher education. The Central region is the state’s largest economic engine, “providing $300 billion in gross domestic product and accounting for 67 percent of the state’s total GDP” and currently housing 61% of the total population of the state. In recognition of the challenges faced by this region over the next 25 years such as population growth outstripping the current capacity of the transportation system, deteriorating quality of the infrastructure, and the associated growing costs of maintenance, the plan has set the following goals and initiatives for the Central Region over the next 25 years:
• Relieve Congestion for People and Products
• Expand Mass Transit Options
• Enhance Access to Inland Ports
• Improve Connectivity to Logistics Hubs and
• Support Connections to Privately Developed Mega-sites.
An element of the new transportation planning process undertaken by the NC Department of Transportation is the identification of strategic transport corridors throughout the state. These corridors include both road and rail routes. Some of the corridors are wholly within the boundaries of North Carolina, while others link to adjoining states.
The NCDOT is defining the network of multimodal Strategic Transportation Corridors because they form the backbone of the state’s transportation system. The corridors are recognized as routes used by most of the state’s freight and intercity travel (passengers), link critical centers of economic activity and international air and sea ports, and generally support interstate commerce.
The goals of the Strategic Transportation Corridors program include:
• System connectivity – essential links within the entire transport system;
• Mobility – facilitating significant movements of freight and people; and
• Economic prosperity – support economic development and efficiency of transport logistics.
A significant number of Strategic Transportation Corridors are within the Piedmont Triad region. They include numerous interstate and major highway corridors including I-40, I-73, I-74, I-77, I-85, US 29 and US 220 as well as rail corridors including the NS Crescent Corridor. These corridors not only serve economic centers within the Piedmont Triad region, but also provide critical links to other parts of North Carolina as well as the rest of the United States.
Piedmont Together, a recent regional study of the Piedmont Triad, highlights the importance of freight transportation and logistics infrastructure and services with regard to the economic wellbeing of the region and its residents. The study identified a series of goals and objectives directly related to enhancing and developing the multimodal freight system of the region as a tool to benefit the residents and the economic development of the Piedmont Triad.
Piedmont Together noted “freight movement will remain a driving economic force. To protect this asset the region includes freight movement in the planning and prioritization of the regional transportation infrastructure. Providing more transportation options on a regional scale will help us maintain minimal congestion and create advantages to provide an attractive lifestyle and a welcoming environment for businesses to thrive and create more job opportunities.”1
The study identified two primary goals related to freight planning and operations within the region.
1. Provide more transportation choices through the development of safe, reliable and economical transportation infrastructure and services to decrease household transportation costs, reduce our nation’s dependence on foreign oil, improve air quality, and promote public health.
• Objective 1 Establish and enhance a robust network of multimodal transportation choices at the statewide, regional, county and municipal levels involving highways, passenger and freight rail, regional and local transit, para-transit services, sidewalks, cycling infrastructure, and recreational trails and greenways.
1Piedmont Together, Comprehensive Regional Plan, PART, 201

GREENSBORO URBAN AREA 2040 Metropolitan Transportation Plan
Freight Element 7-3
• Objective 2 Conduct local research and education on the benefits of a multimodal regional network.
2. Maintain and enhance the region’s competitive edge as a freight transportation and logistics hub on the Eastern Seaboard by focusing on facilities and infrastructure planning, and improving coordination and cooperation among stakeholders.
• Objective 1 Develop a comprehensive vision for freight infrastructure in the region.
• Objective 2 Develop a multimodal freight network strategy in the region designed to create, protect and maintain transport links, connecting intermodal facilities and appropriate modes, both public and private.
• Objective 3 Maintain a low level of traffic congestion in the region along Unlimited Truck Routes.
• Objective 4 Expand logistics education and career opportunities for the Piedmont Triad workforce.
These goals and their associated objectives underscore the importance of freight flows to the Piedmont Triad region and recognized need by PART to devote efforts to understand the existing freight infrastructure and flows and to formulate focused plans that will enhance the existing freight system in the Piedmont Triad region.
Finally, the formation of the North Carolina Freight Advisory Council (NCFAC) signifies recognition by NCDOT as to the importance of freight transportation and infrastructure. The NCFAC will provide advice and counsel to the NCDOT Secretary of Transportation regarding strategies that will enhance the status of North Carolina as a freight friendly state.
Freight transportation is a major factor in manufacturing retail costs. Manufacturers look for reliability, speed, and quality control in the carriers that deliver their raw materials and finished products. If materials do not arrive on time, all other processes are affected, productivity falls and costs go up.
Figure 7-1 is a schematic drawing of the relationship between shipping reliability and cost (Husdal, 2004). Retailers currently assume that the costs of transportation are less than the cost of maintaining large inventories (i.e., warehousing). ‘Just-in-time’ inventory is widespread and points to the strength and reliability of the transportation
system. However, as congestion affects transportation reliability, costs will increase because reliability will be a premium – affecting the price of retail items.
Costs
Vulnerability Reliability
Cost of disruptions
Cost of countermeasuresA
B
CD
FIGURE 7-1Freight Reliability vs. Cost (After Husdal)
Freight movement may be mysterious to the average consumer, but is crucial to maintaining our quality of life. The Federal Highway Administration has produced an excellent video entitled “Keeping the Global Supply Chain Moving” (http://www.youtube.com/watch?v=OVYcxi1rDgE). The video offers the following points about the supply chain. If the US Supply chain slows down:
• In 6-12 hours manufacturers assembly lines will stop;
• In 24 hours many hospitals will run out of critical supplies;
• In 48 hours Gas Stations will begin running out of fuel; and
• In 72 hours most Grocery Stores will run out of perishable foods.
In addition, transportation jobs generally pay well and, through multipliers, this income positively affects the local economy in a direct way.
Freight, in the study area, moves by air, highway, rail, and pipeline. The Piedmont Triad was an early crossroad for the railroads, connecting freight from eastern ports to inland buyers. This logistical network contributes significantly to the regional economy. The Piedmont Triad is located at a crossroad of the interstate system. The I-85 and I-40 corridors through the Triad region confirm the importance of freight and freight movements. The percentage of trucks in these corridors is around 14%,

GREENSBORO URBAN AREA 2040 Metropolitan Transportation Plan
Freight Element 7-4
Company
Square Footage
County
*Hanesbrand Inc 2,333,520 Forsyth*Ralph Lauren Corp 2,000,000 Guilford*Liberty Hardware 1,734,160 ForsythHarris Teeter 1,480,000 Guilford**1031 E. Mountain St. 1,200,000 ForsythSalem Business Park 1,100,000 ForsythPiedmont Triad Industrial Center
930,100 Forsyth
Twin City Warehouse Inc 900,000 ForsythUSPS Bulk Mail Center 892,000 GuilfordPhillips Van-Heusen 750,000 YadkinNC 1-Liberty Hardware 680,000 ForsythKay Chemical Company 600,000 ForsythPowell Company 600,000 GuilfordGildan Activewear 597,898 Rockingham**6105 Corporate Park Dr 582,037 GuilfordGold Toe Brands 570,000 AlamancePepsi Bottling Ventures 526,000 ForsythLowes Companies Inc 516,000 GuilfordReplacements Ltd. 500,000 GuilfordJockey International 500,000 DavieSchenker Logistics 500,000 GuilfordVF Jeanswear 494,700 DavieStokesdale Distribution 481,131 RockinghamLoomcraft Textiles 454,219 AlamanceGateway Business Center 415,000 ForsythFedEx Ground 415,000 GuilfordKlaussner Furniture Industries
381,402 Randolph
Dart Container 366,000 RandolphLegacy Classic Furniture 349,960 GuilfordSamson Marketing 347,000 GuilfordBull Ridge Distribution Center
341,000 Guilford
United Parcel Service 336,000 GuilfordSav-A-Lot 325,000 DavidsonLentz Property Mgmt 315,000 ForsythMylan Pharmaceuticals 312,000 GuilfordO’Reilly Automotive Inc. 300,000 Guilford
FIGURE 7-2Piedmont Triad Major Distribution Facilities
resulting in average annual truck volumes in the range of 5,600 – 14,000. Two major pipelines, Colonial and Plantation, provide another important source of freight transport, once again with the Piedmont Triad at the crossroad.
The Piedmont Triad is in a time of economic transition. Since 2000, tens of thousands of jobs in the Region’s traditional industrial clusters (furniture, textiles, and tobacco manufacturing) have been lost due to low-wage global competition and more productive manufacturing. With 1.6 million residents and a 1.5% annual growth rate, the population of the Piedmont Triad is expected to exceed 2 million by 2030.
On a positive note, new regional economics are emerging. FedEx established its Mid-Atlantic hub at PTI and the major UPS sort center provides the Piedmont Triad with a competitive advantage in air logistics, offering time-sensitive industries fast, reliable long-distance connectivity. Just as shippers and manufacturers have traditionally located near seaports and railheads, modern businesses also want good access to airports (Glaser, 2011). Airport- linked e-commerce fulfillment centers complement flow- through facilities for perishables, just-in-time supply chain and emergency parts provision centers, and reverse logistics facilities for the repair and upgrade of high-tech products such as laptops and smart phones. The clustering of time-critical goods facilities near air-express airports is stimulating expansion of air cargo, less than trailer load trucking (LTL), freight forwarders, and third party logistics providers (3PLs) along major highways accessible to these airports. Figure 7-2 shows a listing of major distribution facilities.
The Piedmont Triad has many logistics assets and is strategically located in the center of the Atlantic Coast Air Transport Corridor. The Triad offers excellent interstate highway access and competitive rail service, and is within six-hour trucking proximity to deep-water ports at Wilmington, NC, Morehead City, NC, Charleston, SC, Norfolk, VA and Savannah, GA. In addition, the area is served by the Norfolk Southern and CSX rail lines.
Existing Conditions and TrendsThe NC Maritime Strategy report (AECOM; URS, 2012) shows that trucks carried 82.4% of freight traffic in North Carolina in 2007, while rail carried 13.6%. The analysis predicts that by 2040 the total truck freight
*Indicates more than one location**Indicates more than one business at location

GREENSBORO URBAN AREA 2040 Metropolitan Transportation Plan
Freight Element 7-5
carried will increase to 85.18% while the rail freight will decrease to 10.16%. Figures 7-3 and 7-4 show the distribution by mode in 2007 and expected in 2040. This information seems to contradict information released by the railroad industry. A CSX application to the Federal Highway Administration’s Corridors of the Future program says “Each intermodal train can take 280 trucks off the roadways, while each bulk and merchandise train can remove up to 500 trucks.” Although true, in most cases trucks carry the goods to and from the rail facility. Intrastate freight movement in North Carolina moves mainly by truck. Therefore we would be remiss not to consider more truck movement into and through the Piedmont Triad.
Truck Rail Other Total
FIGURE 7-32007 North Carolina Freight Movements
Truck Rail Other Total
FIGURE 7-42040 North Carolina Freight Movements
Highway FreightHighway Freight: National Conditions and Trends
Truck mileage has been consistently increasing nationally over the past decades, but has been confined to essentially the same road capacity. Urban freeways and arterials in particular have become increasingly congested, and this trend is expected to continue. Trucks are affected just as much as commuters by congestion with additional implications for freight travel time and reliability.
By 2020, the trucking industry expects to move three billion more tons of freight than it hauls today. To meet this demand, the industry will put another 1.8 million trucks on the road. On average, 10,500 trucks a day travel on the Interstate Highway System. By 2035, this will more than double, to 22,700 trucks on the most heavily used parts of the Interstate, with the most popular segments seeing upwards of 50,000 trucks a day. (Transportation Reboot, 2010)
Highway Freight: Statewide and Regional Conditions and Trends
As presented in Figure 7-5, total freight traffic in 2012 in North Carolina was almost 400 million tons with a total value of $454 million. In 2040, the total weight of freight traffic is predicted to increase to over 450 million tons with a combined value of $628 million. Between 2012 and 2040 total freight traffic is estimated to increase by 13.5% in terms of weight and 38.4% in terms of value. Domestic traffic will continue to dominate the total flows, accounting for 96% in 2040, down from 97.8% in 2012. As the table shows, the volume of export traffic from North Carolina is expected to grow by almost 150% during the forecast period.

GREENSBORO URBAN AREA 2040 Metropolitan Transportation Plan
Freight Element 7-6
DomesticYear Tons (000) Value ($M)
2012 389,989 $431,021
2040 432,402 $558,488
% Change 10.9% 29.6%
ImportsYear Tons (000) Value ($M)
2012 3,078 $5,5882040 5,746 $20,375% Change 86.7% 264.6%
ExportsYear Tons (000) Value ($M)
2012 5,837 $17,2402040 14,545 $49,200% Change 149.2% 185.4%
CombinedYear Tons (000) Value ($M)
2012 398,904 $453,8482040 452,693 $628,063% Change 13.5% 38.4%
FIGURE 7-5North Carolina Freight Traffic Flows
Highway infrastructure in North Carolina includes state, municipal, and federally owned roadways. According to the 2012 Maintenance Condition Assessment Report, the NCDOT owns and maintains 80,000 miles of roadways, which represents approximately three-fourths of the total roadway inventory in the state. The state-owned roadway inventory includes 170,947 paved lanes miles, approximately 4,357 centerline miles of unpaved roads, and 18,265 structures. This wealth of paved roads is critical to the overall economic vitality of our state and region. Just as critical however is the need to properly maintain this road system after initial construction.
In 2013 NCDOT updated North Carolina Multimodal Investment Network (NCMIN) and renamed it North Carolina Transportation Network (NCTN). The NCTN retains the original tier levels but is more consistent with NCDOT’s project prioritization process. The NCTN stratifies each modal system into three tiers: statewide, regional, and sub-regional. Figure 7-6 shows the definitions of Statewide, Regional, and Subregional facilities for the highway networks.
Mode Highways
Statewide Tier
Statewide Corridors/ facilities linking major activity centers and supporting interstate and inter-regional movement.
Regional TierRegional Corridors/ facilities (US, NC, SR) inter-regional movements.
Subregional TierLocal Corridors provide land access and supporting local travel.
FIGURE 7-6North Carolina Tier Definitions (Highway)
TIP Number Route
Project Description
U-3109 NC 119 Relocate NC 119 from I-85 to Mebane Rogers Road in Alamance County
Construction Year: UnfundedU-2524, U-2525
Greensboro Eastern and Western Loop(s)
Greensboro Eastern Loop from Lawndale Drive to I-40/85 in Greensboro
Construction Year: Under ConstructionR-2528 NC 24-27 Widening NC 24-27
from US 220 to Carthage in Moore County
Construction Year: UnfundedR-2413 US 220/ NC 68
ConnectorMulti-lane freeway on new location from US 220/NC 68 Intersection in Rockingham County North to NC 68 in Greensboro
Construction Year: Under ConstructionR-2579 WS Northern
Beltway (Eastern Section)
Multi-lane freeway on new location from US 52 to US 311.
Construction Year: UnfundedU-2800 Macy Grove
Road Interchange
Construct a new interchange of Macy Grove Rd. with I-40 Business
Construction Year: Under ConstructionFIGURE 7-7
Triad Regional Projects

GREENSBORO URBAN AREA 2040 Metropolitan Transportation Plan
Freight Element 7-7
Highway Freight: Conditions and Trends in the Piedmont Triad Study Area
Road conditions for freight are generally better in North Carolina than in many areas of the US. However, the region must remain vigilant to ensure that our growth does not create bottlenecks and conditions that will limit our ability to increase current and bring new business to our area.
Six programmed projects in the Triad seem to further this goal (George F. List; Robert Foyle, 2011). Figure 7-7 at left describes these six projects.
Two other challenges to freight mobility need to be addressed. The first is congestion along US 52 from I-40
to University Parkway in Winston-Salem. US 52 is a key north to south corridor between I-85 in the south, I-40 in the middle and I-74 in the north. US 52 between I-85 and I-40 is in good repair and uncongested. However, from I-40 to University Parkway the roadway is obsolete and congested. Although major construction is taking place on this segment, until it and the northern loop around Winston-Salem is completed, this transportation corridor is crippled.
The roadway network plays a critical role in efficient movement of freight. The following offers the ideal roadway network and various criteria that can be utilized in designing future roadways:
Criterion: Site DistanceTrucks are large heavy vehicles traveling at least as high a speed as most automobiles on the nation’s roadways. As such the distance that a truck driver can see the road before him/her adds additional safety benefits to the highway system.Overall Benefit: Safety, Fuel Economy
Criterion: Entrance and Exit Ramp RadiiThe most efficient entrance and exit ramp design for any motor vehicle is one that allows the vehicle to slow to a stop or turn gracefully or to enter a high speed section of highway safely and smoothly. This design takes a large amount of land and not all current highway designs are able to offer this opportunity at all times. When a tighter entrance/exit ramp is necessary, it should be understood that the larger the radii the safer the entrance/exit to/from a roadway will be. This is not only a matter of weight distribution shift as a truck enters a corner, but as well allows a “site distance safety” as well as monetary economies due to lessened brake wear and tire scrub.Overall Benefit: Safety, Fuel Economy, Operating Costs, Less
Congestion
Criterion: Truck LanesHOV (High Occupancy Vehicle) Lanes are very valuable. However, the HOV lanes force trucks (heavier and larger vehicles) into general traffic flow. This in turn creates additional congestion as trucks take longer to stop and accelerate and this in turn slows down traffic flow in general. Better to have through moving truck traffic in a lane of its own freeing the general traffic lanes for local truck traffic if entering/exiting a highway and passenger automobiles which can by their nature flow together and maintain speed easier.Overall Benefit: Safety, Fuel Economy, Less Congestion
Criterion: GradeAlthough trucks are heavy and powerful they are designed to carry loads not accelerate quickly. They have little reserve power to climb hills. The steeper a grade is designed and built, the more congestion it will create when trucks share the lanes with automobiles. To the extent practical, designers should minimize road grades.Overall Benefit: Safety, Fuel Economy, Less Congestion
Criterion: IntersectionsA car can turn in a much shorter distance than a truck. Especially if the truck in question is a tractor/trailer combination. These units can be anywhere from 60′ to 75′ in total length. Compare that to an automobile which is normally 10′ to 15′ and you can see the difficulties in designing a turn or intersection for both. From a freight perspective “always plan” for at least a 60′ unit.Overall Benefit: Fuel Economy, Safety, Operating Costs
Criterion: Lane WidthFrom freight perspective, wider is better. It can be hard enough at times to estimate the furthest edge of a road from a passenger car driver’s perspective. As a heavy freight vehicle is 8′ wide with the driver at 6′ from the road surface additional width adds a safety factor that is lacking in many newly designed road networks. In addition a wider road allows truck drivers to better see and react to traffic around them.Overall Benefit: Safety
Criterion: Road SurfaceSmoother roads allow for better fuel economies, Rougher surfaces create better adhesion. The newest technologies developed for road engineering should always be utilized.Overall Benefit: Fuel Economy, Safety, Operating Costs
FIGURE 7-8Criteria For Freight and Roadways
GREENSBORO URBAN AREA 2040 Metropolitan Transportation Plan
Freight Element 7-8
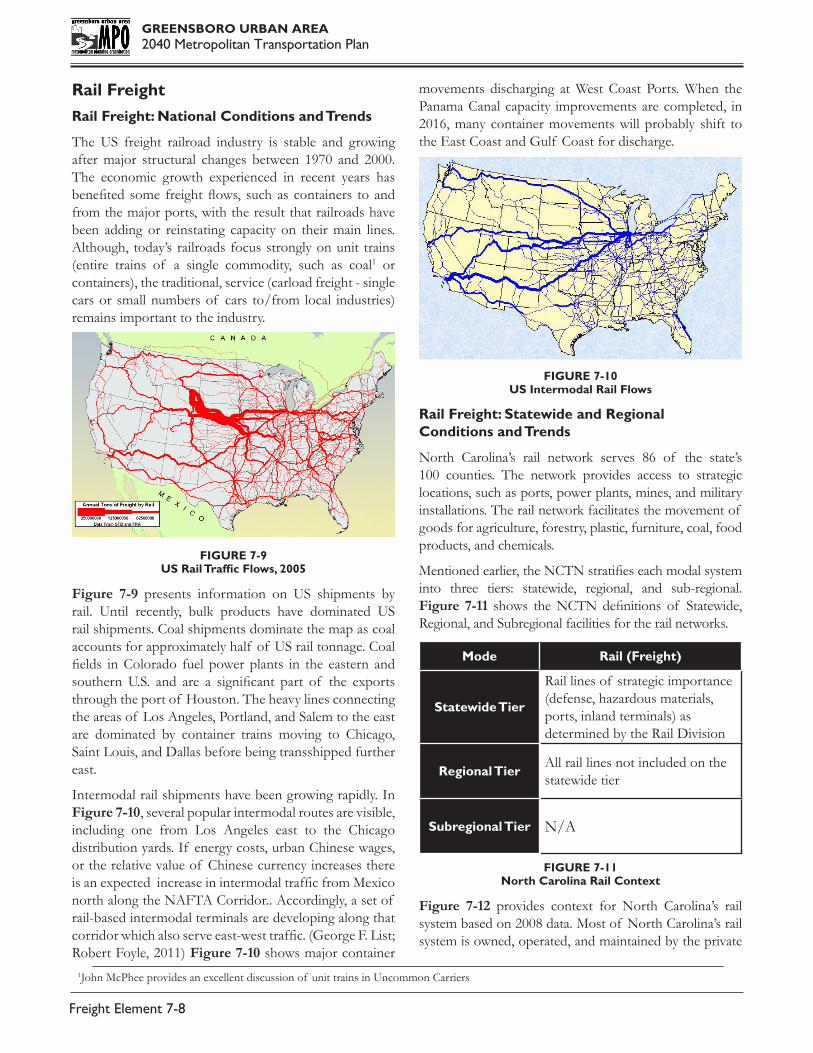
Rail FreightRail Freight: National Conditions and Trends
The US freight railroad industry is stable and growing after major structural changes between 1970 and 2000. The economic growth experienced in recent years has benefited some freight flows, such as containers to and from the major ports, with the result that railroads have been adding or reinstating capacity on their main lines. Although, today’s railroads focus strongly on unit trains (entire trains of a single commodity, such as coal1 or containers), the traditional, service (carload freight - single cars or small numbers of cars to/from local industries) remains important to the industry.
FIGURE 7-9US Rail Traffic Flows, 2005
Figure 7-9 presents information on US shipments by rail. Until recently, bulk products have dominated US rail shipments. Coal shipments dominate the map as coal accounts for approximately half of US rail tonnage. Coal fields in Colorado fuel power plants in the eastern and southern U.S. and are a significant part of the exports through the port of Houston. The heavy lines connecting the areas of Los Angeles, Portland, and Salem to the east are dominated by container trains moving to Chicago, Saint Louis, and Dallas before being transshipped further east.
Intermodal rail shipments have been growing rapidly. In Figure 7-10, several popular intermodal routes are visible, including one from Los Angeles east to the Chicago distribution yards. If energy costs, urban Chinese wages, or the relative value of Chinese currency increases there is an expected increase in intermodal traffic from Mexico north along the NAFTA Corridor.. Accordingly, a set of rail-based intermodal terminals are developing along that corridor which also serve east-west traffic. (George F. List; Robert Foyle, 2011) Figure 7-10 shows major container
movements discharging at West Coast Ports. When the Panama Canal capacity improvements are completed, in 2016, many container movements will probably shift to the East Coast and Gulf Coast for discharge.
FIGURE 7-10
US Intermodal Rail Flows
Rail Freight: Statewide and Regional Conditions and Trends
North Carolina’s rail network serves 86 of the state’s 100 counties. The network provides access to strategic locations, such as ports, power plants, mines, and military installations. The rail network facilitates the movement of goods for agriculture, forestry, plastic, furniture, coal, food products, and chemicals.
Mentioned earlier, the NCTN stratifies each modal system into three tiers: statewide, regional, and sub-regional. Figure 7-11 shows the NCTN definitions of Statewide, Regional, and Subregional facilities for the rail networks.
Mode Rail (Freight)
Statewide Tier
Rail lines of strategic importance (defense, hazardous materials, ports, inland terminals) as determined by the Rail Division
Regional TierAll rail lines not included on the statewide tier
Subregional Tier N/A
FIGURE 7-11North Carolina Rail Context
Figure 7-12 provides context for North Carolina’s rail system based on 2008 data. Most of North Carolina’s rail system is owned, operated, and maintained by the private
1John McPhee provides an excellent discussion of unit trains in Uncommon Carriers

GREENSBORO URBAN AREA 2040 Metropolitan Transportation Plan
Freight Element 7-9
sector. Of 5,767 miles of rail lines in North Carolina, 491 miles are owned by the State. The state of North Carolina owns the North Carolina Railroad Company (NCRR), with Norfolk Southern Railroad Company (NS) operating trackage rights over its 317-mile corridor from Charlotte to Morehead City. Figures 7-13 and 7-14 show the miles and locations of freight railroads operated in North Carolina, with 2,422 miles of Class I railroads comprising 72.4 percent of all railroads in the state.
NC Rank Statistic
13th in number of railroad companies 23
17th in total rail miles 3,250
32nd in originated rail tons 12,086,168
13th in terminated rail tons 58,440,018
13th in originated rail carloads 211,572
14th in terminated rail carloads 665,580
32nd in rail tons carried 103,254,917
34th in rail carloads carried 1,467,318
29th in freight rail employment 2,425
30th in freight rail wages $163.2 Million
FIGURE 7-12North Carolina Rail Context
Twenty-two freight railroad companies operate in the state:
Two Class I railroads (CSX Transportation and Norfolk Southern (NS) Railroad Company): According to size classifications established by the Surface Transportation Board, a Class I railroad had annual carrier operating revenues of $379 million in 2009.
Twenty Class III railroads: 12 short line railroads, and 8 other short line railroads that specialize in switching and terminal services. According to the Surface Transportation Board, a Class III railroad is a railway company with annual operating revenue of less than $20.5 million.
Although most short-line railroads operating in the state move freight via box car, tank or flatbed rail cars, any increase in short-line
railroad activity will have an impact on transit and transportation flow on our roads and highways at railroad crossings throughout the state.
The defined statewide and regional tiers for freight rail are shown in Figure 7-11 and Figure 7-15. The NCTN did not define sub-regional tier for freight rail because rail is not used for short distance transportation, with trips typically exceeding 300 miles. NCDOT defines the statewide tier as rail lines having strategic importance with the remainder of rail lines being considered regional tier facilities.
The most heavily used freight rail corridors in North Carolina include:
• The CSX corridor in western North Carolina serves through freight traffic and connects South Carolina to Tennessee. Coal is the predominate cargo in this corridor.
• The CSX corridor in eastern North Carolina, parallels I-95 and connects North Carolina to states from Boston, MA to Miami, FL. This corridor is the CSX north/south mainline and is the backbone of the CSX’s National Gateway 3 intermodal corridor (http://www.nationalgateway. org/news-resources/in-the-news/railroads- redraw-intermodal-map). It also carries Amtrak rail passenger traffic.
• The CSX corridor from the Port of Wilmington to Charlotte is part of CSX’s National Gateway intermodal corridor. The National Gateway ends in Charlotte but the corridor extends to Atlanta and points south.
• The 317 mile long NCRR corridor from the port
Railroad Classification Miles
Class I RailroadsCSX Transportation 1,121Norfolk Southern Railroad Company2
1,301
Subtotal Class I Railroads 2,422
Class III RailroadsShortline/local railroads 687Switching and terminal Railroads 923Subtotal Class III Railroads 3,345
Total 5,767FIGURE 7-13
Railroad Classification

GREENSBORO URBAN AREA 2040 Metropolitan Transportation Plan
Freight Element 7-10
FIGURE 7-14North Carolina Freight Railroad Network, 2011
2Includes Operating Rights on 317 miles of the NCRR.3The National Gateway is intended to create a double-stack cleared, state-of-the-art rail corridor linking East Coast Ports with population and manufacturing centers in the Midwest.
FIGURE 7-15North Carolina Freight Railroads Multimodal Investment Network

GREENSBORO URBAN AREA 2040 Metropolitan Transportation Plan
Freight Element 7-11
of Morehead City to Charlotte. The line parallels I-40 and I-85. NS has exclusive track rights on the NCRR. Between Charlotte and Greensboro is the NS mainline, which is part of its Crescent Corridor. The corridor is a heavily traveled intermodal corridor connecting New Jersey to New Orleans. This corridor also serves passenger rail and is included in the Southeast High Speed Rail Corridor. North Carolina’s Raleigh to Charlotte passenger service (the Piedmont and the Carolinian) uses this corridor as does Amtrak’s Crescent from NY to New Orleans, LA.
Despite the strength of these lines, North Carolina is critical to neither the NS nor the CSX. One estimate is that less than 2% of the revenues for either railroad are derived from shippers in North Carolina. The implication might be that the state needs a strategic plan that relies on partnerships with short lines or shared rights-of-way.
Figure 7-16 shows North Carolina’s railroad network. The primary interest of CSX lies in its north/south main line stretching Weldon to Rowland, through Selma and Fayetteville where it intersects with NS. The primary interest of NS is its north-south main line from Lynchburg (VA) to Greenville (SC) through Greensboro to Charlotte, where it intersects with CSX. There are other secondary lines in the state as well as locations served by both CSX and NS: Goldsboro, Colon, and Cary to Raleigh. Arguably, the entire length of the Aberdeen, Carolina, and Western Railway Company is also served by both Class 1 railroads since the ACWR interchanges with both CSX and NS. The same is true for the Carolina Coastal Railway (CLNA) between Raleigh and Wilson and the Aberdeen & Rockfish Railroad (AR).
It is necessary to have a tiered network approach to railroad network planning. There is also value in developing a sense of the types of railroads that would be best to operate different parts of the network, Class I railroads versus short lines, and where service by the two Class I railroads is needed. Figure 7-15 illustrates one realization of this tiered network idea, borrowing from the highway network ideas of interstates, state highways, and local “roads”.
North Carolina has two “interstate” quality rail lines (high performance lines). One is the CSX north-south main line from Petersburg (VA), through Rocky Mount, Selma, and Fayetteville to Florence (SC). The other is the NS north- south main line from Lynchburg (VA), through Danville, Greensboro, and Charlotte to Greenville (SC).
The state might want to develop more east-west high
performance lines. The goal of the east-west line would be to reach the Midwest and the Mississippi River at Memphis and St. Louis. One option is the CSX east-west main line from Wilmington, through Monroe, Charlotte, and Marion to Johnson City (TN). In the east it has the longest stretch of tangent (straight) track in the US but steep grades and crooked track lines in western North Carolina limit speed through the Blue Ridge Mountains. It is used primarily to bring coal out of the Appalachians. Improving the alignment to main line standards would be expensive and require work in two states. Another option involves a combination of the CSX east-west main line from Wilmington through Monroe, but not Charlotte, to Chester (SC) and then back into North Carolina via NS from Spartanburg (SC), through Asheville into Tennessee. Upgrading this line would is cost prohibitive and would involve putting the Saluda Grade back in service. Another solution would be to use the CSX main line from Wilmington through Monroe to Chester (SC) and not attempt to create an in-state route through the North Carolina Mountains. Two other reasonable options are available on the NS. One possible route is from Morehead City west through Raleigh to Greensboro, and then north to Lynchburg, VA. The second is similar, from Morehead City west through Raleigh and Greensboro to Winston-Salem, and then north to Roanoke, Virginia.
The rest of the rail lines in a third tier are shown in Figure 7-16. These would have a local focus, either for short hauls or pick-up and delivery to and from shippers and consignees. This third-tier network could be operated by short lines, whose cost structures make short-distance moves more profitable. These short line operators could be local to the state or subsidiaries of national holding companies. Short-line companies tend to have stronger interest in local businesses, they provide more frequent service, run shorter trains, and are invested in the success of the state’s economy.
The railroad business model is for trains and crews to operate only on tracks owned or leased by their railroad. Railroads charge fees for hauling freight in other brand cars. A challenging, but valuable idea is to treat the second and third tier lines as public rights-of- way, over which any rail carrier can operate. This idea, suggested by Robert L. Banks and others in the 1970’s, is at least 40 years old. Except in limited instances, where governments have argued successfully before the Surface Transportation Board (and the earlier Interstate Commerce Commission) to provide track rights for multiple carriers over a particular rail line, this shared use idea has not been popular. Pursuing this idea could lead to more competitive rail rates

GREENSBORO URBAN AREA 2040 Metropolitan Transportation Plan
Freight Element 7-12
FIGURE 7-16North Carolina Railroad Network With Corridors Marked
4Houston Power & Lighting Company took similar approach by building a second rail line to serve a large coal-fired generating station in Texas. By introducing competition into the logistics mix Houston Power saved $10 Million the first year and gained flexibility and redundancy in their supply chain. This case is discussed in Shell’s Bargaining for Advantage.
and higher quality service to the ports of Wilmington and Morehead City and to strategic development locations such as Global TransPark4.
The goal of this strategy is to achieve two objectives:
1. Have a high-quality railroad network that connects to the major industrial locations in the state; and
2. Get high quality service at reasonable rates, from the railroads that operate over these lines.
Several specific improvements that seem helpful from a logistics perspective, surfaced during the review conducted for this project. They include:
• Restoring the line from Wallace to Castle Hayne;
• Building a wye (triangular junction) in Pembroke;
• Getting two-carrier service to both the State ports;
• Completing the wye on the branch that services MOTSU (Military Ocean Terminal at Sunny Point);
• Providing more direct service to the Port of Wilmington, one that eliminates crisscrossing the City of Wilmington multiple times;
• Simplifying the rail alignments through Charlotte; and
• Eliminating single-track sections along the main lines–Greensboro to Raleigh, Charlotte to Greensboro, and along the entire CSX main line.
Improvements at site specific locations would also be beneficial such as, improving access to Morehead City (including Radio Island), building a larger local yard west of Morehead City to help service the port; and reorganizing the tracks in Goldsboro, as well as Raleigh, Greensboro, and Winston-Salem; and bypassing cities like New Bern.

GREENSBORO URBAN AREA 2040 Metropolitan Transportation Plan
Freight Element 7-13
Rail Freight: Condition and Trends in the Piedmont Triad Study Area
Proposed Piedmont Triad Regional Freight Villages5 based on NC Governors Logistics Task Force – 7 Portals Report
1. Burlington (Alamance County Ind. Dev. Corp./ Burlington/Alamance AP): There is rail service on the north side of the airport, running E-W.
2. Greensboro (Aerotropolis site at PTI): NS trackage is adjacent to the site.
3. Montgomery/Moore (The Heart of NC Mega-site): The site is near the Montgomery Airport and the railroad is near the airport (Aberdeen), about 2 miles from the site; it would be easy to construct a rail spur into the area; there are connections to CSX in Wadesboro and NS in Albemarle.
4. Winston-Salem (Smith Reynolds Airport): NS trackage is adjacent to the site. (Seven Portals Study, page 107, 2011)
Rail freight transportation in the Winston-Salem Urban Area is operated by three different railroads, the Yadkin Valley Railroad, the Winston-Salem Southbound Railway, and the Norfolk Southern Railway.
The Yadkin Valley Railroad Company is owned and operated by Gulf and Ohio Railways of Knoxville, TN and operates in the counties of Forsyth, Stokes, Surry, and Wilkes. The railroad carries forest products, coal, grain, and fiberboard. The Yadkin Valley Railroad has
two lines, one from Rural Hall to Mount Airy and one from Rural Hall to North Wilkesboro. Both lines connect to the Norfolk Southern Railway at Rural Hall.
Norfolk Southern Railway (NS) is owned and operated by Norfolk Southern Corporation headquartered in Norfolk, VA. NS connects the Winston-Salem Urban Area to Roanoke, VA in the north and Greensboro in the east. NS also owns a currently unused line that connects Winston-Salem with Charlotte. One of the largest commodities carried by the railroad is automobiles. NS operates an automobile distribution center in Winston-Salem. In October of 2011, Norfolk Southern announced the expansion of its Triad freight operations with a dedicated double-stack train service to the Triad, from the Port of Norfolk. The new service runs 6 days per week and continues south on to Atlanta.. This additional intermodal capacity to/from Norfolk ports increases truck movement on the I-85/I-40 corridor within this MTP’s study area, as well as the Patterson Street intermodal connector in Greensboro. The Triad stands to gain volume and business as the Port of Norfolk is the only east coast port with the capacity to handle the large vessels that will benefit once the Panama Canal widening project is completed in 2016. To assist with this possible congestion scenario, the Greensboro MPO has identified a project known as the Norwalk Street Connector, which would provide alternate access to I-40 using Patterson Street or full access to I-40 via Wendover Avenue
Winston-Salem Southbound Railway (WSS) began service in 1910 and is independently operated but CSX and
5“a defined area within which all activities relating to transport, logistics and the distribution of goods, both for national and international transit, are carried out by various operators.” (NC Governors Logistics Task Force, 7 Portals report December, 2011. Additional information concerning NC Freight Villages may be obtained in this report (section 2.5 pages 41-48) and may be located at: http://www.ncdot.gov/doh/preconstruct/tpb/research/download/2010-34-0masterfinalreport.pdf
FIGURE 7-17Double-Stack Train at Pomona Yard

GREENSBORO URBAN AREA 2040 Metropolitan Transportation Plan
Freight Element 7-14
NS each own half of its stock. WSS connects Winston-Salem and Forsyth County to Lexington, Albemarle, and Wadesboro to the south. The railway operates in Forsyth, Davidson, Stanly, and Anson Counties. The railroad carries grain, sand, gravel, stone, forest products, paper products, coal, coke, cement, clay, fertilizer, chemicals, aluminum, iron, and steel. One of the principal shippers is Ingredion Corporation, manufacturers of corn syrup and related products in Winston-Salem. WSS connects with NS in Winston-Salem on the north end and with CSX in Wadesboro on the south end. WSS also connects to High Point, Thomasville, and Denton Railroad (HPTD) and Aberdeen, Carolina, and Western Railroad (ACWR) along the railway. (LRTP of Winston-Salem Area, 2009)
The High Point, Thomasville & Denton Railroad Co. (HPT&D) operates from High Point through Thomasville and Denton to a junction with the Winston-Salem Southbound Railway at High Rock. The company, founded in 1923, is owned by the Winston- Salem Southbound Railway. The railroad carries forest products, paper products, chemicals, brick, coal, cement, and furniture. Principal shippers are: Thomasville Forest Products of Shale Brick – a division of Lowes Inc.; Carolina Container Corp. of High Point –manufacturer of pulp board; and Georgia Pacific of Denton – chemical manufacturer.
Working with the North Carolina Railroad (NCRR), NS Railway and CSX Transportation, the NCDOT is upgrading existing rail corridors to improve safety, efficiency and capacity for freight and passenger train services. The first phase of improvements is scheduled along the North Carolina Railroad. The 317- mile, state owned corridor links Charlotte, Greensboro and Raleigh and extends to the state’s seaport at Morehead City. Norfolk Southern Railway operates trains along the entire corridor under a lease agreement with NCRR. CSX Transportation shares operation of a portion of the NCRR’s corridor between Raleigh and Cary.
At one time, the whole corridor between Greensboro and Charlotte had two tracks. Portions of the second track were removed in the late 1960’s as part of a signal system improvement. Railroad traffic has significantly increased since that time and additional capacity is now needed. Rebuilding the second track in four separate areas will create a 92-mile stretch of double-track railroad, between Greensboro and Charlotte. This long double-track section will allow freight and passenger trains to meet or pass one
another without slowing down to enter a siding, resulting in increased corridor capacity and improved traffic flow and schedule reliability.
Concerning Southeast High Speed Rail Projects in the Greensboro Urban Area, NCDOT has been awarded $545 million from the American Recovery and Reinvestment Act to support implementation of Southeast High Speed Rail Corridor (SEHSR). $520 million in improvements are anticipated between Raleigh and Charlotte, to enable higher speeds and more reliable service through the corridor while improving rail security. The goal of the SEHSR corridor upgrade is to allow trains to travel between Charlotte and Washington, D.C. at speeds of 90-110 miles per hour (mph) and an average speed of 86 mph. NCDOT’s original request was for $5.2 billion, which is the current estimated cost, to fully complete SEHSR improvements in the state.
Since the USDOT designated Charlotte to Washington, D.C. as a high-speed rail corridor in 1992, the N.C. Department of Transportation has invested more than $300 million in the state’s intercity passenger rail service for renovation and construction of train stations, track work improvements and corridor preservation projects in order to pave the way for high-speed service. The ARRA funding requires projects to meet readiness criteria that will enable them to move to construction in the near term. Corridor wide, the improvements include expanding all single track sections to double track, removing and improving crossings, and station security upgrades.
Another project built an 8.7-mile section of second main track on the old roadbed (east of the existing track) between “Cox” in west Greensboro and near Hoskins Street in High Point. New crossovers will be constructed to allow trains to quickly change from one track to the other at Cox and at Hoskins. The project cost an estimated $20 million and was completed in December of 2009.6 The new double track section improves reliability and traffic flow, increases capacity and results in gains of at least one minute of travel time per train.
Through track and signal improvements, the NCDOT has reduced the travel time between Raleigh and Charlotte by more than 35 minutes since the work began in 2001. In addition to reducing the travel time, the work increases efficiency and reliability for both freight and passenger trains in the corridor (High Point Enterprise).
6News & Record http://www.news-record.com/content/2009/12/16/ article/work_ends_to_expand_railroad_tracks_between_ greensboro_high_point.

GREENSBORO URBAN AREA 2040 Metropolitan Transportation Plan
Freight Element 7-15
Current and Future IssuesEntire Freight System: Statewide and Regional Current and Future issues
State Departments of Transportation (DOTs) have a historic linkage to freight and freight movements. This linkage dates to the early days of DOTs, when their primary focus tended to be on creating “farm to market” roads to meet basic societal needs - bringing food from the point of production (the farm) to where people live (cities and towns). Accordingly, including freight considerations in the transportation process is not a new trend than a revisiting of a historical relationship.
Compared to the historic role of freight in DOT activities and planning, recent efforts to incorporate freight considerations into the transportation planning process tend to be reflective of shifts toward the use of global rather than national or regional supply chains. In a global supply chain environment (where markets are operating freely), it is natural and predictable that labor-intensive industries would tend to locate in areas where labor costs are low (subject to the impact of transportation costs), while industries that tend to be capital-intensive(or for which transportation costs are a major component of final product cost) are less affected. These predictable trends have proven true in the United States and North Carolina and have had significant impacts on many domestic industries such as textiles, furniture, and other industries with similar economics. However, predicting the industry and employment impacts does not change the difficulty associated with adjusting to the job losses and industry displacements associated with these market-driven adjustments or the desire for governments to attempt to avoid or mitigate the effects of these changes. Such mitigation efforts can include using transportation system projects to encourage the location of new businesses or to improve the competitive standing of existing businesses.
Because of the factors noted above, the Federal Highway Administration (FHWA) and state DOTs are increasingly devoting resources to understanding and determining how to best incorporate freight considerations into transportation planning and/or project selection. Specifically, the FHWA, through the efforts of its Offices of Planning and Freight Management and Operations, has sponsored the development of, and/or compiled a considerable library of, resources directed to this topic. Specific tools include freight data sources, demand modeling tools, guides, and technical resources directed to practitioners to incorporate freight in their state planning activities. Additionally, a number of
state DOTs have actively been developing state-specific models for including freight in both project planning and prioritization efforts. The Florida Strategic Intermodal System prioritization model represents one of the most mature and comprehensive efforts to systemically incorporate freight into the project planning and prioritization process. Other notable state DOT efforts to include freight in transportation planning include Indiana, Minnesota, Ohio, and Washington. (2040 North Carolina Statewide Transportation plan, page 2-25, 2012) While the FHWA and NCDOT are looking at various models to better include freight flow and logistics into planning efforts, the models and tools are not currently at a sufficient level of detail to be useful at regional and county levels.
Triad MPO Freight Survey
The FHWA Strategic Highway Research Program (SHRP) provides grant funding to encourage the development of new technologies and processes for transportation. In support of evaluating freight at the planning the Triad MPOs applied for and were awarded the Strategic Highway Research Program (SHRP2) grant. The research program sponsored by FHWA provided funding for Freight Demand Modeling and Data Improvement. The Triad MPOs, along with PART, were awarded funding for the Freight Data Improvement. As noted above, the freight component at the planning and project selection is challenging. The purpose of the grant was to encourage government entities to further explore and document new approaches to freight demand modeling or data collection that would enhance decision making.
The MPOs and PART secured a consultant team to conduct Phase I of a 3-phased approach. Phase I included collecting data to support development of an advanced freight model. The consultant team, consisting of Parsons Brinkerhoff, Westat, University of Maryland, and the N.C. Center for Global Logistics, conducted surveys and created GIS based maps with almost a 1,000 freight nodes. Over 150 surveys were completed in the Triad MPO area, with the largest percentage in Guilford County. The survey provided data on the freight company’s operations in terms of routes used and number of trucks. The data provided to the Triad MPOs is confidential but the survey also asked about current issues, which the MPOs will review and evaluate with local and state officials for short term solutions. The Triad MPOs will continue to improve the freight component of the demand model through Phase II (development of the freight model) and Phase III (facilitate travel diary data collection). Figure 7-18 shows the top ten NAICS descriptions of the freight companies that completed a survey.

GREENSBORO URBAN AREA 2040 Metropolitan Transportation Plan
Freight Element 7-16
This report acknowledges the linkage of economic growth to the state’s transportation infrastructure. However, while the freight/economics/transportation linkage was generally understood, the report did not define how freight/logistics considerations should be weighted within NCDOT’s project prioritization and selection process. (2040 North Carolina Statewide Transportation Plan, 2011) Although NCDOT acknowledges the importance of freight planning, it needs assistance from industry and transportation planners to decide how to evaluate the data. With this team effort, regional freight planning can partner with NCDOT to supply the information and needed to make “informed” decisions.
3 Digit NAICS Code Count NAICS Definition (2012)
484 23 Truck transportation
423 22 Merchant wholesalers, Durable Goods
337 11 Furniture and Related Product Manufacturing
541 11 Professional, Scientific, and Technical Services
332 9 Fabricated Metal Product Manufacturing
326 6 Plastics and Rubber Products Manufacturing
333 6 Machinery Manufacturing
313 5 Textile Mills
315 5 Apparel Manufacturing
325 5 Chemical Manufacturing
FIGURE 7-18Top Ten NAICS Description for Completed Surveys
Highway Freight: National Current and Future Issues
Across the nation decision-makers are realizing that system maintenance is just as important as adding capacity and today’s funding streams are (a) inadequate to the task, and (b) have begun to decrease. Much of current congestion occurs at bottlenecks on the highway system—specific locations that experience recurring congestion and backups because traffic volumes exceed highway capacity. The American Trucking Association
estimates that the annual cost of delay from bottlenecks comes to $19 billion. Our economy depends on a well- functioning and efficient transportation system, which in turn depends on the capacity and condition of the underlying infrastructure—our highways, bridges, rail lines, tunnels, ports, harbors, and channels. We know demand for freight transportation is growing. We know this will exacerbate congestion that already is adding to shipper and carrier costs. We know where the bottlenecks and choke points are, and we know how to fix them. We are not addressing these problems because few state transportation agencies have the money to implement the solutions. Several major projects that would create both regional and national benefits, have costs too high to be funded by a single state. (Transportation reboot) However, as we mentioned on page. 1, the third suggestion in “10 Steps to an Effective National Freight Policy” to create a competitive freight discretionary program, and the fourth suggestion, to strengthen and diversify freight funding sources could assist funding stream development. The national USDOT TIGER grant program addressed a number of major freight bottlenecks including, the I-85 Bridge over the Yadkin River, Norfolk Southern Rail Road’s Crescent Corridor Project and the Appalachian Regional Short Line Rail Project (which shows the increasing importance of Short Line Railroads in the national freight infrastructure. In addition, the MAP-21 reauthorization bill created a new competitive project of national significance program that will help with fund development. Despite these first steps, there is still a need for greater emphasis on national issues.
Highway Freight: Statewide and Regional Current and Future Issues
Freight mobility through North Carolina’s highway network will rely on improvements that provide direct and timely access for trucks to port facilities from inland freight nodes and facilities, including rail intermodal facilities, manufacturing, agricultural production, warehousing and distribution centers.
Based on the maritime market opportunities identified for North Carolina, investment in the US 70, I-73/I-74, and I-40 highway corridors has the greatest potential for reducing trucking travel times within the state. Focused investments along these targeted freight corridors is also consistent with the 2010 Statewide Logistics Plan recommendations for highway improvements, including creation of a multimodal corridor between Charlotte and Wilmington and enhancing the primary highways of the National Truck Network in North Carolina. The Logistics Plan also recommends improvements to I-95 to support

GREENSBORO URBAN AREA 2040 Metropolitan Transportation Plan
Freight Element 7-17
pass–through traffic; while there are many benefits to the enhancement of this vital corridor, improvements to I-95 were not demonstrated to support the specific market scenarios evaluated under this study. (North Carolina Maritime Strategy, page 104, 2012)
The roadway needs estimate was developed with assistance from several NCDOT Business Units and all seventeen MPOs in the state. The highway mobility estimate was completed in two parts. Each MPO provided an estimate for highway needs within its jurisdiction based on local plans. For areas not in an MPO, an estimate for highway widening was developed based on a volume-to-capacity analysis using a GIS database developed by the NCDOT GIS Unit and SPOT (Strategic Planning Office of Transportation). In addition, the highway mobility estimate includes the policy-driven estimate for completion of urban loops and the intrastate system. The highway safety needs estimate was developed by the NCDOT Traffic Safety Unit and includes funding needs for the Spot Safety, Hazard Elimination, and High Risk Rural Road safety programs. The infrastructure health needs estimates were developed by the NCDOT Pavement Management and State Road Maintenance Units. (2040 North Carolina Statewide Transportation Plan, page 3-10, 2012)
Rail Freight: National Current and Future Issues
Nationwide forecasts suggest that long-term economic growth will create demand for substantial capacity growth on the main rail corridors – and that the railroad industry will not be able to pay for all the additional capacity on its own. Public-private partnerships are likely to be a key funding mechanism for achieving the necessary capacity. Railroads are increasingly open to strategies that combine public funding of public benefits (principally reductions in truck traffic) with railroad funding of private benefits. In particular, states and municipalities are increasingly recognizing the public benefit of diverting truck traffic from highways to railroads. (LRTP of Rock Hill Fort Area)
FHWA has served as the lead agency on many state rail system projects because they have more staff resources than the FRA. FHWA is involved in safety improvements as related to railway grade crossings through Section 130, of its Highway Safety Program.
The Rail Safety Improvement Act of 2008 updated safety regulations and authorized the installation of new train control systems on all routes that handle certain classes of hazardous materials. The new regulations take effect at the end of 2015. (2040 North Carolina Statewide
Transportation Plan, page 7-7, 2012)
Rail Freight: Statewide and Regional Current and Future Issues
In 2008, the North Carolina General Assembly established the House Select Committee on a Comprehensive Rail Service Plan for North Carolina to study development of a comprehensive rail plan. The committee identified freight rail needs, including rail capacity to promote economic development, better service for the military and ports, accommodating heavier rail cars (286,000 pounds), and addressing rail and highway congestion.
In its 2009 final report the 21st Century Transportation Committee recommended:
• Using more rail to transport freight;
• Investing in rail connections between intermodal facilities and inland ports;
• Restoring abandoned rail lines; and
• Expanding and upgrading passenger, freight, commuter, and short line service.
In 2007, the General Assembly instructed the Office of State Budget and Management to develop a Statewide Logistics Plan to address long-term economic, mobility, and infrastructure needs. Short- and mid-term freight rail- specific recommendations in the plan include:
• Encourage further development along the Crescent Rail Corridor (0 to 5 years);
• Retain existing rail corridors; halt track removal (0 to 5 years);
• Support short line infrastructure improvements (0 to 5 years);
• Coordinate schedules to optimize freight and passenger services (5 to 15 years);
• Create a Charlotte to Wilmington multimodal corridor (5 to 15 years); and
• Expand high-use corridor capacity (5 to 15 years).
NCDOT has pursued multiple initiatives to increase safety on the state’s freight rail systems. These new programs include the Crossing Hazard Elimination Program, Sealed Corridor Program, Private Crossing Safety Initiative, and Safety Oversight Program.
Improvements to the Southeast High-Speed Rail Corridor will benefit freight transportation, double (or triple) tracking will increase the train capacity and freight movement efficiency in the affected areas, and

GREENSBORO URBAN AREA 2040 Metropolitan Transportation Plan
Freight Element 7-18
the Sealed Corridor Program will improve trackside safety. NCDOT has been awarded $545 million from the American Recovery and Reinvestment Act to support implementation of Southeast High Speed Rail Corridor (SEHSR). $520 million in improvements are anticipated between Raleigh and Charlotte to enable higher speeds and more reliable service through the corridor while improving rail security. Although this funding is to be utilized for increasing the capability of passenger traffic, any upgrades to the rail system in North Carolina will benefit freight movement as both passenger and freight trains operate on the same tracks.
Major strategic freight rail transportation initiatives will benefit freight rail. These efforts include the NS Crescent Corridor, the CSXT National Gateway, the doubling of the CSXT intermodal yard in Charlotte, and the relocation of the NS intermodal yard in Charlotte. The NS intermodal yard relocation is a $100 million joint venture among NS, the state, the City of Charlotte, the federal government, and the Charlotte Douglas International Airport. These initiatives will improve efficiency and cost-effectiveness of the freight rail network.
Freight System: Current and Future Issues Within the Piedmont Triad Study Area
The three goals of the region are:
1. Be recognized as the Premier Logistics Center of the East Coast of the United States by providing reliable and efficient regional access to air, highway, and rail infrastructure for companies operating within the area.
2. Be a major player in the aviation industry, including companies that engage in aircraft design and construction, aviation parts manufacturers, and aviation services providers. The aviation industry continues to generate economic and job growth. Most of the aviation related activity in the region is happening at the Piedmont Triad International Airport but aviation-related activity is rapidly spreading throughout the region, notably in Winston-Salem, Davidson County and the area surrounding Burlington-Alamance Airport.
3. Fulfill the potential of the Aerotropolis/NC Center for Global Logistics initiative which targets the melding of business, education, research, and planned economic development to provide a blueprint for a vibrant future for the Triad Region and the entire state. The elements of the initiative operate synergistically to provide the leverage and
mass needed to promote economic development, job growth, and educational opportunity in the region and state. (Seven Portals Study, page 84, 2011).
Given the Piedmont Triad’s logistics and other assets which are reinforced by the FedEx Mid-Atlantic hub, the Region has a good opportunity to create a world-class competency in multi-modal logistics that will strengthen the traditional manufacturing economy and attract new industries such as aerospace equipment, medical devices, microelectronics, and pharmaceuticals. The Piedmont Triads combination of location, interstate highways, PTI and its new FedEx hub give the Region a competitive advantage that can help brand the Piedmont Triad the same way that RTP and research has branded the Raleigh-Durham-Chapel Hill area and financial services has branded Charlotte. Beyond branding, the Piedmont Triad’s combination of logistical assets gives the Region an economic advantage that has the potential to create tens of thousands of new jobs in the 12-county Region.
With the above in mind, an area that should be paid close attention to is the region’s push to develop a major economic driver called a “Mega-Site”. Because economic development efforts are competitive and as they have far reaching impact to job creation, real estate values and incentive packages, the information, in the following image and paragraphs, are gleaned from open sources (press, publications, internet, etc.)
FIGURE 7-19Piedmont Triad Proposed Mega-Site Locations
There are four locations being considered as a focus for regions efforts to create a mega-site. Figure 7-19 shows the locations and the descriptions are below:
3. Berry Hill, Virginia
1. Heart of NC
2. Davidson County
4. Randolph County

GREENSBORO URBAN AREA 2040 Metropolitan Transportation Plan
Freight Element 7-19
1. Heart of North Carolina MegaPark straddling Moore and Montgomery Counties just east of I-73;
2. Davidson County Industrial Park near I-85;
3. Berry Hill Mega Park in Virginia near the intersection of Rockingham and Caswell County in North Carolina and Pittsylvania County in Virginia, and
4. Greensboro- Randolph County Mega-site north of Liberty near US 421.
Success at any of these sites will have a major impact to traffic and freight flow in the region. Not only will the areas outlined in the comments below have a significant increase in traffic flow, the area surrounding the possible sites and the region in general will see a major increase in commuters and freight flow due to the increase of workers and suppliers of the company or companies that would locate to these sites. Further, with manufacturing now a global endeavor, freight flowing to and from container ports will impact traffic congestion. Import and export freight movement would primarily increase on I-40 and I-85, the major routes into and out of the region from the ports of Norfolk, Wilmington and Charleston. In addition, intermodal cargo movements will increase along these routes with a major impact at the Norfolk Southern Intermodal ramp in Greensboro (Patterson Street). Without room to grow, the Greensboro intermodal ramp may need to shift cargo movement to its alternative NC facility in Charlotte facility.
Basic comments concerning each location mentioned above:
1. Heart of North Carolina MegaPark – The impact to the study capture area in this case would be primarily at the intersections of I-73 and I-85 as well as I-74 and I-85. In addition, freight flow on I-85, I-40, and other major arteries would be affected. Southern traffic flow would have no major impact. The Greensboro MPO has identified projects that address maintenance and upgrades to affected roadways. They include the following:
• R-952- I-40 Business /US 421: Pavement and Bridge Rehabilitation from Linville Rd. to west of Sandy Ridge Rd.;
• I-4921- US 220: Upgrade to Interstate Standards from I-85 to Asheboro.
2. Davidson County Industrial Park – Although the site is no longer being marketed as a mega-
site, the industrial park would still impact major roadways. The impact area is expected on the I-85 corridor as it moves northeast through the region as well as Highway 52, which would be a natural artery to I-40 and beyond. With the current issues as they exist today at Hwy 52 and I-40, this is an area to watch very carefully. Freight traffic moving southwest on I-85 would also increase; however this would not impact our region unless there was a major accident that backed up traffic.
3. Berry Hill Mega Park – As this site is in southern Virginia, the major impact to the region would be freight moving south along both Highway 29/I-785 and possibly on Highway US 220/I-73. The intersections of these roadways in Greensboro would become major bottlenecks. Depending upon the entrance/ exit ramp design, the loop around Greensboro could alleviate this and should be completed before this mega-site begins affecting regional traffic and freight flow. R-4707, a project in the Greensboro MPO, identifies improvements to the interchange at Reedy Fork Parkway. The project includes reconfiguration of the interchange and improvements to Reedy Fork Parkway and Summit Avenue. In addition, the MPO has also identified a project that would upgrade US 29 to Interstate Standards and widen it from south of Reedy Fork Parkway to Rockingham County. Funding is in place for projects on the west side of Guilford County for US 220 (widening from US 220/ NC 68 Connector to Horse Pen Creek) and for the US 220/ NC 68 Connector (widening and new location project from US 220/ NC 68 intersection in Rockingham County to NC 68).
4. Greensboro-Randolph County Mega-site – Understanding that any recruitment of a large manufacturing company will have major impact to this area of the region, the prime freight flow impact will occur at the intersection of Highway 421 and I-85. This will lead to increased traffic on I-85 north and south as well as on I-40 east. Fortunately the I-85 expansion project has been completed and is designed and constructed to handle much more traffic than currently exists.
The Region already has two examples of the impact large employers can have on the transportation network. As the Caterpillar plant in Forsyth County continues to expand there will be big increase in freight at the Union Cross Road interchanges with I-40 and US 311. Trailers hauling new heavy equipment have capacity, durability, and safety

GREENSBORO URBAN AREA 2040 Metropolitan Transportation Plan
Freight Element 7-20
impacts on Union Cross Road and at the two interchanges. In Davie County, the Ashley Furniture manufacturing facility could add as many as 200 trucks per day on I-40 and affect all major regional highways and interstates. In addition, as Ashley Furniture is a major importer from the Far East we can expect increased container traffic flow from the Port of Wilmington along the I-40/I-85 corridor.
Regional transportation planners need to maintain a very close working relationship with all economic development groups in the region and most specifically the North Carolina Department of Commerce. Now economic development in one county affects the surrounding counties and the shared transportation network.
NC PortsThe North Carolina State Ports Authority is an Enterprise agency reporting to the NCDOT. The North Carolina ports system is owned and operated by the North Carolina State Ports Authority (NCSPA), an independent public agency that is not a part of NCDOT and does not received dedicated state funding for operating or capital expenditures. The North Carolina ports system consists of two seaports (Wilmington and Morehead City) and two inland terminals (Charlotte and Piedmont Triad, located in Greensboro). The inland terminals at Charlotte
and Greensboro are served by I-77 and I-85, and I-40 and I-85, respectively. CSX and Norfolk Southern rail lines run through both cities. (2040 North Carolina Statewide Transportation Plan, page 10-1, 2012)
For many years, ships using the Panama Canal have been limited to dimensions of less than 1000 feet of length, 107 feet of width (beam) and 41 feet of depth. At the time of this report, roughly 37% of cargo vessels are too large to use the Canal. However, Panamanian government is funding a project to improve the canal that will eliminate the size restrictions and significantly increase the number of ships that can traverse the Canal during the year. This widening will have significant impacts on the ports of call for the world’s container ships. Once the largest vessels can traverse the Canal, all ships from Asia can travel directly to Port Elizabeth, Norfolk, and other east coast and gulf coast ports. Figure 7-20 shows shipping patterns will heavily focus on direct shipments through the Panama Canal as well as trade lanes through the Suez Canal. The largest ships may even travel around the world, both east- and west-bound, and make stops at ports in the same direction on a continuing basis, rather than shuttling back-and forth across the Pacific or to- Europe-and-back through the Suez Canal. (Seven Portals Study, page 17, 2011)
More than 60 percent of foreign imports to North
FIGURE 7-20Emerging Global Trade Patterns
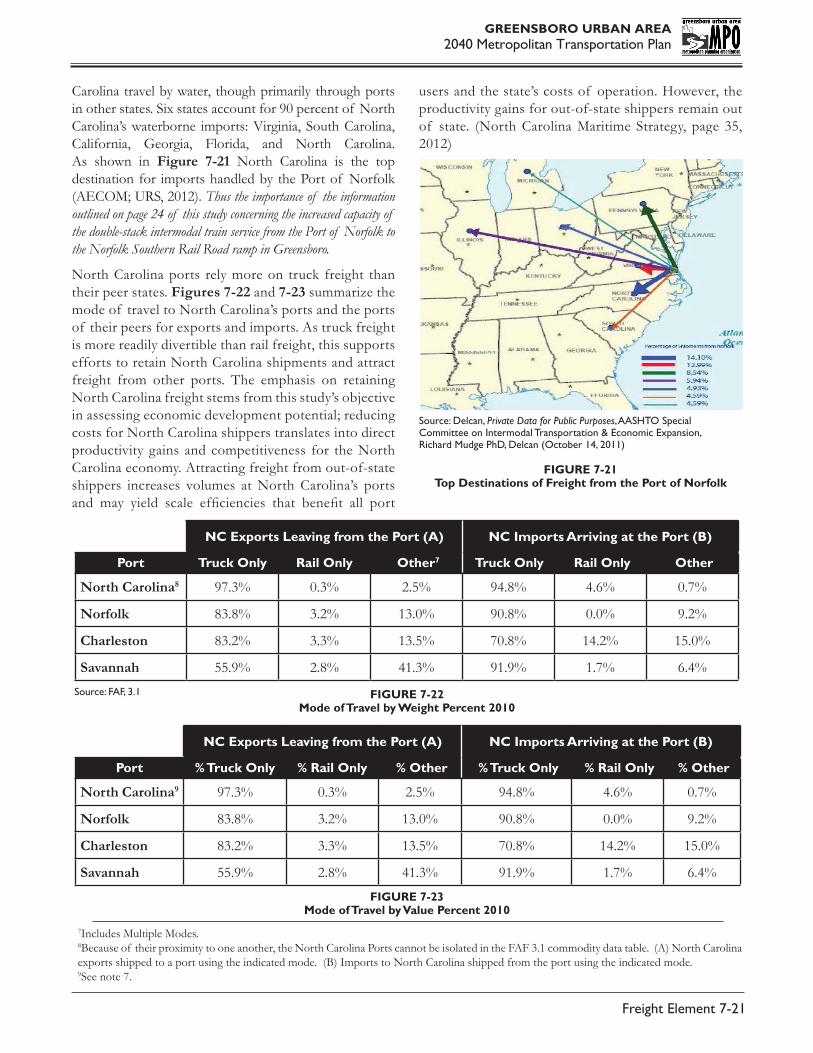
GREENSBORO URBAN AREA 2040 Metropolitan Transportation Plan
Freight Element 7-21
Carolina travel by water, though primarily through ports in other states. Six states account for 90 percent of North Carolina’s waterborne imports: Virginia, South Carolina, California, Georgia, Florida, and North Carolina. As shown in Figure 7-21 North Carolina is the top destination for imports handled by the Port of Norfolk (AECOM; URS, 2012). Thus the importance of the information outlined on page 24 of this study concerning the increased capacity of the double-stack intermodal train service from the Port of Norfolk to the Norfolk Southern Rail Road ramp in Greensboro.
North Carolina ports rely more on truck freight than their peer states. Figures 7-22 and 7-23 summarize the mode of travel to North Carolina’s ports and the ports of their peers for exports and imports. As truck freight is more readily divertible than rail freight, this supports efforts to retain North Carolina shipments and attract freight from other ports. The emphasis on retaining North Carolina freight stems from this study’s objective in assessing economic development potential; reducing costs for North Carolina shippers translates into direct productivity gains and competitiveness for the North Carolina economy. Attracting freight from out-of-state shippers increases volumes at North Carolina’s ports and may yield scale efficiencies that benefit all port
users and the state’s costs of operation. However, the productivity gains for out-of-state shippers remain out of state. (North Carolina Maritime Strategy, page 35, 2012)
Source: Delcan, Private Data for Public Purposes, AASHTO Special Committee on Intermodal Transportation & Economic Expansion, Richard Mudge PhD, Delcan (October 14, 2011)
FIGURE 7-21Top Destinations of Freight from the Port of Norfolk
NC Exports Leaving from the Port (A) NC Imports Arriving at the Port (B)
Port Truck Only Rail Only Other7 Truck Only Rail Only Other
North Carolina8 97.3% 0.3% 2.5% 94.8% 4.6% 0.7%
Norfolk 83.8% 3.2% 13.0% 90.8% 0.0% 9.2%
Charleston 83.2% 3.3% 13.5% 70.8% 14.2% 15.0%
Savannah 55.9% 2.8% 41.3% 91.9% 1.7% 6.4%
NC Exports Leaving from the Port (A) NC Imports Arriving at the Port (B)
Port % Truck Only % Rail Only % Other % Truck Only % Rail Only % Other
North Carolina9 97.3% 0.3% 2.5% 94.8% 4.6% 0.7%
Norfolk 83.8% 3.2% 13.0% 90.8% 0.0% 9.2%
Charleston 83.2% 3.3% 13.5% 70.8% 14.2% 15.0%
Savannah 55.9% 2.8% 41.3% 91.9% 1.7% 6.4%
Source: FAF, 3.1 FIGURE 7-22Mode of Travel by Weight Percent 2010
FIGURE 7-23Mode of Travel by Value Percent 2010
7Includes Multiple Modes.8Because of their proximity to one another, the North Carolina Ports cannot be isolated in the FAF 3.1 commodity data table. (A) North Carolina exports shipped to a port using the indicated mode. (B) Imports to North Carolina shipped from the port using the indicated mode. 9See note 7.

GREENSBORO URBAN AREA 2040 Metropolitan Transportation Plan
Freight Element 7-22
AirportsBecause the region is focusing on aviation related industries and manufacturing, and because the FedEx Mid-Atlantic hub has recently opened airports, air is an important component of freight movement in the region10. We will not duplicate the various airport master-plans in this report because most are available online. However, we will comment on specific facilities which we believe are important to readers.
Piedmont Triad International Airport (PTI)
The PTI’s Airport Master Plan Executive Summary states:
“The expanded airfield infrastructure makes the airport an ideal candidate for enhanced service from its existing air carriers, potential new air carriers, fixed base operators and tenants and provides new capabilities to attract additional aviation-related tenants engaged in distribution, logistics, manufacturing, cargo, and aircraft repair and maintenance.”
“The airport continues to be a center for important regional economic development, with such major tenants as FedEx, Honda Aircraft, TIMCO, and CESSNA, and with an outstanding infrastructure to attract new tenants.”
“The Airport Master Plan Update anticipates that the airport’s most likely growth in the Near-Term will be the result of new tenants locating at the airport to take advantage of its outstanding infrastructure and its central location on the East Coast. Airport planning should embrace this trend. Finally, PTAA must plan for Long-Term growth. Undeveloped land, primarily to the north and west of the airport, must be acquired and protected to allow for future growth. This Airport Master Plan Update includes a long range strategic vision that goes beyond the typical 20-year planning horizon addressed in most Airport Master Plan Updates. The strategic vision proposes a future “fence line” to the north and west of the airport that will help guide decision-making as PTAA and land use and transportation planners consider land use around the airport.”
PTI’s expansion opportunities are in the northwest quadrant of the airport property. To access this space a new cross-field taxiway perpendicular to the second parallel runway and crossing the I-73 Connector (which will replace Bryan Boulevard at this location) is being constructed.
Based on the above statements, it is apparent that the growth and expansion of PTI will impact the freight flow in the region. Because economic development can move rapidly, it is important that transportation and
land planners develop and maintain a close working relationship with PTI so they may act quickly during the planned expansion when economic development opportunities present themselves.
Projects identified in the Greensboro MTP that would improve access to the airport include I-73 Connector (I-5110), US 220/ NC 68 Connector (R-2413), Airport Connector, E. Mountain Street widening (U-3617), Sandy Ridge Road widening and widening of NC 68 and Pleasant Ridge.
0
50,000,000
100,000,000
150,000,000
200,000,000
250,000,000
2008 2009 2010 2011 2012 2013 2014
Air C
argo
Ton
nage
Year
FIGURE 7-24:Trends in Total Air Cargo, by Carrier Type (calendar years; freight and mail in tons)
Smith Reynolds Airport, Winston Salem
Although Smith Reynolds Airport does not have then number of runways or the runway length of PTI, it is an important asset of the region. Used primarily for private aircraft and the maintenance of larger commercial aircraft, it maintains the capability for a freight/logistics operation using turbo-prop and regional jets. Smith Reynolds is a solid performer in the region’s aviation efforts and careful attention should be paid to planned expansions, especially as affected by the modernization of Business 40 and US 52 in Winston-Salem.
Other Airports in the Region
Asheboro Regional Airport (ICAO: KHBI, FAA LID: HBI) is a city-owned public-use airport located 5.2 miles (11 km) southwest of the central business district of Asheboro. It was formerly known as Asheboro Municipal Airport. Asheboro Regional Airport covers an area of 454 acres (184 ha) at an elevation of 671 feet (205 m) above mean sea level. It has one runway designated 3/21 with an asphalt surface measuring 5,501 by 100 feet (1,677 x 30 m).
Source: Piedmont Triad Airport AuthorityNote: Data represents sum of enplaned and deplaned freight and mail.
10John McPhee describes the impact of air freight in Uncommon Carriers.

GREENSBORO URBAN AREA 2040 Metropolitan Transportation Plan
Freight Element 7-23
Rockingham County NC Shiloh Airport (ICAO: KSIF, FAA LID: SIF, formerly 78N) is a county-owned, public- use airport in Rockingham County, North Carolina. Located in the town of Stoneville, 7.9 miles (12.7 km) northwest of the central business district of the city of Reidsville, it is also known as Rockingham County/ NC Shiloh Airport, Rockingham County/Shiloh Airport, or simply as Shiloh Airport. The airport covers an area of 220 acres (89 ha) at an elevation of 694 feet (212 m) above mean sea level. It has one runway designated 13/31 oriented southeast to northwest (1300, 3010) with an asphalt surface measuring 5,199 by 100 feet (1,585 x 30 m).
Davidson County Airport (ICAO: KEXX, FAA LID: EXX) is a public airport located 3 miles (5 km) southwest of the central business district of Lexington, a city in Davidson County, North Carolina. This general aviation airport covers 75 acres and has one runway.
Burlington-Alamance Regional Airport (ICAO: KBUY, FAA LID: BUY) is a public use airport in Alamance County. It is 3.5 miles (5.6 km) southwest of the Burlington central business district and is owned by the Burlington-Alamance Airport Authority. The National Plan of Integrated Airport Systems for 2011–2015 categorized it as a general aviation facility. Burlington- Alamance Regional Airport covers 500 acres (202 ha) at an elevation of 616 feet (188 m) above mean sea level. It has one runway designated 6/24, oriented northeast to southwest (600/2400) with an asphalt surface measuring 4,999 by 99 feet (1,524 x 30 m). The airport plans to extend its runway to 6,400 feet. The major tenant of the Burlington-Alamance is LabCorp’s fleet of aircraft utilized to collect lab test samples for processing throughout the Southeast. The adjacent Burlington-Alamance Airport’s industrial park is where Honda Aircraft builds its jet engines.
Mount Airy/Surry County Airport (ICAO: KMWK, FAA LID: MWK) is a public use airport located 2.9 miles (4.6 km) southeast of the central business district of Mount Airy, in Surry County. The airport is owned by the city and county. The National Plan of Integrated Airport Systems for 2011–2015, classed it as a general aviation facility. Mount Airy/Surry County Airport covers an area of 147 acres (59 ha) at an elevation of 1,249 feet (381 m) above mean sea level. It has one runway designated 18/36, oriented south to north (1800,3600) with an asphalt surface measuring 4,301 by 75 feet (1,311 x 23 m).
Elkin Municipal Airport (ICAO: KZEF, FAA LID: ZEF) is a public airport located 3 miles (5 km) northeast of the Elkin central business district. This general aviation
airport covers 91 acres and maintains a 4,003 foot runway.
Montgomery County Airport (FAA LID: 43A) is a public use airport located in Star. It is owned and operated by Montgomery County. Montgomery County Airport covers an area of 65 acres (26 ha) at an elevation of 628 feet (191 m) above mean sea level. It has one asphalt paved runway designated 3/21 which measures 4,001 by 75 feet (1,220 x 23 m).
Swan Creek Airport is a private airport located on the western edge of Yadkin County, 5 miles (8 km) west of I-77. The airport covers 35 acres and has two runways. Runway 1 is 1,650 ft. long and 200 ft. wide and runway 2 is 2,600 ft. long and 200 ft. wide. The airport is accessible from I-77.
Hiatt Airport is a private airport on the eastern edge of Davidson County south of I-85. The airport covers 30 acres and has two runways. Runway 1 is 2,500 ft. long and 75 ft. wide and runway 2 is 1160 ft. long and 50 ft. wide. The location is accessible from I-85.
Sugar Valley Airport is a private airport in northeast Davie County just north of I-40. The airport covers 70 acres and has two runways. Runway 1 is 2,424 ft. in length and 25 ft. in width and runway 2 is 2,000 ft. length and 100 ft. in width.

GREENSBORO URBAN AREA 2040 Metropolitan Transportation Plan
Freight Element 7-24
Airport Runway Length(s) in FeetRUNWAY
1RUNWAY
2RUNWAY
3
Piedmont Triad International Airport 10,001 9,000 6,380
Smith Reynolds Airport 6,655 3,938Asheboro Regional Airport 5,510Rockingham Co., NC Shiloh Airport 5,199
Davidson Co. Airport 5,004Burlington Alamance Regional Airport 4,999
Mount Airy/Surry Co. Airport 4,301
Elkin Municipal Airport 4,003Montgomery Co. Airport 4,001Swan Creek Airport 2,600 1,650Hiatt Airport 2,500 1,160Sugar Valley Airport 2,424 2,000
FIGURE 7-25Piedmont Triad Airport Runway Lengths
Recommendations for Piedmont Triad Study AreaTruck Route Recommendations
Trucks are defined as vehicles with a manufacturer’s gross vehicle weight of 33,000 pounds or more. This definition excludes most straight, panel, and delivery trucks, but includes large trucks with more than two axles, such as tractor-trailers (single and double trailers) and tandem axle dump trucks. This definition also excludes public service vehicles, such as garbage collection trucks. Signs should be posted at the city limits, highway exits, and other appropriate locations directing truck drivers to designated routes.
Restrictions may include limiting travel to US and NC routes or designated/signed routes through the city. Within the city limits, consideration could be given to amending the local ordinance to specifically prohibit through trip truck travel on local streets. Prohibition of trucks on any segment of state-maintained roadways will require approval from NCDOT. In addition, caution should be exercised when permitting vehicles carrying certain types of hazardous materials from utilizing certain routes (proximity to schools, housing, etc.)
Truck designations for major routes and industrial streets provides better defined freight corridors. Likewise, truck
traffic should be discouraged on roadways that do not meet the design criteria necessary to facilitate heavy truck traffic.
Industrial development will require efficient truck access and circulation to the arterial system, ultimately improving freight mobility while limiting cut-through truck traffic in neighboring subdivisions. Additional tasks associated with establishing a series of truck routes through the urban area include:
1. Work with NCDOT to prioritize resurfacing of designated routes in an effort to reduce noise and vibration from trucks;
2. Adjust signal timing along high priority routes to minimize delay to through movements based on posted speed limits. The result will be improved travel times, reduced noise, better fuel economy, and decreases in air pollution;
3. Publish and distribute materials to businesses and industries concerning proposed designated truck routes to educate and to enlist their assistance in route planning;
4. Work with NCDOT to make improvements to critical intersections on truck routes to facilitate and encourage their use by truck operators. Improved turning radii, lane width, and the provision of dedicated turn lanes will greatly improve the efficiency and safety of these corridors. This should include working with rail road operators in the region (North Carolina Rail Road, and Class 1 and Class 2 Railroads) to better understand rail traffic increases and/or decreases as they impact rail crossings within the regional infrastructure;
5. Identify streets in industrial areas that function as industrial collectors and work with stakeholders to evaluate and implement the appropriate cross- section.
Summary Recommendations
Efficient and safe movement of goods
The following recommendations are intended to improve the efficient and safe movement of goods and services in the study area:
1. Continued expansion of the highway system to provide improved access and circulation around major transportation corridors. This should include working with NCDOT to complete the

GREENSBORO URBAN AREA 2040 Metropolitan Transportation Plan
Freight Element 7-25
road projects suggested by the NC Governors Logistics Task Force “Seven Portals Committee”;
2. Continued investments within the vicinity of PTIA as outlined in the Airport Area Plan, Metropolitan Transportation Plan, Comprehensive Transportation Plan and the Thoroughfare and Collector Street Plan;
3. Coordinate needed improvements to meet the advancements of the PTIA logistical hub, and proposed PTI Air Logistics Hub and Piedmont Triad Aerotropolis;
4. Implement an Intermodal Management System;
5. Coordinate with NCDOT on the development of future rail improvements. This should include discussion with both Class 1 (major) and Class 2 (short-line) railroads;
6. 6. Coordinate area roadway planning with freight objectives, including access and mobility in the context of other planning objectives;
7. Increase the use and availability of intelligent transportation systems to reduce the amount of time trucks spend in congestion and ensure efficient timely movement of goods. This includes regular upgrades and improvement of signal management systems;
8. Coordinate with NCDOT on routine maintenance of truck routes carrying significant freight movements.
Awareness
I. Coordinate and implement methods of keeping the regional consumer aware of the importance of freight and freight flow in the region;
II. Monitor the freight traffic pattern shift due to the opening of the widened Panama Canal in 2016. The canal opening may substantially shift Pacific Rim USWC discharge to a more USEC centric model for freight moving east of the Mississippi River;
III. Establish and maintain communication with regional economic development offices as they pertain to large/mega-site projects in the region.
Communication
I. Establish annual meetings with the regions short- line railroads to jointly discuss traffic flow and projected increase/decrease in the region;
II. Establish and maintain communication with NCDOT Logistics Office concerning proposed regional “Freight Villages” studied and recommended for the region in the “Seven Portals Report” from the NC Governors Logistics Task Force;
III. Create, implement and maintain a regional legislative workshop to discuss and promote the regions importance in freight flow and to secure funding to maintain and improve our infrastructure;
IV. Create, implement, and maintain a “Share the Road” campaign to elevate the importance of freight flow and how to properly share the road with heavyweight freight vehicles;
V. Create an outreach campaign for truck stops serving the region. This is a “first stop” to greater safety for our citizens and national freight flow;
VI. Schedule and maintain an annual regional Safety & Security meeting with government entities, NCDOT, private industry, US Customs, and Police and Fire Departments.
Data Modeling
I. Continue to evaluate best practices for utilizing FHWA/NCDOT resources and data modeling to create a regional macro-view of national, state and regional freight projects/policies and their impact on the region. This capability will be a “must have” as we go forward and will provide a very strong tool for economic development recruitment.
II. Expand freight node database. Comparisons between the freight node data and aerial imagery (see Figure 4) suggest that many truck facilities may not be represented in the current node database. Given that there are enough surveys to estimate truck trip generation, future node data should focus on identifying the location, type, building square footage, and number of truck bays. These items do not require field visitation of contact. Expanding this database would allow the model to include location specific truck demand.
III. Truck travel patterns could be explored through a travel diary or through the analysis of truck GPS data. The survey revealed that the intermodal facilities generate the most truck activity per facility. A diary survey at select intermodal facilities would reveal the types of travel patterns that are typical

GREENSBORO URBAN AREA 2040 Metropolitan Transportation Plan
Freight Element 7-26
within the region, including temporal patterns, off-site parking issues, frequency of local trips, etc.
IV. The freight survey revealed that the shipper category (manufacturing) is difficult to forecast regarding truck trip generation. An effort could be conducted to review national trends in truck trip generation by commodity and facility size. This information could be used in conjunction with the survey data to allow a better establishment of truck trips for this seemingly highly-variable category.
Other
I. Create and maintain a centralized/coordinated regional freight flow agency and ensure that all government entities are aware of and work with it.