Chapter 6: Teachers of Mathematics - Boston College · chapter 6: teachers of mathematics 245...
24
Chapter 6 Teachers of Mathematics To help place students’ mathematics achievement in the context of their school and classroom situations, the mathematics teachers of the students tested were asked to complete questionnaires about their experience and education. is chapter presents teachers’ reports about their background characteristics, education and training in teaching mathematics, and about how well prepared they feel to teach mathematics. It is important to note that the data shown are the percentages of students whose teachers reported on various characteristics. at is, the student is the unit of analysis so that TIMSS can describe the classroom contexts of the students. e exhibits have special notations when relatively large percentages of students did not have teacher questionnaire information. For a country where teacher responses were available for 70 to 84 percent of the students, an “r” is included next to its data. 1 Where teacher responses were available for 50 to 69 percent of students, an “s” is included. Where teacher responses were available for less than 50 percent, an “x” replaces the data. What Are the Background Characteristics of Mathematics Teachers? is section presents information about the background characteristics of the teachers of mathematics, including gender, age, and years teaching experience. As shown in Exhibit 6.1, in many countries, most fourth- grade students were taught mathematics by females (international average of 79%). is was less so at the eighth grade (international average of 57%), although the majority of students had female teachers in more than half of the countries. 1 Although countries worked hard to maximize participation by teachers, sometimes this was affected by external factors. For example, a teacher strike led to somewhat reduced teacher participation in Israel.
Transcript of Chapter 6: Teachers of Mathematics - Boston College · chapter 6: teachers of mathematics 245...
Chapter 6
Teachers of Mathematics
To help place students’ mathematics achievement in the context of their school and classroom situations, the mathematics teachers of the students tested were asked to complete questionnaires about their experience and education. This chapter presents teachers’ reports about their background characteristics, education and training in teaching mathematics, and about how well prepared they feel to teach mathematics. It is important to note that the data shown are the percentages of students whose teachers reported on various characteristics. That is, the student is the unit of analysis so that TIMSS can describe the classroom contexts of the students. The exhibits have special notations when relatively large percentages of students did not have teacher questionnaire information. For a country where teacher responses were available for 70 to 84 percent of the students, an “r” is included next to its data.1 Where teacher responses were available for 50 to 69 percent of students, an “s” is included. Where teacher responses were available for less than 50 percent, an “x” replaces the data.
What Are the Background Characteristics of Mathematics Teachers?
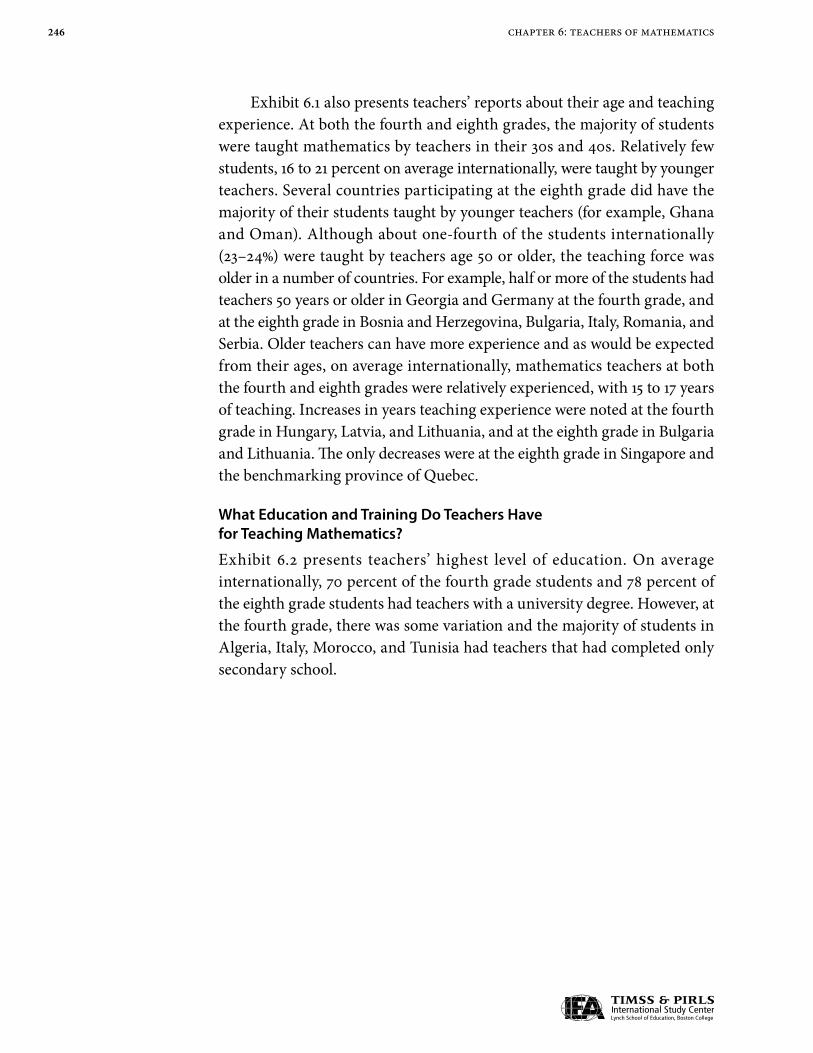
This section presents information about the background characteristics of the teachers of mathematics, including gender, age, and years teaching experience. As shown in Exhibit 6.1, in many countries, most fourth-grade students were taught mathematics by females (international average of 79%). This was less so at the eighth grade (international average of 57%), although the majority of students had female teachers in more than half of the countries.
1 Althoughcountriesworkedhardtomaximizeparticipationbyteachers,sometimesthiswasaffectedbyexternalfactors.Forexample,ateacherstrikeledtosomewhatreducedteacherparticipationinIsrael.

244 chapter 6: teachers of mathematics
Exhibit 6.1: Mathematics Teachers’ Gender, Age, and Number of YearsTeaching with Trends
Country
Percentage of Students by Teacher Characteristics Trends in Average Number of Years TeachingGender Age
Female Male 29 Years or Under 30–39 Years 40–49 Years 50 Years
or Older 2007 Difference from 2003
Algeria 58 (4.5) 42 (4.5) 6 (1.9) 45 (4.6) 44 (4.4) 5 (1.8) 17 (0.6) ◊ ◊Armenia 85 (3.3) 15 (3.3) 15 (3.0) 20 (3.2) 26 (3.2) 39 (4.4) 22 (0.8) 2 (1.2)Australia 80 (3.4) 20 (3.4) 21 (3.9) 18 (3.4) 29 (4.1) 32 (3.4) 17 (1.0) 0 (1.3)Austria 89 (2.0) 11 (2.0) 8 (2.1) 21 (2.7) 36 (2.8) 34 (2.8) 22 (0.7) ◊ ◊Chinese Taipei 75 (3.7) 25 (3.7) 21 (3.6) 46 (3.9) 25 (3.2) 8 (2.3) 12 (0.7) 1 (1.0)Colombia 76 (4.3) 24 (4.3) 13 (3.6) 28 (4.9) 30 (4.0) 29 (4.5) 19 (1.1) ◊ ◊Czech Republic 91 (2.5) 9 (2.5) 11 (2.5) 24 (3.1) 40 (3.4) 25 (3.2) 17 (1.0) ◊ ◊Denmark 49 (4.0) 51 (4.0) 9 (1.9) 30 (4.2) 24 (3.9) 37 (4.3) 16 (1.1) ◊ ◊El Salvador 70 (4.2) 30 (4.2) 14 (2.7) 38 (3.9) 40 (4.0) 8 (2.6) 14 (0.7) ◊ ◊England 69 (3.5) 31 (3.5) 31 (3.8) 29 (3.4) 23 (3.4) 16 (3.0) r 11 (0.8) –2 (1.2)Georgia 99 (0.8) 1 (0.8) 4 (1.5) 17 (2.6) 29 (3.9) 50 (3.8) 25 (0.9) ◊ ◊Germany 85 (2.1) 15 (2.1) 9 (1.8) 20 (2.7) 16 (2.5) 56 (3.1) 22 (0.8) ◊ ◊Hong Kong SAR 59 (4.1) 41 (4.1) 38 (3.8) 37 (4.1) 11 (2.9) 13 (2.7) 12 (0.8) –1 (1.3)Hungary 95 (1.7) 5 (1.7) 5 (1.9) 20 (2.7) 45 (3.3) 30 (3.5) 23 (0.7) 3 (1.1) h
Iran, Islamic Rep. of 53 (2.7) 47 (2.7) 14 (2.4) 40 (4.1) 40 (3.9) 7 (1.6) 16 (0.6) 0 (0.9)Italy 97 (0.9) 3 (0.9) 4 (1.4) 20 (2.3) 37 (3.0) 39 (3.1) 21 (0.6) 0 (0.9)Japan 65 (3.1) 35 (3.1) 13 (2.5) 20 (3.1) 39 (3.5) 28 (3.5) 19 (0.8) 0 (1.1)Kazakhstan 94 (1.7) 6 (1.7) 11 (3.0) 34 (3.7) 34 (5.2) 22 (4.6) 18 (0.9) ◊ ◊Kuwait r 88 (2.7) 12 (2.7) r 37 (4.3) 56 (4.5) 7 (2.1) 0 (0.0) r 8 (0.5) ◊ ◊Latvia 100 (0.3) 0 (0.0) 5 (1.6) 27 (3.1) 39 (3.2) 29 (3.1) 22 (0.7) 2 (1.2) h
Lithuania 98 (0.8) 2 (0.8) 1 (0.6) 34 (3.0) 39 (3.5) 26 (3.3) 21 (0.6) 2 (0.9) h
Morocco 50 (4.3) 50 (4.3) 21 (3.0) 29 (3.7) 35 (3.6) 15 (2.9) s 16 (0.6) 1 (1.0)Netherlands 58 (4.1) 42 (4.1) 24 (3.5) 19 (3.1) 15 (3.0) 42 (3.9) 18 (1.0) 2 (1.5)New Zealand 75 (2.4) 25 (2.4) 27 (2.6) 29 (2.1) 23 (2.0) 21 (2.2) 11 (0.6) 0 (0.8)Norway 82 (2.4) 18 (2.4) 10 (2.0) 28 (2.8) 20 (2.6) 42 (2.9) 17 (0.8) 1 (1.3)Qatar 92 (0.1) 8 (0.1) 39 (0.2) 42 (0.1) 18 (0.1) 1 (0.0) 9 (0.0) ◊ ◊Russian Federation 99 (0.9) 1 (0.9) 7 (2.3) 34 (3.3) 37 (3.6) 22 (2.4) 21 (0.5) 1 (0.9)Scotland 92 (1.8) 8 (1.8) 23 (3.6) 21 (3.1) 23 (2.8) 33 (3.4) r 15 (0.9) –1 (1.3)Singapore 67 (2.6) 33 (2.6) 37 (2.8) 36 (3.1) 18 (2.2) 8 (1.7) 10 (0.6) –1 (1.1)Slovak Republic 94 (1.7) 6 (1.7) 12 (2.4) 32 (3.5) 28 (3.3) 28 (2.7) 20 (0.7) ◊ ◊Slovenia 98 (0.7) 2 (0.7) 14 (1.9) 21 (2.4) 48 (3.0) 17 (2.5) 19 (0.6) 1 (1.0)Sweden 82 (2.9) 18 (2.9) 7 (1.8) 26 (3.1) 26 (2.5) 41 (3.3) 18 (0.9) ◊ ◊Tunisia 66 (3.4) 34 (3.4) 8 (2.0) 47 (4.2) 35 (3.4) 10 (1.8) r 17 (0.5) –1 (0.9)Ukraine 100 (0.0) 0 (0.0) 8 (1.8) 32 (3.7) 38 (3.9) 22 (2.8) 22 (0.6) ◊ ◊United States 88 (1.7) 12 (1.7) 18 (2.0) 28 (2.3) 22 (2.1) 31 (2.1) 14 (0.4) 0 (0.7)Yemen 26 (3.9) 74 (3.9) 29 (4.0) 61 (4.7) 8 (2.3) 2 (1.6) 13 (0.6) ◊ ◊International Avg. 79 (0.5) 21 (0.5) 16 (0.4) 31 (0.6) 29 (0.5) 24 (0.5) 17 (0.1)
Benchmarking ParticipantsAlberta, Canada 80 (3.1) 20 (3.1) 16 (3.1) 28 (4.0) 29 (4.1) 27 (3.3) 14 (0.8) ◊ ◊British Columbia, Canada 82 (2.9) 18 (2.9) r 10 (2.7) 32 (4.0) 23 (3.1) 35 (3.8) r 15 (0.8) ◊ ◊Dubai, UAE r 80 (5.2) 20 (5.2) r 21 (3.8) 44 (5.1) 24 (4.3) 11 (3.9) r 13 (0.9) ◊ ◊Massachusetts, US 93 (2.9) 7 (2.9) 23 (4.2) 28 (5.5) 23 (5.6) 26 (5.7) 13 (0.9) ◊ ◊Minnesota, US 75 (5.6) 25 (5.6) 8 (3.4) 29 (5.3) 22 (5.4) 41 (7.2) 18 (1.2) ◊ ◊Ontario, Canada 84 (3.2) 16 (3.2) 12 (2.7) 29 (4.5) 38 (4.9) 21 (3.9) 13 (0.8) 0 (1.2)Quebec, Canada 87 (3.0) 13 (3.0) 12 (2.5) 30 (3.6) 33 (4.2) 25 (3.8) 16 (0.8) –2 (1.2)
2007 significantly higher h
2007 significantly lower i
Background data provided by teachers.( ) Standard errors appear in parentheses. Because results are rounded to the nearest
whole number, some totals may appear inconsistent.
An “r” indicates data are available for at least 70 but less than 85% of the students. An “s” indicates data are available for at least 50 but less than 70% of the students. A diamond (◊) indicates the country did not participate in the assessment.
SOU
RCE:
IEA
’s Tr
ends
in In
tern
atio
nal M
athe
mat
ics
and
Scie
nce
Stud
y (T
IMSS
) 200
7
Exhibit 6.1 Mathematics Teachers’ Gender, Age, and Number of YearsTeaching with Trends

245chapter 6: teachers of mathematics
Exhibit 6.1: Mathematics Teachers’ Gender, Age, and Number of YearsTeaching with Trends (Continued)
Country
Percentage of Students by Teacher Characteristics Trends in Average Number of Years TeachingGender Age
Female Male 29 Years or Under 30–39 Years 40–49 Years 50 Years
or Older 2007 Difference from 2003
Algeria 40 (4.2) 60 (4.2) 6 (1.9) 25 (3.8) 63 (4.0) 7 (2.0) 19 (0.8) ◊ ◊Armenia 82 (2.7) 18 (2.7) 9 (2.6) 26 (3.3) 29 (3.4) 36 (3.6) r 20 (0.7) 1 (1.0)Australia 49 (4.3) 51 (4.3) 20 (3.2) 29 (3.7) 22 (3.2) 30 (3.2) 15 (0.8) 0 (1.2)Bahrain 48 (1.1) 52 (1.1) 18 (1.9) 51 (2.7) 27 (2.6) 4 (1.4) 12 (0.5) 1 (0.9)Bosnia and Herzegovina 57 (4.1) 43 (4.1) 6 (2.1) 22 (3.3) 22 (3.7) 50 (3.5) 23 (0.8) ◊ ◊Botswana 43 (4.5) 57 (4.5) 32 (4.4) 60 (4.5) 8 (2.3) 0 (0.1) r 8 (0.4) 1 (0.7)Bulgaria 86 (2.7) 14 (2.7) 1 (0.7) 12 (2.6) 37 (4.1) 50 (4.2) 23 (0.9) 3 (1.1) h
Chinese Taipei 57 (4.4) 43 (4.4) 16 (3.2) 45 (4.1) 29 (3.7) 10 (2.4) 12 (0.7) –2 (1.1)Colombia 41 (5.8) 59 (5.8) 23 (4.0) 25 (3.8) 22 (4.1) 31 (5.3) 18 (1.4) ◊ ◊Cyprus 69 (2.4) 31 (2.4) 6 (1.5) 32 (2.4) 36 (2.6) 26 (2.5) 13 (0.5) 1 (0.8)Czech Republic 79 (3.3) 21 (3.3) 13 (2.4) 19 (3.0) 34 (3.6) 35 (3.9) 20 (0.9) ◊ ◊Egypt 22 (3.5) 78 (3.5) 10 (2.5) 52 (3.8) 34 (3.6) 4 (1.4) 14 (0.6) 1 (0.7)El Salvador 55 (4.6) 45 (4.6) 21 (3.7) 45 (4.9) 27 (3.3) 7 (2.3) 12 (0.6) ◊ ◊England 52 (4.2) 48 (4.2) 18 (3.4) 25 (3.3) 26 (3.3) 31 (2.8) r 14 (0.9) –2 (1.7)Georgia 89 (3.2) 11 (3.2) 3 (1.3) 21 (3.7) 30 (4.1) 46 (4.2) 23 (1.0) ◊ ◊Ghana 8 (2.2) 92 (2.2) 52 (3.9) 28 (4.2) 16 (3.1) 4 (1.1) 7 (0.4) 0 (0.7)Hong Kong SAR 40 (3.8) 60 (3.8) 26 (4.0) 35 (4.4) 27 (4.3) 12 (2.7) 13 (0.9) 1 (1.2)Hungary 80 (3.3) 20 (3.3) 9 (2.7) 19 (3.3) 35 (2.9) 37 (3.2) 21 (0.8) –1 (1.1)Indonesia 44 (4.3) 56 (4.3) 15 (3.2) 41 (3.9) 37 (4.3) 7 (2.3) 14 (0.7) 0 (0.9)Iran, Islamic Rep. of 42 (2.0) 58 (2.0) 26 (3.2) 49 (3.5) 20 (3.1) 5 (1.3) 14 (0.5) 0 (0.7)Israel 76 (3.3) 24 (3.3) 15 (2.7) 33 (3.2) 32 (3.0) 20 (2.4) r 17 (0.7) 1 (1.0)Italy 81 (2.8) 19 (2.8) 2 (1.1) 10 (1.9) 22 (2.3) 67 (2.9) 23 (0.7) 0 (0.9)Japan 43 (3.7) 57 (3.7) 20 (3.1) 28 (3.3) 39 (3.7) 13 (2.7) 16 (0.8) –1 (1.0)Jordan 52 (2.6) 48 (2.6) 36 (3.9) 39 (3.8) 18 (3.0) 7 (2.0) 10 (0.6) –1 (0.9)Korea, Rep. of 64 (3.2) 36 (3.2) 25 (2.8) 29 (2.9) 34 (3.2) 12 (2.5) s 14 (0.6) 1 (0.8)Kuwait r 51 (2.5) 49 (2.5) r 19 (3.7) 49 (4.9) 22 (3.6) 10 (2.9) r 12 (0.7) ◊ ◊Lebanon 42 (4.4) 58 (4.4) 33 (4.0) 27 (3.6) 22 (3.7) 19 (3.8) r 14 (0.9) –1 (1.2)Lithuania 93 (1.7) 7 (1.7) 7 (1.8) 12 (2.7) 47 (4.0) 34 (3.4) 22 (0.7) 2 (1.1) h
Malaysia 71 (3.7) 29 (3.7) 22 (3.7) 39 (4.1) 28 (3.8) 10 (2.5) 12 (0.7) 2 (0.9)Malta 59 (0.2) 41 (0.2) 47 (0.2) 30 (0.2) 13 (0.2) 10 (0.1) 11 (0.0) ◊ ◊Norway 41 (3.6) 59 (3.6) 10 (2.2) 34 (3.0) 17 (2.3) 39 (2.5) 17 (0.7) –1 (1.2)Oman 52 (2.4) 48 (2.4) 83 (3.0) 14 (2.9) 3 (1.0) 0 (0.4) 5 (0.4) ◊ ◊Palestinian Nat’l Auth. 49 (3.1) 51 (3.1) 37 (4.4) 29 (3.7) 24 (3.4) 11 (2.4) 12 (0.9) 1 (1.1)Qatar 51 (0.2) 49 (0.2) 25 (0.1) 40 (0.1) 22 (0.1) 13 (0.1) 14 (0.0) ◊ ◊Romania 60 (3.4) 40 (3.4) 6 (1.8) 21 (3.0) 23 (3.1) 50 (3.2) 23 (1.0) 0 (1.5)Russian Federation 94 (1.8) 6 (1.8) 5 (1.0) 21 (2.8) 33 (2.9) 41 (3.4) 24 (0.7) 0 (1.1)Saudi Arabia 47 (1.7) 53 (1.7) 35 (4.3) 46 (4.2) 13 (2.6) 7 (2.6) 11 (0.8) – –Scotland 58 (3.1) 42 (3.1) 16 (2.1) 25 (3.0) 25 (2.9) 33 (3.6) r 15 (0.8) –1 (1.3)Serbia 61 (4.4) 39 (4.4) 9 (2.4) 20 (3.0) 20 (3.5) 51 (4.0) 20 (1.0) –2 (1.4)Singapore 64 (2.7) 36 (2.7) 45 (2.5) 31 (2.3) 12 (1.8) 12 (1.3) 8 (0.4) –4 (0.8) i
Slovenia 82 (2.0) 18 (2.0) 17 (2.1) 23 (2.4) 39 (3.0) 21 (2.5) 18 (0.6) –2 (1.0)Sweden 55 (2.9) 45 (2.9) 11 (2.0) 30 (2.7) 22 (2.7) 37 (3.2) 15 (0.8) 1 (1.1)Syrian Arab Republic 55 (3.8) 45 (3.8) 34 (3.8) 39 (4.0) 17 (3.0) 10 (2.8) 11 (0.7) ◊ ◊Thailand 64 (4.1) 36 (4.1) 19 (3.5) 29 (3.9) 26 (3.9) 25 (3.8) 15 (0.9) ◊ ◊Tunisia 33 (3.8) 67 (3.8) 15 (2.9) 47 (4.1) 25 (3.6) 13 (2.7) s 13 (0.6) 0 (1.1)Turkey 45 (4.2) 55 (4.2) 49 (4.0) 16 (2.8) 19 (3.3) 16 (3.4) 11 (0.8) ◊ ◊Ukraine 91 (2.4) 9 (2.4) 8 (2.3) 21 (3.1) 31 (4.1) 40 (4.2) 23 (0.9) ◊ ◊United States 69 (2.6) 31 (2.6) 20 (2.3) 29 (2.8) 26 (2.8) 25 (2.2) 14 (0.6) –1 (0.9)
¶ Morocco 25 (3.5) 75 (3.5) 9 (2.9) 13 (3.0) 47 (5.4) 31 (5.2) r 20 (1.3) – –International Avg. 57 (0.5) 43 (0.5) 21 (0.4) 30 (0.5) 26 (0.5) 23 (0.4) 15 (0.1)
Benchmarking ParticipantsBasque Country, Spain 51 (5.2) 49 (5.2) 2 (1.4) 23 (4.0) 34 (4.3) 41 (4.8) 22 (1.1) 1 (1.4)British Columbia, Canada 45 (4.3) 55 (4.3) 16 (3.4) 39 (4.7) 24 (3.9) 21 (3.8) 13 (0.8) ◊ ◊Dubai, UAE s 57 (6.2) 43 (6.2) s 13 (1.5) 46 (5.6) 24 (4.3) 17 (4.3) s 15 (0.6) ◊ ◊Massachusetts, US 56 (6.1) 44 (6.1) 23 (5.6) 29 (6.5) 23 (5.3) 25 (5.3) 12 (1.2) ◊ ◊Minnesota, US 50 (8.2) 50 (8.2) 33 (8.6) 32 (7.7) 19 (7.0) 16 (4.6) 12 (1.5) ◊ ◊Ontario, Canada 49 (3.6) 51 (3.6) 20 (3.8) 50 (5.0) 16 (3.6) 14 (3.5) 10 (0.9) –1 (1.2)Quebec, Canada 53 (4.3) 47 (4.3) 22 (3.7) 46 (4.6) 19 (3.6) 13 (2.7) 11 (0.8) –5 (1.3) i
2007 significantly higher h
2007 significantly lower i
Background data provided by teachers.¶ Did not satisfy guidelines for sample participation rates (see Appendix A). ( ) Standard errors appear in parentheses. Because results are rounded to the nearest
whole number, some totals may appear inconsistent.
A dash (–) indicates comparable data are not available. An “r” indicates data are available for at least 70 but less than 85% of the students. An “s” indicates data are available for at least 50 but less than 70% of the students. A diamond (◊) indicates the country did not participate in the assessment.
SOU
RCE:
IEA
’s Tr
ends
in In
tern
atio
nal M
athe
mat
ics
and
Scie
nce
Stud
y (T
IMSS
) 200
7
Exhibit 6.1 Mathematics Teachers’ Gender, Age, and Number of YearsTeaching with Trends (Continued)
246 chapter 6: teachers of mathematics
Exhibit 6.1 also presents teachers’ reports about their age and teaching experience. At both the fourth and eighth grades, the majority of students were taught mathematics by teachers in their 30s and 40s. Relatively few students, 16 to 21 percent on average internationally, were taught by younger teachers. Several countries participating at the eighth grade did have the majority of their students taught by younger teachers (for example, Ghana and Oman). Although about one-fourth of the students internationally (23–24%) were taught by teachers age 50 or older, the teaching force was older in a number of countries. For example, half or more of the students had teachers 50 years or older in Georgia and Germany at the fourth grade, and at the eighth grade in Bosnia and Herzegovina, Bulgaria, Italy, Romania, and Serbia. Older teachers can have more experience and as would be expected from their ages, on average internationally, mathematics teachers at both the fourth and eighth grades were relatively experienced, with 15 to 17 years of teaching. Increases in years teaching experience were noted at the fourth grade in Hungary, Latvia, and Lithuania, and at the eighth grade in Bulgaria and Lithuania. The only decreases were at the eighth grade in Singapore and the benchmarking province of Quebec.
What Education and Training Do Teachers Have for Teaching Mathematics?
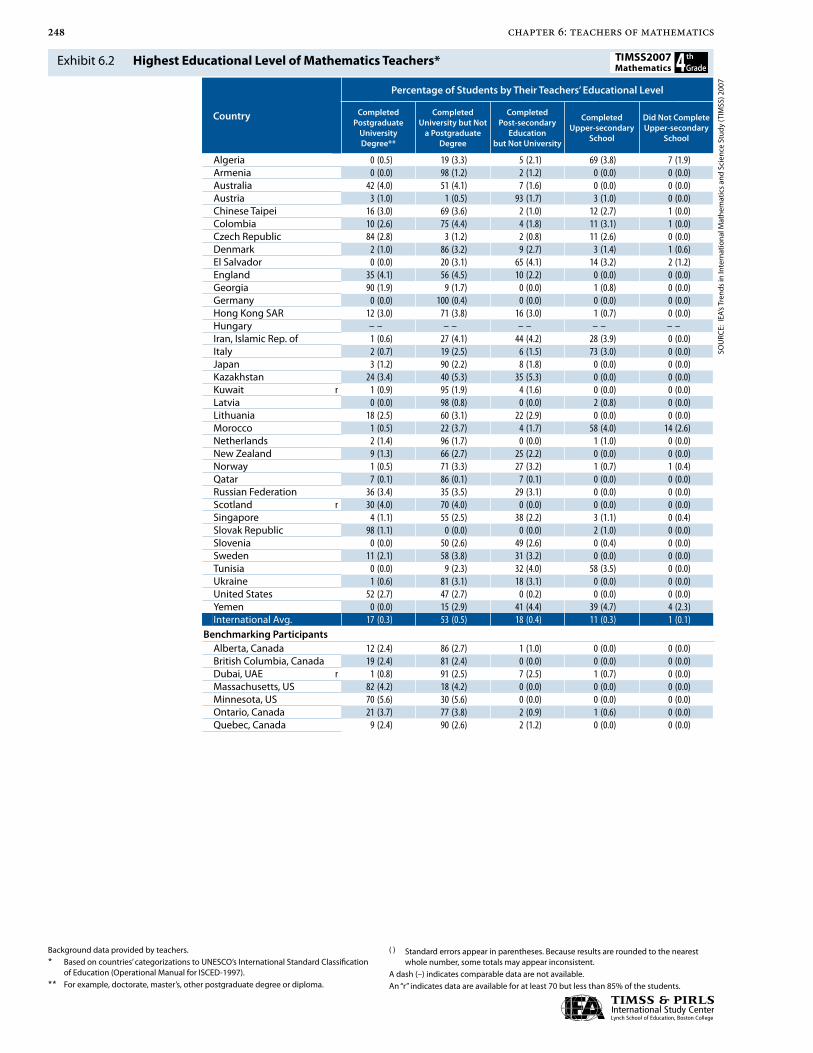
Exhibit 6.2 presents teachers’ highest level of education. On average internationally, 70 percent of the fourth grade students and 78 percent of the eighth grade students had teachers with a university degree. However, at the fourth grade, there was some variation and the majority of students in Algeria, Italy, Morocco, and Tunisia had teachers that had completed only secondary school.

247chapter 6: teachers of mathematics
Exhibit 6.3 contains information about teachers’ educational emphasis in mathematics. Most countries have a national or regional mathematics curriculum, and most countries reported that teachers received specific preparation in how to teach the mathematics curriculum as part of pre-service education. However, the teachers of the fourth grade students in a number of countries reported little specific training or specialized education in mathematics. Countries where 80 percent or more of the fourth grade students had teachers who studied primary/elementary education without a major or specialization in mathematics or science, included Australia, Austria, the Czech Republic, Hungary, Lithuania, and the Slovak Republic as well as the benchmarking province of Quebec. At the other end of the continuum, 80 percent or more had teachers with primary/elementary education and a major or specialization in mathematics or science in Germany and Kazakhstan. In Armenia and Kuwait almost all teachers had a mathematics major or specialization (94 to 98%), but few had studied primary/elementary education. At the eighth grade, on average internationally, most students had teachers who had studied mathematics (70%) or mathematics education (54%) or both (since teachers often reported that their study was focused in more than one area).
Exhibit 6.4 contains teachers’ reports about their participation in professional development related to teaching mathematics. At the fourth grade, two-fifths or more of the students, on average internationally, had teachers that had participated in some type of professional development during the past two years in the various mathematics areas asked about by TIMSS, including mathematics content (42%), mathematics pedagogy (47%), mathematics curriculum (40%), and/or improving students’ critical thinking or problem-solving skills (40%). Somewhat fewer students had teachers
248 chapter 6: teachers of mathematics
Exhibit 6.2: Highest Educational Level of Mathematics Teachers*
Country
Percentage of Students by Their Teachers’ Educational Level
Completed Postgraduate
University Degree**
Completed University but Not
a Postgraduate Degree
Completed Post-secondary
Education but Not University
Completed Upper-secondary
School
Did Not Complete Upper-secondary
School
Algeria 0 (0.5) 19 (3.3) 5 (2.1) 69 (3.8) 7 (1.9)Armenia 0 (0.0) 98 (1.2) 2 (1.2) 0 (0.0) 0 (0.0)Australia 42 (4.0) 51 (4.1) 7 (1.6) 0 (0.0) 0 (0.0)Austria 3 (1.0) 1 (0.5) 93 (1.7) 3 (1.0) 0 (0.0)Chinese Taipei 16 (3.0) 69 (3.6) 2 (1.0) 12 (2.7) 1 (0.0)Colombia 10 (2.6) 75 (4.4) 4 (1.8) 11 (3.1) 1 (0.0)Czech Republic 84 (2.8) 3 (1.2) 2 (0.8) 11 (2.6) 0 (0.0)Denmark 2 (1.0) 86 (3.2) 9 (2.7) 3 (1.4) 1 (0.6)El Salvador 0 (0.0) 20 (3.1) 65 (4.1) 14 (3.2) 2 (1.2)England 35 (4.1) 56 (4.5) 10 (2.2) 0 (0.0) 0 (0.0)Georgia 90 (1.9) 9 (1.7) 0 (0.0) 1 (0.8) 0 (0.0)Germany 0 (0.0) 100 (0.4) 0 (0.0) 0 (0.0) 0 (0.0)Hong Kong SAR 12 (3.0) 71 (3.8) 16 (3.0) 1 (0.7) 0 (0.0)Hungary – – – – – – – – – –Iran, Islamic Rep. of 1 (0.6) 27 (4.1) 44 (4.2) 28 (3.9) 0 (0.0)Italy 2 (0.7) 19 (2.5) 6 (1.5) 73 (3.0) 0 (0.0)Japan 3 (1.2) 90 (2.2) 8 (1.8) 0 (0.0) 0 (0.0)Kazakhstan 24 (3.4) 40 (5.3) 35 (5.3) 0 (0.0) 0 (0.0)Kuwait r 1 (0.9) 95 (1.9) 4 (1.6) 0 (0.0) 0 (0.0)Latvia 0 (0.0) 98 (0.8) 0 (0.0) 2 (0.8) 0 (0.0)Lithuania 18 (2.5) 60 (3.1) 22 (2.9) 0 (0.0) 0 (0.0)Morocco 1 (0.5) 22 (3.7) 4 (1.7) 58 (4.0) 14 (2.6)Netherlands 2 (1.4) 96 (1.7) 0 (0.0) 1 (1.0) 0 (0.0)New Zealand 9 (1.3) 66 (2.7) 25 (2.2) 0 (0.0) 0 (0.0)Norway 1 (0.5) 71 (3.3) 27 (3.2) 1 (0.7) 1 (0.4)Qatar 7 (0.1) 86 (0.1) 7 (0.1) 0 (0.0) 0 (0.0)Russian Federation 36 (3.4) 35 (3.5) 29 (3.1) 0 (0.0) 0 (0.0)Scotland r 30 (4.0) 70 (4.0) 0 (0.0) 0 (0.0) 0 (0.0)Singapore 4 (1.1) 55 (2.5) 38 (2.2) 3 (1.1) 0 (0.4)Slovak Republic 98 (1.1) 0 (0.0) 0 (0.0) 2 (1.0) 0 (0.0)Slovenia 0 (0.0) 50 (2.6) 49 (2.6) 0 (0.4) 0 (0.0)Sweden 11 (2.1) 58 (3.8) 31 (3.2) 0 (0.0) 0 (0.0)Tunisia 0 (0.0) 9 (2.3) 32 (4.0) 58 (3.5) 0 (0.0)Ukraine 1 (0.6) 81 (3.1) 18 (3.1) 0 (0.0) 0 (0.0)United States 52 (2.7) 47 (2.7) 0 (0.2) 0 (0.0) 0 (0.0)Yemen 0 (0.0) 15 (2.9) 41 (4.4) 39 (4.7) 4 (2.3)International Avg. 17 (0.3) 53 (0.5) 18 (0.4) 11 (0.3) 1 (0.1)
Benchmarking ParticipantsAlberta, Canada 12 (2.4) 86 (2.7) 1 (1.0) 0 (0.0) 0 (0.0)British Columbia, Canada 19 (2.4) 81 (2.4) 0 (0.0) 0 (0.0) 0 (0.0)Dubai, UAE r 1 (0.8) 91 (2.5) 7 (2.5) 1 (0.7) 0 (0.0)Massachusetts, US 82 (4.2) 18 (4.2) 0 (0.0) 0 (0.0) 0 (0.0)Minnesota, US 70 (5.6) 30 (5.6) 0 (0.0) 0 (0.0) 0 (0.0)Ontario, Canada 21 (3.7) 77 (3.8) 2 (0.9) 1 (0.6) 0 (0.0)Quebec, Canada 9 (2.4) 90 (2.6) 2 (1.2) 0 (0.0) 0 (0.0)
Background data provided by teachers.* Based on countries’ categorizations to UNESCO’s International Standard Classification
of Education (Operational Manual for ISCED-1997).** For example, doctorate, master’s, other postgraduate degree or diploma.
( ) Standard errors appear in parentheses. Because results are rounded to the nearest whole number, some totals may appear inconsistent.
A dash (–) indicates comparable data are not available. An “r” indicates data are available for at least 70 but less than 85% of the students.
SOU
RCE:
IEA
’s Tr
ends
in In
tern
atio
nal M
athe
mat
ics
and
Scie
nce
Stud
y (T
IMSS
) 200
7
Exhibit 6.2 Highest Educational Level of Mathematics Teachers*

249chapter 6: teachers of mathematics
Exhibit 6.2: Highest Educational Level of Mathematics Teachers* (Continued)
Country
Percentage of Students by Their Teachers’ Educational Level
Completed Postgraduate
University Degree**
Completed University but Not
a Postgraduate Degree
Completed Post-secondary
Education but Not University
Completed Upper-secondary
School
Did Not Complete Upper-secondary
School
Algeria 1 (0.0) 14 (3.0) 63 (3.7) 20 (3.4) 3 (1.5)Armenia 94 (1.6) 4 (1.0) 2 (1.3) 0 (0.0) 0 (0.0)Australia 60 (4.1) 38 (3.9) 2 (1.1) 0 (0.0) 0 (0.0)Bahrain 10 (1.9) 86 (2.3) 4 (1.4) 0 (0.0) 0 (0.0)Bosnia and Herzegovina 1 (0.6) 8 (2.1) 91 (2.3) 1 (0.8) 0 (0.0)Botswana 1 (1.0) 9 (2.6) 89 (2.8) 0 (0.0) 0 (0.0)Bulgaria 77 (3.4) 12 (2.5) 11 (2.5) 0 (0.0) 0 (0.0)Chinese Taipei 22 (3.5) 72 (3.7) 1 (1.0) 5 (1.8) 0 (0.0)Colombia 13 (5.7) 84 (5.8) 1 (1.1) 1 (0.1) 1 (0.8)Cyprus 24 (2.8) 76 (2.8) 0 (0.0) 0 (0.0) 0 (0.0)Czech Republic 97 (1.2) 1 (0.0) 1 (0.0) 2 (0.8) 0 (0.0)Egypt 6 (1.7) 91 (2.2) 0 (0.5) 0 (0.0) 2 (1.4)El Salvador 0 (0.0) 27 (4.5) 67 (4.6) 6 (2.0) 0 (0.0)England 30 (3.3) 64 (3.4) 6 (1.6) 0 (0.0) 0 (0.0)Georgia 96 (1.5) 4 (1.5) 0 (0.0) 0 (0.0) 0 (0.0)Ghana 0 (0.0) 6 (1.8) 75 (3.6) 19 (3.3) 0 (0.0)Hong Kong SAR 26 (3.7) 62 (3.8) 12 (3.1) 1 (0.9) 0 (0.0)Hungary – – – – – – – – – –Indonesia 0 (0.0) 76 (3.6) 20 (3.3) 4 (1.4) 0 (0.0)Iran, Islamic Rep. of 1 (0.0) 49 (4.0) 51 (4.0) 0 (0.0) 0 (0.0)Israel 29 (2.6) 67 (3.1) 4 (2.0) 0 (0.0) 0 (0.0)Italy 14 (2.4) 86 (2.4) 0 (0.0) 0 (0.0) 0 (0.0)Japan 8 (2.1) 90 (2.5) 2 (1.2) 0 (0.0) 0 (0.0)Jordan 13 (2.6) 76 (3.4) 11 (2.2) 0 (0.0) 0 (0.0)Korea, Rep. of 32 (3.1) 68 (3.1) 0 (0.0) 0 (0.0) 0 (0.0)Kuwait r 3 (1.6) 96 (1.8) 1 (0.0) 0 (0.0) 0 (0.0)Lebanon 9 (2.3) 63 (4.5) 0 (0.0) 28 (4.2) 0 (0.0)Lithuania 42 (4.1) 39 (4.1) 18 (3.5) 1 (0.5) 0 (0.0)Malaysia 6 (2.0) 76 (3.4) 15 (2.6) 3 (1.5) 0 (0.0)Malta 5 (0.1) 83 (0.1) 6 (0.1) 6 (0.1) 0 (0.0)Norway 9 (2.0) 76 (3.0) 13 (2.4) 0 (0.0) 1 (0.9)Oman 1 (0.5) 99 (0.9) 1 (0.0) 0 (0.0) 0 (0.0)Palestinian Nat'l Auth. 4 (1.6) 81 (3.1) 14 (2.9) 0 (0.0) 1 (0.9)Qatar 16 (0.1) 81 (0.1) 2 (0.0) 0 (0.0) 1 (0.0)Romania 9 (2.3) 71 (3.7) 19 (3.0) 0 (0.3) 1 (0.5)Russian Federation 79 (2.7) 20 (2.8) 1 (0.4) 0 (0.0) 0 (0.0)Saudi Arabia 1 (0.0) 96 (1.5) 3 (1.2) 0 (0.0) 0 (0.0)Scotland 30 (3.3) 70 (3.3) 0 (0.0) 0 (0.0) 0 (0.0)Serbia 1 (0.7) 38 (3.7) 59 (3.8) 2 (1.0) 0 (0.0)Singapore 6 (1.5) 89 (1.8) 4 (1.0) 0 (0.0) 0 (0.0)Slovenia 1 (0.6) 45 (3.3) 50 (3.1) 4 (1.1) 0 (0.0)Sweden 50 (2.9) 41 (2.9) 8 (1.6) 1 (0.6) 0 (0.0)Syrian Arab Republic 2 (1.3) 5 (1.9) 89 (2.6) 3 (1.2) 2 (1.0)Thailand 11 (2.7) 88 (2.9) 0 (0.0) 1 (0.9) 0 (0.0)Tunisia 0 (0.0) 71 (3.6) 27 (3.5) 2 (1.1) 0 (0.0)Turkey 7 (2.4) 66 (4.0) 27 (3.5) 0 (0.0) 0 (0.0)Ukraine 1 (0.7) 98 (1.1) 1 (0.0) 0 (0.0) 0 (0.0)United States 56 (2.9) 43 (2.8) 0 (0.4) 0 (0.0) 0 (0.0)
¶ Morocco r 2 (1.7) 9 (2.7) 14 (3.1) 58 (5.8) 17 (5.2)International Avg. 21 (0.3) 57 (0.4) 18 (0.3) 3 (0.2) 1 (0.1)
Benchmarking ParticipantsBasque Country, Spain 49 (4.5) 51 (4.5) 0 (0.0) 0 (0.0) 0 (0.0)British Columbia, Canada 59 (4.3) 40 (4.4) 1 (0.9) 0 (0.0) 0 (0.0)Dubai, UAE s 3 (1.1) 92 (1.4) 6 (1.2) 0 (0.0) 0 (0.0)Massachusetts, US 64 (6.4) 36 (6.4) 0 (0.0) 0 (0.0) 0 (0.0)Minnesota, US 49 (7.2) 51 (7.2) 0 (0.0) 0 (0.0) 0 (0.0)Ontario, Canada 76 (3.8) 22 (3.7) 2 (1.1) 0 (0.0) 0 (0.0)Quebec, Canada 16 (3.4) 82 (3.6) 1 (1.0) 0 (0.0) 0 (0.0)
Background data provided by teachers.* Based on countries’ categorizations to UNESCO’s International Standard Classification
of Education (Operational Manual for ISCED-1997).** For example, doctorate, master’s, other postgraduate degree or diploma.¶ Did not satisfy guidelines for sample participation rates (see Appendix A).
( ) Standard errors appear in parentheses. Because results are rounded to the nearest whole number, some totals may appear inconsistent.
A dash (–) indicates comparable data are not available. An “r” indicates data are available for at least 70 but less than 85% of the students. An “s” indicates data are available for at least 50 but less than 70% of the students.
SOU
RCE:
IEA
’s Tr
ends
in In
tern
atio
nal M
athe
mat
ics
and
Scie
nce
Stud
y (T
IMSS
) 200
7
Exhibit 6.2 Highest Educational Level of Mathematics Teachers* (Continued)

250 chapter 6: teachers of mathematics
Exhibit 6.3: Teachers' Educational Emphasis on Mathematics and Teaching
Country
Teachers Receive Specific Preparation in How to Teach the
Mathematics Curriculum as
Part of Pre-service Education
Percentage of Students by Their Teachers’ Major Area of Study in Their Post-secondary Education
Primary / Elementary Education with a
Major or Specialization
in Mathematics
Primary / Elementary
Education with a Major or
Specialization in Science but Not
in Mathematics
Mathematics or Science Major or
Specialization Without a Major
in Primary/Elementary Education
Primary / Elementary
Education Without a Major or
Specialization in Mathematics
or Science
Other
Algeria – r 11 (2.9) 6 (2.1) 14 (3.4) 46 (4.9) 22 (3.8)Armenia j 8 (2.1) 1 (0.8) 90 (2.4) 1 (0.5) 1 (0.6)Australia k 7 (1.7) 5 (1.9) 1 (0.8) 84 (2.7) 2 (0.9)Austria k 5 (1.3) 0 (0.0) 0 (0.0) 94 (1.4) 0 (0.2)Chinese Taipei k 27 (3.7) 3 (1.5) 7 (1.9) 41 (4.1) 22 (3.5)Colombia j 16 (4.0) 6 (2.2) 17 (4.1) 43 (4.0) 19 (4.0)Czech Republic k 3 (1.3) 1 (0.9) 4 (1.7) 81 (3.2) 12 (2.3)Denmark k 18 (3.3) 2 (1.0) 40 (4.4) 14 (2.8) 27 (3.7)El Salvador k 11 (2.4) 3 (1.7) 13 (3.0) 35 (4.3) 38 (4.3)England k 11 (2.5) 9 (2.0) 11 (2.5) 50 (3.8) 20 (3.2)Georgia j 56 (4.3) 1 (0.0) 13 (3.2) 19 (3.1) 11 (2.4)Germany k 71 (2.8) 14 (2.3) 3 (0.9) 9 (1.8) 2 (1.0)Hong Kong SAR k 51 (4.2) 2 (1.2) 13 (2.8) 26 (3.4) 8 (2.3)Hungary k 4 (2.3) 3 (1.3) 0 (0.0) 93 (2.6) 0 (0.0)Iran, Islamic Rep. of k 43 (4.0) 6 (2.2) 10 (2.0) 28 (3.0) 13 (2.9)Italy j 0 (0.0) 0 (0.0) 2 (0.7) 4 (1.2) 94 (1.4)Japan k 19 (3.0) 6 (1.3) 2 (1.2) 54 (3.8) 19 (2.8)Kazakhstan k 89 (2.9) 1 (0.8) 3 (1.3) 6 (2.5) 1 (0.4)Kuwait k r 32 (4.0) 1 (1.0) 62 (4.3) 3 (1.6) 1 (0.9)Latvia k 69 (3.4) 2 (0.9) 2 (1.1) 27 (3.2) 0 (0.1)Lithuania k 8 (2.1) 1 (0.4) 2 (0.7) 85 (2.3) 5 (1.7)Morocco j 14 (2.9) 3 (1.4) 26 (3.7) 30 (3.7) 28 (4.1)Netherlands k 22 (3.7) 15 (3.2) 0 (0.0) 61 (4.5) 2 (1.2)New Zealand k 12 (1.9) 7 (1.2) 2 (0.7) 73 (2.4) 6 (0.8)Norway k – – – – – – – – – –Qatar k 18 (0.1) 3 (0.1) 53 (0.2) 3 (0.1) 23 (0.2)Russian Federation k 55 (3.0) 3 (1.2) 6 (1.4) 35 (2.8) 2 (1.0)Scotland k 7 (2.0) 5 (1.6) 3 (1.2) 74 (3.4) 11 (2.2)Singapore k 51 (3.0) 6 (1.4) 13 (2.0) 15 (2.0) 15 (2.0)Slovak Republic k 3 (1.1) 0 (0.0) 4 (1.5) 91 (1.8) 3 (0.8)Slovenia k 44 (3.0) 14 (2.1) 0 (0.0) 42 (3.1) 0 (0.4)Sweden k 42 (3.6) 2 (0.9) 5 (1.6) 45 (3.4) 5 (1.6)Tunisia k r 3 (1.4) 2 (1.0) 13 (2.9) 24 (4.3) 58 (5.0)Ukraine k 23 (3.5) 1 (1.0) 2 (1.3) 68 (3.6) 6 (1.7)United States k 8 (1.4) 4 (1.1) 2 (0.6) 70 (2.1) 15 (1.6)Yemen k 19 (4.1) 0 (0.0) 39 (4.7) 17 (3.7) 25 (4.0)International Avg. 25 (0.5) 4 (0.2) 14 (0.4) 43 (0.5) 15 (0.4)
Benchmarking ParticipantsAlberta, Canada k 7 (1.9) 6 (1.8) 3 (1.1) 70 (3.5) 14 (3.1)British Columbia, Canada j 7 (2.2) 5 (1.8) 2 (0.7) 72 (4.1) 14 (3.1)Dubai, UAE k r 15 (2.5) 5 (3.3) 59 (4.0) 10 (2.1) 10 (4.4)Massachusetts, US k 9 (3.1) 4 (2.0) 4 (2.1) 70 (4.2) 13 (3.2)Minnesota, US – 10 (3.8) 9 (4.9) 0 (0.0) 77 (6.5) 4 (2.8)Ontario, Canada k 7 (2.9) 6 (2.3) 2 (1.2) 64 (4.5) 21 (3.3)Quebec, Canada k 4 (1.6) 3 (1.4) 1 (0.3) 84 (3.1) 8 (2.6)
Background data provided by National Research Coordinators and by teachers.( ) Standard errors appear in parentheses. Because results are rounded to the nearest
whole number, some totals may appear inconsistent.
A dash (–) indicates comparable data are not available. An “r” indicates data are available for at least 70 but less than 85% of the students.
k Yes j No
SOU
RCE:
IEA
’s Tr
ends
in In
tern
atio
nal M
athe
mat
ics
and
Scie
nce
Stud
y (T
IMSS
) 200
7
Exhibit 6.3 Teachers’ Educational Emphasis on Mathematics and Teaching

251chapter 6: teachers of mathematics
Exhibit 6.3: Teachers' Educational Emphasis on Mathematics and Teaching (Continued)
Country
Teachers Receive Specific Preparation in How to Teach the
Mathematics Curriculum as
Part of Pre-service Education
Percentage of Students by Their Teachers’ Major Area of Study in Their Post-secondary Education1
Education – Mathematics Mathematics Education –
Science Science Education – General Other
Algeria j r 26 (3.8) r 85 (3.3) r 2 (1.5) r 2 (1.4) r 8 (2.6) r 16 (3.4)Armenia j 91 (2.3) 98 (1.1) 15 (2.7) 37 (3.8) 54 (4.5) 40 (3.7)Australia k 46 (4.0) 49 (3.6) 25 (3.6) 34 (3.4) 32 (3.2) 39 (3.6)Bahrain k 73 (2.5) 62 (2.4) 3 (0.1) 9 (1.8) 6 (1.4) 7 (1.2)Bosnia and Herzegovina k 36 (4.0) 96 (1.6) 16 (3.2) 19 (3.6) 30 (3.8) 14 (2.8)Botswana k 61 (4.7) 73 (4.2) 9 (2.5) 19 (3.2) 24 (3.8) 21 (3.4)Bulgaria j 74 (3.7) 96 (1.9) 33 (3.5) 40 (4.0) 68 (3.9) 38 (4.2)Chinese Taipei k 50 (4.5) 81 (3.7) 19 (3.5) 17 (3.2) 54 (4.2) 35 (3.9)Colombia j 58 (5.2) 79 (3.8) 10 (2.5) 15 (3.2) 32 (3.9) 29 (5.8)Cyprus k 27 (2.5) 96 (1.2) 4 (1.2) 8 (1.6) 11 (1.9) 11 (1.4)Czech Republic k 85 (2.8) 62 (3.6) 58 (4.2) 47 (4.1) 24 (3.5) 27 (3.1)Egypt k 71 (4.3) 63 (4.1) 6 (2.0) 4 (1.3) 25 (3.7) 12 (2.6)El Salvador k 46 (4.1) 66 (4.3) 20 (3.5) 29 (4.1) 52 (4.2) 41 (4.4)England k 39 (4.1) 72 (3.6) 8 (2.3) 20 (3.2) 27 (3.6) 33 (3.6)Georgia k 78 (3.5) 46 (5.2) 1 (0.7) 7 (2.8) 7 (3.0) 17 (3.7)Ghana k 57 (4.4) 69 (4.2) 32 (4.2) 42 (4.2) 54 (4.3) 43 (4.5)Hong Kong SAR k 58 (4.6) 62 (4.3) 19 (3.6) 30 (4.0) 36 (4.3) 40 (3.8)Hungary k 96 (1.7) 97 (1.6) 57 (3.9) 58 (3.9) 5 (2.1) 25 (3.1)Indonesia k 75 (3.6) 44 (4.0) 7 (2.2) 8 (2.3) 12 (2.4) 13 (2.8)Iran, Islamic Rep. of k 57 (3.7) 58 (3.8) 3 (1.3) 5 (1.9) 7 (2.1) 11 (2.5)Israel k r 57 (3.6) r 76 (2.8) r 10 (2.1) r 19 (2.8) r 20 (2.6) r 35 (3.6)Italy j – – 16 (2.4) – – 67 (3.1) – – 17 (2.6)Japan k 52 (3.8) 76 (3.3) 3 (1.3) 16 (2.7) 30 (3.4) 19 (2.9)Jordan k 44 (4.0) 86 (2.9) 3 (1.3) 36 (4.5) 21 (3.8) 18 (3.6)Korea, Rep. of k 70 (3.2) 28 (3.2) 1 (0.9) 0 (0.0) 4 (1.2) 4 (1.4)Kuwait k r 61 (4.2) r 62 (4.7) r 6 (2.3) r 7 (2.2) r 9 (2.5) r 2 (1.2)Lebanon k 40 (4.9) 77 (4.4) 14 (3.9) 26 (4.3) 13 (3.1) 20 (4.2)Lithuania k 33 (3.3) 93 (1.9) 1 (0.8) 6 (1.8) 17 (2.7) 11 (2.3)Malaysia k 45 (4.2) 46 (3.9) 11 (2.1) 19 (3.4) 31 (3.9) 41 (4.1)Malta k 76 (0.2) 71 (0.2) 10 (0.2) 7 (0.1) 44 (0.3) 26 (0.2)Norway k r 8 (2.4) r 41 (3.9) r 8 (2.5) r 38 (3.9) r 43 (4.1) r 61 (4.3)Oman k 73 (3.8) 71 (3.5) 3 (1.8) 2 (1.6) 6 (1.9) 12 (2.9)Palestinian Nat'l Auth. k 47 (3.9) 78 (3.5) 8 (2.5) 9 (2.3) 24 (3.5) 4 (1.4)Qatar j 65 (0.1) 70 (0.2) 3 (0.0) 10 (0.1) 10 (0.1) 6 (0.1)Romania k 65 (3.8) 97 (1.8) 11 (2.3) 26 (3.7) 68 (3.5) 16 (3.3)Russian Federation k 70 (3.2) 99 (0.8) 15 (2.4) 20 (2.6) 55 (3.3) 17 (2.1)Saudi Arabia k 43 (4.6) r 70 (4.3) r 1 (0.5) r 0 (0.3) r 1 (0.5) r 1 (0.7)Scotland k 46 (3.8) 87 (2.3) 3 (1.1) 24 (2.2) 15 (2.4) 22 (2.4)Serbia k 41 (3.6) 95 (1.9) 2 (1.3) 11 (2.5) 28 (3.9) 12 (2.9)Singapore k 49 (2.9) 69 (2.4) 18 (2.1) 46 (2.5) 34 (3.0) 50 (2.9)Slovenia k 94 (1.3) 9 (1.6) 21 (2.2) 3 (0.8) 9 (1.7) 22 (2.4)Sweden k 63 (2.5) 50 (3.2) 62 (3.1) 44 (3.5) 30 (2.8) 28 (3.0)Syrian Arab Republic k 17 (3.2) 92 (2.1) 2 (1.2) 5 (1.7) 6 (1.3) 11 (2.9)Thailand k 4 (1.7) 72 (3.8) 1 (0.0) 4 (1.3) 4 (1.8) 23 (3.6)Tunisia k 13 (2.8) 92 (2.0) 4 (1.5) 15 (2.8) 3 (1.5) 13 (2.6)Turkey k 69 (3.9) 49 (4.0) 12 (3.0) 14 (2.6) 29 (4.2) 9 (2.5)Ukraine k 59 (4.0) 53 (4.2) 3 (1.4) 4 (1.4) 11 (2.7) 12 (2.8)United States k 49 (2.9) 42 (3.0) 7 (1.7) 9 (1.9) 56 (2.7) 34 (2.7)
¶ Morocco k r 27 (4.9) r 87 (3.4) r 6 (2.7) r 17 (4.0) r 7 (3.0) r 11 (3.2)International Avg. 54 (0.5) 70 (0.5) 12 (0.3) 19 (0.4) 25 (0.4) 22 (0.4)
Benchmarking ParticipantsBasque Country, Spain j 31 (4.9) 36 (5.0) 37 (4.6) 32 (5.1) 15 (3.1) 25 (4.1)British Columbia, Canada j 33 (4.0) 25 (3.9) 29 (3.5) 42 (3.9) 39 (4.0) 56 (4.8)Dubai, UAE k s 50 (5.3) s 88 (2.5) s 7 (2.9) s 20 (4.1) s 22 (3.3) s 10 (2.8)Massachusetts, US k 26 (5.0) 43 (7.2) 3 (1.6) 13 (3.8) 57 (6.7) 39 (7.0)Minnesota, US k 72 (5.9) 50 (7.3) 3 (2.3) 4 (2.5) 60 (6.3) 25 (6.5)Ontario, Canada k 12 (3.2) 11 (3.1) 18 (3.5) 20 (3.3) 62 (4.6) 72 (3.7)Quebec, Canada k 57 (4.1) 33 (4.0) 14 (3.4) 25 (4.0) 19 (3.4) 31 (3.8)
Background data provided by National Research Coordinators and by teachers.1 Teachers who responded that they majored in more than one area are reflected in all
categories that apply.¶ Did not satisfy guidelines for sample participation rates (see Appendix A).
( ) Standard errors appear in parentheses. Because results are rounded to the nearest whole number, some totals may appear inconsistent.
A dash (–) indicates comparable data are not available. An “r” indicates data are available for at least 70 but less than 85% of the students. An “s” indicates data are available for at least 50 but less than 70% of the students.
k Yes j No
SOU
RCE:
IEA
’s Tr
ends
in In
tern
atio
nal M
athe
mat
ics
and
Scie
nce
Stud
y (T
IMSS
) 200
7
Exhibit 6.3 Teachers’ Educational Emphasis on Mathematics and Teaching (Continued)

252 chapter 6: teachers of mathematics
Background data provided by teachers.( ) Standard errors appear in parentheses. Because results are rounded to the nearest
whole number, some totals may appear inconsistent.
An “r” indicates data are available for at least 70 but less than 85% of the students. An “s” indicates data are available for at least 50 but less than 70% of the students.
Exhibit 6.4: Teachers’ Participation in Professional Development in Mathematics
Country
Percentage of Students by Their Teachers’ Participation in Professional Development in Mathematics in the Past 2 Years
Mathematics Content
Mathematics Pedagogy / Instruction
Mathematics Curriculum
Integrating Information
Technology into Mathematics
Improving Students’
Critical Thinking or Problem
Solving Skills
Mathematics Assessment
Algeria 44 (4.8) 53 (4.4) 50 (4.8) 10 (2.6) 42 (4.3) 45 (4.4)Armenia 64 (4.0) 77 (3.5) 75 (3.6) 39 (4.1) 51 (3.5) 62 (3.5)Australia 71 (3.1) 63 (3.7) 73 (3.7) 35 (3.9) 53 (4.3) 52 (3.5)Austria 56 (3.1) 32 (3.1) 11 (1.9) 6 (1.7) 22 (2.7) 20 (2.6)Chinese Taipei 67 (3.8) 74 (3.5) 71 (3.9) 42 (4.0) 33 (3.7) 33 (4.0)Colombia 42 (5.6) 37 (5.3) 46 (6.0) 28 (4.6) 52 (5.0) 37 (5.4)Czech Republic 20 (3.0) 35 (3.8) 20 (3.3) 33 (3.5) 31 (3.6) 21 (3.5)Denmark 23 (3.4) 23 (3.4) 9 (2.6) 21 (3.0) 9 (2.2) 5 (2.0)El Salvador 26 (3.7) 28 (3.9) 12 (2.7) 13 (2.9) 34 (4.2) 26 (3.9)England 60 (3.6) 70 (3.5) 65 (3.7) 44 (4.1) 59 (3.8) 43 (4.5)Georgia 21 (3.5) 41 (3.6) 39 (4.3) 18 (3.4) 55 (4.6) 53 (5.1)Germany 44 (3.3) 37 (3.1) 38 (3.3) 7 (1.5) 28 (3.2) 27 (3.1)Hong Kong SAR 74 (3.5) 82 (3.5) 70 (3.6) 49 (4.5) 72 (3.7) 58 (4.3)Hungary 43 (4.1) 47 (4.3) 19 (3.5) 11 (2.7) 26 (3.3) 23 (3.6)Iran, Islamic Rep. of 30 (3.6) 37 (3.6) 25 (3.2) 18 (3.2) 29 (3.9) 27 (3.6)Italy 22 (2.7) 25 (2.6) 14 (2.4) 33 (3.2) 22 (2.6) 14 (2.3)Japan 48 (3.9) 55 (3.6) 16 (2.6) 19 (2.8) 27 (3.4) 21 (2.7)Kazakhstan 63 (5.6) 72 (5.5) 76 (5.0) 56 (4.2) 72 (5.4) 70 (5.6)Kuwait r 27 (4.0) r 34 (4.2) r 20 (3.9) r 25 (4.1) r 30 (4.3) r 28 (4.3)Latvia 43 (3.9) 42 (3.7) 43 (3.8) 17 (3.0) 55 (3.9) 46 (3.5)Lithuania 17 (2.7) 21 (3.1) 18 (3.1) 56 (3.6) 50 (4.1) 30 (2.8)Morocco 11 (2.7) 11 (2.6) 10 (2.3) 3 (0.8) 9 (2.3) 13 (2.8)Netherlands 11 (2.7) 15 (2.5) 6 (1.9) 18 (2.9) 19 (3.0) 10 (2.5)New Zealand 83 (2.1) 76 (2.4) 78 (2.1) 26 (2.4) 54 (2.7) 64 (2.6)Norway 26 (3.2) 30 (3.5) 24 (3.3) 12 (2.8) 18 (2.7) 5 (1.3)Qatar 41 (0.2) 50 (0.2) 40 (0.2) 36 (0.2) 40 (0.2) 38 (0.2)Russian Federation 66 (3.5) 67 (3.0) 68 (3.0) 51 (3.5) 58 (3.6) 55 (3.2)Scotland 44 (4.1) 62 (4.0) 43 (4.1) 51 (4.7) 57 (4.8) 33 (4.2)Singapore 59 (2.6) 70 (2.6) 50 (2.7) 51 (2.9) 66 (2.6) 52 (2.8)Slovak Republic 13 (2.5) 41 (3.4) 46 (3.8) 55 (3.2) 30 (3.3) 24 (2.9)Slovenia 43 (3.0) 35 (3.1) 38 (3.4) 25 (2.8) 17 (2.3) 62 (3.4)Sweden 34 (3.4) 41 (3.3) 35 (3.8) 5 (0.9) 21 (3.1) 25 (3.4)Tunisia 39 (4.0) 57 (3.9) 33 (3.9) 19 (3.1) 36 (3.9) 61 (4.0)Ukraine 65 (3.3) 74 (2.8) 73 (3.3) 64 (3.5) 82 (3.0) 81 (2.7)United States 60 (2.2) 50 (2.6) 63 (2.4) 39 (2.6) 51 (2.5) 47 (2.4)Yemen 20 (4.4) 47 (5.0) 28 (4.3) 6 (2.6) 37 (4.9) 31 (4.8)International Avg. 42 (0.6) 47 (0.6) 40 (0.6) 29 (0.5) 40 (0.6) 37 (0.6)
Benchmarking ParticipantsAlberta, Canada 57 (4.1) 54 (4.2) 52 (3.9) 33 (3.4) 54 (4.2) 46 (4.1)British Columbia, Canada r 73 (3.8) r 59 (4.5) r 67 (3.8) r 17 (3.3) r 64 (4.2) r 39 (4.3)Dubai, UAE r 55 (4.5) s 51 (4.2) s 54 (6.3) s 36 (4.3) s 64 (5.2) r 48 (4.8)Massachusetts, US 77 (6.4) 77 (5.7) 77 (5.6) 44 (5.6) 65 (6.1) 64 (6.8)Minnesota, US 59 (5.2) 57 (4.7) 63 (6.7) 33 (4.9) 49 (8.5) 34 (7.6)Ontario, Canada 68 (4.2) 67 (4.3) 75 (4.3) 30 (4.3) 53 (4.3) 51 (5.9)Quebec, Canada 36 (4.8) 39 (4.6) 41 (4.2) 11 (2.5) 31 (3.8) 39 (4.2)
SOU
RCE:
IEA
’s Tr
ends
in In
tern
atio
nal M
athe
mat
ics
and
Scie
nce
Stud
y (T
IMSS
) 200
7
Exhibit 6.4 Teachers’ Participation in Professional Development in Mathematics

253chapter 6: teachers of mathematics
Exhibit 6.4: Teachers’ Participation in Professional Development in Mathematics (Continued)
Country
Percentage of Students by Their Teachers’ Participation in Professional Development in Mathematics in the Past 2 Years
Mathematics Content
Mathematics Pedagogy / Instruction
Mathematics Curriculum
Integrating Information
Technology into Mathematics
Improving Students’
Critical Thinking or Problem
Solving Skills
Mathematics Assessment
Algeria 51 (4.4) 66 (4.0) 51 (4.4) 27 (3.6) 60 (4.5) 51 (4.5)Armenia 56 (3.9) 67 (3.7) 69 (4.1) 32 (3.9) 38 (4.2) 45 (3.9)Australia 69 (3.8) 61 (3.4) 69 (3.3) 57 (3.2) 45 (3.7) 59 (3.6)Bahrain 33 (2.4) 48 (2.4) 26 (2.2) 69 (2.4) 56 (2.7) 40 (2.5)Bosnia and Herzegovina 67 (3.9) 60 (3.8) 56 (3.6) 39 (3.6) 43 (3.8) 46 (4.3)Botswana 20 (3.5) 12 (2.5) 11 (2.7) 13 (3.2) 27 (4.1) 27 (4.0)Bulgaria 59 (3.6) 42 (3.4) 60 (3.6) 69 (3.5) 25 (3.0) 44 (3.4)Chinese Taipei 84 (2.9) 79 (3.3) 84 (3.1) 73 (3.6) 40 (4.1) 52 (4.5)Colombia 70 (4.0) 64 (5.5) 67 (4.3) 51 (4.9) 60 (4.6) 53 (4.6)Cyprus 69 (2.9) 70 (2.7) 56 (2.3) 59 (3.4) 46 (2.7) 48 (2.9)Czech Republic 47 (4.2) 45 (4.1) 35 (3.8) 49 (4.6) 28 (3.3) 22 (3.3)Egypt 46 (4.0) 66 (3.9) 34 (4.1) 54 (4.1) 77 (3.4) 51 (3.7)El Salvador 49 (4.0) 42 (3.9) 26 (3.9) 26 (3.7) 45 (4.0) 38 (4.4)England 66 (3.9) 79 (3.3) 61 (4.3) 62 (4.2) 40 (3.7) 58 (3.9)Georgia 30 (4.3) 49 (4.6) 52 (5.5) 26 (4.3) 59 (5.3) 64 (5.0)Ghana 60 (3.9) 38 (3.6) 44 (3.8) 13 (2.5) 44 (4.3) 46 (4.2)Hong Kong SAR 78 (3.5) 71 (4.0) 72 (4.0) 63 (4.3) 60 (4.7) 56 (4.1)Hungary 51 (3.9) 53 (3.3) 28 (3.9) 26 (3.6) 34 (4.1) 32 (3.7)Indonesia 71 (3.9) 69 (4.2) 77 (3.8) 29 (4.0) 57 (4.4) 69 (4.0)Iran, Islamic Rep. of 57 (4.3) 78 (3.1) 47 (3.8) 28 (3.4) 52 (3.9) 44 (3.8)Israel r 59 (3.6) r 63 (3.6) r 50 (3.7) r 35 (3.5) r 45 (3.6) r 33 (3.6)Italy 16 (2.1) 34 (3.3) 15 (2.0) 43 (3.1) 9 (1.6) 17 (2.7)Japan 74 (3.4) 76 (3.4) 31 (3.5) 27 (3.3) 39 (3.7) 39 (3.5)Jordan 57 (4.2) 78 (3.3) 62 (3.9) 65 (4.4) 67 (3.5) 53 (3.4)Korea, Rep. of 48 (3.3) 50 (3.5) 41 (3.3) 31 (3.2) 22 (2.8) 33 (3.2)Kuwait r 45 (4.4) r 62 (4.2) r 30 (3.8) r 45 (5.1) r 69 (4.6) r 43 (4.7)Lebanon 68 (3.6) 67 (3.6) 54 (4.7) 50 (5.0) 68 (4.2) 70 (3.7)Lithuania 85 (2.7) 81 (3.1) 71 (3.3) 69 (3.5) 52 (3.8) 65 (3.8)Malaysia 57 (4.0) 46 (4.2) 52 (4.0) 61 (3.7) 27 (3.8) 38 (3.6)Malta 47 (0.2) 71 (0.2) 60 (0.2) 83 (0.2) 31 (0.2) 68 (0.2)Norway 40 (3.9) 39 (3.9) 44 (4.0) 35 (3.7) 18 (3.2) 22 (3.3)Oman 54 (4.7) 42 (4.0) 58 (4.5) 24 (3.9) 36 (4.1) 48 (4.1)Palestinian Nat'l Auth. 44 (4.3) 47 (4.5) 34 (4.4) 26 (3.6) 45 (4.4) 35 (4.3)Qatar 43 (0.1) 56 (0.2) 37 (0.1) 54 (0.2) 50 (0.1) 43 (0.2)Romania 71 (3.4) 55 (3.4) 53 (3.9) 57 (3.9) 56 (3.8) 69 (3.6)Russian Federation 84 (2.4) 73 (3.0) 74 (3.1) 67 (3.1) 62 (3.0) 60 (2.8)Saudi Arabia 26 (4.1) 47 (4.6) 19 (3.2) 24 (4.1) 34 (4.0) 24 (4.1)Scotland 80 (3.4) 93 (2.0) 74 (3.3) 79 (3.0) 56 (4.1) 71 (3.1)Serbia 72 (4.1) 50 (4.4) 45 (4.3) 33 (3.8) 37 (4.1) 46 (4.0)Singapore 81 (1.8) 88 (1.7) 65 (2.3) 74 (2.0) 63 (2.2) 61 (2.4)Slovenia 70 (2.8) 65 (2.9) 66 (3.2) 62 (3.0) 37 (2.8) 72 (2.8)Sweden 41 (3.1) 48 (3.3) 38 (3.1) 9 (1.8) 28 (3.2) 46 (3.2)Syrian Arab Republic 13 (2.5) 20 (3.4) 17 (3.3) 15 (2.6) 49 (4.1) 32 (4.1)Thailand 82 (3.3) 80 (3.3) 79 (3.6) 73 (3.7) 82 (3.1) 83 (3.1)Tunisia 24 (3.6) 35 (4.4) 26 (3.8) 22 (3.4) 36 (4.1) 32 (4.1)Turkey 47 (4.0) 48 (4.5) 69 (4.0) 18 (3.3) 24 (4.0) 27 (3.8)Ukraine 79 (3.6) 82 (3.1) 81 (3.5) 75 (3.7) 80 (3.3) 83 (3.4)United States 81 (2.1) 76 (2.4) 80 (1.7) 61 (3.0) 65 (2.8) 69 (2.5)
¶ Morocco 24 (4.2) 37 (4.8) 29 (4.2) 22 (5.0) 21 (3.6) 24 (3.9)International Avg. 56 (0.5) 59 (0.5) 51 (0.5) 45 (0.5) 46 (0.5) 48 (0.5)
Benchmarking ParticipantsBasque Country, Spain 24 (4.0) 26 (4.3) 27 (4.7) 32 (4.5) 19 (3.9) 19 (3.7)British Columbia, Canada 77 (3.0) 70 (3.6) 69 (3.5) 51 (3.9) 75 (2.8) 58 (4.0)Dubai, UAE s 65 (3.6) s 57 (3.4) s 60 (4.6) s 57 (3.8) s 67 (4.7) s 62 (4.7)Massachusetts, US 94 (2.9) 91 (3.6) 75 (4.6) 64 (5.6) 65 (6.3) 61 (4.9)Minnesota, US r 78 (6.6) r 75 (5.4) r 80 (5.6) r 57 (7.7) r 62 (7.5) r 63 (6.6)Ontario, Canada 82 (2.9) 73 (3.4) 76 (3.3) 51 (4.5) 67 (4.1) 61 (4.7)Quebec, Canada 57 (3.9) 74 (3.7) 78 (3.6) 27 (3.8) 35 (4.3) 78 (3.6)
Background data provided by teachers.¶ Did not satisfy guidelines for sample participation rates (see Appendix A). ( ) Standard errors appear in parentheses. Because results are rounded to the nearest
whole number, some totals may appear inconsistent.
An “r” indicates data are available for at least 70 but less than 85% of the students. An “s” indicates data are available for at least 50 but less than 70% of the students.
SOU
RCE:
IEA
’s Tr
ends
in In
tern
atio
nal M
athe
mat
ics
and
Scie
nce
Stud
y (T
IMSS
) 200
7
Exhibit 6.4 Teachers’ Participation in Professional Development in Mathematics (Continued)

254 chapter 6: teachers of mathematics
with such professional development in mathematics assessment (37%) and integrating information technology into mathematics (29%). At the eighth grade, the participation in professional development in the areas asked about by TIMSS was somewhat higher, but the pattern was similar. Approximately half the eighth grade students, on average internationally, had teachers that had participated in some type of professional development during the past two years in mathematics content (56%), mathematics pedagogy (59%), mathematics curriculum (51%), mathematics assessment (48%), improving students’ critical thinking or problem solving skills (46%), and integrating information technology into mathematics (45%).
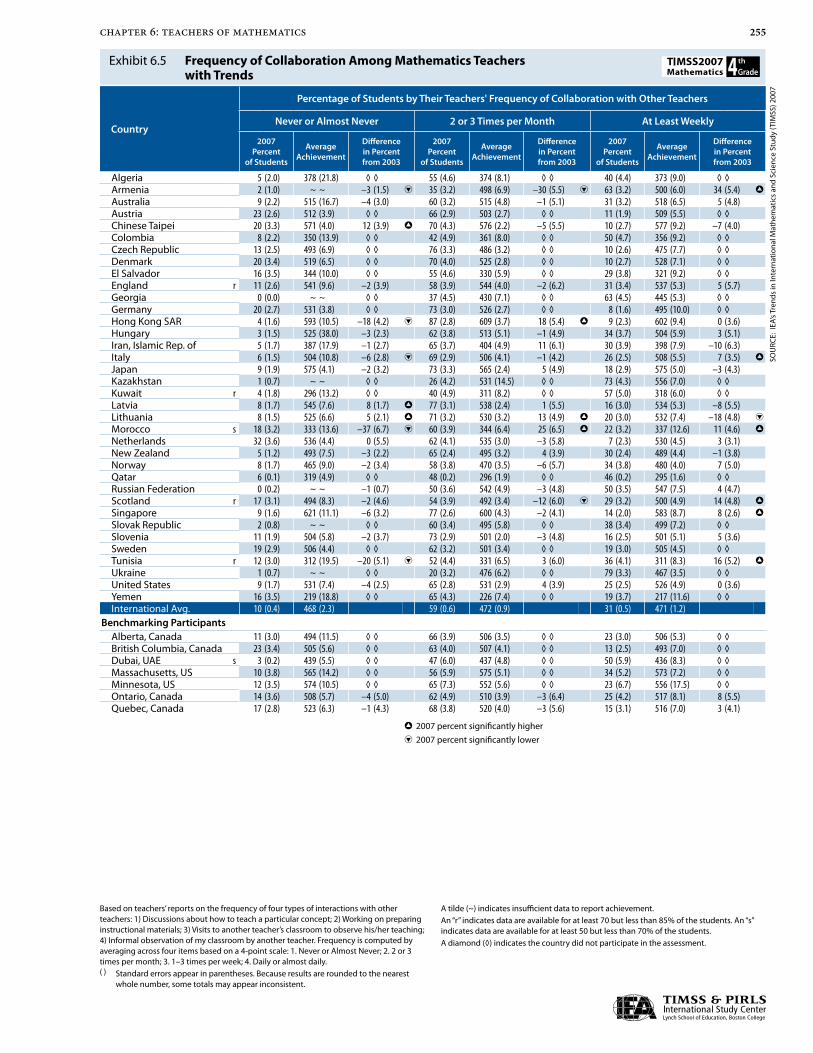
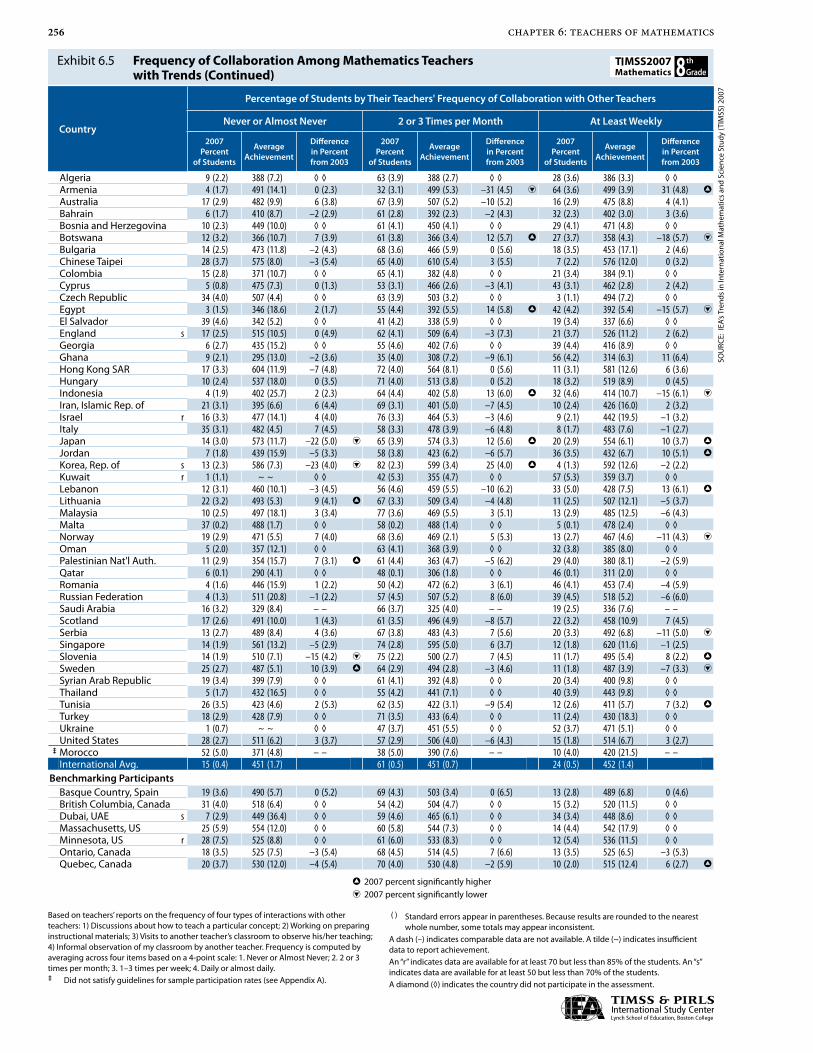
Teachers also were asked about opportunities for collaboration with other teachers. Exhibit 6.5 contains the results in relation to students’ average mathematics achievement and with changes from 2003. Internationally on average, the largest percentages of students at both grades (59 to 61%) had teachers that collaborated with other teachers about 2–3 times a month. Other than that, collaboration tended to be more frequent (at least weekly) rather than less frequent (never or almost never). At the fourth grade, between 2003 and 2007 the frequency of collaboration increased to some extent. In particular, in Armenia, Italy, Morocco, Scotland, Singapore, and Tunisia greater percentages of students had teachers that reported collaborating with other teachers at least weekly (and only Lithuania showed a decrease). At the eighth grade, the percentages of students whose teachers reported at least weekly collaboration increased between 2003 and 2007 in Armenia, Japan, Jordan, Lebanon, Slovenia, and Tunisia as well as the benchmarking province of Quebec. The percentages decreased in Botswana, Egypt, Indonesia, Norway, Serbia, and Sweden.
255chapter 6: teachers of mathematics
Exhibit 6.5: Frequency of Collaboration Among Mathematics Teacherswith Trends
Country
Percentage of Students by Their Teachers' Frequency of Collaboration with Other Teachers
Never or Almost Never 2 or 3 Times per Month At Least Weekly
2007Percent
of Students
Average Achievement
Difference in Percent from 2003
2007Percent
of Students
Average Achievement
Difference in Percent from 2003
2007Percent
of Students
Average Achievement
Difference in Percent from 2003
Algeria 5 (2.0) 378 (21.8) ◊ ◊ 55 (4.6) 374 (8.1) ◊ ◊ 40 (4.4) 373 (9.0) ◊ ◊Armenia 2 (1.0) ~ ~ –3 (1.5) i 35 (3.2) 498 (6.9) –30 (5.5) i 63 (3.2) 500 (6.0) 34 (5.4) h
Australia 9 (2.2) 515 (16.7) –4 (3.0) 60 (3.2) 515 (4.8) –1 (5.1) 31 (3.2) 518 (6.5) 5 (4.8)Austria 23 (2.6) 512 (3.9) ◊ ◊ 66 (2.9) 503 (2.7) ◊ ◊ 11 (1.9) 509 (5.5) ◊ ◊Chinese Taipei 20 (3.3) 571 (4.0) 12 (3.9) h 70 (4.3) 576 (2.2) –5 (5.5) 10 (2.7) 577 (9.2) –7 (4.0)Colombia 8 (2.2) 350 (13.9) ◊ ◊ 42 (4.9) 361 (8.0) ◊ ◊ 50 (4.7) 356 (9.2) ◊ ◊Czech Republic 13 (2.5) 493 (6.9) ◊ ◊ 76 (3.3) 486 (3.2) ◊ ◊ 10 (2.6) 475 (7.7) ◊ ◊Denmark 20 (3.4) 519 (6.5) ◊ ◊ 70 (4.0) 525 (2.8) ◊ ◊ 10 (2.7) 528 (7.1) ◊ ◊El Salvador 16 (3.5) 344 (10.0) ◊ ◊ 55 (4.6) 330 (5.9) ◊ ◊ 29 (3.8) 321 (9.2) ◊ ◊England r 11 (2.6) 541 (9.6) –2 (3.9) 58 (3.9) 544 (4.0) –2 (6.2) 31 (3.4) 537 (5.3) 5 (5.7)Georgia 0 (0.0) ~ ~ ◊ ◊ 37 (4.5) 430 (7.1) ◊ ◊ 63 (4.5) 445 (5.3) ◊ ◊Germany 20 (2.7) 531 (3.8) ◊ ◊ 73 (3.0) 526 (2.7) ◊ ◊ 8 (1.6) 495 (10.0) ◊ ◊Hong Kong SAR 4 (1.6) 593 (10.5) –18 (4.2) i 87 (2.8) 609 (3.7) 18 (5.4) h 9 (2.3) 602 (9.4) 0 (3.6)Hungary 3 (1.5) 525 (38.0) –3 (2.3) 62 (3.8) 513 (5.1) –1 (4.9) 34 (3.7) 504 (5.9) 3 (5.1)Iran, Islamic Rep. of 5 (1.7) 387 (17.9) –1 (2.7) 65 (3.7) 404 (4.9) 11 (6.1) 30 (3.9) 398 (7.9) –10 (6.3)Italy 6 (1.5) 504 (10.8) –6 (2.8) i 69 (2.9) 506 (4.1) –1 (4.2) 26 (2.5) 508 (5.5) 7 (3.5) h
Japan 9 (1.9) 575 (4.1) –2 (3.2) 73 (3.3) 565 (2.4) 5 (4.9) 18 (2.9) 575 (5.0) –3 (4.3)Kazakhstan 1 (0.7) ~ ~ ◊ ◊ 26 (4.2) 531 (14.5) ◊ ◊ 73 (4.3) 556 (7.0) ◊ ◊Kuwait r 4 (1.8) 296 (13.2) ◊ ◊ 40 (4.9) 311 (8.2) ◊ ◊ 57 (5.0) 318 (6.0) ◊ ◊Latvia 8 (1.7) 545 (7.6) 8 (1.7) h 77 (3.1) 538 (2.4) 1 (5.5) 16 (3.0) 534 (5.3) –8 (5.5)Lithuania 8 (1.5) 525 (6.6) 5 (2.1) h 71 (3.2) 530 (3.2) 13 (4.9) h 20 (3.0) 532 (7.4) –18 (4.8) i
Morocco s 18 (3.2) 333 (13.6) –37 (6.7) i 60 (3.9) 344 (6.4) 25 (6.5) h 22 (3.2) 337 (12.6) 11 (4.6) h
Netherlands 32 (3.6) 536 (4.4) 0 (5.5) 62 (4.1) 535 (3.0) –3 (5.8) 7 (2.3) 530 (4.5) 3 (3.1)New Zealand 5 (1.2) 493 (7.5) –3 (2.2) 65 (2.4) 495 (3.2) 4 (3.9) 30 (2.4) 489 (4.4) –1 (3.8)Norway 8 (1.7) 465 (9.0) –2 (3.4) 58 (3.8) 470 (3.5) –6 (5.7) 34 (3.8) 480 (4.0) 7 (5.0)Qatar 6 (0.1) 319 (4.9) ◊ ◊ 48 (0.2) 296 (1.9) ◊ ◊ 46 (0.2) 295 (1.6) ◊ ◊Russian Federation 0 (0.2) ~ ~ –1 (0.7) 50 (3.6) 542 (4.9) –3 (4.8) 50 (3.5) 547 (7.5) 4 (4.7)Scotland r 17 (3.1) 494 (8.3) –2 (4.6) 54 (3.9) 492 (3.4) –12 (6.0) i 29 (3.2) 500 (4.9) 14 (4.8) h
Singapore 9 (1.6) 621 (11.1) –6 (3.2) 77 (2.6) 600 (4.3) –2 (4.1) 14 (2.0) 583 (8.7) 8 (2.6) h
Slovak Republic 2 (0.8) ~ ~ ◊ ◊ 60 (3.4) 495 (5.8) ◊ ◊ 38 (3.4) 499 (7.2) ◊ ◊Slovenia 11 (1.9) 504 (5.8) –2 (3.7) 73 (2.9) 501 (2.0) –3 (4.8) 16 (2.5) 501 (5.1) 5 (3.6)Sweden 19 (2.9) 506 (4.4) ◊ ◊ 62 (3.2) 501 (3.4) ◊ ◊ 19 (3.0) 505 (4.5) ◊ ◊Tunisia r 12 (3.0) 312 (19.5) –20 (5.1) i 52 (4.4) 331 (6.5) 3 (6.0) 36 (4.1) 311 (8.3) 16 (5.2) h
Ukraine 1 (0.7) ~ ~ ◊ ◊ 20 (3.2) 476 (6.2) ◊ ◊ 79 (3.3) 467 (3.5) ◊ ◊United States 9 (1.7) 531 (7.4) –4 (2.5) 65 (2.8) 531 (2.9) 4 (3.9) 25 (2.5) 526 (4.9) 0 (3.6)Yemen 16 (3.5) 219 (18.8) ◊ ◊ 65 (4.3) 226 (7.4) ◊ ◊ 19 (3.7) 217 (11.6) ◊ ◊International Avg. 10 (0.4) 468 (2.3) 59 (0.6) 472 (0.9) 31 (0.5) 471 (1.2)
Benchmarking ParticipantsAlberta, Canada 11 (3.0) 494 (11.5) ◊ ◊ 66 (3.9) 506 (3.5) ◊ ◊ 23 (3.0) 506 (5.3) ◊ ◊British Columbia, Canada 23 (3.4) 505 (5.6) ◊ ◊ 63 (4.0) 507 (4.1) ◊ ◊ 13 (2.5) 493 (7.0) ◊ ◊Dubai, UAE s 3 (0.2) 439 (5.5) ◊ ◊ 47 (6.0) 437 (4.8) ◊ ◊ 50 (5.9) 436 (8.3) ◊ ◊Massachusetts, US 10 (3.8) 565 (14.2) ◊ ◊ 56 (5.9) 575 (5.1) ◊ ◊ 34 (5.2) 573 (7.2) ◊ ◊Minnesota, US 12 (3.5) 574 (10.5) ◊ ◊ 65 (7.3) 552 (5.6) ◊ ◊ 23 (6.7) 556 (17.5) ◊ ◊Ontario, Canada 14 (3.6) 508 (5.7) –4 (5.0) 62 (4.9) 510 (3.9) –3 (6.4) 25 (4.2) 517 (8.1) 8 (5.5)Quebec, Canada 17 (2.8) 523 (6.3) –1 (4.3) 68 (3.8) 520 (4.0) –3 (5.6) 15 (3.1) 516 (7.0) 3 (4.1)
h 2007 percent significantly higheri 2007 percent significantly lower
Based on teachers’ reports on the frequency of four types of interactions with other teachers: 1) Discussions about how to teach a particular concept; 2) Working on preparing instructional materials; 3) Visits to another teacher’s classroom to observe his/her teaching; 4) Informal observation of my classroom by another teacher. Frequency is computed by averaging across four items based on a 4-point scale: 1. Never or Almost Never; 2. 2 or 3 times per month; 3. 1–3 times per week; 4. Daily or almost daily.( ) Standard errors appear in parentheses. Because results are rounded to the nearest
whole number, some totals may appear inconsistent.
A tilde (~) indicates insufficient data to report achievement.An “r” indicates data are available for at least 70 but less than 85% of the students. An “s” indicates data are available for at least 50 but less than 70% of the students. A diamond (◊) indicates the country did not participate in the assessment.
SOU
RCE:
IEA
’s Tr
ends
in In
tern
atio
nal M
athe
mat
ics
and
Scie
nce
Stud
y (T
IMSS
) 200
7
Exhibit 6.5 Frequency of Collaboration Among Mathematics Teacherswith Trends
256 chapter 6: teachers of mathematics
Exhibit 6.5: Frequency of Collaboration Among Mathematics Teacherswith Trends (Continued)
Country
Percentage of Students by Their Teachers' Frequency of Collaboration with Other Teachers
Never or Almost Never 2 or 3 Times per Month At Least Weekly
2007Percent
of Students
Average Achievement
Difference in Percent from 2003
2007Percent
of Students
Average Achievement
Difference in Percent from 2003
2007Percent
of Students
Average Achievement
Difference in Percent from 2003
Algeria 9 (2.2) 388 (7.2) ◊ ◊ 63 (3.9) 388 (2.7) ◊ ◊ 28 (3.6) 386 (3.3) ◊ ◊Armenia 4 (1.7) 491 (14.1) 0 (2.3) 32 (3.1) 499 (5.3) –31 (4.5) i 64 (3.6) 499 (3.9) 31 (4.8) h
Australia 17 (2.9) 482 (9.9) 6 (3.8) 67 (3.9) 507 (5.2) –10 (5.2) 16 (2.9) 475 (8.8) 4 (4.1)Bahrain 6 (1.7) 410 (8.7) –2 (2.9) 61 (2.8) 392 (2.3) –2 (4.3) 32 (2.3) 402 (3.0) 3 (3.6)Bosnia and Herzegovina 10 (2.3) 449 (10.0) ◊ ◊ 61 (4.1) 450 (4.1) ◊ ◊ 29 (4.1) 471 (4.8) ◊ ◊Botswana 12 (3.2) 366 (10.7) 7 (3.9) 61 (3.8) 366 (3.4) 12 (5.7) h 27 (3.7) 358 (4.3) –18 (5.7) i
Bulgaria 14 (2.5) 473 (11.8) –2 (4.3) 68 (3.6) 466 (5.9) 0 (5.6) 18 (3.5) 453 (17.1) 2 (4.6)Chinese Taipei 28 (3.7) 575 (8.0) –3 (5.4) 65 (4.0) 610 (5.4) 3 (5.5) 7 (2.2) 576 (12.0) 0 (3.2)Colombia 15 (2.8) 371 (10.7) ◊ ◊ 65 (4.1) 382 (4.8) ◊ ◊ 21 (3.4) 384 (9.1) ◊ ◊Cyprus 5 (0.8) 475 (7.3) 0 (1.3) 53 (3.1) 466 (2.6) –3 (4.1) 43 (3.1) 462 (2.8) 2 (4.2)Czech Republic 34 (4.0) 507 (4.4) ◊ ◊ 63 (3.9) 503 (3.2) ◊ ◊ 3 (1.1) 494 (7.2) ◊ ◊Egypt 3 (1.5) 346 (18.6) 2 (1.7) 55 (4.4) 392 (5.5) 14 (5.8) h 42 (4.2) 392 (5.4) –15 (5.7) i
El Salvador 39 (4.6) 342 (5.2) ◊ ◊ 41 (4.2) 338 (5.9) ◊ ◊ 19 (3.4) 337 (6.6) ◊ ◊England s 17 (2.5) 515 (10.5) 0 (4.9) 62 (4.1) 509 (6.4) –3 (7.3) 21 (3.7) 526 (11.2) 2 (6.2)Georgia 6 (2.7) 435 (15.2) ◊ ◊ 55 (4.6) 402 (7.6) ◊ ◊ 39 (4.4) 416 (8.9) ◊ ◊Ghana 9 (2.1) 295 (13.0) –2 (3.6) 35 (4.0) 308 (7.2) –9 (6.1) 56 (4.2) 314 (6.3) 11 (6.4)Hong Kong SAR 17 (3.3) 604 (11.9) –7 (4.8) 72 (4.0) 564 (8.1) 0 (5.6) 11 (3.1) 581 (12.6) 6 (3.6)Hungary 10 (2.4) 537 (18.0) 0 (3.5) 71 (4.0) 513 (3.8) 0 (5.2) 18 (3.2) 519 (8.9) 0 (4.5)Indonesia 4 (1.9) 402 (25.7) 2 (2.3) 64 (4.4) 402 (5.8) 13 (6.0) h 32 (4.6) 414 (10.7) –15 (6.1) i
Iran, Islamic Rep. of 21 (3.1) 395 (6.6) 6 (4.4) 69 (3.1) 401 (5.0) –7 (4.5) 10 (2.4) 426 (16.0) 2 (3.2)Israel r 16 (3.3) 477 (14.1) 4 (4.0) 76 (3.3) 464 (5.3) –3 (4.6) 9 (2.1) 442 (19.5) –1 (3.2)Italy 35 (3.1) 482 (4.5) 7 (4.5) 58 (3.3) 478 (3.9) –6 (4.8) 8 (1.7) 483 (7.6) –1 (2.7)Japan 14 (3.0) 573 (11.7) –22 (5.0) i 65 (3.9) 574 (3.3) 12 (5.6) h 20 (2.9) 554 (6.1) 10 (3.7) h
Jordan 7 (1.8) 439 (15.9) –5 (3.3) 58 (3.8) 423 (6.2) –6 (5.7) 36 (3.5) 432 (6.7) 10 (5.1) h
Korea, Rep. of s 13 (2.3) 586 (7.3) –23 (4.0) i 82 (2.3) 599 (3.4) 25 (4.0) h 4 (1.3) 592 (12.6) –2 (2.2)Kuwait r 1 (1.1) ~ ~ ◊ ◊ 42 (5.3) 355 (4.7) ◊ ◊ 57 (5.3) 359 (3.7) ◊ ◊Lebanon 12 (3.1) 460 (10.1) –3 (4.5) 56 (4.6) 459 (5.5) –10 (6.2) 33 (5.0) 428 (7.5) 13 (6.1) h
Lithuania 22 (3.2) 493 (5.3) 9 (4.1) h 67 (3.3) 509 (3.4) –4 (4.8) 11 (2.5) 507 (12.1) –5 (3.7)Malaysia 10 (2.5) 497 (18.1) 3 (3.4) 77 (3.6) 469 (5.5) 3 (5.1) 13 (2.9) 485 (12.5) –6 (4.3)Malta 37 (0.2) 488 (1.7) ◊ ◊ 58 (0.2) 488 (1.4) ◊ ◊ 5 (0.1) 478 (2.4) ◊ ◊Norway 19 (2.9) 471 (5.5) 7 (4.0) 68 (3.6) 469 (2.1) 5 (5.3) 13 (2.7) 467 (4.6) –11 (4.3) i
Oman 5 (2.0) 357 (12.1) ◊ ◊ 63 (4.1) 368 (3.9) ◊ ◊ 32 (3.8) 385 (8.0) ◊ ◊Palestinian Nat'l Auth. 11 (2.9) 354 (15.7) 7 (3.1) h 61 (4.4) 363 (4.7) –5 (6.2) 29 (4.0) 380 (8.1) –2 (5.9)Qatar 6 (0.1) 290 (4.1) ◊ ◊ 48 (0.1) 306 (1.8) ◊ ◊ 46 (0.1) 311 (2.0) ◊ ◊Romania 4 (1.6) 446 (15.9) 1 (2.2) 50 (4.2) 472 (6.2) 3 (6.1) 46 (4.1) 453 (7.4) –4 (5.9)Russian Federation 4 (1.3) 511 (20.8) –1 (2.2) 57 (4.5) 507 (5.2) 8 (6.0) 39 (4.5) 518 (5.2) –6 (6.0)Saudi Arabia 16 (3.2) 329 (8.4) – – 66 (3.7) 325 (4.0) – – 19 (2.5) 336 (7.6) – –Scotland 17 (2.6) 491 (10.0) 1 (4.3) 61 (3.5) 496 (4.9) –8 (5.7) 22 (3.2) 458 (10.9) 7 (4.5)Serbia 13 (2.7) 489 (8.4) 4 (3.6) 67 (3.8) 483 (4.3) 7 (5.6) 20 (3.3) 492 (6.8) –11 (5.0) i
Singapore 14 (1.9) 561 (13.2) –5 (2.9) 74 (2.8) 595 (5.0) 6 (3.7) 12 (1.8) 620 (11.6) –1 (2.5)Slovenia 14 (1.9) 510 (7.1) –15 (4.2) i 75 (2.2) 500 (2.7) 7 (4.5) 11 (1.7) 495 (5.4) 8 (2.2) h
Sweden 25 (2.7) 487 (5.1) 10 (3.9) h 64 (2.9) 494 (2.8) –3 (4.6) 11 (1.8) 487 (3.9) –7 (3.3) i
Syrian Arab Republic 19 (3.4) 399 (7.9) ◊ ◊ 61 (4.1) 392 (4.8) ◊ ◊ 20 (3.4) 400 (9.8) ◊ ◊Thailand 5 (1.7) 432 (16.5) ◊ ◊ 55 (4.2) 441 (7.1) ◊ ◊ 40 (3.9) 443 (9.8) ◊ ◊Tunisia 26 (3.5) 423 (4.6) 2 (5.3) 62 (3.5) 422 (3.1) –9 (5.4) 12 (2.6) 411 (5.7) 7 (3.2) h
Turkey 18 (2.9) 428 (7.9) ◊ ◊ 71 (3.5) 433 (6.4) ◊ ◊ 11 (2.4) 430 (18.3) ◊ ◊Ukraine 1 (0.7) ~ ~ ◊ ◊ 47 (3.7) 451 (5.5) ◊ ◊ 52 (3.7) 471 (5.1) ◊ ◊United States 28 (2.7) 511 (6.2) 3 (3.7) 57 (2.9) 506 (4.0) –6 (4.3) 15 (1.8) 514 (6.7) 3 (2.7)
¶ Morocco 52 (5.0) 371 (4.8) – – 38 (5.0) 390 (7.6) – – 10 (4.0) 420 (21.5) – –International Avg. 15 (0.4) 451 (1.7) 61 (0.5) 451 (0.7) 24 (0.5) 452 (1.4)
Benchmarking ParticipantsBasque Country, Spain 19 (3.6) 490 (5.7) 0 (5.2) 69 (4.3) 503 (3.4) 0 (6.5) 13 (2.8) 489 (6.8) 0 (4.6)British Columbia, Canada 31 (4.0) 518 (6.4) ◊ ◊ 54 (4.2) 504 (4.7) ◊ ◊ 15 (3.2) 520 (11.5) ◊ ◊Dubai, UAE s 7 (2.9) 449 (36.4) ◊ ◊ 59 (4.6) 465 (6.1) ◊ ◊ 34 (3.4) 448 (8.6) ◊ ◊Massachusetts, US 25 (5.9) 554 (12.0) ◊ ◊ 60 (5.8) 544 (7.3) ◊ ◊ 14 (4.4) 542 (17.9) ◊ ◊Minnesota, US r 28 (7.5) 525 (8.8) ◊ ◊ 61 (6.0) 533 (8.3) ◊ ◊ 12 (5.4) 536 (11.5) ◊ ◊Ontario, Canada 18 (3.5) 525 (7.5) –3 (5.4) 68 (4.5) 514 (4.5) 7 (6.6) 13 (3.5) 525 (6.5) –3 (5.3)Quebec, Canada 20 (3.7) 530 (12.0) –4 (5.4) 70 (4.0) 530 (4.8) –2 (5.9) 10 (2.0) 515 (12.4) 6 (2.7) h
h 2007 percent significantly higheri 2007 percent significantly lower
Based on teachers’ reports on the frequency of four types of interactions with other teachers: 1) Discussions about how to teach a particular concept; 2) Working on preparing instructional materials; 3) Visits to another teacher’s classroom to observe his/her teaching; 4) Informal observation of my classroom by another teacher. Frequency is computed by averaging across four items based on a 4-point scale: 1. Never or Almost Never; 2. 2 or 3 times per month; 3. 1–3 times per week; 4. Daily or almost daily.¶ Did not satisfy guidelines for sample participation rates (see Appendix A).
( ) Standard errors appear in parentheses. Because results are rounded to the nearest whole number, some totals may appear inconsistent.
A dash (–) indicates comparable data are not available. A tilde (~) indicates insufficient data to report achievement.An “r” indicates data are available for at least 70 but less than 85% of the students. An “s” indicates data are available for at least 50 but less than 70% of the students. A diamond (◊) indicates the country did not participate in the assessment.
SOU
RCE:
IEA
’s Tr
ends
in In
tern
atio
nal M
athe
mat
ics
and
Scie
nce
Stud
y (T
IMSS
) 200
7
Exhibit 6.5 Frequency of Collaboration Among Mathematics Teacherswith Trends (Continued)
257chapter 6: teachers of mathematics
How Well Prepared Do Teachers Feel They Are to Teach Mathematics?
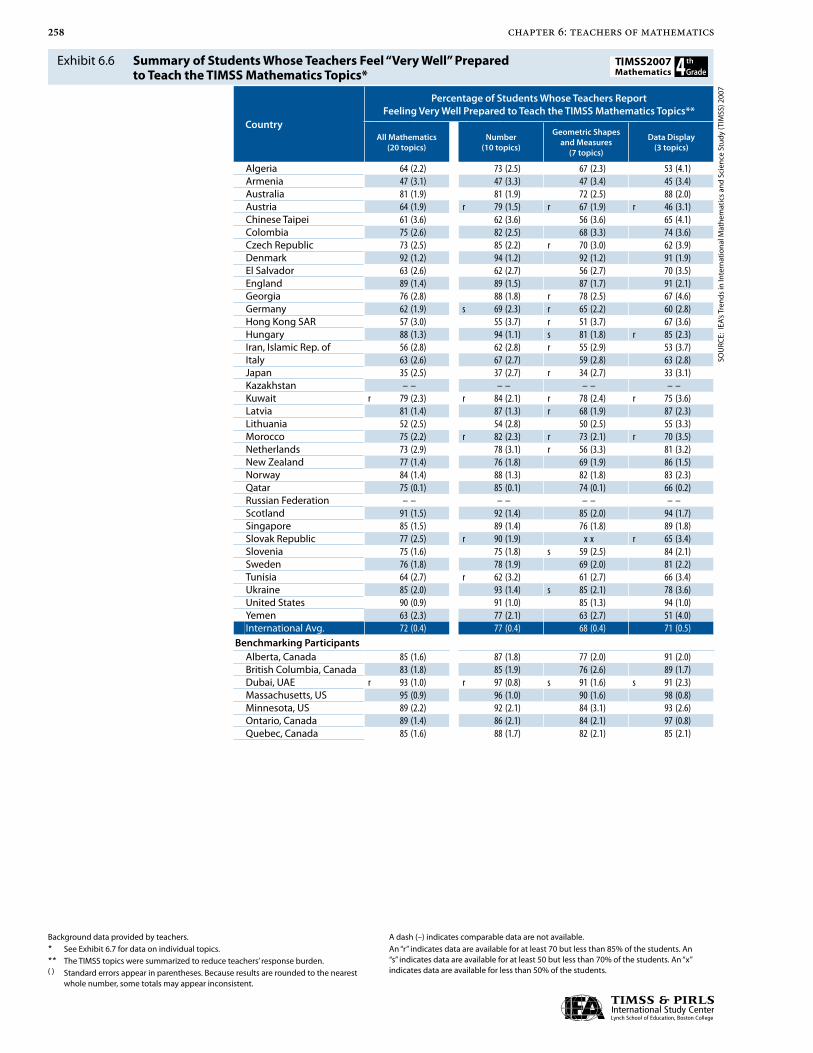
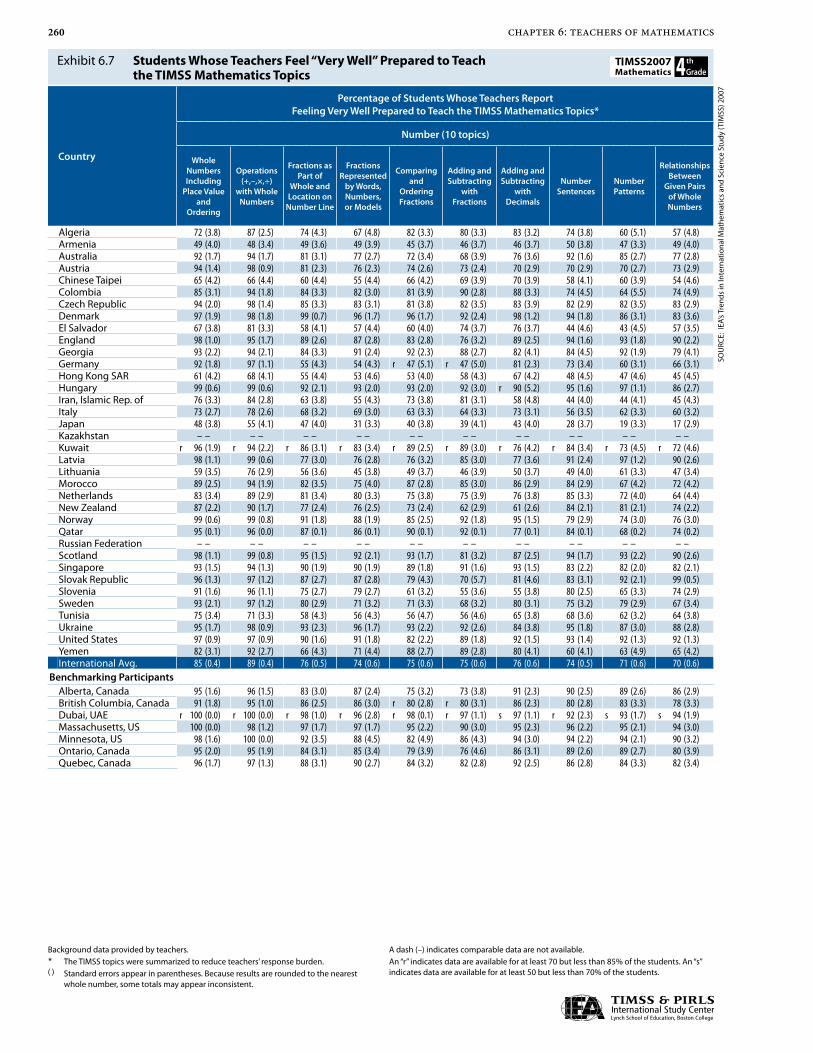
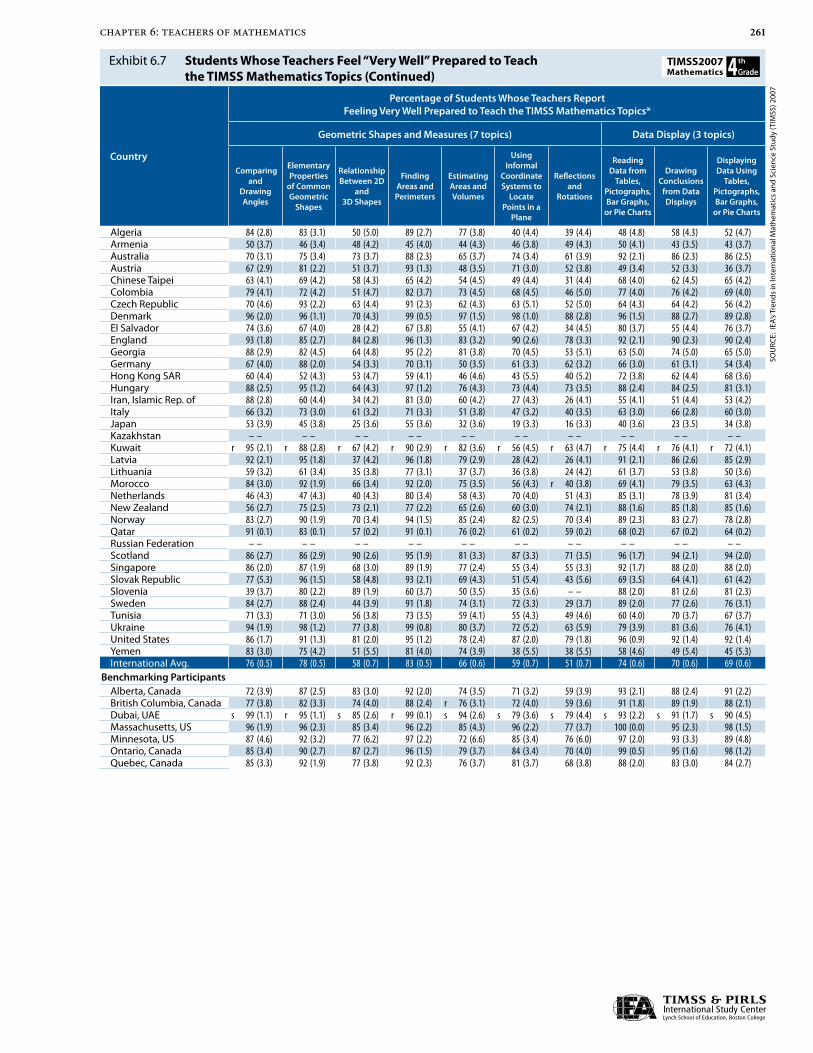
TIMSS 2007 asked the students’ teachers of mathematics how prepared they felt to teach a subset of the mathematics topics included in the TIMSS 2007 mathematics framework. At the fourth grade, teachers were asked about 20 topics in total, including 10 topics in number, 7 topics in geometric shapes and measures, and 3 topics in data display. At the eighth grade, teachers were asked about 18 topics in total, including 5 topics in number, 4 topics in algebra, 6 topics in geometry, and 3 topics in data and chance. The percentages of students with teachers that reported feeling “Very Well” prepared to teach the various topics are presented in Exhibits 6.6 and 6.7. In Exhibit 6.6, the results are summarized across all the mathematics topics and by content domain, and Exhibit 6.7 presents the results for each topic.
At the fourth grade, the average across all mathematics topics was 72 percent. The number content domain had the highest average percent across topics internationally (77 percent), approaching 90 percent for the whole number topics and never falling below 70 percent for any topic. The average across the topics in the geometric shapes and measures content domain was 68 percent, with considerable variation from topic to topic. Most fourth grade students (83%) were taught by teachers who reported feeling very well prepared to teach about finding areas and perimeters, but the percents were lower for other topics—down to as low as about half (51%) for reflections and rotations. The percents for the data display topics were very similar (69–74%).
258 chapter 6: teachers of mathematics
Exhibit 6.6: Summary of Students Whose Teachers Feel “Very Well” Prepared to Teach the TIMSS Mathematics Topics*
Country
Percentage of Students Whose Teachers Report Feeling Very Well Prepared to Teach the TIMSS Mathematics Topics**
All Mathematics(20 topics)
Number(10 topics)
Geometric Shapes and Measures
(7 topics)
Data Display(3 topics)
Algeria 64 (2.2) 73 (2.5) 67 (2.3) 53 (4.1)Armenia 47 (3.1) 47 (3.3) 47 (3.4) 45 (3.4)Australia 81 (1.9) 81 (1.9) 72 (2.5) 88 (2.0)Austria 64 (1.9) r 79 (1.5) r 67 (1.9) r 46 (3.1)Chinese Taipei 61 (3.6) 62 (3.6) 56 (3.6) 65 (4.1)Colombia 75 (2.6) 82 (2.5) 68 (3.3) 74 (3.6)Czech Republic 73 (2.5) 85 (2.2) r 70 (3.0) 62 (3.9)Denmark 92 (1.2) 94 (1.2) 92 (1.2) 91 (1.9)El Salvador 63 (2.6) 62 (2.7) 56 (2.7) 70 (3.5)England 89 (1.4) 89 (1.5) 87 (1.7) 91 (2.1)Georgia 76 (2.8) 88 (1.8) r 78 (2.5) 67 (4.6)Germany 62 (1.9) s 69 (2.3) r 65 (2.2) 60 (2.8)Hong Kong SAR 57 (3.0) 55 (3.7) r 51 (3.7) 67 (3.6)Hungary 88 (1.3) 94 (1.1) s 81 (1.8) r 85 (2.3)Iran, Islamic Rep. of 56 (2.8) 62 (2.8) r 55 (2.9) 53 (3.7)Italy 63 (2.6) 67 (2.7) 59 (2.8) 63 (2.8)Japan 35 (2.5) 37 (2.7) r 34 (2.7) 33 (3.1)Kazakhstan – – – – – – – –Kuwait r 79 (2.3) r 84 (2.1) r 78 (2.4) r 75 (3.6)Latvia 81 (1.4) 87 (1.3) r 68 (1.9) 87 (2.3)Lithuania 52 (2.5) 54 (2.8) 50 (2.5) 55 (3.3)Morocco 75 (2.2) r 82 (2.3) r 73 (2.1) r 70 (3.5)Netherlands 73 (2.9) 78 (3.1) r 56 (3.3) 81 (3.2)New Zealand 77 (1.4) 76 (1.8) 69 (1.9) 86 (1.5)Norway 84 (1.4) 88 (1.3) 82 (1.8) 83 (2.3)Qatar 75 (0.1) 85 (0.1) 74 (0.1) 66 (0.2)Russian Federation – – – – – – – –Scotland 91 (1.5) 92 (1.4) 85 (2.0) 94 (1.7)Singapore 85 (1.5) 89 (1.4) 76 (1.8) 89 (1.8)Slovak Republic 77 (2.5) r 90 (1.9) x x r 65 (3.4)Slovenia 75 (1.6) 75 (1.8) s 59 (2.5) 84 (2.1)Sweden 76 (1.8) 78 (1.9) 69 (2.0) 81 (2.2)Tunisia 64 (2.7) r 62 (3.2) 61 (2.7) 66 (3.4)Ukraine 85 (2.0) 93 (1.4) s 85 (2.1) 78 (3.6)United States 90 (0.9) 91 (1.0) 85 (1.3) 94 (1.0)Yemen 63 (2.3) 77 (2.1) 63 (2.7) 51 (4.0)International Avg. 72 (0.4) 77 (0.4) 68 (0.4) 71 (0.5)
Benchmarking ParticipantsAlberta, Canada 85 (1.6) 87 (1.8) 77 (2.0) 91 (2.0)British Columbia, Canada 83 (1.8) 85 (1.9) 76 (2.6) 89 (1.7)Dubai, UAE r 93 (1.0) r 97 (0.8) s 91 (1.6) s 91 (2.3)Massachusetts, US 95 (0.9) 96 (1.0) 90 (1.6) 98 (0.8)Minnesota, US 89 (2.2) 92 (2.1) 84 (3.1) 93 (2.6)Ontario, Canada 89 (1.4) 86 (2.1) 84 (2.1) 97 (0.8)Quebec, Canada 85 (1.6) 88 (1.7) 82 (2.1) 85 (2.1)
Background data provided by teachers.* See Exhibit 6.7 for data on individual topics.** The TIMSS topics were summarized to reduce teachers’ response burden.( ) Standard errors appear in parentheses. Because results are rounded to the nearest
whole number, some totals may appear inconsistent.
A dash (–) indicates comparable data are not available. An “r” indicates data are available for at least 70 but less than 85% of the students. An “s” indicates data are available for at least 50 but less than 70% of the students. An “x” indicates data are available for less than 50% of the students.
SOU
RCE:
IEA
’s Tr
ends
in In
tern
atio
nal M
athe
mat
ics
and
Scie
nce
Stud
y (T
IMSS
) 200
7
Exhibit 6.6 Summary of Students Whose Teachers Feel “Very Well” Prepared to Teach the TIMSS Mathematics Topics*

259chapter 6: teachers of mathematics
Exhibit 6.6: Summary of Students Whose Teachers Feel “Very Well” Prepared to Teach the TIMSS Mathematics Topics* (Continued)
Country
Percentage of Students Whose Teachers Report Feeling Very Well Prepared to Teach the TIMSS Mathematics Topics**
All Mathematics(18 topics)
Number(5 topics)
Algebra(4 topics)
Geometry(6 topics)
Data and Chance(3 topics)
Algeria 66 (2.2) 77 (2.8) r 66 (3.1) r 63 (2.6) 54 (3.2)Armenia 51 (2.2) 54 (3.0) 49 (3.3) 52 (2.9) 45 (3.4)Australia 91 (1.6) 92 (1.6) 89 (2.2) 88 (2.0) 93 (1.8)Bahrain 88 (0.8) 94 (0.7) 88 (0.8) 86 (1.0) 83 (1.9)Bosnia and Herzegovina 67 (2.9) 78 (3.1) 75 (3.3) 72 (3.2) r 43 (3.3)Botswana 82 (1.6) 89 (1.5) 83 (2.2) 84 (2.1) 73 (3.0)Bulgaria 89 (1.0) 100 (0.2) 98 (0.6) 95 (1.1) 65 (3.0)Chinese Taipei 74 (2.7) 83 (2.8) 81 (2.8) 70 (2.7) 65 (3.5)Colombia 88 (1.7) 97 (1.1) 93 (1.8) 83 (2.2) 80 (3.2)Cyprus 83 (1.6) 91 (1.4) 91 (1.6) 85 (1.6) 65 (2.7)Czech Republic 85 (1.3) 98 (0.9) 93 (1.2) 90 (1.4) 60 (3.0)Egypt 86 (1.3) 90 (1.5) 90 (1.5) 89 (1.2) 74 (2.5)El Salvador 67 (2.7) 78 (2.9) 70 (3.1) 56 (3.3) 62 (3.5)England 95 (1.0) 96 (1.1) 96 (1.0) 92 (1.5) 95 (1.3)Georgia 86 (2.4) 97 (1.3) 89 (3.3) 86 (2.8) 75 (3.5)Ghana 85 (1.4) 90 (1.6) 88 (1.5) 81 (2.0) 81 (2.4)Hong Kong SAR 67 (3.1) 67 (3.5) 73 (3.0) 67 (3.2) 61 (4.0)Hungary 89 (2.2) 95 (2.2) 94 (2.2) 91 (2.3) 76 (3.1)Indonesia 81 (1.9) 87 (1.9) 79 (2.3) 84 (2.0) 72 (3.2)Iran, Islamic Rep. of 78 (1.5) 90 (1.1) 77 (1.9) 80 (1.7) 64 (2.8)Israel r 84 (2.2) r 87 (2.3) r 91 (2.2) r 80 (2.4) r 81 (2.5)Italy 65 (2.1) 77 (2.5) 62 (2.8) 70 (2.2) 51 (2.7)Japan 51 (2.6) 50 (3.2) 59 (2.8) 62 (3.2) 33 (2.9)Jordan 89 (1.5) 94 (1.5) 92 (1.5) 85 (2.0) 84 (2.4)Korea, Rep. of 70 (2.3) 72 (2.7) 75 (2.2) 73 (2.5) 60 (2.8)Kuwait r 76 (2.3) r 89 (2.4) r 74 (3.1) r 73 (2.6) r 69 (3.8)Lebanon 85 (1.9) 91 (1.8) 90 (1.9) 84 (2.3) 77 (3.0)Lithuania 70 (2.2) 81 (2.7) 73 (2.3) 69 (2.6) 56 (3.1)Malaysia 79 (1.9) 83 (2.6) 82 (2.2) 80 (1.9) 69 (2.8)Malta 91 (0.1) 96 (0.1) 94 (0.1) 90 (0.1) 85 (0.2)Norway 87 (1.1) 97 (0.8) 91 (1.4) 89 (1.2) 72 (2.3)Oman 84 (1.4) 92 (1.3) 86 (1.8) 84 (1.8) 76 (2.6)Palestinian Nat’l Auth. 86 (1.5) 93 (1.5) 89 (1.5) 83 (1.8) 80 (2.8)Qatar 86 (0.1) 95 (0.1) 86 (0.1) 83 (0.1) 83 (0.1)Romania 87 (1.3) 96 (1.1) 92 (1.3) 90 (1.3) 70 (2.8)Russian Federation – – – – – – – – – –Saudi Arabia 68 (2.4) 82 (2.6) 74 (2.8) 70 (2.8) r 49 (3.7)Scotland 96 (0.6) 98 (0.6) 97 (0.8) 96 (0.9) 95 (0.9)Serbia 74 (2.4) 86 (2.4) 79 (3.1) 79 (2.6) 51 (3.7)Singapore 82 (1.3) 88 (1.4) 84 (1.4) 82 (1.4) 72 (2.1)Slovenia 79 (1.2) 92 (1.2) 85 (1.3) 82 (1.4) 56 (2.2)Sweden 79 (1.5) 90 (1.5) 79 (1.7) 73 (1.8) 76 (1.8)Syrian Arab Republic 74 (1.6) 87 (2.1) 80 (1.8) 73 (1.8) 59 (3.1)Thailand 47 (2.3) 56 (3.1) 40 (3.1) 47 (2.6) 41 (3.3)Tunisia 80 (2.1) 89 (2.0) 80 (2.3) 79 (2.3) 71 (3.2)Turkey 68 (2.7) 78 (3.1) 66 (3.4) 67 (3.1) 62 (3.4)Ukraine 90 (1.3) 97 (0.9) 96 (1.2) 93 (1.3) 71 (3.0)United States 93 (0.8) 97 (0.7) 95 (0.8) 88 (1.3) 92 (1.3)
¶ Morocco 73 (2.7) 86 (3.1) 79 (3.3) r 77 (2.1) r 53 (4.9)International Avg. 79 (0.3) 87 (0.3) 82 (0.3) 79 (0.3) 68 (0.4)
Benchmarking ParticipantsBasque Country, Spain 88 (1.7) 98 (1.0) 94 (1.7) 85 (2.6) 77 (3.4)British Columbia, Canada 91 (1.3) 95 (1.1) 93 (1.4) 86 (2.0) 89 (2.1)Dubai, UAE s 88 (1.4) s 95 (1.3) s 94 (1.5) s 84 (1.6) s 81 (2.5)Massachusetts, US 96 (0.9) 98 (1.3) 97 (0.8) 93 (1.3) 97 (1.8)Minnesota, US r 97 (1.1) r 99 (0.5) r 98 (1.1) r 91 (3.1) r 98 (1.0)Ontario, Canada 83 (2.4) 88 (2.3) 80 (2.8) 78 (3.0) 85 (3.0)Quebec, Canada 87 (1.7) 95 (1.4) 87 (2.3) 89 (1.7) 79 (2.7)
Background data provided by teachers.* See Exhibit 6.7 for data on individual topics.** The TIMSS topics were summarized to reduce teachers’ response burden.¶ Did not satisfy guidelines for sample participation rates (see Appendix A).( ) Standard errors appear in parentheses. Because results are rounded to the nearest
whole number, some totals may appear inconsistent.
A dash (–) indicates comparable data are not available. An “r” indicates data are available for at least 70 but less than 85% of the students. An “s” indicates data are available for at least 50 but less than 70% of the students.
SOU
RCE:
IEA
’s Tr
ends
in In
tern
atio
nal M
athe
mat
ics
and
Scie
nce
Stud
y (T
IMSS
) 200
7
Exhibit 6.6 Summary of Students Whose Teachers Feel “Very Well” Prepared to Teach the TIMSS Mathematics Topics* (Continued)
260 chapter 6: teachers of mathematics
Exhibit 6.7: Students Whose Teachers Feel “Very Well” Prepared to Teach the TIMSS Mathematics Topics
Country
Percentage of Students Whose Teachers Report Feeling Very Well Prepared to Teach the TIMSS Mathematics Topics*
Number (10 topics)
Whole NumbersIncluding
Place Value and
Ordering
Operations (+,–,×,÷)
with Whole Numbers
Fractions as Part of
Whole and Location on
Number Line
Fractions Represented
by Words, Numbers, or Models
Comparing and
Ordering Fractions
Adding and Subtracting
withFractions
Adding and Subtracting
withDecimals
NumberSentences
NumberPatterns
Relationships Between
Given Pairs of Whole Numbers
Algeria 72 (3.8) 87 (2.5) 74 (4.3) 67 (4.8) 82 (3.3) 80 (3.3) 83 (3.2) 74 (3.8) 60 (5.1) 57 (4.8)Armenia 49 (4.0) 48 (3.4) 49 (3.6) 49 (3.9) 45 (3.7) 46 (3.7) 46 (3.7) 50 (3.8) 47 (3.3) 49 (4.0)Australia 92 (1.7) 94 (1.7) 81 (3.1) 77 (2.7) 72 (3.4) 68 (3.9) 76 (3.6) 92 (1.6) 85 (2.7) 77 (2.8)Austria 94 (1.4) 98 (0.9) 81 (2.3) 76 (2.3) 74 (2.6) 73 (2.4) 70 (2.9) 70 (2.9) 70 (2.7) 73 (2.9)Chinese Taipei 65 (4.2) 66 (4.4) 60 (4.4) 55 (4.4) 66 (4.2) 69 (3.9) 70 (3.9) 58 (4.1) 60 (3.9) 54 (4.6)Colombia 85 (3.1) 94 (1.8) 84 (3.3) 82 (3.0) 81 (3.9) 90 (2.8) 88 (3.3) 74 (4.5) 64 (5.5) 74 (4.9)Czech Republic 94 (2.0) 98 (1.4) 85 (3.3) 83 (3.1) 81 (3.8) 82 (3.5) 83 (3.9) 82 (2.9) 82 (3.5) 83 (2.9)Denmark 97 (1.9) 98 (1.8) 99 (0.7) 96 (1.7) 96 (1.7) 92 (2.4) 98 (1.2) 94 (1.8) 86 (3.1) 83 (3.6)El Salvador 67 (3.8) 81 (3.3) 58 (4.1) 57 (4.4) 60 (4.0) 74 (3.7) 76 (3.7) 44 (4.6) 43 (4.5) 57 (3.5)England 98 (1.0) 95 (1.7) 89 (2.6) 87 (2.8) 83 (2.8) 76 (3.2) 89 (2.5) 94 (1.6) 93 (1.8) 90 (2.2)Georgia 93 (2.2) 94 (2.1) 84 (3.3) 91 (2.4) 92 (2.3) 88 (2.7) 82 (4.1) 84 (4.5) 92 (1.9) 79 (4.1)Germany 92 (1.8) 97 (1.1) 55 (4.3) 54 (4.3) r 47 (5.1) r 47 (5.0) 81 (2.3) 73 (3.4) 60 (3.1) 66 (3.1)Hong Kong SAR 61 (4.2) 68 (4.1) 55 (4.4) 53 (4.6) 53 (4.0) 58 (4.3) 67 (4.2) 48 (4.5) 47 (4.6) 45 (4.5)Hungary 99 (0.6) 99 (0.6) 92 (2.1) 93 (2.0) 93 (2.0) 92 (3.0) r 90 (5.2) 95 (1.6) 97 (1.1) 86 (2.7)Iran, Islamic Rep. of 76 (3.3) 84 (2.8) 63 (3.8) 55 (4.3) 73 (3.8) 81 (3.1) 58 (4.8) 44 (4.0) 44 (4.1) 45 (4.3)Italy 73 (2.7) 78 (2.6) 68 (3.2) 69 (3.0) 63 (3.3) 64 (3.3) 73 (3.1) 56 (3.5) 62 (3.3) 60 (3.2)Japan 48 (3.8) 55 (4.1) 47 (4.0) 31 (3.3) 40 (3.8) 39 (4.1) 43 (4.0) 28 (3.7) 19 (3.3) 17 (2.9)Kazakhstan – – – – – – – – – – – – – – – – – – – –Kuwait r 96 (1.9) r 94 (2.2) r 86 (3.1) r 83 (3.4) r 89 (2.5) r 89 (3.0) r 76 (4.2) r 84 (3.4) r 73 (4.5) r 72 (4.6)Latvia 98 (1.1) 99 (0.6) 77 (3.0) 76 (2.8) 76 (3.2) 85 (3.0) 77 (3.6) 91 (2.4) 97 (1.2) 90 (2.6)Lithuania 59 (3.5) 76 (2.9) 56 (3.6) 45 (3.8) 49 (3.7) 46 (3.9) 50 (3.7) 49 (4.0) 61 (3.3) 47 (3.4)Morocco 89 (2.5) 94 (1.9) 82 (3.5) 75 (4.0) 87 (2.8) 85 (3.0) 86 (2.9) 84 (2.9) 67 (4.2) 72 (4.2)Netherlands 83 (3.4) 89 (2.9) 81 (3.4) 80 (3.3) 75 (3.8) 75 (3.9) 76 (3.8) 85 (3.3) 72 (4.0) 64 (4.4)New Zealand 87 (2.2) 90 (1.7) 77 (2.4) 76 (2.5) 73 (2.4) 62 (2.9) 61 (2.6) 84 (2.1) 81 (2.1) 74 (2.2)Norway 99 (0.6) 99 (0.8) 91 (1.8) 88 (1.9) 85 (2.5) 92 (1.8) 95 (1.5) 79 (2.9) 74 (3.0) 76 (3.0)Qatar 95 (0.1) 96 (0.0) 87 (0.1) 86 (0.1) 90 (0.1) 92 (0.1) 77 (0.1) 84 (0.1) 68 (0.2) 74 (0.2)Russian Federation – – – – – – – – – – – – – – – – – – – –Scotland 98 (1.1) 99 (0.8) 95 (1.5) 92 (2.1) 93 (1.7) 81 (3.2) 87 (2.5) 94 (1.7) 93 (2.2) 90 (2.6)Singapore 93 (1.5) 94 (1.3) 90 (1.9) 90 (1.9) 89 (1.8) 91 (1.6) 93 (1.5) 83 (2.2) 82 (2.0) 82 (2.1)Slovak Republic 96 (1.3) 97 (1.2) 87 (2.7) 87 (2.8) 79 (4.3) 70 (5.7) 81 (4.6) 83 (3.1) 92 (2.1) 99 (0.5)Slovenia 91 (1.6) 96 (1.1) 75 (2.7) 79 (2.7) 61 (3.2) 55 (3.6) 55 (3.8) 80 (2.5) 65 (3.3) 74 (2.9)Sweden 93 (2.1) 97 (1.2) 80 (2.9) 71 (3.2) 71 (3.3) 68 (3.2) 80 (3.1) 75 (3.2) 79 (2.9) 67 (3.4)Tunisia 75 (3.4) 71 (3.3) 58 (4.3) 56 (4.3) 56 (4.7) 56 (4.6) 65 (3.8) 68 (3.6) 62 (3.2) 64 (3.8)Ukraine 95 (1.7) 98 (0.9) 93 (2.3) 96 (1.7) 93 (2.2) 92 (2.6) 84 (3.8) 95 (1.8) 87 (3.0) 88 (2.8)United States 97 (0.9) 97 (0.9) 90 (1.6) 91 (1.8) 82 (2.2) 89 (1.8) 92 (1.5) 93 (1.4) 92 (1.3) 92 (1.3)Yemen 82 (3.1) 92 (2.7) 66 (4.3) 71 (4.4) 88 (2.7) 89 (2.8) 80 (4.1) 60 (4.1) 63 (4.9) 65 (4.2)International Avg. 85 (0.4) 89 (0.4) 76 (0.5) 74 (0.6) 75 (0.6) 75 (0.6) 76 (0.6) 74 (0.5) 71 (0.6) 70 (0.6)
Benchmarking ParticipantsAlberta, Canada 95 (1.6) 96 (1.5) 83 (3.0) 87 (2.4) 75 (3.2) 73 (3.8) 91 (2.3) 90 (2.5) 89 (2.6) 86 (2.9)British Columbia, Canada 91 (1.8) 95 (1.0) 86 (2.5) 86 (3.0) r 80 (2.8) r 80 (3.1) 86 (2.3) 80 (2.8) 83 (3.3) 78 (3.3)Dubai, UAE r 100 (0.0) r 100 (0.0) r 98 (1.0) r 96 (2.8) r 98 (0.1) r 97 (1.1) s 97 (1.1) r 92 (2.3) s 93 (1.7) s 94 (1.9)Massachusetts, US 100 (0.0) 98 (1.2) 97 (1.7) 97 (1.7) 95 (2.2) 90 (3.0) 95 (2.3) 96 (2.2) 95 (2.1) 94 (3.0)Minnesota, US 98 (1.6) 100 (0.0) 92 (3.5) 88 (4.5) 82 (4.9) 86 (4.3) 94 (3.0) 94 (2.2) 94 (2.1) 90 (3.2)Ontario, Canada 95 (2.0) 95 (1.9) 84 (3.1) 85 (3.4) 79 (3.9) 76 (4.6) 86 (3.1) 89 (2.6) 89 (2.7) 80 (3.9)Quebec, Canada 96 (1.7) 97 (1.3) 88 (3.1) 90 (2.7) 84 (3.2) 82 (2.8) 92 (2.5) 86 (2.8) 84 (3.3) 82 (3.4)
Background data provided by teachers.* The TIMSS topics were summarized to reduce teachers’ response burden.( ) Standard errors appear in parentheses. Because results are rounded to the nearest
whole number, some totals may appear inconsistent.
A dash (–) indicates comparable data are not available. An “r” indicates data are available for at least 70 but less than 85% of the students. An “s” indicates data are available for at least 50 but less than 70% of the students.
SOU
RCE:
IEA
’s Tr
ends
in In
tern
atio
nal M
athe
mat
ics
and
Scie
nce
Stud
y (T
IMSS
) 200
7
Exhibit 6.7 Students Whose Teachers Feel “Very Well” Prepared to Teach the TIMSS Mathematics Topics
261chapter 6: teachers of mathematics
Exhibit 6.7: Students Whose Teachers Feel “Very Well” Prepared to Teach the TIMSS Mathematics Topics (Continued)
Country
Percentage of Students Whose Teachers Report Feeling Very Well Prepared to Teach the TIMSS Mathematics Topics*
Geometric Shapes and Measures (7 topics) Data Display (3 topics)
Comparing and
Drawing Angles
Elementary Properties
of Common Geometric
Shapes
Relationship Between 2D
and3D Shapes
Finding Areas and Perimeters
Estimating Areas and Volumes
Using Informal
Coordinate Systems to
Locate Points in a
Plane
Reflections and
Rotations
Reading Data from
Tables, Pictographs, Bar Graphs,
or Pie Charts
Drawing Conclusions
from Data Displays
Displaying Data Using
Tables, Pictographs, Bar Graphs,
or Pie Charts
Algeria 84 (2.8) 83 (3.1) 50 (5.0) 89 (2.7) 77 (3.8) 40 (4.4) 39 (4.4) 48 (4.8) 58 (4.3) 52 (4.7)Armenia 50 (3.7) 46 (3.4) 48 (4.2) 45 (4.0) 44 (4.3) 46 (3.8) 49 (4.3) 50 (4.1) 43 (3.5) 43 (3.7)Australia 70 (3.1) 75 (3.4) 73 (3.7) 88 (2.3) 65 (3.7) 74 (3.4) 61 (3.9) 92 (2.1) 86 (2.3) 86 (2.5)Austria 67 (2.9) 81 (2.2) 51 (3.7) 93 (1.3) 48 (3.5) 71 (3.0) 52 (3.8) 49 (3.4) 52 (3.3) 36 (3.7)Chinese Taipei 63 (4.1) 69 (4.2) 58 (4.3) 65 (4.2) 54 (4.5) 49 (4.4) 31 (4.4) 68 (4.0) 62 (4.5) 65 (4.2)Colombia 79 (4.1) 72 (4.2) 51 (4.7) 82 (3.7) 73 (4.5) 68 (4.5) 46 (5.0) 77 (4.0) 76 (4.2) 69 (4.0)Czech Republic 70 (4.6) 93 (2.2) 63 (4.4) 91 (2.3) 62 (4.3) 63 (5.1) 52 (5.0) 64 (4.3) 64 (4.2) 56 (4.2)Denmark 96 (2.0) 96 (1.1) 70 (4.3) 99 (0.5) 97 (1.5) 98 (1.0) 88 (2.8) 96 (1.5) 88 (2.7) 89 (2.8)El Salvador 74 (3.6) 67 (4.0) 28 (4.2) 67 (3.8) 55 (4.1) 67 (4.2) 34 (4.5) 80 (3.7) 55 (4.4) 76 (3.7)England 93 (1.8) 85 (2.7) 84 (2.8) 96 (1.3) 83 (3.2) 90 (2.6) 78 (3.3) 92 (2.1) 90 (2.3) 90 (2.4)Georgia 88 (2.9) 82 (4.5) 64 (4.8) 95 (2.2) 81 (3.8) 70 (4.5) 53 (5.1) 63 (5.0) 74 (5.0) 65 (5.0)Germany 67 (4.0) 88 (2.0) 54 (3.3) 70 (3.1) 50 (3.5) 61 (3.3) 62 (3.2) 66 (3.0) 61 (3.1) 54 (3.4)Hong Kong SAR 60 (4.4) 52 (4.3) 53 (4.7) 59 (4.1) 46 (4.6) 43 (5.5) 40 (5.2) 72 (3.8) 62 (4.4) 68 (3.6)Hungary 88 (2.5) 95 (1.2) 64 (4.3) 97 (1.2) 76 (4.3) 73 (4.4) 73 (3.5) 88 (2.4) 84 (2.5) 81 (3.1)Iran, Islamic Rep. of 88 (2.8) 60 (4.4) 34 (4.2) 81 (3.0) 60 (4.2) 27 (4.3) 26 (4.1) 55 (4.1) 51 (4.4) 53 (4.2)Italy 66 (3.2) 73 (3.0) 61 (3.2) 71 (3.3) 51 (3.8) 47 (3.2) 40 (3.5) 63 (3.0) 66 (2.8) 60 (3.0)Japan 53 (3.9) 45 (3.8) 25 (3.6) 55 (3.6) 32 (3.6) 19 (3.3) 16 (3.3) 40 (3.6) 23 (3.5) 34 (3.8)Kazakhstan – – – – – – – – – – – – – – – – – – – –Kuwait r 95 (2.1) r 88 (2.8) r 67 (4.2) r 90 (2.9) r 82 (3.6) r 56 (4.5) r 63 (4.7) r 75 (4.4) r 76 (4.1) r 72 (4.1)Latvia 92 (2.1) 95 (1.8) 37 (4.2) 96 (1.8) 79 (2.9) 28 (4.2) 26 (4.1) 91 (2.1) 86 (2.6) 85 (2.9)Lithuania 59 (3.2) 61 (3.4) 35 (3.8) 77 (3.1) 37 (3.7) 36 (3.8) 24 (4.2) 61 (3.7) 53 (3.8) 50 (3.6)Morocco 84 (3.0) 92 (1.9) 66 (3.4) 92 (2.0) 75 (3.5) 56 (4.3) r 40 (3.8) 69 (4.1) 79 (3.5) 63 (4.3)Netherlands 46 (4.3) 47 (4.3) 40 (4.3) 80 (3.4) 58 (4.3) 70 (4.0) 51 (4.3) 85 (3.1) 78 (3.9) 81 (3.4)New Zealand 56 (2.7) 75 (2.5) 73 (2.1) 77 (2.2) 65 (2.6) 60 (3.0) 74 (2.1) 88 (1.6) 85 (1.8) 85 (1.6)Norway 83 (2.7) 90 (1.9) 70 (3.4) 94 (1.5) 85 (2.4) 82 (2.5) 70 (3.4) 89 (2.3) 83 (2.7) 78 (2.8)Qatar 91 (0.1) 83 (0.1) 57 (0.2) 91 (0.1) 76 (0.2) 61 (0.2) 59 (0.2) 68 (0.2) 67 (0.2) 64 (0.2)Russian Federation – – – – – – – – – – – – – – – – – – – –Scotland 86 (2.7) 86 (2.9) 90 (2.6) 95 (1.9) 81 (3.3) 87 (3.3) 71 (3.5) 96 (1.7) 94 (2.1) 94 (2.0)Singapore 86 (2.0) 87 (1.9) 68 (3.0) 89 (1.9) 77 (2.4) 55 (3.4) 55 (3.3) 92 (1.7) 88 (2.0) 88 (2.0)Slovak Republic 77 (5.3) 96 (1.5) 58 (4.8) 93 (2.1) 69 (4.3) 51 (5.4) 43 (5.6) 69 (3.5) 64 (4.1) 61 (4.2)Slovenia 39 (3.7) 80 (2.2) 89 (1.9) 60 (3.7) 50 (3.5) 35 (3.6) – – 88 (2.0) 81 (2.6) 81 (2.3)Sweden 84 (2.7) 88 (2.4) 44 (3.9) 91 (1.8) 74 (3.1) 72 (3.3) 29 (3.7) 89 (2.0) 77 (2.6) 76 (3.1)Tunisia 71 (3.3) 71 (3.0) 56 (3.8) 73 (3.5) 59 (4.1) 55 (4.3) 49 (4.6) 60 (4.0) 70 (3.7) 67 (3.7)Ukraine 94 (1.9) 98 (1.2) 77 (3.8) 99 (0.8) 80 (3.7) 72 (5.2) 63 (5.9) 79 (3.9) 81 (3.6) 76 (4.1)United States 86 (1.7) 91 (1.3) 81 (2.0) 95 (1.2) 78 (2.4) 87 (2.0) 79 (1.8) 96 (0.9) 92 (1.4) 92 (1.4)Yemen 83 (3.0) 75 (4.2) 51 (5.5) 81 (4.0) 74 (3.9) 38 (5.5) 38 (5.5) 58 (4.6) 49 (5.4) 45 (5.3)International Avg. 76 (0.5) 78 (0.5) 58 (0.7) 83 (0.5) 66 (0.6) 59 (0.7) 51 (0.7) 74 (0.6) 70 (0.6) 69 (0.6)
Benchmarking ParticipantsAlberta, Canada 72 (3.9) 87 (2.5) 83 (3.0) 92 (2.0) 74 (3.5) 71 (3.2) 59 (3.9) 93 (2.1) 88 (2.4) 91 (2.2)British Columbia, Canada 77 (3.8) 82 (3.3) 74 (4.0) 88 (2.4) r 76 (3.1) 72 (4.0) 59 (3.6) 91 (1.8) 89 (1.9) 88 (2.1)Dubai, UAE s 99 (1.1) r 95 (1.1) s 85 (2.6) r 99 (0.1) s 94 (2.6) s 79 (3.6) s 79 (4.4) s 93 (2.2) s 91 (1.7) s 90 (4.5)Massachusetts, US 96 (1.9) 96 (2.3) 85 (3.4) 96 (2.2) 85 (4.3) 96 (2.2) 77 (3.7) 100 (0.0) 95 (2.3) 98 (1.5)Minnesota, US 87 (4.6) 92 (3.2) 77 (6.2) 97 (2.2) 72 (6.6) 85 (3.4) 76 (6.0) 97 (2.0) 93 (3.3) 89 (4.8)Ontario, Canada 85 (3.4) 90 (2.7) 87 (2.7) 96 (1.5) 79 (3.7) 84 (3.4) 70 (4.0) 99 (0.5) 95 (1.6) 98 (1.2)Quebec, Canada 85 (3.3) 92 (1.9) 77 (3.8) 92 (2.3) 76 (3.7) 81 (3.7) 68 (3.8) 88 (2.0) 83 (3.0) 84 (2.7)
Exhibit 6.7: Students Whose Teachers Feel “Very Well” Prepared to Teach the TIMSS Mathematics Topics (Continued)
Benchmarking Participants
SOU
RCE:
IEA
’s Tr
ends
in In
tern
atio
nal M
athe
mat
ics
and
Scie
nce
Stud
y (T
IMSS
) 200
7
Exhibit 6.7 Students Whose Teachers Feel “Very Well” Prepared to Teach the TIMSS Mathematics Topics (Continued)

262 chapter 6: teachers of mathematics
Exhibit 6.7: Students Whose Teachers Feel “Very Well” Prepared to Teach the TIMSS Mathematics Topics (Continued)
Country
Percentage of Students Whose Teachers Report Feeling Very Well Prepared to Teach the TIMSS Mathematics Topics*
Number (5 topics) Algebra (4 topics)
Computing, Estimating, or
Approximating with Whole
Numbers
Representing Decimals and
Fractions Using Words,
Numbers, or Models
Computing with
Fractions and Decimals
Representing, Comparing,
Ordering, and Computing
with Integers
Problem Solving
Involving Percents and Proportions
Numeric, Algebraic,
andGeometric
Patterns or Sequences
Simplifyingand
Evaluating the Algebraic Expressions
Simple Linear Equations and
Inequalities, and Simultaneous(Two Variable)
Equations
Equivalent Representations of Functions as Ordered Pairs, Tables, Graphs,
Words, or Equations
Algeria 71 (4.3) 61 (4.7) 82 (3.4) 89 (2.8) 81 (3.5) r 28 (4.9) 88 (2.7) 79 (3.7) 56 (4.4)Armenia 53 (3.6) 51 (3.7) 54 (3.3) 54 (3.3) 59 (3.2) 49 (3.3) 48 (4.1) 50 (3.8) 47 (3.8)Australia 92 (2.5) 95 (1.8) 91 (2.6) 90 (2.7) 94 (2.0) 88 (2.6) 93 (2.2) 87 (2.7) 88 (2.6)Bahrain 97 (0.8) 91 (1.0) 95 (1.3) 95 (1.6) 92 (0.9) 72 (2.1) 96 (0.5) 98 (1.1) 88 (1.2)Bosnia and Herzegovina 77 (3.7) 78 (3.4) 81 (3.2) 80 (3.4) 73 (3.6) 65 (3.9) 79 (3.3) 81 (3.3) 76 (3.7)Botswana 89 (2.8) 86 (3.1) 94 (2.0) 88 (2.9) 85 (3.1) 77 (4.1) 94 (1.8) 92 (2.7) 69 (4.9)Bulgaria 98 (0.7) 99 (0.4) 100 (0.0) 100 (0.0) 100 (0.2) 92 (2.1) 100 (0.2) 100 (0.0) 98 (1.0)Chinese Taipei 83 (3.1) 83 (3.1) 85 (3.0) 86 (2.9) 76 (3.4) 80 (3.2) 85 (2.9) 85 (2.7) 75 (3.7)Colombia 99 (0.8) 97 (1.5) 97 (1.5) 98 (1.1) 95 (2.1) 89 (2.6) 95 (2.0) 94 (2.7) 93 (2.4)Cyprus 92 (1.7) 79 (2.9) 94 (1.4) 95 (1.3) 95 (1.3) 83 (2.5) 97 (1.3) 96 (1.6) 88 (2.0)Czech Republic 98 (1.1) 96 (1.5) 99 (0.7) 98 (1.2) 98 (0.9) 78 (3.3) 98 (1.1) 98 (1.0) 95 (1.6)Egypt 92 (2.1) 83 (3.0) 92 (1.9) 94 (1.9) 87 (2.7) 77 (3.5) 97 (0.8) 97 (1.3) 88 (2.7)El Salvador 80 (3.3) 76 (3.8) 85 (3.4) 80 (3.7) 69 (4.1) 51 (4.8) 80 (3.5) 79 (3.5) 72 (4.1)England 96 (1.6) 95 (1.8) 97 (1.5) 98 (1.2) 95 (1.4) 98 (0.9) 100 (0.3) 96 (1.4) 92 (2.4)Georgia 99 (0.8) 97 (1.6) 98 (1.2) 95 (2.4) 93 (3.4) 89 (4.0) 95 (2.8) 90 (3.8) 84 (4.3)Ghana 89 (2.3) 88 (2.7) 91 (2.3) 91 (2.5) 91 (2.5) 80 (3.3) 98 (1.1) 92 (2.2) 83 (3.1)Hong Kong SAR 61 (4.4) 65 (4.3) 75 (3.8) 75 (3.9) 60 (4.3) 66 (3.9) 78 (3.7) 80 (3.6) 68 (3.8)Hungary 95 (2.2) 94 (2.4) 96 (2.2) 95 (2.2) 95 (2.2) 92 (2.4) 96 (2.2) 94 (2.3) 93 (2.3)Indonesia 73 (3.9) 86 (3.2) 96 (1.6) 92 (2.5) 87 (2.8) 67 (4.0) 80 (2.9) 92 (2.2) 77 (3.6)Iran, Islamic Rep. of 88 (2.2) 77 (2.9) 96 (1.3) 97 (1.3) 92 (2.1) 53 (3.9) 98 (1.0) 92 (1.9) 63 (3.9)Israel r 85 (2.7) r 85 (2.5) r 89 (2.4) r 89 (2.5) r 86 (2.4) r 89 (2.4) r 92 (2.2) r 93 (2.1) r 89 (2.5)Italy 74 (2.6) 77 (2.8) 79 (2.8) 82 (2.6) 74 (3.0) 42 (3.4) 76 (2.9) 64 (3.5) 67 (3.1)Japan 43 (4.3) 48 (4.2) 54 (3.7) 60 (3.6) 45 (3.5) 44 (3.9) 73 (3.1) 70 (3.4) 49 (4.0)Jordan 94 (1.9) 93 (2.1) 97 (1.3) 96 (1.8) 90 (2.4) 78 (3.5) 97 (1.5) 97 (1.3) 94 (1.9)Korea, Rep. of 66 (3.4) 68 (3.5) 77 (3.2) 79 (3.0) 70 (3.3) 53 (3.3) 85 (2.6) 87 (2.5) 74 (3.1)Kuwait r 92 (2.7) r 83 (4.1) r 91 (2.7) r 92 (2.7) r 89 (3.1) r 51 (5.4) r 82 (3.9) r 86 (3.5) r 75 (3.9)Lebanon 93 (1.9) 91 (2.4) 94 (1.9) 92 (2.4) 85 (3.3) 86 (3.1) 95 (1.8) 92 (2.4) 86 (2.7)Lithuania 81 (2.7) 80 (3.1) 84 (2.9) 81 (3.3) 79 (3.1) 52 (3.3) 83 (3.0) 82 (2.8) 71 (3.2)Malaysia 87 (3.0) 81 (3.4) 85 (3.2) 86 (2.9) 75 (3.5) 82 (3.2) 91 (2.6) 82 (3.4) 73 (3.4)Malta 95 (0.1) 93 (0.1) 95 (0.1) 99 (0.1) 97 (0.1) 90 (0.1) 98 (0.1) 97 (0.1) 91 (0.2)Norway 97 (1.2) 98 (1.0) 99 (0.8) 97 (1.2) 95 (1.6) 87 (2.2) 95 (1.5) 94 (1.7) 86 (2.2)Oman 96 (1.8) 86 (2.8) 89 (2.5) 97 (1.7) 93 (2.0) 62 (4.1) 95 (2.0) 96 (1.8) 89 (3.1)Palestinian Nat’l Auth. 95 (1.9) 90 (2.8) 95 (2.3) 94 (2.0) 92 (2.3) 69 (3.6) 96 (1.7) 98 (1.3) 93 (2.2)Qatar 95 (0.1) 93 (0.1) 96 (0.1) 98 (0.0) 92 (0.1) 71 (0.2) 94 (0.1) 97 (0.0) 86 (0.1)Romania 96 (1.6) 95 (1.8) 98 (0.9) 97 (1.1) 96 (1.7) 81 (3.1) 97 (1.1) 97 (1.0) 92 (2.1)Russian Federation – – – – – – – – – – – – – – – – – –Saudi Arabia 87 (3.0) 75 (4.1) 83 (3.7) 90 (2.5) 71 (4.0) 47 (4.5) 85 (3.1) 76 (4.1) 84 (3.3)Scotland 98 (0.7) 98 (1.0) 98 (0.8) 98 (0.9) 97 (1.1) 97 (1.3) 99 (0.3) 100 (0.3) 91 (2.1)Serbia 78 (4.1) 88 (2.7) 92 (2.3) 89 (2.9) 84 (3.3) 63 (4.1) 84 (3.7) 91 (2.8) 76 (4.0)Singapore 87 (1.9) 87 (1.8) 91 (1.4) 89 (1.5) 87 (1.8) 70 (2.3) 93 (1.4) 91 (1.5) 83 (2.0)Slovenia 95 (1.1) 88 (1.8) 95 (1.2) 95 (1.2) 86 (1.9) 66 (2.6) 92 (1.4) 92 (1.6) 90 (1.7)Sweden 93 (1.5) 89 (1.6) 90 (1.8) 90 (1.8) 88 (2.0) 73 (2.5) 89 (1.6) 78 (2.5) 72 (2.5)Syrian Arab Republic 87 (3.0) 79 (3.4) 90 (2.7) 92 (2.3) 82 (3.3) 49 (4.3) 92 (2.4) 93 (2.2) 78 (3.5)Thailand 55 (4.4) 48 (4.0) 61 (4.4) 64 (4.3) 51 (3.8) 23 (3.8) 29 (4.3) 53 (4.1) 52 (4.5)Tunisia 88 (2.9) 88 (2.8) 94 (2.2) 95 (1.7) 78 (3.6) 62 (3.9) 91 (2.3) 87 (3.0) 76 (3.4)Turkey 80 (4.0) 70 (3.9) 82 (3.4) 87 (3.3) 73 (4.6) 56 (4.5) 80 (3.9) 75 (4.1) 49 (4.9)Ukraine 96 (1.5) 95 (1.7) 99 (0.9) 98 (1.3) 98 (1.0) 94 (1.7) 96 (1.8) 98 (1.3) 95 (1.6)United States 97 (0.8) 97 (0.8) 97 (0.8) 98 (0.7) 95 (1.0) 93 (1.1) 98 (0.7) 95 (1.2) 94 (1.2)
¶ Morocco 86 (4.0) 78 (4.5) 91 (3.4) 91 (3.1) 84 (4.3) r 56 (4.5) 85 (3.8) 89 (3.5) 79 (4.3)International Avg. 86 (0.4) 84 (0.4) 89 (0.3) 90 (0.3) 84 (0.4) 70 (0.5) 89 (0.3) 88 (0.4) 80 (0.4)
Benchmarking ParticipantsBasque Country, Spain 99 (1.0) 98 (1.4) 98 (1.4) 100 (0.0) 98 (1.3) 92 (2.7) 99 (1.0) 98 (1.3) 87 (3.6)British Columbia, Canada 96 (1.8) 94 (2.1) 98 (1.2) 95 (1.9) 94 (1.7) 89 (2.3) 99 (0.8) 92 (2.4) 93 (2.2)Dubai, UAE s 96 (1.2) s 95 (2.5) s 96 (1.3) s 93 (2.2) s 95 (1.8) s 96 (0.7) s 92 (2.3) s 94 (2.6) s 93 (1.5)Massachusetts, US 99 (1.3) 98 (1.6) 99 (1.3) 100 (0.0) 97 (1.8) 94 (2.1) 100 (0.0) 98 (1.5) 98 (1.6)Minnesota, US r 100 (0.3) r 98 (1.9) r 100 (0.3) r 100 (0.3) r 100 (0.3) r 93 (4.4) r 100 (0.3) r 99 (0.8) r 99 (0.9)Ontario, Canada 89 (2.6) 82 (3.5) 90 (2.5) 90 (2.6) 86 (3.3) 83 (3.4) 87 (2.8) 73 (4.4) 80 (3.6)Quebec, Canada 96 (1.4) 96 (1.8) 96 (1.6) 90 (3.2) 96 (1.9) 88 (3.1) 96 (1.7) 82 (3.8) 82 (3.8)
Background data provided by teachers.* The TIMSS topics were summarized to reduce teachers’ response burden.¶ Did not satisfy guidelines for sample participation rates (see Appendix A).( ) Standard errors appear in parentheses. Because results are rounded to the nearest
whole number, some totals may appear inconsistent.
A dash (–) indicates comparable data are not available. An “r” indicates data are available for at least 70 but less than 85% of the students. An “s” indicates data are available for at least 50 but less than 70% of the students.
SOU
RCE:
IEA
’s Tr
ends
in In
tern
atio
nal M
athe
mat
ics
and
Scie
nce
Stud
y (T
IMSS
) 200
7
Exhibit 6.7 Students Whose Teachers Feel “Very Well” Prepared to Teach the TIMSS Mathematics Topics (Continued)

263chapter 6: teachers of mathematics
Exhibit 6.7: Students Whose Teachers Feel “Very Well” Prepared to Teach the TIMSS Mathematics Topics (Continued)
Country
Percentage of Students Whose Teachers Report Feeling Very Well Prepared to Teach the TIMSS Mathematics Topics*
Geometry (6 topics) Data and Chance (3 topics)
Geometric Properties of Angles
andGeometric
Shapes
Congruent Figures and
SimilarTriangles
Relationship Between 3D Shapes and
Their 2D Representation
Measurement Formulas for Perimeters,
Surface Areas and Volumes
Cartesian Plane (Ordered Pairs,
Equations, Intercepts,
Intersections, and Gradient)
Translation, Reflection,
and Rotation
Reading and Displaying Data Using Tables and
Graphs
Interpreting Data Sets
Judging, Predicting, and
Determining Chances of
Possible Outcomes
Algeria 94 (2.0) 76 (4.0) 33 (4.7) 75 (3.9) r 34 (5.3) 47 (4.5) 80 (3.7) 43 (4.3) 38 (4.5)Armenia 55 (3.4) 58 (3.2) 50 (3.4) 50 (3.5) 45 (3.5) 53 (4.1) 45 (4.1) 45 (4.1) 43 (3.7)Australia 95 (1.8) 87 (2.6) 86 (3.0) 94 (1.7) 88 (2.3) 79 (3.0) 96 (1.6) 93 (2.2) 91 (2.4)Bahrain 98 (0.9) 96 (1.8) 70 (2.2) 91 (1.4) 67 (2.5) 91 (2.1) 88 (2.2) 87 (2.1) 75 (2.7)Bosnia and Herzegovina 77 (3.5) 68 (3.8) 58 (4.1) 79 (3.5) 75 (3.7) 72 (3.8) 43 (3.7) 43 (3.4) 41 (3.5)Botswana 96 (1.9) 76 (3.5) 71 (4.4) 93 (2.5) 80 (3.9) 80 (3.8) 94 (2.2) 62 (4.7) 63 (4.6)Bulgaria 99 (1.0) 99 (1.1) 95 (1.6) 99 (0.9) 82 (3.2) 93 (1.8) 82 (2.9) 57 (3.9) 55 (4.0)Chinese Taipei 84 (2.8) 78 (3.2) 61 (3.8) 79 (3.5) 70 (3.8) 47 (4.5) 75 (3.5) 54 (4.5) 64 (4.3)Colombia 91 (2.2) 88 (3.2) 64 (4.4) 92 (2.8) 95 (1.7) 71 (4.6) 89 (2.9) 80 (3.5) 72 (4.8)Cyprus 95 (1.5) 94 (1.8) 66 (3.2) 97 (1.3) 95 (1.4) 60 (3.4) 79 (2.7) 60 (3.0) 56 (3.3)Czech Republic 97 (1.4) 94 (1.9) 88 (2.6) 99 (0.9) 80 (3.0) 82 (2.9) 84 (3.1) 53 (3.7) 42 (4.2)Egypt 94 (1.9) 95 (1.9) 60 (4.2) 90 (2.6) 94 (1.7) 97 (1.5) 87 (2.3) 67 (3.7) 68 (3.9)El Salvador 71 (4.0) 63 (4.7) 33 (4.3) 67 (4.3) 69 (4.1) 34 (4.6) 85 (3.2) 56 (4.5) 46 (5.0)England 97 (1.1) 89 (2.3) 83 (3.3) 98 (1.0) 89 (2.8) 94 (1.7) 96 (1.4) 92 (2.2) 97 (1.1)Georgia 98 (1.0) 90 (3.6) 71 (4.3) 91 (3.5) 81 (4.7) 86 (3.9) 83 (3.4) 73 (4.5) 68 (4.4)Ghana 90 (2.5) 77 (3.7) 64 (4.0) 87 (3.0) 81 (3.4) 89 (2.5) 93 (2.0) 77 (3.5) 75 (3.8)Hong Kong SAR 75 (3.9) 73 (4.0) 57 (4.7) 71 (3.6) 69 (4.0) 54 (4.9) 70 (4.1) 59 (4.9) 52 (4.8)Hungary 95 (2.2) 92 (2.4) 74 (3.9) 95 (2.2) 92 (2.5) 92 (2.6) 89 (2.9) 75 (3.7) 63 (4.3)Indonesia 92 (2.3) 91 (2.3) 59 (4.7) 95 (1.8) 88 (2.6) 79 (3.9) 87 (3.3) 54 (4.5) 72 (4.2)Iran, Islamic Rep. of 95 (1.4) 86 (2.7) 39 (3.9) 90 (2.5) 90 (2.0) 76 (3.6) 80 (3.0) 63 (4.1) 43 (4.1)Israel r 89 (2.5) r 86 (3.0) r 66 (3.2) r 83 (2.9) r 85 (2.9) r 66 (3.1) r 89 (2.7) r 78 (3.0) r 76 (3.1)Italy 82 (2.7) 75 (3.0) 72 (3.2) 86 (2.4) 67 (3.1) 38 (3.1) 65 (3.1) 46 (3.1) 41 (3.3)Japan 69 (3.8) 69 (3.8) 56 (4.4) 65 (3.7) 63 (3.9) 51 (4.2) 31 (4.0) 23 (3.4) 47 (4.0)Jordan 89 (2.8) 94 (2.2) 61 (4.1) 93 (2.1) 95 (1.9) 77 (3.2) 93 (2.2) 80 (3.5) 78 (3.7)Korea, Rep. of 76 (3.2) 82 (2.9) 55 (3.5) 81 (2.9) 81 (2.9) 60 (3.4) 64 (3.6) 58 (3.2) 56 (3.1)Kuwait r 88 (3.0) r 88 (3.2) r 43 (4.9) r 78 (3.9) r 40 (5.2) r 88 (3.2) r 80 (4.2) r 66 (4.7) r 61 (4.8)Lebanon 94 (1.9) 90 (2.3) 72 (4.3) 91 (2.3) 89 (2.5) 65 (5.0) 79 (3.2) 76 (4.0) 79 (3.6)Lithuania 78 (2.9) 75 (3.4) 56 (3.7) 83 (2.9) 66 (3.6) 49 (4.0) 71 (3.3) 49 (3.9) 45 (3.9)Malaysia 84 (2.3) 76 (3.3) 70 (3.3) 85 (2.9) 78 (3.4) 85 (2.2) 82 (2.8) 69 (4.0) 57 (4.0)Malta 100 (0.0) 85 (0.2) 74 (0.2) 97 (0.1) 93 (0.1) 86 (0.2) 92 (0.2) 79 (0.2) 87 (0.2)Norway 97 (1.1) 92 (1.7) 67 (2.8) 98 (0.9) 94 (1.6) 84 (2.5) 90 (1.7) 65 (3.3) 61 (3.7)Oman 91 (2.3) 90 (2.8) 52 (4.3) 91 (2.1) 88 (2.9) 91 (2.5) 90 (2.7) 71 (3.7) 67 (4.0)Palestinian Nat’l Auth. 94 (2.3) 94 (2.1) 64 (3.5) 90 (2.5) 82 (3.2) 74 (3.4) 86 (3.0) 75 (3.6) 79 (3.6)Qatar 92 (0.1) 93 (0.1) 68 (0.2) 87 (0.1) 64 (0.2) 97 (0.1) 95 (0.1) 80 (0.1) 73 (0.2)Romania 95 (1.8) 96 (1.7) 90 (2.2) 97 (1.1) 93 (1.7) 70 (3.4) 86 (2.7) 54 (3.4) 70 (4.1)Russian Federation – – – – – – – – – – – – – – – – – –Saudi Arabia 85 (3.1) 88 (3.1) 39 (4.9) 62 (4.2) 66 (4.6) 70 (3.8) 63 (4.9) 39 (4.5) 49 (4.4)Scotland 97 (1.0) 96 (1.5) 92 (1.9) 100 (0.3) 98 (0.7) 91 (2.1) 98 (0.9) 94 (1.4) 94 (1.5)Serbia 89 (2.9) 77 (4.0) 65 (4.2) 90 (2.8) 83 (2.9) 71 (3.7) 62 (4.2) 53 (4.5) 38 (4.0)Singapore 87 (1.6) 83 (1.9) 67 (2.8) 94 (1.0) 89 (1.7) 71 (2.6) 89 (1.8) 70 (2.9) 56 (3.0)Slovenia 92 (1.5) 86 (1.7) 75 (2.2) 92 (1.4) 73 (2.5) 74 (2.1) 78 (2.0) 51 (3.0) 38 (3.0)Sweden 90 (2.0) 82 (2.5) 54 (3.0) 92 (1.8) 81 (2.3) 32 (2.9) 86 (1.9) 72 (2.5) 70 (2.7)Syrian Arab Republic 98 (1.2) 95 (1.9) 56 (4.1) 78 (3.4) 36 (4.9) 60 (4.4) 64 (3.9) 56 (3.9) 58 (3.9)Thailand 57 (4.0) 59 (4.0) 35 (4.2) 50 (4.0) 23 (4.0) 54 (4.0) 64 (4.0) 29 (4.4) 28 (4.3)Tunisia 95 (1.8) 90 (2.7) 73 (3.8) 79 (3.5) 70 (4.0) 67 (4.0) 72 (4.0) 76 (3.5) 65 (3.7)Turkey 81 (3.5) 80 (3.8) 41 (4.6) 72 (4.4) 69 (4.6) 58 (4.9) 68 (4.2) 63 (4.5) 56 (3.8)Ukraine 98 (1.2) 94 (2.0) 83 (2.9) 98 (1.2) 99 (0.9) 89 (2.4) 86 (2.9) 67 (3.9) 61 (4.2)United States 93 (1.5) 93 (1.5) 85 (1.8) 95 (1.2) 85 (1.8) 79 (2.6) 95 (1.1) 92 (1.5) 89 (1.8)
¶ Morocco 93 (2.4) 94 (2.1) r 57 (4.8) 86 (3.9) 66 (4.7) 62 (5.0) 64 (6.2) 47 (4.6) 51 (6.6)International Avg. 89 (0.3) 85 (0.4) 64 (0.5) 86 (0.4) 77 (0.5) 72 (0.5) 79 (0.5) 64 (0.5) 62 (0.5)
Benchmarking ParticipantsBasque Country, Spain 97 (1.8) 89 (2.8) 74 (4.6) 98 (1.5) 85 (3.8) 64 (5.2) 88 (3.2) 75 (4.3) 66 (4.7)British Columbia, Canada 91 (2.4) 91 (2.6) 78 (3.5) 95 (2.0) 84 (3.2) 75 (3.6) 95 (1.9) 88 (2.5) 83 (3.1)Dubai, UAE s 97 (1.1) s 87 (1.6) s 71 (2.8) s 92 (1.7) s 78 (3.1) s 80 (4.1) s 92 (1.6) s 75 (3.6) s 77 (3.4)Massachusetts, US 97 (1.9) 97 (1.7) 83 (4.2) 98 (1.7) 96 (2.9) 91 (4.4) 96 (2.8) 98 (1.7) 96 (2.9)Minnesota, US r 94 (4.1) r 96 (3.9) r 85 (5.8) r 99 (0.4) r 91 (4.7) r 84 (6.1) r 99 (0.4) r 99 (0.9) r 96 (2.7)Ontario, Canada 78 (3.6) 82 (3.9) 74 (4.1) 92 (2.8) 64 (4.7) 77 (4.0) 91 (2.7) 86 (3.5) 78 (3.7)Quebec, Canada 91 (2.6) 94 (2.2) 73 (3.8) 95 (1.8) 86 (3.1) 92 (2.3) 89 (3.1) 70 (4.0) 76 (3.5)
SOU
RCE:
IEA
’s Tr
ends
in In
tern
atio
nal M
athe
mat
ics
and
Scie
nce
Stud
y (T
IMSS
) 200
7
Exhibit 6.7 Students Whose Teachers Feel “Very Well” Prepared to Teach the TIMSS Mathematics Topics (Continued)

264 chapter 6: teachers of mathematics
At the eighth grade, the average across all topics was 79 percent. Again, number had the highest percent on average across topics, with 87 percent of the students having teachers that reported being very well prepared to teach those topics. The averages for the algebra and geometry topics were similar, 82 and 79 percent, respectively. Within the algebra topics, the highest percents were for working with algebraic expressions and equations (88–89%), next for working with functions (80%), and lowest for patterns and sequences (70%). Again there was quite a range across the geometry topics from 89 percent for properties of angles and shapes to 64 percent for relationships between three-dimensional shapes and their two-dimensional representations. The average for data and chance was 68 percent. Within the three data and chance topics, reading and displaying data in graphs in tables was 79 percent, but the other two topics were lower—interpreting data sets (64%) and chances of possible outcomes (62%).