Chapter 6. Macroeconomics: The Big Picture Link to syllabus.
13
Chapter 6. Macroeconomics: The Big Picture Link to syllabus
-
date post
19-Dec-2015 -
Category
Documents
-
view
238 -
download
4
Transcript of Chapter 6. Macroeconomics: The Big Picture Link to syllabus.

Chapter 6. Macroeconomics: The Big Picture
Link to syllabus

Figure 6-3 p. 171. The Business Cycle

Figure 6-2 p. 170. Business Cycle

Figure 6-4 p. 172. US Unemployment Rates, 1988-2011

Figure 6-3 p. 160. U.S. Unemployment

Global p. 173. International Business Cycles Compared
Rough correlations

Figure 6-1 (p. 168) and 6-5, (p. 174). Comparing Three Business Cycles.

Figure 6-7 p. 175. Long Term Growth in the US, 1900-2007
For log-graph for the US, see next slide

Economic Growth in the US, India, and China. ( Second edition). Fig 9-1, P. 226
Not repeated in the current edition.

Figure 6-8 p. 177. Rising Prices in the US, 1980-2011

Figure 6-9 p. 180. Unbalanced Trade
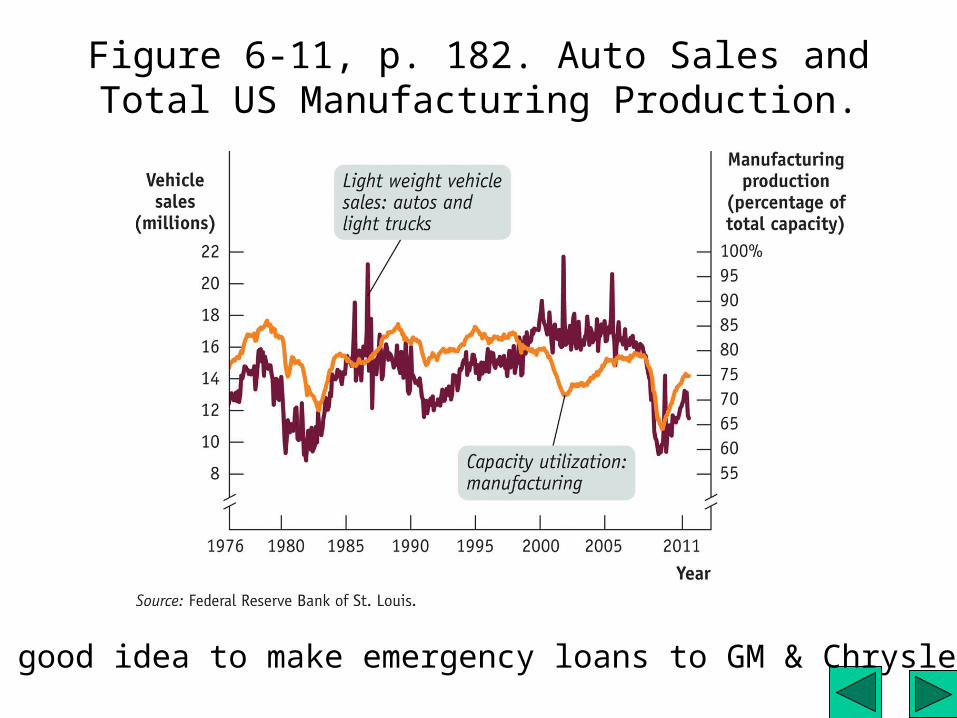
Figure 6-11, p. 182. Auto Sales and Total US Manufacturing Production.
Was it a good idea to make emergency loans to GM & Chrysler?
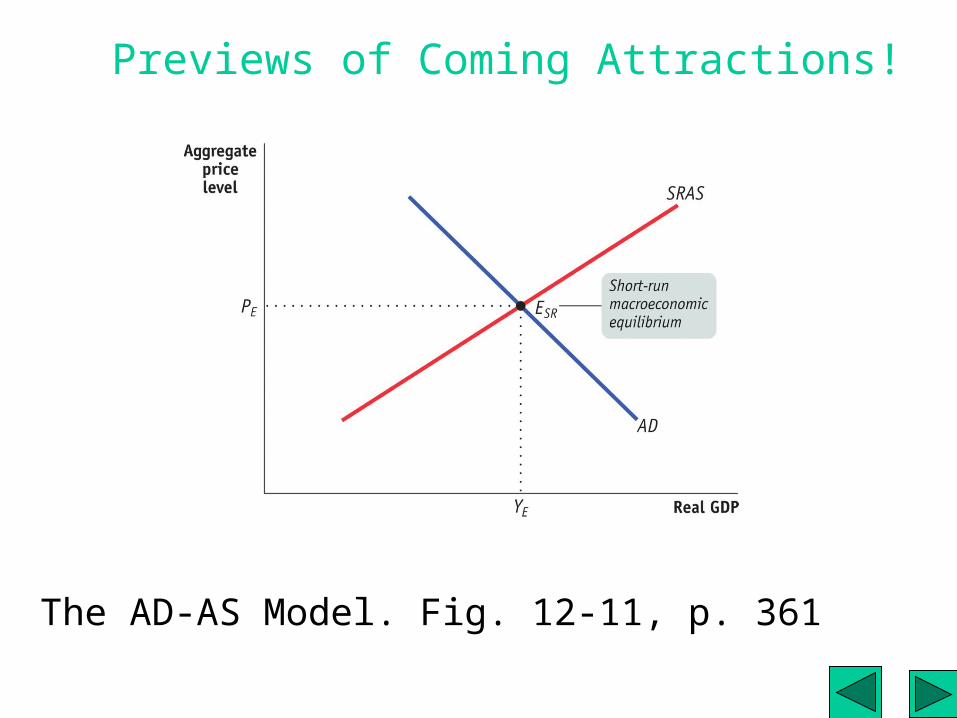
The AD-AS Model. Fig. 12-11, p. 361
Previews of Coming Attractions!