New Marriages, New Families: U.S. Racial and Hispanic Intermarriage

101
Chapter 6: Intermarriage, Integration and Multiculturalism: A Demographic
Perspective1
Siew-Ean Khoo
Introduction
The demography discipline provides one of the most powerful indicators of integration of immigrants or ethnic groups in multicultural societies: intermarriage between people of different national origins or ethnic background. Marriage is an important demographic and life course event, usually signalling the start of family formation and childbearing. As with births and deaths, two other important demographic events, marriages are recorded with the registrar of births, deaths and marriages in countries that keep records of these vital events. These records are usually referred to as vital registration statistics and are one of the most important collections of demographic data for any country.
Intermarriage is considered as one of the most definitive measures of the dissolution of social and cultural barriers – and therefore of social and cultural integration – because it is the result of close social interaction between people of two different ethnicities2. Early studies of inter-ethnic marriage in the United States of America considered it an important element in the ‘melting pot’ theory of assimilation3 and, in 1982, Australian demographer Charles Price wrote that ‘intermarriage is still the best measure of ethnic intermixture because it breaks down ethnic exclusiveness and mixes the various ethnic populations more effectively than any other social process’4. Intermarried partners, although coming from different ethnic, social or cultural backgrounds, are likely to share some common values and aspirations, important elements in building
1 I would like to dedicate this chapter to the memory of Dr Charles Price, FASSA (1920-2009), who pioneered the study of the demography of intermarriage in Australia.2 Bean, F and Stevens, G (2003). America’s Newcomers and the Dynamics of Diversity. New York: Russell Sage Foundation; Kalmijn, M and Flap, H (2001). ‘Assortative Meeting and Mating: Unintended Consequences of Organized Settings for Partner Choices.’ Social Forces, 79: 1289-1312.3 Drachsler, J quoted in Jones, F L (1994). ‘Multiculturalism and ethnic intermarriage: Melting pot or nation of tribes?’, paper presented at the Seventh National Conference of the Australian Population Association, Canberra, 22 September.4 Price, C A (1982). The Fertility and Marriage Patterns of Australia’s Ethnic Groups. Canberra: Department of Demography, ANU: 100.

Multiculturalism and Integration
102
social cohesion and contributing to social integration in multicultural societies. Inter-ethnic marriage also affects the social and cultural identities of the next generation who will be of mixed or multiethnic origins.
As an indicator of integration, intermarriage is also an indicator of the progress of multiculturalism in ethnically diverse societies. Intermarriage is more likely to occur in multicultural societies where there are opportunities for social interaction between people of different ethnicities. This interaction is facilitated by various factors including access to education, training and employment opportunities for young people of all ethnic backgrounds, and opportunities for people to participate in social and community activities regardless of ethnic background. Thus, social, cultural and religious factors and institutions, and government policies and programs that facilitate access to these opportunities are likely to increase the intermarriage rate. Conversely, cultural or religious institutions that focus on intra-group activities and maintaining intra-group cohesion – sometimes preferred by the elders in some ethnic communities in order to preserve the group’s language and culture – can lead to reduced opportunities for their youth to interact socially with other young people in the local community who are of different ethnic or religious background, and to lower intermarriage rates.
Factors such as the size of, and gender imbalance in, the ethnic community and its residential concentration can also affect the availability and choice of marriage partners within the community, thereby affecting the group’s intermarriage rate5. The larger the ethnic community and the more concentrated it is in terms of residential location, the more opportunity there is of finding a marriage partner within the community. An imbalance in the sex ratio of single people in the ethnic community, on the other hand, will affect the supply of potential spouses and can lead to greater intermarriage with members of the local community. For example, where single men outnumber single women in the ethnic community, some of the men will have to find marriage partners from outside the ethnic community or otherwise remain unmarried. This will result in a higher intermarriage rate for men than women.
While these demographic or geographic factors may have affected the intermarriage rate in the past, today’s marriage market is no longer local but global. People now look abroad for marriage partners if the local marriage market is limited from their perspective. Former migrants now maintain transnational contacts with friends and relatives in the country of origin through the use of email, internet, mobile phones and cheap airfares and can easily return to their homeland to find a marriage partner if there is no suitable partner locally. Some immigrant parents who are concerned with maintaining cultural traditions
5 Penny, J and Khoo, S E (1996). Intermarriage: A Study of Migration and Integration, AGPS, Canberra.

Chapter 6: Intermarriage, Integration and Multiculturalism
103
within the family have also looked to their country of origin for marriage partners for their children when they reach marriage age. These practices are associated with lesser integration and contribute to a lower intermarriage rate.
Intermarriage is therefore regarded as an important index or indicator of integration particularly in a country of immigration such as Australia, where 40 per cent of the population is either first (born overseas) or second generation (born in Australia with one or both parents born overseas) Australians. Because of Australia’s long history with immigration, country of birth is an important demographic identifier of people’s origin. Data on country of birth are collected in the Australian census. The country of birth of the bride and groom is also specified in marriage registration records (and previously also the country of birth of the parents of the bride and groom, although this is no longer the case). The availability of these data ignited the interest of demographers in Australia some forty years ago in the study of intermarriage between immigrants and native-born Australians as an indicator of immigrant integration6. Information on each person’s ancestry is also now available from the Australian census (since 2001), providing the opportunity for demographers to examine intermarriage by ethnic origin as well as birthplace. Because it is also possible to identify the second and third or more generations from census data, it is now also possible to examine intergenerational trends in intermarriage, allowing us to observe the extent that successive generations of each ethnic group are integrating into the country of settlement through intermarriage.
The next section of this paper introduces and discusses the two methodological approaches used by demographers to measure intermarriage rates, and their strengths and limitations. This is followed by a review of previous demographic studies of intermarriage in Australia. I then present and discuss current rates of intermarriage by birthplace and ethnicity based on the two methodological approaches and the latest available demographic data. This is followed by an examination of outcomes and implications for the next generation – the children of intermarriages – in terms of their ethnic identification and language spoken at home. The paper concludes with a discussion of the implications of current patterns of intermarriage for immigrant integration and the progress of multiculturalism in Australia.
6 Price, C A and Zubrzycki, J (1962a). ‘The use of intermarriage statistics as an index of assimilation’, Population Studies 16 (1): 58-69; Price, C A and Zubrzycki, J (1962b). ‘Intermarriage patterns in Australia’, Population Studies 16 (2): 123-133.
Multiculturalism and Integration
104
The demography of intermarriage
In 1962, Price and Zubrzycki published a paper, ‘The use of inter-marriage statistics as an index of assimilation’, which marked the beginning of the study of intermarriage in Australia7. The paper discusses the two different demographic approaches to measuring intermarriage.
The two approaches are based on different sources of demographic data. The first uses marriage registration statistics to measure the incidence of intermarriage during a specific period, for example, a particular year. It provides a measure of intermarriage that is based on marriages that take place in the country of settlement only. For example, the rate for Australia is calculated as the percentage of brides or grooms marrying in Australia each year (or over a two- or five-year period) who is marrying a person born in a different country. Since it is based on the bride’s and groom’s country of birth, it is a measure of intermarriage by birthplace. The intermarriage rate that is calculated as the percentage of overseas-born brides or grooms who marry a person who is born in Australia is usually considered as an index of immigrant integration because it measures the extent of intermarriage between immigrants and native-born Australians, with the marriages taking place in Australia after the migration of the overseas-born spouse.
The second approach uses census or survey data to measure the prevalence of intermarriage at the time of the census or survey. The intermarriage rate is obtained as the percentage of married men or women born in country x (or of ancestry/ethnic origin a) whose spouse is not born in country x (or of ancestry/ethnic origin a). The intermarriage rate obtained in this way includes marriages that have occurred in the country of settlement as well as marriages that have taken place overseas before the migration of the overseas-born spouse or couple. Price and Zubrzycki8 suggested that the intermarriage rate obtained in this way is a better measure of immigrant integration because the people who are already married in the country of origin before migrating are just as important in maintaining ethnic values as are those who choose to marry within their own ethnic background in the place of settlement. Price and Zubrzycki9 considered this approach ‘the most appropriate for measuring the extent of intermarriage amongst an ethnic group at any given moment of time’ and referred to the intermarriage rate obtained in this way as the true rate. Being based on the entire population of married men or women of a given birthplace or ethnicity, this rate is also more stable, particularly for small birthplace or ethnic groups, and is not affected by year to year fluctuations in the number of men and women of any
7 Price, C A and Zubrzycki, J (1962a). Op cit.8 Ibid.9 Ibid: 67.

Chapter 6: Intermarriage, Integration and Multiculturalism
105
given birthplace or ethnicity who marry each year as in the first approach. When using data from recent Australian censuses to obtain intermarriage rates in this way, the rate includes couples in de facto relationships, while the intermarriage rate based on marriage registration statistics is based on registered marriages only and excludes couples in de facto relationships.
Intermarriage rates are usually calculated separately for men and women so gender differences can be observed. These differences usually reflect the different roles and status of men and women in the family in different cultures. The rates can also be obtained for men and women of each generation so that intergenerational trends in intermarriage can be observed. The immigrant generation – the overseas-born – is referred to as the first generation. The second generation refers to people born in the country of settlement to one or both immigrant parents. The third generation refers to the native-born whose parents are also native-born but whose grandparents are the immigrant generation. Studies of intermarriage by generation have shown that intermarriage rates usually increase with each successive generation but there is also variation by ethnic origin10. Intermarriage rates can also be examined by educational attainment, or other descriptors of the socio-economic status of the couple, to observe the nature of the relation between intermarriage, socio-economic status and ethnicity.
Previous studies of intermarriage in Australia
The first study of intermarriage in Australia by Price and Zubrzycki11 examined the intermarriage rates based on data on the country of birth of brides and grooms whose marriages occurred in Australia during the period 1947-60. At that time, just after the Second World War, the overseas-born population in Australia was mainly from European countries so the focus of the study was on intermarriages between the European migrants and native-born Australians. The paper showed that, among the European migrants, those born in Italy and Greece had lower rates of intermarriage than migrants from Western or Eastern European countries such as the Netherlands or Poland.
Subsequent studies by Price12, based on marriage registration statistics, show the same pattern of lower intermarriage rates among Southern European migrants than Western European migrants, indicating that Southern European
10 Bean, F and Stevens, G (2003). Op cit; Khoo, S E (2004). ‘Intermarriage in Australia: Patterns by ancestry, gender and generation’, People and Place 12 (2): 35-44; Khoo, S E, Birrell, B and Heard, G (2009). ‘Intermarriage by birthplace and ancestry in Australia’, People and Place 17 (1): 15-27.11 Price, C A and Zubrzycki, J (1962b). Op cit.12 Price, C A (1981). Australian Immigration: A Digest, ANU, Canberra; Price, C A (1982). Op cit; Price, C A (1989). Ethnic Groups in Australia, Office of Multicultural Affairs, Canberra.

Multiculturalism and Integration
106
migrants were integrating more slowly than other European migrants through marriage with native-born Australians. The studies by Price13 on intermarriage among the second generation during the 1980s and early 1990s also show that the second generation of Southern European and Middle Eastern background had lower intermarriage rates than those of Western European background, although there was an increase in the intermarriage rate from the first to the second generation. His analysis also showed a small increase in in-marriage among the Greek, Lebanese and Yugoslav second generation between the 1980s and early 1990s and he attributed it partly to the increase in second-generation numbers and the geographic concentration of these groups. He also suggested that ‘cultural and religious factors have a very strong influence on in-marriage, and that the larger a culturally strong ethnic group becomes, the more it can open clubs, churches and schools and the more it can keep its young people together and discourage mixed marriages’14.
A question on ancestry was asked for the first time in the Australian census in 1986, providing the first opportunity to examine inter-ethnic marriage based on people’s ethnic origin. These data were used in a number of studies to examine the effects of generation, group size, residential concentration, education and social distance on inter-ethnic marriage15. The rate of intermarriage between a particular ethnic group and the dominant ethnic group was found to be related to the social distance between the two groups: the greater the social distance the less likely intermarriage will occur16. In the studies, social distance between groups was indicated by ethnic group characteristics such as the percentage speaking only English at home, the percentage Catholic and the percentage living in metropolitan areas. Pre-1986, group size was found to have an impact on the intermarriage rate, with larger groups having lower rates of intermarriage17. The study also showed that groups which had a more dispersed pattern of residential settlement, such as the Dutch and Germans, had higher rates of intermarriage, but gender imbalance had no impact. Education had a strong effect only in those groups that had relatively low educational attainment.
The ancestry question was asked again in the 2001 census. Analysis of the data shows that intermarriage rates increase from the first to the second to
13 Price, C A (1993). ‘Ethnic intermixture in Australia’, People and Place 1 (1): 6-8; Price, C A, (1994). ‘Ethnic intermixture in Australia’, People and Place 2 (4): 8-11.14 Price, C A (1994). Op cit: 10.15 Jones, F L (1994). ‘Multiculturalism and ethnic intermarriage: Melting pot or nation of tribes?’ Paper presented at the Seventh National Conference of the Australian Population Association, Canberra, 22 September; Jones, F L and Luijkx, R (1996). ‘Postwar patterns of intermarriage in Australia: The Mediterranean experience’. European Sociological Review 12 (1): 67-86; Giorgas, D and Jones, F L (2002). ‘Intermarriage patterns and social cohesion among first, second and later generation Australians’, Journal of Population Research 19 (1): 47-64.16 Jones, F L and Luijkx, R (1996). Op cit; Giorgas, D and Jones, F L (2002). Op cit.17 Jones, F L (1994). Op cit.

Chapter 6: Intermarriage, Integration and Multiculturalism
107
the third generation for all ancestry groups examined18. Although differences in the intermarriage rate persist from the first to the second generation, there is convergence in the rates by the third generation, with 70 per cent or more of the third generation of ethnic groups that migrated to Australia before 1970 married to spouses of a different ancestry. Of particular interest is that the majority of third generation men and women who reported Southern or Eastern European, Middle Eastern or Asian (Chinese or Indian) ancestry, and who had intermarried, had spouses who were of Australian or English-speaking ancestries. This indicates a high degree of social integration of these groups with Australian society by the third generation.
Current patterns of intermarriage in Australia
Current patterns of intermarriage can be examined using the two demographic approaches described earlier and the 2006 census data and 2006-07 marriage registration statistics. Table 1 shows the extent of intermarriage between immigrants and native-born Australians based on a comparison of the country of birth of spouses in all married and de facto couples enumerated in the 2006 population census. As noted earlier, according to Price and Zubrzycki19, this measure indicates the extent that migrant communities are becoming integrated through intermarriage with the native-born population.
The table ranks the birthplace groups from the highest percentage to the lowest for overseas-born women with a spouse born in Australia. Men and women from North America have the highest rate of intermarriage with the Australian-born, followed by men and women born in the United Kingdom and other Western European countries such as the Netherlands, France and Germany. This pattern is consistent with those observed in previous studies and indicates close social interaction between Australians and people from Western European and North American countries.
In contrast to migrants from the UK and other Western European countries, migrants from Southern and Eastern European countries are less likely to have Australian-born spouses. This is partly a reflection of the migration of families from these countries in the 1950s and 1960s.
A relatively low percentage of immigrants from Lebanon and Turkey, and more recent source countries of migration such as China, India and Sri Lanka, are married to Australian-born men and women. Many have spouses born in the same country and are married before their migration to Australia. There is also
18 Khoo, S E (2004). Op cit.19 Price, C A and Zubrzycki, J (1962a). Op cit.

Multiculturalism and Integration
108
some evidence that immigrants from these countries are more likely to look to their country of origin for marriage partners. Statistics on spouse and fiancé(e) visa grants since the 1990s show that China has been the second largest country of origin (after the UK), and Viet Nam, India and Lebanon are among the top ten source countries, of recipients of the spouse and fiancé(e) visas20. A study of spouse migration also shows that more than 85 per cent of migrants arriving on partner visas in 1993-95 from Turkey, China, Viet Nam, Lebanon, India, Sri Lanka and Cambodia were sponsored by previous migrants from the same country21.
Women from three Asian countries - Thailand, Japan and the Philippines - have high intermarriage rates with the Australian-born, but this is not the case for the men from these countries. The high female intermarriage rate is related to marriage migration of women from these countries to marry Australian men and this pattern has been observed since the 1970s for women from the Philippines and since 1990 for the other two countries22. In recent years, there has also been a similar pattern of marriage migration of women from Russia and this is indicated in a similar gender differential in the intermarriage rate as shown in Table 1.
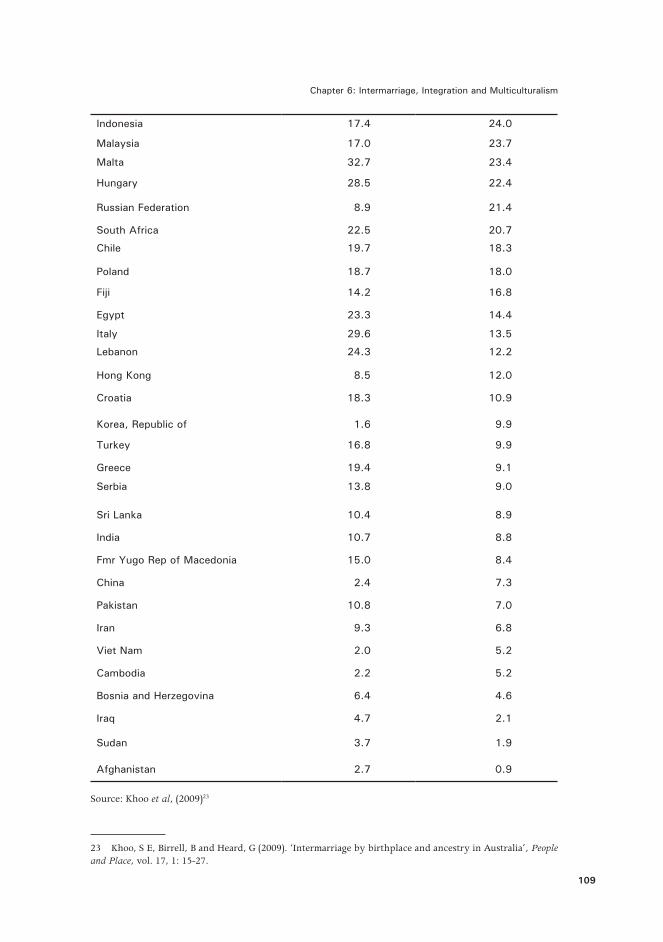
Table 1 Percent of overseas-born men and women in couple families with an Australian-born partner, by country of birth, 2006
Country of birth of overseas-born men/women
Male Female
% intermarried with Australian-born
Canada 60 .6 60 .1
United States of America 57 .3 56 .6
Thailand 15 .6 47 .4
Netherlands 50 .3 42 .3
United Kingdom 43 .4 40 .8
Japan 14 .9 40 .6
France 43 .8 39 .5
Germany 45 .2 38 .6
New Zealand 42 .9 38 .3
Philippines 8 .1 35 .6
Ireland 42 .3 34 .8
Singapore 23 .5 28 .2
Spain 30 .6 26 .0
20 Department of Immigration and Citizenship (2008). Community Projects 2007-2008, http://www.immi.gov.au/media/publications/multicultural/pdf_doc/Community; Department of Immigration and Multicultural Affairs, various years.21 Khoo, S E (2001). ‘The context of spouse migration to Australia’, International Migration 39 (1): 111-132.22 Penny, J and Khoo, S E (1996). Op cit.
Chapter 6: Intermarriage, Integration and Multiculturalism
109
Indonesia 17 .4 24 .0
Malaysia 17 .0 23 .7
Malta 32 .7 23 .4
Hungary 28 .5 22 .4
Russian Federation 8 .9 21 .4
South Africa 22 .5 20 .7
Chile 19 .7 18 .3
Poland 18 .7 18 .0
Fiji 14 .2 16 .8
Egypt 23 .3 14 .4
Italy 29 .6 13 .5
Lebanon 24 .3 12 .2
Hong Kong 8 .5 12 .0
Croatia 18 .3 10 .9
Korea, Republic of 1 .6 9 .9
Turkey 16 .8 9 .9
Greece 19 .4 9 .1
Serbia 13 .8 9 .0
Sri Lanka 10 .4 8 .9
India 10 .7 8 .8
Fmr Yugo Rep of Macedonia 15 .0 8 .4
China 2 .4 7 .3
Pakistan 10 .8 7 .0
Iran 9 .3 6 .8
Viet Nam 2 .0 5 .2
Cambodia 2 .2 5 .2
Bosnia and Herzegovina 6 .4 4 .6
Iraq 4 .7 2 .1
Sudan 3 .7 1 .9
Afghanistan 2 .7 0 .9
Source: Khoo et al, (2009)23
23 Khoo, S E, Birrell, B and Heard, G (2009). ‘Intermarriage by birthplace and ancestry in Australia’, People and Place, vol. 17, 1: 15-27.

Multiculturalism and Integration
110
Higher female than male rates are also observed for migrants from other Southeast and East Asian countries, although the female rate is not as high as that for migrants from Thailand, Japan and Philippines. This gender differential reflects cultural norms in East Asian societies in relation to women’s and men’s roles and status, namely that women leave the family when they marry whereas men are expected to remain in the family to carry on the lineage so it is more important that they marry women of the same ethnic background24. The reverse gender pattern is observed for migrants from South Asia and the Middle Eastern countries. In these societies, daughters are considered a kind of family asset and are more protected to safeguard the family’s reputation while sons are given more freedom to mix outside the ethnic community25. Therefore, the men are more likely to intermarry than the women.
Birthplace groups with the lowest rates of intermarriage with the Australian-born population are mostly from countries that have been the sources of recent refugee and other humanitarian migration, such as Afghanistan, Sudan, Iraq and Bosnia. Their low intermarriage rate reflects the migration of families from these countries, most of whom arrived during the past ten years for resettlement under Australia’s humanitarian migration program. Older refugee groups, such as those from Cambodia and Viet Nam, also have low intermarriage rates with the Australian-born which may partly reflect the slower social and economic integration of these migrant communities.
Patterns of inter-ethnic marriage are shown in Table 2 by ancestry and generation for groups that have at least a second generation of marriage age. In the first generation, intermarriage is more common among men and women of Western European ancestries than among men and women of Southern or Eastern ancestries. Among the European migrants, the first generation Greek and Macedonian ancestries are the least likely to marry outside the ethnic community. The proportion intermarried is also low among the first generation of Middle Eastern and Asian ancestries such as the Lebanese, Turks, Vietnamese, Chinese and Indians. This is partly a reflection of the recent migration of families and partly of the propensity of these groups for intra-ethnic marriage, sometimes achieved through sponsorship of spouses from the country of origin, as referred to earlier.
24 Ibid.25 Ibid.

Chapter 6: Intermarriage, Integration and Multiculturalism
111
Table 2 Percentage of partnered men and women with spouse of a different ancestry, by ancestry and generation, 2006
Ancestry1st generation 2nd generation 3rd+ generation
Male Female Male Female Male Female
English 41 36 49 48 20 21
Irish 62 59 86 83 71 67
Scottish 65 60 90 88 80 75
Welsh 71 66 96 96 96 94
Dutch 62 55 89 88 95 95
French 61 60 91 93 98 98
German 59 56 91 90 72 69
Greek 12 9 37 31 67 61
Italian 22 12 51 42 77 74
Maltese 33 28 67 64 79 77
Spanish 36 37 87 85 96 98
Bosnian 15 14 44 42 * *
Croatian 26 21 60 59 88 88
Macedonian 10 8 39 35 * *
Serbian 26 17 67 62 96 91
Czech 52 47 96 96 * *
Hungarian 47 36 89 88 * *
Polish 34 34 84 80 95 94
Russian 28 43 74 76 97 94
Armenian 21 15 48 47 * *
Egyptian 24 14 66 58 * *
Lebanese 11 8 31 21 68 58
Turkish 11 7 25 16 * *
Filipino 8 52 47 76 * *
Indonesian 24 53 58 64 * *
Vietnamese 7 13 48 48 * *
Chinese 6 13 35 48 69 73
Indian 11 11 56 58 * *
Sinhalese 14 13 95 86 * *
South African 30 34 92 97 * *
Maori 53 50 89 88 * *
New Zealander
70 69 97 96 * *
a . Based on sole ancestry response
* Less than 100 persons
Source: Khoo et al, (2009)

Multiculturalism and Integration
112
The most significant pattern shown in Table 2 is the increase in intermarriage with each successive generation. This indicates increased social interaction among people of different ethnicities with each successive generation. The increase in intermarriage is seen in all ancestry groups and it is quite large for some groups such as those of Greek, Lebanese or Chinese ancestry, where the proportion intermarried increases from about 10 per cent in the first generation to 30 per cent or more in the second generation to 60 per cent or more by the third generation. These patterns are similar to those indicated in the analysis of the 2001 census ancestry data discussed earlier26. Significant increases in the proportion intermarried are also seen from the first to the second generation of the other Asian, Middle Eastern and Southern and Eastern European groups that do not yet have a sizeable third generation of marriage age, indicating that social interaction is occurring between members of the second generation of these ethnic groups and other Australians.
Over 90 per cent of the third or more generation of most Western and Eastern European ancestries have spouses of a different ancestry. The exception is the third or more generation of English ancestry; the relatively low proportion intermarried is likely a reflection of the large number of third or more generation Australians who are of English ancestry.
Current patterns of intermarriage as indicated by marriage registration statistics for 2006 and 2007 are shown in Table 3. The first two columns show the percentages of overseas-born brides and grooms marrying persons born in Australia. Persons born in the United States were the most likely to marry persons born in Australia, followed by persons born in the United Kingdom and other European countries, New Zealand and South Africa. Very few men born in China or Viet Nam were marrying Australian-born women. Women from these two countries were more likely than the men to marry native-born Australians. This gender differential is also observed for the other East and Southeast Asian birthplace groups and is consistent with the pattern shown in the intermarriage rates based on census data (Table 1). However, the figures based on marriages registered in 2006-07 are higher than those based on all couples in the census because the latter include marriages that occurred overseas before the couples’ migration and that are more likely to involve spouses from the same country of birth.
26 Khoo, S E (2004). Op cit.

Tabl
e 3
Per c
ent of
brid
es a
nd g
room
s m
arry
ing
pers
ons
born
in A
ustral
ia o
r diff
eren
t co
untry:
Mar
riage
s re
gist
ered
in A
ustral
ia, 2
006-
07
Cou
ntry
or
regi
on o
f bi
rth
of b
ride
or g
room
Brid
esG
room
sBrid
esG
room
sBrid
esG
room
sN
umbe
r of
:br
ides
gro
oms
% m
arry
ing
pers
on b
orn
in
Aus
tral
ia%
mar
ryin
g pe
rson
fro
m a
noth
er
over
seas
cou
ntry
% m
arry
ing
pers
on f
rom
a
diff
eren
t co
untr
y*
New
Zea
land
57 .9
62 .6
18 .1
18 .7
76 .0
81 .3
5354
6860
Oth
er O
cean
ia40 .3
45 .7
27 .5
15 .1
67 .8
60 .8
1679
1751
Ger
man
y52 .1
46 .4
24 .5
32 .2
76 .6
78 .6
1198
1309
Irel
and
56 .6
61 .4
23 .7
25 .6
80 .3
87 .0
599
909
Uni
ted
Kin
gdom
58 .4
60 .8
16 .8
21 .1
75 .2
81 .9
10744
14725
Oth
er N
W E
urop
e58 .6
55 .6
24 .5
30 .9
83 .1
86 .5
1697
2121
Gre
ece
56 .8
61 .4
21 .8
27 .5
78 .6
88 .9
220
425
Ital
y56 .8
55 .1
22 .3
35 .0
79 .1
90 .1
387
818
Oth
er S
&E
Euro
pe45 .2
37 .9
28 .7
32 .2
73 .9
70 .1
4096
3581
Leba
non
45 .0
63 .7
14 .1
12 .3
59 .1
76 .0
773
1315
Oth
er M
iddl
e Ea
st26 .1
33 .8
24 .9
27 .0
51 .0
60 .8
2106
2633
Mal
aysi
a37 .2
23 .0
38 .6
46 .2
75 .8
69 .2
1791
1410
Phili
ppin
es51 .2
20 .8
23 .7
11 .9
74 .9
32 .7
3494
1305
Vie
t N
am17 .8
7 .3
16 .8
16 .1
34 .6
23 .4
3405
2906
Oth
er S
E A
sia
43 .0
17 .7
31 .5
32 .7
74 .5
50 .4
5214
2680
Chi
na17 .0
1 .9
23 .1
10 .5
40 .1
12 .4
6084
4162
Hon
g Kon
g26 .2
12 .3
34 .1
47 .4
60 .3
59 .7
1184
1167
Oth
er N
E A
sia
36 .6
8 .3
29 .4
24 .7
66 .0
33 .0
3557
1808
Indi
a15 .9
22 .0
15 .8
23 .3
31 .7
45 .3
1664
2079
Oth
er S
. A
sia
21 .3
22 .7
23 .3
29 .9
44 .6
52 .6
1308
1531
USA
69 .1
66 .4
19 .6
23 .9
88 .7
90 .3
1433
1666
Oth
er A
mer
icas
48 .3
47 .0
25 .6
25 .2
73 .9
72 .2
2947
2774
Sou
th A
fric
a57 .7
59 .6
24 .3
23 .1
82 .0
82 .7
1441
1500
Oth
er A
fric
a37 .4
39 .7
29 .1
30 .2
66 .5
69 .9
1386
1543
* Inc
lude
s m
arry
ing
pers
ons
born
in A
ustr
alia
Sour
ces:
Cal
cula
ted
from
mar
riag
e re
gist
rati
on s
tati
stic
s pu
blis
hed
by A
BS (2
007;
200
8)
Multiculturalism and Integration
114
The intermarriage figures according to marriages in 2006-07 are also relatively low for migrants from India and other South Asian countries and also for the Other Middle East group, although they are relatively high for brides and grooms born in Lebanon. It is likely that the brides and grooms born in Lebanon may be marrying men and women who are second generation of Lebanese background. Analysis of the 2001 census data shows that 42 per cent of married women of Lebanese ancestry who are of the second generation are married to first generation (overseas-born) Lebanese men, while 22 per cent of married men of Lebanese ancestry who are of the second generation are married to first generation (overseas-born) Lebanese women27. It is likely that some of these second generation Lebanese men and women have looked to their parents’ homeland to find marriage partners28.
Table 3 also shows the percentage of brides and grooms in 2006-07 marrying a person born in a different overseas country, a possible indicator of the extent of social interaction between members of different migrant communities. About 20-30 per cent of overseas-born brides and grooms marrying in 2006-07 were marrying migrants from another overseas country. The exceptions were brides and grooms born in Lebanon, and grooms born in China or the Philippines, of whom less than 15 per cent were marrying migrants from a different overseas country. However, a marriage between persons born in different countries does not necessarily indicate an inter-ethnic marriage. It is possible that the relatively high percentage of brides and grooms from Malaysia or Hong Kong marrying migrants from another overseas country may be marrying co-ethnic Chinese. Many migrants from Malaysia or Hong Kong are ethnic Chinese29 and their marriage to migrants from Singapore or China, for example, may be to co-ethnics from these countries. The marriage registration statistics do not have information on the ethnicity of the brides and grooms to enable examination of this issue.
Both demographic approaches to measuring intermarriage between migrants and native-born Australians show similar patterns of differences by migrants’ birthplace. It is apparent that some migrant groups have integrated socially to a greater degree with Australian society than others who have tended to marry within their community or look for marriage partners from their country of origin. Migrant communities of more recent origin, and particularly those formed through mainly family reunion or refugee/humanitarian migration, are less likely to mix socially with local Australians, as indicated by their
27 Ibid.28 Khoo, S E (2001). Op cit.29 See Department of Immigration and Citizenship (2009a). ‘Community Information Summary: Hong Kong-born Community’. At http://www.immi.gov.au/media/publications/statistics/comm-summ/summary.htm; Department of Immigration and Citizenship (2009b). ‘Community Information Summary: Malaysia-born Community’. At http://www.immi.gov.au/media/publications/statistics/comm-summ/summary.htm.

Chapter 6: Intermarriage, Integration and Multiculturalism
115
intermarriage rates. Language may be a barrier to such social interaction as members of these migrant groups are generally less proficient in English. A recent study has shown that migrants who are less proficient in English are less likely to participate in social and community groups and activities; they are more likely to participate in religious groups and ethnic/multicultural clubs and organisations, which involves interaction mainly with people of similar religious beliefs or co-ethnics and other migrants since less than three per cent of native-born Australians participate in ethnic/multicultural clubs30.
Outcomes and implications for the next generation
Intermarriage has important implications for the next generation who will have mixed or multiple ethnicities. With marriage registration statistics in the early 1990s showing that at least two-thirds of the second generation are marrying outside their ethnic group, this will result in an increase in the number of Australians of mixed ethnic origins31. Price estimated that 37 per cent of Australia’s population in 1988 were of mixed ethnic origins and that this proportion would exceed 40 per cent by the year 2000. He also suggested that ‘not only will this element soon become the largest ethnic element in the population but it will have more and more influence in determining Australia’s identity and values’32.
Just 28 per cent of the Australian population reported mixed or multiple ancestries in the 2006 census. This is likely to be a considerable underestimate of Australians who are of mixed or multiple ancestries. Studies comparing the ancestries of parents and children in the 1986 and 2001 censuses have shown that when parents are of different ancestries, they do not always report their children as having both their ancestries; instead there is a tendency to simplify their children’s ancestry by reporting just one ancestry33. Of particular interest in relation to the issue of integration, these parents are also likely to report their children’s ancestry as ‘Australian’, particularly when one parent is identified as Australian34. A study in the United States has also shown that second generation children of intermarriages between immigrants and native-born Americans are
30 Khoo, S E and Temple, J (2008). ‘“Immigrants” social and community participation in Australia’, Paper presented at the Australian Population Association Biennial National Conference, Alice Springs.31 Price, C A (1994). Op cit.32 Ibid: 11.33 Khoo, S E (1991). ‘Consistency of ancestry reporting between parents and children in the 1986 census’, Journal of the Australian Population Association 8 (2): 129-139; Khoo, S E and Lucas, D (2004). Australians’ Ancestries, 2001. Australian Census Analytic Program. Canberra: Australian Bureau of Statistics.34 Khoo, S E and Lucas, D (2004). Op cit.

Multiculturalism and Integration
116
more likely to identify as American than children with two immigrant parents35. Table 4 shows this comparison for the second generation in Australia in 2006. More than 50 per cent of the second generation who have one Australian-born parent identified their ancestry (or were identified by their parents) as Australian compared with less than 10 per cent of the second generation with both parents born overseas. More than 60 per cent of the second generation who have one Australian-born parent and one overseas-born parent reported multiple ancestries compared with just over 20 per cent of the second generation who have two overseas-born parents.
Table 4 Second generation Australians: Per cent with multiple ancestries or Australian ancestry, by age and parents’ birthplace, 2006 census
Age of person (years)
Father born overseas, mother born in Aust .
Mother born overseas, father born in Aust .
Both parents born overseas
% with multiple ancestries
0-14 62 .6 63 .3 22 .6
15-29 64 .1 66 .0 26 .1
30-44 66 .1 67 .0 20 .5
45+ 59 .8 59 .0 20 .3
Total 63 .0 63 .8 22 .4
% with Aust . ancestry
0-14 59 .6 61 .8 8 .6
15-29 54 .9 57 .7 6 .1
30-44 52 .1 53 .6 4 .1
45+ 51 .2 52 .7 4 .7
Total 54 .6 57 .2 5 .9
Source: 2006 census, customised table
In case studies of the family context in intermarriages between immigrants and native-born Australians, Penny and Khoo36 observed that the cultural identity of the children of mixed marriages depends on their upbringing as well as on their physical appearance. Those of mixed race face different concerns and issues from those who are not because of how others see and respond to them. The majority of the couples in the study have raised their children to be ‘Australians, because they live here’ rather than according to the customs of the immigrant parent. Others have tried to combine ‘the best of both cultures’ taking what they value from the culture of the immigrant parent and ‘the openness, freedom,
35 Portes, A and Rumbaut, R (2001). Legacies: The Story of the Immigrant Second Generation. Berkeley: University of California Press.36 Penny, J and Khoo, S E (1996).

Chapter 6: Intermarriage, Integration and Multiculturalism
117
self-confidence and practical approach to life of the Australian culture’37. Some families have also given their children a combination of ‘ethnic’ and Australian names to reflect their mixed ethnic-Australian parentage.
Other studies have shown that intermarriage also has important implications for the maintenance of the ethnic language. In studies of the second generation in Australia, Clyne and Kipp38 and Khoo39 compared children whose parents were born in the same overseas country with children with one parent born in that country and the other parent born in another overseas country or Australia on whether they spoke the ethnic language or English at home. They found that the shift to speaking English only at home was greater among the children of parents born in different countries or those with one parent born in Australia than those with two parents born in the same overseas country. However, the shift to speaking English among the children also varies by the overseas-born parent’s birthplace. The pattern of these variations was similar to the pattern of intermarriage by birthplace discussed earlier. Children whose fathers or mothers were born in Viet Nam, Lebanon, Greece or Turkey – groups that have a low rate of intermarriage with the Australian-born – were more likely to retain the language of the overseas-born parent than children whose overseas-born parent was from migrant communities that have a higher rate of intermarriage with the Australian-born. Still, more than 40 per cent of Australian-born children with one Australian-born parent and one parent born in Viet Nam, Lebanon or Greece, spoke English only at home, compared with less than 10 per cent of Australian-born children with both parents born in these countries40, indicating the importance of intermarriage in terms of the next generation’s shift to speaking English at home.
Penny and Khoo’s41 study of intermarriage between immigrants and Australians also found that ‘reverse assimilation’ can occur, where the Australian-born partner has adopted the language, religion and culture of the migrant partner. Hence they warn that it may be an oversimplification to assume that intermarriage between immigrants and Australians always leads to immigrant integration. However, the strong statistical evidence in terms of the tendency to identify as Australians amongst the second generation who are children of marriages between immigrants and Australians, and their greater shift to speaking English at home, indicates the important role of intermarriage in the integration of the second generation.
37 Ibid: 206.38 Clyne, M and Kipp, S (1995). ‘The extent of community language maintenance in Australia’, People and Place, 3 (4): 4-8.39 Khoo, S E (1995). ‘Language maintenance amongst the second generation’, People andPlace, 3 (4): 9-12.40 Penny, J and Khoo, S E (1996). Op cit: 52.41 Ibid.

Multiculturalism and Integration
118
Conclusion
Australian demographers have had a long-standing interest in research on intermarriage and its potential as a measure of immigrant integration, an important issue for a country of immigration. The result has been a rich body of knowledge of the intermarriage behaviour of immigrants, based on data on the country of birth of brides and grooms marrying in Australia since the 1920s. More recently, the availability of census data on ancestry has made it possible to examine intermarriage rates by ethnic origin of the Australian-born second and third generations, providing information on the integration of successive generations through inter-ethnic marriage.
In a country of immigration and increasing ethnic diversity such as Australia, intermarriage is not an uncommon occurrence. The spouses were of different ancestries in 30 per cent of all couples enumerated in the 2006 census, and 30 per cent of all marriages that took place in Australia in 2007 were between people who were born in different countries: 23 per cent were between a person born overseas and a person born in Australia and 7 per cent were between people born in two different overseas countries who had migrated to Australia. This level of prevalence and incidence of intermarriage is an indication of the progress of integration and multiculturalism in Australia up to the present time and the continuing role that intermarriage will have in the social and cultural integration of immigrants and ethnic communities in the country’s future.
Intermarried couples have overcome social and cultural barriers in their partnering decisions. This process, building on shared aspirations and values, respect and tolerance, surely also contributes to the progress of multiculturalism, which advocates respect and tolerance of all cultures. Intermarriage is of course also more likely in multicultural societies where different ethnic groups are more likely to come into daily contact with one another in schools, workplaces and social and community activities than in societies where ethnic minorities are residentially and/or socially more segregated. Thus, multiculturalism both promotes and is advanced by intermarriage.
Intermarriage also contributes to the development of an Australian identity in that many children of intermarriages, with their bi- or multi-cultural identities, become Australians by their parents’ or their own definition, as indicated when they are asked to identify their ancestry in the population census. This is particularly the case when one parent identifies as Australian or when one parent is overseas-born and the other is Australian-born. These outcomes also demonstrate the important role of intermarriage in the integration of immigrants and ethnic groups in multicultural societies.

Chapter 6: Intermarriage, Integration and Multiculturalism
119
Recent census data show increasing intermarriage with each successive generation in Australia regardless of ethnic background. Whether this trend will continue in the future in relation to ethnic communities of more recent migrant origin, that do not as yet have a second or third generation of marriage age, is unknown at this time. It will be a few more decades before the intermarriage patterns of the second and third generations of recent immigrant groups can be observed. Much depends on the extent of social interaction between young people from these communities and young Australians of different ethnic backgrounds in schools, tertiary training institutions, workplaces and the community. Policies, institutions, attitudes and cultural-religious norms that encourage equal access to education, training and employment opportunities and participation in social and community groups and activities for young men and women of all ethnic backgrounds will increase their social interaction and encourage intermarriage while those that lead to ethnic or gender segregation and social exclusion are unlikely to contribute to an increase in the intermarriage rate.