Chapter 6 -final - National Council of Educational …ncert.nic.in/ncerts/l/iess106.pdfPOPULATION*...
14
POPULATION * C an you imagine a world without human beings? Who would have utilised resources and created the social and cultural environment? The people are important to develop the economy and society. The people make and use resources and are themselves resources with varying quality. Coal is but a piece of rock, until people were able to invent technology to obtain it and make it a ‘resource’. Natural events like a river flood or Tsunami becomes a ‘disaster’ only when they affect a crowded village or a town. Hence, population is the pivotal element in social studies. It is the point of reference from which all other elements are observed and from which they derive significance and meaning. ‘Resources’, ‘calamities’ and ‘disasters’ are all meaningful only in relation to human beings. Their numbers, distribution, growth and characteristics or qualities provide the basic background for understanding and appreciating all aspects of the environment. Human beings are producers and consumers of earth’s resources. Therefore, it is important to know how many people are there in a country, where do they live, how and why their numbers are increasing and what are their characteristics. The census of India provides us with information regarding the population of our country. We are primarily concerned with three major questions about the population: (i) Population size and distribution: How many people are there and where are they located? (ii) Population growth and processes of population change: How has the population grown and changed through time? (iii) Characteristics or qualities of the population: What are their age, sex- composition, literacy levels, occupational structure and health conditions? POPULATION SIZE AND D ISTRIBUTION India’s Population Size and Distribution by Numbers India’s population as on March 2001 stood at 1,028 million, which account for 16.7 per cent of the world’s population. These 1.02 billion people are unevenly distributed over our country’s vast area of 3.28 million square km, which accounts for 2.4 per cent of the world’s area (Figure 6.1). The 2001 Census data reveals that Uttar Pradesh with a population size of 166 million people is the most populous state of India. Uttar Pradesh accounts for about 16 per cent of the Census A census is an official enumeration of population done periodically. In India the first census was held in the year 1872. The first complete census, however was taken in the year 1881. Since then censuses have been held regularly every tenth year. The Indian Census is the most comprehensive source of demographic, social and economic data. Have you ever seen a census report? Check in your library if it has one. 6 * Kindly see appendix for Census 2011 provisional data 2015-16
Transcript of Chapter 6 -final - National Council of Educational …ncert.nic.in/ncerts/l/iess106.pdfPOPULATION*...

POPULATION*
Can you imagine a world without human
beings? Who would have utilised
resources and created the social andcultural environment? The people are
important to develop the economy and society.
The people make and use resources and are
themselves resources with varying quality.
Coal is but a piece of rock, until people wereable to invent technology to obtain it and make
it a ‘resource’. Natural events like a river flood
or Tsunami becomes a ‘disaster’ only when
they affect a crowded village or a town.
Hence, population is the pivotal element insocial studies. It is the point of reference from
which all other elements are observed and from
which they derive significance and meaning.
‘Resources’, ‘calamities’ and ‘disasters’ are all
meaningful only in relation to human beings.Their numbers, distribution, growth and
characteristics or qualities provide the basic
background for understanding and
appreciating all aspects of the environment.
Human beings are producers andconsumers of earth’s resources. Therefore, it
is important to know how many people are
there in a country, where do they live, how and
why their numbers are increasing and what
are their characteristics. The census of Indiaprovides us with information regarding the
population of our country.
We are primarily concerned with three
major questions about the population:
(i) Population size and distribution: How
many people are there and where are they
located?
(ii) Population growth and processes of
population change: How has the
population grown and changed through
time?
(iii) Characteristics or qualities of the
population: What are their age, sex-
composition, literacy levels, occupationalstructure and health conditions?
POPULATION SIZE AND DISTRIBUTION
India’s Population Size and Distribution by
Numbers
India’s population as on March 2001 stood at
1,028 million, which account for 16.7 per cent
of the world’s population. These 1.02 billion
people are unevenly distributed over our
country’s vast area of 3.28 million square km,
which accounts for 2.4 per cent of the world’sarea (Figure 6.1).
The 2001 Census data reveals that Uttar
Pradesh with a population size of 166 millionpeople is the most populous state of India. Uttar
Pradesh accounts for about 16 per cent of the
Census
A census is an official enumeration of population done periodically. In India the first census was held in the year1872. The first complete census, however was taken in the year 1881. Since then censuses have been heldregularly every tenth year.
The Indian Census is the most comprehensive source of demographic, social and economic data. Have you
ever seen a census report? Check in your library if it has one.
6
* Kindly see appendix for Census 2011 provisional data
2015-16

54 CONTEMPORARY INDIA
Do You KnowOnly Bangladesh and Japan havehigher average population densities
than India. Find out the population densities ofBangladesh and Japan.
is calculated as the number of persons per unitarea. India is one of the most densely populated
countries of the world.
The population density of India in the year
2001 was 324 persons per sq km. Densitiesvary from 904 persons per sq km in West
Bengal to only 13 persons per sq km in
Arunachal Pradesh. A study of the figure 6.3
shows the pattern of uneven distribution of
population densities at the state level.
Activity
Study the figure 6.3 and compare it withfigure 2.4 and figure 4.7. Do you find any
corelation between these maps?
Note the states with population densities
below 250 persons per square km. Ruggedterrain and unfavourable climatic conditions
are primarily responsible for sparse populationin these areas. Which states have density below
100 persons per square km?
Assam and most of the Peninsular stateshave moderate population densities. Hilly,
dissected and rocky nature of the terrain,moderate to low rainfall, shallow and less
fertile soils have influenced population
densities in these areas.The Northern Plains and Kerala in the
south have high to very high populationdensities because of the flat plains with fertile
soils and abundant rainfall. Identify the three
states of the Northern Plains with highpopulation densities.
POPULATION GROWTH AND PROCESSES OF
POPULATION CHANGE
Population is a dynamic phenomenon. Thenumbers, distribution and composition of the
population are constantly changing. This is theinfluence of the interaction of the three processes,
namely-births, deaths and migrations.
India, 16.7%
Rest of the world, 83.3%
Rest of the world, 97.6%
India, 2.4%
AREA
POPULATION
Fig 6.1 : India’s share of world’s area and population
Others 51.2%
UttarPradesh 16.16%
Maharashtra
9.42%
Bihar8.02%
W. Bengal7.79%
AndhraPradesh 7.41%
country’s population. On the other hand, theHimalayan state Sikkim has a population of
just about 0.5 million and Lakshadweep has
only 60 thousand people.Almost half of India’s population lives in
just five states. These are Uttar Pradesh,Maharashtra, Bihar, West Bengal, and Andhra
Pradesh. Rajasthan, the biggest state in terms
of area, has only 5.5 per cent of the totalpopulation of India (Figure 6.2)
• What could be the reason of uneven
distribution of population in India?
India’s Population Distribution by Density
Population density provides a better picture
of the uneven distribution. Population density
Figure 6.2 : Distribution of Population
2015-16

POPULATION 55
Figure 6.3 : Density of Population in India
HARYANA
* Note: Telangana became the 29th State of India on the 2nd June 2014 after the reorganisation of the state ofAndhra Pradesh
2015-16

56 CONTEMPORARY INDIA
12
10
8
6
4
2
01951 1961 1971 1981 1991 2001
2.5
2
1.5
1
0.5
0
Year
Po
pu
lati
on
in
Millio
ns
Total Pupulation
Annual Growth
An
nu
al G
row
th R
ate
%
Table 6.1 and figure 6.4 reveal that from
1951 to 1981, the annual rate of population
growth was steadily increasing; whichexplains the rapid increase in population
from 361 million in 1951 to 683 million in1981.
• Table 6.1 reveals that despite the
decline in growth rates, the number of people beingadded every decade is steadily increasing. Why?
Since 1981, however, the rate of growth
started declining gradually. During thisperiod, birth rates declined rapidly. Still 182
million people were added to the total
population in the 1990s alone (an annual
addition larger than ever before).
It is essential to realise that India has a verylarge population. When a low annual rate is
applied to a very large population, it yields a
large absolute increase. When more than a
billion people increase even at a lower rate, the
total numbers being added becomes very large.India’s current annual increase in population
of 15.5 million is large enough to neutralise
efforts to conserve the resource endowment
and environment.
The declining trend of the growth rate isindeed a positive indicator of the efforts of birth
control. Despite that, the total additions to the
population base continue to grow, and India
may overtake China in 2045 to become the
most populous country in the world.
Population Growth
Growth of population refers to the change inthe number of inhabitants of a country/territory
during a specific period of time, say during thelast ten years. Such a change can be expressedin two ways: in terms of absolute numbers and
in terms of percentage change per year.The absolute numbers added each year or
decade is the magnitude of increase. It isobtained by simply subtracting the earlier
population (e.g. that of 1991) from the laterpopulation (e.g. that of 2001). It is referred toas the absolute increase.
The rate or the pace of population increaseis the other important aspect. It is studied inper cent per annum, e.g. a rate of increase of 2
per cent per annum means that in a given year,there was an increase of two persons for every100 persons in the base population. This isreferred to as the annual growth rate.
India’s population has been steadilyincreasing from 361 million in 1951 to 1028
million in 2001.
Table 6.1 : The Magnitude and Rate of India’s
Population Growth
Year Total Absolute AnnualPopulation Increase in Growth(in millions) the decade Rate
(in million) ( % )
1951 361.0 42.43 1.251961 439.2 78.15 1.961971 548.2 108.92 2.201981 683.3 135.17 2.221991 846.4 163.09 2.142001 1028.7 182.32 1.93
Figure 6.4 : India’s Population and Population Growth Rates during 1951-2001
2015-16

POPULATION 57
Processes of Population Change/Growth
There are three main processes of change of
population : birth rates, death rates andmigration.
The natural increase of population is thedifference between birth rates and death rates.
Birth rate is the number of live births per
thousand persons in a year. It is a majorcomponent of growth because in India, birth
rates have always been higher than deathrates.
Death rate is the number of deaths per
thousand persons in a year. The main causeof the rate of growth of the Indian population
has been the rapid decline in death rates.Till 1980, high birth rates and declining
death rates led to a large difference between
birth rates and death rates resulting in higherrates of population growth. Since 1981, birth
rates have also started declining gradually,resulting in a gradual decline in the rate of
population growth. What are the reasons for
this trend?The third component of population growth
is migration. Migration is the movement ofpeople across regions and territories. Migration
can be internal (within the country) or
international (between the countries).Internal migration does not change the size
of the population, but influences the distributionof population within the nation. Migration plays
a very significant role in changing the composition
and distribution of population.
ActivityOn a map, trace the migration of each
of your grandparents and parentssince their birth. Try and analyse the
reasons for each move.
In India, most migrations have been fromrural to urban areas because of the “push”
factor in rural areas. These are adverse
conditions of poverty and unemployment in the
rural areas and the “pull” of the city in terms
of increased employment opportunities andbetter living conditions.
Migration is an important determinant of
population change. It changes not only the
population size but also the populationcomposition of urban and rural populations
in terms of age and sex composition. In India,
the rural-urban migration has resulted in a
steady increase in the percentage of population
in cities and towns. The urban population hasincreased from 17.29 per cent of the total
population in 1951 to 27.78 per cent in 2001.
There has been a significant increase in the
number of ‘million plus cities’ from 23 to 35 in
just one decade i.e. 1991 to 2001.
Age Composition
The age composition of a population refers to
the number of people in different age groups
in a country. It is one of the most basic
characteristics of a population. To an importantdegree, a person’s age influences what he
needs, buys, does and his capacity to perform.
Consequently, the number and percentage of
a population found within the children,
working age and aged groups are notabledeterminants of the population’s social and
economic structure.
The population of a nation is generally
grouped into three broad categories:
Children (generally below 15 years)
They are economically unproductive and need
to be provided with food, clothing, education
and medical care.
Figure 6.5: India: Age Composition
Adults, 58.7%
Aged, 6.9%
Children, 34.4%
India : Age Structure
2015-16

58 CONTEMPORARY INDIA
Working Age (15-59 years)
They are economically productive and
biologically reproductive. They comprise theworking population.
Aged (Above 59 years)
They can be economically productive though
they may have retired. They may be working
voluntarily but they are not available foremployment through recruitment.
The percentage of children and the agedaffect the dependency ratio because these
groups are not producers. The proportion of
the three groups in India’s population isalready presented in figure 6.5 .
Activity :(i) How many children do you know who are
engaged as household helpers, labourers inyour locality?
(ii) How many adults do you know in your localitywho are unemployed?
(iii) What do you feel are the reasons for this?
Sex Ratio
Sex ratio is defined as the number of femalesper 1000 males in the population. Thisinformation is an important social indicatorto measure the extent of equality betweenmales and females in a society at a given time.The sex ratio in the country has alwaysremained unfavourable to females. Find outwhy this is so? Table 6.2 shows the sex ratiofrom 1951-2001.
Table 6.2 : India : Sex Ratio 1951-2001
Census year Sex ratio
(Females per 1000 males)
1951 9461961 9411971 9301981 9341991 9292001 933
• Kerala has a sex ratio of 1058females per 1000 males, Pondicherry has 1001females for every 1000 males, while Delhi hasonly 821 females per 1000 males and Haryanahas just 861.
• What could be the reasons for such
variations?
Literacy Rates
Literacy is a very important quality of apopulation. Obviously, only an informed and
educated citizen can make intelligent choicesand undertake research and development
projects. Low levels of literacy are a serious
obstacle for economic improvement.According to the Census of 2001, a person
aged 7 years. and above who can read andwrite with understanding in any language, is
treated as literate.
There has been a steady improvement inthe literacy levels in India. The literacy rate in
the country as per the Census of 2001 is 64.84per cent; 75.26 per cent for males and 53.67
per cent for females. Why do such differences
exist?
Occupational Structure
The percentage of population that iseconomically active is an important index of
development. The distribution of the
population according to different types ofoccupation is referred to as the occupational
structure. An enormous variety of occupationsare found in any country. Occupations are
generally classified as primary, secondary, and
tertiary.Primary activities include agriculture,
animal husbandry, forestry, fishing, miningand quarrying etc. Secondary activities include
manufacturing industry, building and
construction work etc. Tertiary activitiesinclude transport, communications,
commerce, administration and other services.The proportion of people working in
different activities varies in developed and
developing countries. Developed nations havea high proportion of people in secondary, and
tertiary activities. Developing countries tendto have a higher proportion of their workforce
engaged in primary activities. In India, about
64 per cent of the population is engaged onlyin agriculture. The proportion of population
dependent on secondary and tertiary sectors
2015-16

POPULATION 59
is about 13 and 20 per cent respectively. There
has been an occupational shift in favour of
secondary and tertiary sectors because ofgrowing industrialisation and urbanisation in
recent times.
Health
Health is an important component of
population composition, which affects theprocess of development. Sustained efforts of
government programmes have registeredsignificant improvements in the health
conditions of the Indian population. Death
rates have declined from 25 per 1000population in 1951 to 8.1 per 1000 in 2001
and life expectancy at birth has increased from36.7 years in 1951 to 64.6 years in 2001.
The substantial improvement is the result
of many factors including improvement inpublic health, prevention of infectious diseases
and application of modern medical practicesin diagnosis and treatment of ailments.
Despite considerable achievements, the
health situation is a matter of major concernfor India. The per capita calorie consumption
is much below the recommended levels andmalnutrition afflicts a large percentage of our
population. Safe drinking water and basic
sanitation amenities are available to only one-third of the rural population. These problems
need to be tackled through an appropriatepopulation policy.
Adolescent Population
The most significant feature of the Indianpopulation is the size of its adolescent
population. It constitutes one-fifth of the totalpopulation of India. Adolescents are generally
grouped in the age-group of 10 to 19 years.
They are the most important resource for thefuture. Nutrition requirements of adolescents
are higher than those of a normal child or adult.Poor nutrition can lead to deficiency and
stunted growth. But in India, the diet available
to adolescents is inadequate in all nutrients. Alarge number of adolescent girls suffer from
anaemia. Their problems have so far not
received adequate attention in the process of
development. The adolescent girls have to besensitised to the problems they confront. Their
awareness can be improved through the spreadof literacy and education among them.
National Population Policy
Recognising that the planning of families wouldimprove individual health and welfare, the
Government of India initiated thecomprehensive Family Planning Programme in
1952. The Family Welfare Programme has
sought to promote responsible and plannedparenthood on a voluntary basis. The National
Population Policy 2000 is a culmination ofyears of planned efforts.
The NPP 2000 provides a policy framework
for imparting free and compulsory schooleducation up to 14 years of age, reducing
infant mortality rate to below 30 per 1000 livebirths, achieving universal immunisation of
children against all vaccine preventable
diseases, promoting delayed marriage for girls,and making family welfare a people-centered
programme.
NPP 2000 and Adolescents
NPP 2000 identified adolescents as one of the
major sections of the population that needgreater attention. Besides nutritional
requirements, the policy put greater emphasison other important needs of adolescents
including protection from unwanted
pregnancies and sexually transmitted diseases(STD). It called for programmes that aim
towards encouraging delayed marriage andchild-bearing, education of adolescents about
the risks of unprotected sex, making
contraceptive services accessible andaffordable, providing food supplements,
nutritional services, strengthening legalmeasures to prevent child marriage.
People are the nation’s most valuable
resource. A well- educated healthy populationprovides potential power.
2015-16

60 CONTEMPORARY INDIA
1. Choose the right answer from the four alternatives given below.
(i) Migrations change the number, distribution and composition of the
population in
(a) the area of departure (c) both the area of departure and arrival
(b) the area of arrival (d) none of the above
(ii) A large proportion of children in a population is a result of
(a) high birth rates (c) high death rates
(b) high life expectancies (d) more married couples
(iii) The magnitude of population growth refers to
(a) the total population of an area
(b) the number of persons added each year
(c) the rate at which the population increases
(d) the number of females per thousand males
(iv) According to the Census 2001, a “literate” person is one who
(a) can read and write his/her name
(b) can read and write any language
(c) is 7 years old and can read and write any language with understanding
(d) knows the 3 ‘R’s (reading, writing, arithmetic)
2. Answer the following questions briefly.
(i) Why is the rate of population growth in India declining since 1981?
(ii) Discuss the major components of population growth.
(iii) Define age structure, death rate and birth rate.
(iv) How is migration a determinant factor of population change?
3. Distinguish between population growth and population change.
4. What is the relation between occupational structure and development?
5. What are the advantages of having a healthy population?
6. What are the significant features of the National Population Policy 2000?
PROJECT/ACTIVITY
Conduct a class census by preparing a questionnaire. The questionnaire should
contain minimum five questions. Questions should relate to students, theirfamily members, their class performance, their health etc. Each student isrequired to fill up the questionnaire. Compile the information in numerical terms
(in terms of percentage). Present the information through pie-chart, bar-diagramor in any other way.
EXERCISE
2015-16

POPULATION 61
GLOSSARY
Adolescence : Adolescence is a period in which a person is no longer a child and
not yet an adult. Such persons are grouped in the age group of
10 to 19 years.
Alluvial plain : A level tract of land made up of alluvium or fine rock material
brought down by a river.
Base population : The total population of an area at the beginning of a given time
period.
Biome : Plant communities occuring in distinct groups in areas havingsimilar climatic conditions.
Birth rate : The number of live births for every 1000 persons in a year.
Depression : In meteorology; it denotes an area of relatively low atmospheric
pressure, which is found mainly in temperate regions. In geology,
it refers to a hollow sunken area of the earth’s surface.
Death rate : The number of deaths per 1000 persons in year.
Density of population : The average number of persons per unit area, such as a squarekilometre.
Dependency ratio : The ratio of people of dependent age (below 15 and above 60 years)
to people of economically active ages (15-59 years).
Ecosystem : A system which comprises the physical environment and the
organisms living therein.
Environment : Surroundings or the conditions under which a person or thing
exists and develops his or its character. It covers both physical
and cultural elements.
Fault : A linear break in rocks of the earth’s crust along which there has
been displacement in a horizontal, vertical or oblique direction.
Fauna : The animal life of a given area.
Flora : The total vegetation or plant cover of a region.
Fold : A bend in the rock strata resulting from compression of an area ofthe earth’s crust.
Geosyncline : A narrow, shallow, elongated basin with a sinking bottom in whicha considerable thickness of sediments was deposited by the rivers
coming from Angara and Gondwanaland.
Glacier : A mass of snow and ice that moves slowly under the influence ofgravity along a confined course away from its place of accumulation.
Growth rate of population : The growth rate of population indicates the rate at which thepopulation is growing. In estimating the growth rate the increase
in population is compared with the base population. It can be
measured annually or over a decade.
Indian Mainland : It refers to the contiguous stretch of landmass from Jammu and
Kashmir to Kanniyakumari and from Gujarat to Arunachal Pradesh.
Indian Standard Time : The local time along the Standard Meridian of India (82°30'E).
Inland drainage : A drainage system in which the waters of the rivers do not reach
the oceans but fall into an inland sea or lake.
2015-16

62 CONTEMPORARY INDIA
Igneous rocks : Rocks formed as a result of solidification of magma either below
the earth’s surface or above it.
Lagoon : A salt-water lake separated from the sea by the sandbars and spits.
Lake : A body of water that lies in a hollow in the earth’s surface and isentirely surrounded by land.
Lithospheric Plates : Large segments of the earth’s crust composed of continental and
oceanic lithospheric parts, floating above the asthenosphere.
Life expectancy : The average number of years one is expected to live.
Local Time : The time of a place determined by the midday sun is called thelocal time.
Metamorphic rocks : Deformation and alteration of pre-existing igneous and
sedimentary rocks as a result of changes in physical and chemicalconditions due to intense heat or pressure.
Migration : Movement of people from one place to another. Internal migrationmeans movement of people within a country and external migration
means movement of people between countries. When people come
to a country from another country, it is called immigration andwhen they leave that country, it is called emigration.
Million Plus cities : Cities with a population of more than one million or 10 lakh.
Monsoon : A complete reversal of winds over a large area leading to a change
of seasons.
Mountain : An upward projected features of the earth’s surface that rises tohigh altitude and usually possesses steep slopes.
National park : A reserved area for preserving its natural vegetation, wild life and
the natural environment.
Plain : An extensive area of flat or gently undulating land.
Plateau : An extensive elevated area of relatively flat land.
Plate Tectonics : The scientific concept that explains the movements of the crustal
plates.
Relief : The differences in elevation or the physical outline of the landsurface or ocean floor.
Subsidence : In meteorology, it is the downward movement of the air. In geology,it refers to the sinking of a portion of the earth’s surface.
Sedimentary rocks : Rocks composed of sediments and generally having a layered
structure.
Sex-ratio : Sex-ratio is defined as the number of females per thousand males.
Sub-Continent : A big landmass, which stands out as a distinct geographical unitfrom the rest of the continent.
Tectonic : Forces originating within the earth and responsible for bringing
widespread changes in the landform features.
Young mountains : The fold mountains formed during the most recent major phase
of folding in the earth’s crust.
2015-16

POPULATION 63
APPENDIX
Chapter 6: Population*
• Page no.53, column 2, line 17– 20
India’s population as on March 2011 stood at 1,210 million, which accounts for 17.5 percent of the world population. These 1.21 billion people are unevenly distributed…
• Page no.53, column 2, line 24 – 25The 2011 Census data reveals that Uttar Pradesh with a population size of 199 million…
• Page no.54, Figure 6.1
India’s share of population – 17.5Rest of the world – 82.5
• Page no.54, column 1, line 2 – 4…Sikkim has a population of just 0.6 million and Lakshadweep has only 64,429 people.
• Page no.54, column 1, line 8–10
Rajasthan, the biggest state in terms of area has only 6 per cent of the total population ofIndia.
• Page no.54, column 1, Figure 6.2: Distribution of Population
* For 2011 only provisional data is available. Hence, data/analysis are provisional.Source: Census of India 2011
Fig. 6.2: Distribution of Population
APPENDIX
2015-16

64 CONTEMPORARY INDIA
• Page no.54, column 2, line 8 – 12
The population density of India in the year 2011 was 382 persons per square km.
Densities vary from 1,102 persons per square km in Bihar to only 17 persons per squarekm in Arunachal Pradesh.
• Page no.55, Figure 6.3: Density of Population in India
Fig. 6.3: Density of Population 2011
* Note: Telangana became the 29th State of India on the 2nd June 2014 after the reorganisation of thestate of Andhra Pradesh
2015-16
APPENDIX 65
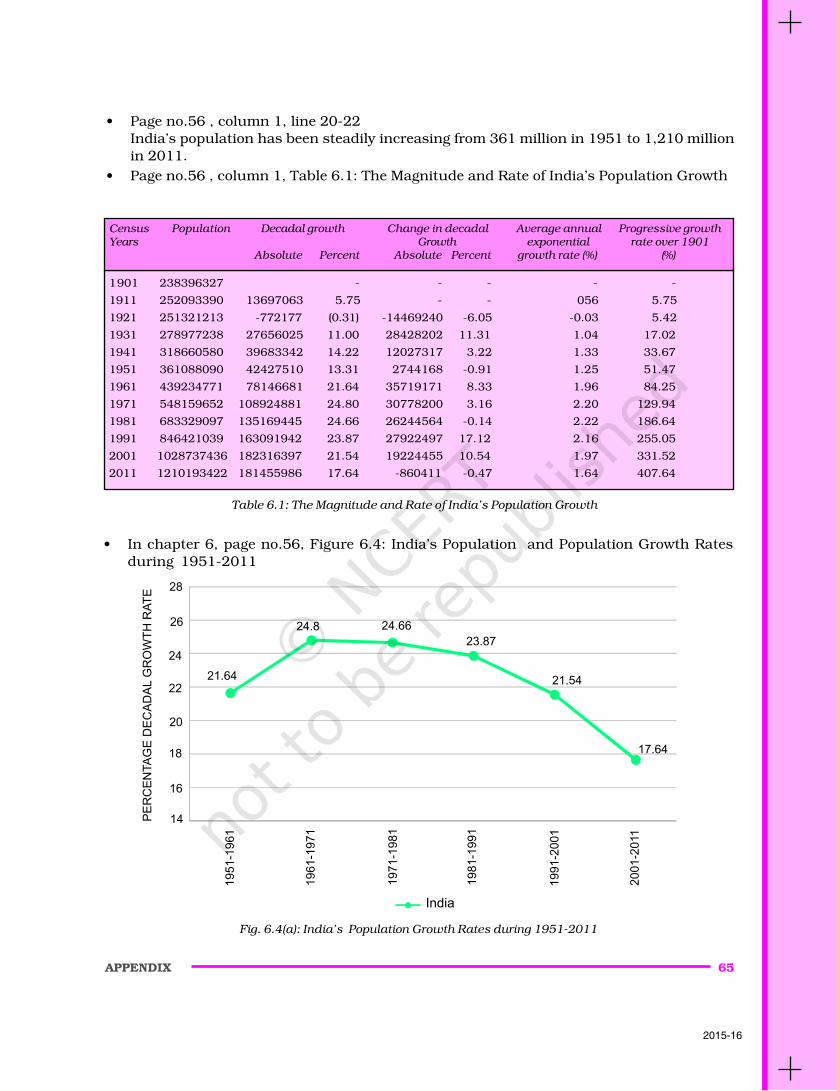
• Page no.56 , column 1, line 20-22
India’s population has been steadily increasing from 361 million in 1951 to 1,210 million
in 2011.
• Page no.56 , column 1, Table 6.1: The Magnitude and Rate of India’s Population Growth
Census Population Decadal growth Change in decadal Average annual Progressive growthYears Growth exponential rate over 1901
Absolute Percent Absolute Percent growth rate (%) (%)
1901 238396327 - - - - -
1911 252093390 13697063 5.75 - - 056 5.75
1921 251321213 -772177 (0.31) -14469240 -6.05 -0.03 5.42
1931 278977238 27656025 11.00 28428202 11.31 1.04 17.02
1941 318660580 39683342 14.22 12027317 3.22 1.33 33.67
1951 361088090 42427510 13.31 2744168 -0.91 1.25 51.47
1961 439234771 78146681 21.64 35719171 8.33 1.96 84.25
1971 548159652 108924881 24.80 30778200 3.16 2.20 129.94
1981 683329097 135169445 24.66 26244564 -0.14 2.22 186.64
1991 846421039 163091942 23.87 27922497 17.12 2.16 255.05
2001 1028737436 182316397 21.54 19224455 10.54 1.97 331.52
2011 1210193422 181455986 17.64 -860411 -0.47 1.64 407.64
• In chapter 6, page no.56, Figure 6.4: India’s Population and Population Growth Rates
during 1951-2011
Fig. 6.4(a): India’s Population Growth Rates during 1951-2011
Table 6.1: The Magnitude and Rate of India’s Population Growth
2015-16

66 CONTEMPORARY INDIA
Fig. 6.4(b): India’s Population 1901-2011
• Page no.57, column 2, line 6-11
The urban population has increased from17.29 per cent of the total population in
1951 to 31.80 per cent in 2011. There hasbeen a significant increase in the number
of million plus cities from 35 to 53 in just
one decade, i.e. 2001 to 2011.Source: Census of India, 2011
• Page no.58, column 1, line 30-31Table 6.2 shows the sex ratio from 1951-
2011.
• Page no.58, column 1, Table 6.2: India :Sex Ratio 1901-2011.
• Page no.58, column 1, Do You Know?
Kerala has a sex ratio of 1084 females per1000 males, Puducherry has 1038
females per every 1000 males, while Delhi has only 866 females per thousand males andHaryana has just 877 females per thousand males.
• Page no.58, column 2, line 15-18
The literacy rate in the country as per the Census of 2011 is 74.04 per cent; 82.14 percent for males and 65.46 per cent for females.
• Page no.59, column 1, line 14-16….1951 to 7.2* per 1000 in 2011 and life expectancy at birth has increased from 36.7
years in 1951 to 64.7** years in 2011.
Census year Sex ratio(Females per 1000 males)
1901 972
1911 964
1921 955
1931 950
1941 945
1951 946
1961 941
1971 930
1981 934
1991 927
2001 933
2011 940
Table 6.2: India : Sex Ratio 1901-2011
*Source: SRS bulletin,Volume 46, No.1 December, 2011
**United Nations World Fact Book (September 17, 2009)
2015-16