CHAPTER 6 Experiment 3: An Investigation of the Effect of...
26
154 CHAPTER 6 Experiment 3: An Investigation of the Effect of Tether Length on Overall Navigational Performance The effect of tether dynamics on local guidance performance has been investigated in Experiment 2. It is the purpose of the current experiment to complement the earlier experiments, according to the dynamic tether space framework shown in Figure 3.9, by investigating the effect of tether length on navigational performance. 6.1 OBJECTIVES AND HYPOTHESES The length of a tether determines the distance between the display viewpoint and the avatar under the control of a user. It affects a tethered viewpoint display in several ways.
Transcript of CHAPTER 6 Experiment 3: An Investigation of the Effect of...

154
CHAPTER 6
Experiment 3: An Investigation of the Effect of Tether Length on Overall Navigational Performance
The effect of tether dynamics on local guidance performance has been investigated in
Experiment 2. It is the purpose of the current experiment to complement the earlier
experiments, according to the dynamic tether space framework shown in Figure 3.9, by
investigating the effect of tether length on navigational performance.
6.1 OBJECTIVES AND HYPOTHESES
The length of a tether determines the distance between the display viewpoint and the
avatar under the control of a user. It affects a tethered viewpoint display in several ways.
155
Firstly, the length of a tether affects the relative egocentricity of a display. As discussed
before, an egocentric frame of reference is characterised by a self-centred local frame of
reference, which is often achieved by placing the display viewpoint at the avatar’s
nominal viewing position. In a tethered viewpoint display, when the length of a tether is
reduced to zero, the information presented on the display is essentially egocentric.
Secondly, the tether length affects the spatial resolution of a display. This is because a
longer tether means a greater distance between the viewpoint and the avatar. Therefore,
in terms of computer graphics, a smaller number of pixels is used to render the avatar and
its immediate surrounding environment. Thirdly, the length of a tether also affects the
amount of preview information that is available to the user. Given the same field of view,
a longer tether allows the viewpoint to cover more surrounding environment than a short
tether. It is suggested that providing more environmental information will facilitate users’
guidance performance, since it allows the user to detect changes in direction earlier.
In an experiment Wickens and Prevett conducted in 1995, a medium length (rigidly)
tethered viewpoint display was reported to support superior local tracking performance
compared with a long and a short length tethered display. However, the global awareness
measurements did not yield any significant results for the tested display conditions.
It was the goal of the current experiment to address this question systematically by
quantitatively investigating the effect of tether length on navigational performance. Two
hypotheses were formulated:

156
1. Global awareness performance will improve with increase of tether length; however,
the margin of performance improvement will be reduced after the length reaches a
certain threshold.
If a maximum tether length is defined as the one which will allow the viewpoint to cover
the whole virtual world, it is obvious that any attempt to increase its length beyond this
maximum will not help to improve global awareness performance. In this study, we
believe that an optimal tether length can be found before it reaches the maximum tether
length and this optimal tether length is associated with the amount of information needed
to perform both local and global navigational tasks.
2. Due to the trade-off between preview information and display spatial resolution, both
very short and very long tethered displays will affect local guidance performance
detrimentally, with the result that optimal local guidance will occur with "medium"
length tethered displays.
In other words, it is believed that local guidance performance can be enhanced by either
providing more preview information or increasing the display spatial resolution. Both of
these factors are affected by the viewing distance, which in turn is determined by the
length of a tether. Elongating a tether will increase the amount of preview information
available to the user, however, will reduce the display spatial resolution at the same time.
On the other hand, reducing the length of a tether will increase the display’s spatial
resolution while limiting the amount of preview information. The result is a trade-off
157
between the advantages and disadvantages of short and long tethers. Hypothesis 2 reflects
this tradeoff, therefore, by postulating that maximal local guidance performance will
occur for "medium length" tethered displays.
6.2 SPATIAL ABILITIES AND THEIR MEASUREMENT
One of the main goals of Experiment 3 was to investigate how users’ global awareness
performance would be affected by the viewpoint distance vector, i.e. the length of a
dynamic tether. Theoretically, however, as discussed here in Section 2.3, it is reasonable
to believe that global awareness performance may depend to a great extent also on
individual abilities with respect to factors such as spatial mapping and spatial memory
capabilities. Therefore, in an attempt to account for potential variability in global
awareness performance introduced by these underlying individual differences in spatial
abilities, if such differences do indeed exist, two evaluations were conducted at the start
of the experiment trials.
Spatial ability refers in reality to a set of abilities, including flexibility of closure, speed
of closure, visual memory, perceptual speed, spatial orientation, and visualization ability.
Many studies have shown that large individual differences exist. (Thorndyke and Stasz,
1980; Thorndyke and Goldin, 1983). In order to correctly interpret the present
experimental results, two spatial ability tests were administered to participants before the
start of the test trials. From among the available spatial ability test packages, the spatial
orientation and spatial visualization tests from the Guilford-Zimmerman Aptitude Survey
(GZAS) battery were selected. The Guilford-Zimmerman Aptitude Survey (distributed by
158
the Sheridan Supply Company, Beverly Hills, California) is a result of early research
done by Guilford with aircraft personnel during World War II (Guilford and Zimmerman,
1948). The battery consists of a total of seven tests. Among them, the spatial orientation
test is designed to measure the subject’s awareness of spatial relations, with an emphasis
on the direction of movement. The spatial visualization test is designed to measure one’s
ability to mentally rotate an object in 3D space. These two tests were selected due to their
obvious relevance to the global awareness test used in the present experiment.
The spatial orientation package comprises 60 questions, a sample of which is shown in
Figure 6.1a. Each question presents two pictures to the participant. The first picture
displays the initial positional relation between a boat and its surrounding environment
(e.g. the bank, other boats, etc.). The second picture shows a subsequent positional
relation between the boat and the environment, after the boat has experienced some
change of its position and/or orientation. The participant’s task is to identify the particular
change of the boat’s position and/or orientation relative to the environment by picking
one answer from the five available choices. In the example shown in Figure 6.1a, for
instance, the correct answer is D.
The spatial visualization package comprises 40 questions, a sample of which is shown in
Figure 6.1b. Each question starts by showing an initial orientation of a clock. Following a
rotational instruction presented by arrows of different lengths on a spherical surface,
participants are asked to figure out the final orientation of the clock and pick an answer
from five possible choices. The direction of the arrow on the sphere indicates the change

159
of clock orientation, while the length of the arrow indicates the amount of angular change.
There are three possible arrow lengths in the tests: 45, 90 and 180 degrees. The number
of orientation changes (arrows) in each question varies from one to three. In the example
shown in Figure 6.1b, for instance the correct answer is B.
6.3 METHOD 6.3.1 Participants
The participants were 12 undergraduate and graduate students from the University of
Toronto (8 women, 4 men). None of them had participated in the previous experiments in
this study, and thus had no experience with either the experimental platform or the
procedure. Eight participants ranged in age from 20 to 29, three participants from 30 to
Figure 6.1 Sample questions from Guilford-Zimmerman Aptitude Survey. Top: spatial orientation test (top); Bottom: spatial visualization test. See text for explanation.
160
39, and one participant was younger than 20. All participants had normal or corrected-to-
normal vision, and satisfied a standard Randot test of stereoscopic acuity. All
participants were predominantly right-handed. Two participants had some limited
experience (i.e. less than 5 hours) with using a Spaceball. Four participants had some
limited experience (i.e. less than 5 hours) in playing aircraft simulation games. None of
the participants had previous experience in flying an aircraft. Participants were paid
$10/h, with a $10 bonus for completing the full experiment.
6.3.2 Apparatus
The hardware setup of this experiment was identical to that used in Experiments 1 and 2.
In order to maintain consistency in reporting the current experiment, key apparatus
features are repeated here.
A Silicon Graphics O2 workstation (1.195 MHz CPU, 224 Mb memory), with a 20-inch
(51-cm) colour monitor with 10241280× pixels of screen resolution, was used to run the
experiment. The monitor was placed approximately 50 cm away from the participants’
eye position. A pair of IMAX stereoscopic shutter goggles was used to provide a
stereoscopic view to the participants. Room lighting was adjusted to reduce the glare on
the monitor. A Spaceball was used as the input device, with only three rotational degrees
of freedom: pitch, roll, and yaw, employed.
The Dynamic Tether Simulator (DTS) was again used as the testing software platform.
Similar to the environmental models used in Experiment 1, the virtual environment
161
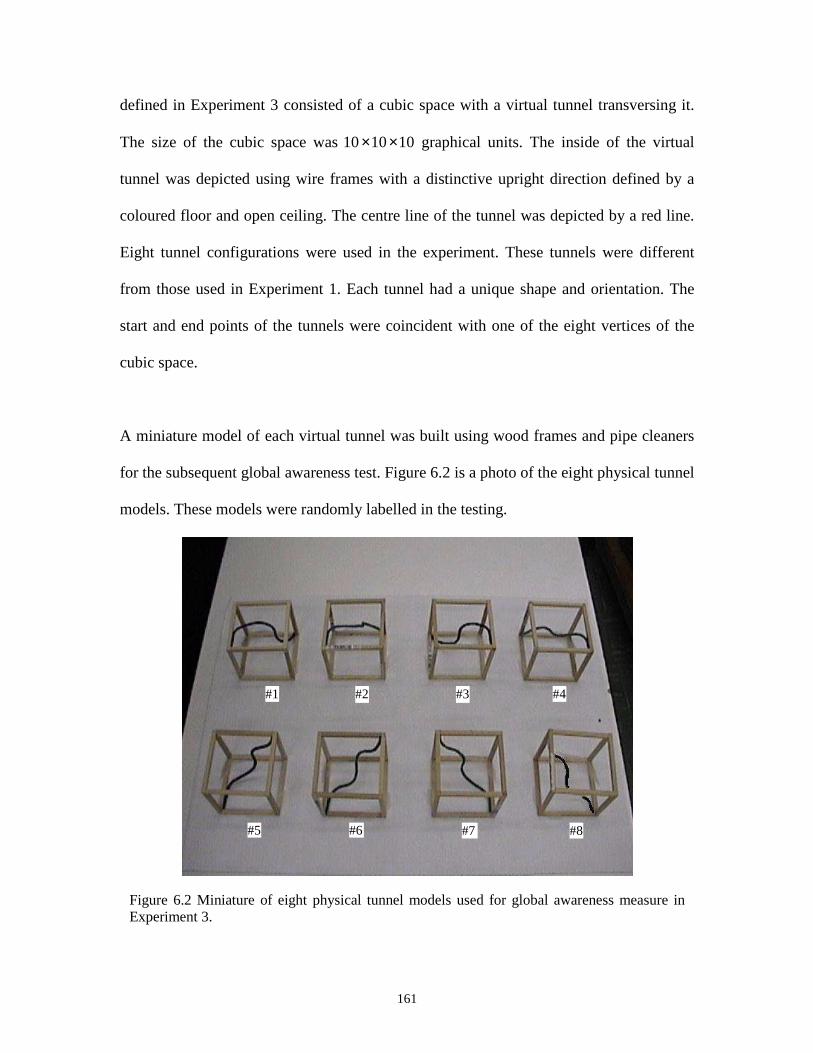
defined in Experiment 3 consisted of a cubic space with a virtual tunnel transversing it.
The size of the cubic space was 101010 ×× graphical units. The inside of the virtual
tunnel was depicted using wire frames with a distinctive upright direction defined by a
coloured floor and open ceiling. The centre line of the tunnel was depicted by a red line.
Eight tunnel configurations were used in the experiment. These tunnels were different
from those used in Experiment 1. Each tunnel had a unique shape and orientation. The
start and end points of the tunnels were coincident with one of the eight vertices of the
cubic space.
A miniature model of each virtual tunnel was built using wood frames and pipe cleaners
for the subsequent global awareness test. Figure 6.2 is a photo of the eight physical tunnel
models. These models were randomly labelled in the testing.
Figure 6.2 Miniature of eight physical tunnel models used for global awareness measure in Experiment 3.
#2 #1 #3 #4
#5 #6 #7 #8

162
6.3.3 Displays
Six critically damped dynamically tethered displays with different tether lengths, ranging
from 0.5 to 12 graphical units, were compared in Experiment 3. Figure 6.3a and 6.3b
show the screen views from the two extreme length tethered displays. Obviously,
considering the fact that the size of the virtual environment was 101010 ×× , the longest
tether depicted in Figure 6.3b, with a length of 12, could be regarded as a ‘very long’
tether. The other four displays had varying tether lengths between the two extreme
conditions, with the specific parametric values listed in Table 6.1. All six tethers were
critically damped, with the values for tether spring constant (K) and damping coefficient
(C) based on the optimal configuration identified in Experiment 2.
Table 6.1 Parameters configurations of six tethers compared in Experiment 3.
Display Code
Spring constant (k)
Damping coefficient (c)
Tether length Damping ratio (ξ)
Dynamic Response
D1 900 60 0.5 1 Critically-damped D2 900 60 1 1 Critically-damped D3 900 60 2 1 Critically-damped D4 900 60 4 1 Critically-damped D5 900 60 8 1 Critically-damped D6 900 60 12 1 Critically-damped
(a) (b) Figure 6.3 Screen views from the shortest tethered display (a) and the longest tethered display (b) used in Experiment 3.
163
6.3.4 Tasks
The participants’ primary task was identical to the active flying task tested in Experiment
1 and 2. They were required to control an avatar, represented by an airplane, flying along
the centre of a virtual tunnel, while mentally keeping track of the shape of the tunnel at
the same time. Before the start of each trial, the airplane was situated at the start point of
one of the virtual tunnels. Following the on-screen instructions, a participant would start
a trial by pressing the space bar on the keyboard. Once a trial was initiated, the airplane
began to fly forward at a constant velocity. The initial part of the tunnel was straight for
all tunnel configurations. The change of orientation of the tunnel was introduced into the
simulation at around 5 seconds after the trial had started. The participant was then
required to maintain the flying trajectory inside the tunnel. In order to define unique
optimal flying performance, participants were instructed to fly the airplane along the
centre line of the tunnel and keep the two wings of the airplane parallel to the tunnel floor.
A trial was completed when the end of the tunnel had been reached. Each trial lasted
approximately 1.5 minutes.
After a trial was finished, participants were presented with a set of eight miniature tunnel
models. (see Figure 6.2) One among those eight tunnel models had the same shape and
orientation as the virtual tunnel used in the just completed trial. Participants were
required to recall the shape of the tunnel they had just flown through and pick it out from
the physical models. Participants had to rely solely on their memory for this judgement;
no further referring to the screen view was allowed.
164
6.3.5 Experimental Design
The experiment was a 6×8 two-factor within-subjects design, comprising 6 tether lengths
and 8 tunnels, with each treatment presented twice to each subject. Display conditions
were counterbalanced across participants. All eight tunnel configurations were presented
for each tether length display condition and were randomly distributed throughout the
experiment.
6.3.6 Procedure
Participants were tested individually over a three-day period and completed six 1-hour
sessions.
Upon arrival at the first session, participants read and signed the informed consent form
(see Appendix 1.3), filled in a demographic questionnaire (see Appendix 2.1), and were
then given the experimental instructions to read (see Appendix 1.2). The experimenter
remained in the room and answered general questions where necessary. Once the
participants understood the experimental task, they were given 20 minutes of training on
the use of the Spaceball. Spaceball demonstration software was used and the training
focused on how to control the Spaceball using three rotational degrees of freedom. After
the participants were comfortable with the Spaceball usage and had successfully
accomplished an unrelated task involving the manipulating of a 3D tetrahedron to four
specific orientations (Zhai, 1995), participants proceeded to perform six experimental

165
trials (one for each tether length). All the hardware and software used during the training
trials were identical to those of the real testing trials, except that a simplified tunnel was
used for the training. The experimenter sat beside the participants during the training and
pointed out incorrect manoeuvres, if there were any.
The second session consisted of the spatial ability examination. Participants were tested
individually using the GZAS spatial orientation and visualization tests. Before the start of
each test, participants were given 20 minutes to read the instructions. The experimenter
remained in the room and answered any question participants might have. It was clearly
explained to participants that they were required to finish each question set as quickly as
possible and that their final scores were calculated by the number of correct answers
minus a fraction of the number of wrong answer. The duration of each test was 10
minutes, for a total duration of 40 minutes for the session. Participants’ answer sheets
were collected for later analysis.
In the ensuing four sessions, the participants completed four blocks of trials. Within each
block there were 24 experimental trials. Root Mean Square (RMS) tracking errors were
used to measure performance on the local guidance subtask. (see Appendix 6) Tunnel
shape recognition was performed at the end of each trial and the accuracy of these
judgments was used as an indication of the completeness of the cognitive map developed
by the participants (Golledge, 1999), and thus as a measure of global awareness
performance.

166
6.4 RESULTS
During the two-week testing period, twelve participants finished a total of 1152 (6 tethers
× 8 tunnels × 12 subjects × 2 repetitions) trials. Raw data were tabulated and analyzed
using Minitab. The analysis focused on two main components of the data: (1) overall
RMS errors produced by each display condition, and (2) tunnel shape recognition scores.
Since the effect of tether length on global awareness was the primary concern in
Experiment 3, a second method was adopted in analyzing the tunnel shape recognition
score, in addition to the same percentage of correct recognition scores used in Experiment
1 and 2. Based on information channel theory, each display was regarded as an
information channel and the amount of information transmitted through each channel (i.e.
each display) was calculated and contrasted with respect to the different tether lengths.
6.4.1 Local Guidance The overall RMS error scores generated are summarized in Table 6.2 and plotted in
Figure 6.4. (See Table 6.1 for an explanation of the display codes, D1 to D6.) An analysis
of variance (see Table 6.3) showed that there was a significant main display effect (F(5,
55) = 8.484, p=0.0005), a significant tunnel effect (F(7, 77)=2.563, p=0.02), and a
significant interaction between the display and tunnel factors (F(35, 385)=2.093,
p<0.0001).

167
Table 6.2 Overall RMS errors across six displays.
Display N MEAN SD D1 192 0.30 0.56 D2 192 0.23 0.36 D3 192 0.15 0.13 D4 192 0.20 0.18 D5 192 0.33 0.42 D6 192 0.53 1.22
Judging from the mean error scores, the “medium length” tethered viewpoint display D3
(l = 2) produced the smallest amount of error. A Tukey pair-wise comparison (p<0.05)
showed that D6 (l = 12) produced significantly more errors than the other five displays,
and D3 (l = 2) generated less error than D1 (l = 0.5), D5 (l = 8), and D6 (l = 12). In
addition, D4 (l = 4) generated less error than D5 (l = 8). (see Table 6.4) It is thus apparent
that at some point the increases of tether length will cause a deterioration in local
guidance performance.
0
0.1
0.2
0.3
0.4
0.5
0.6
0.7
0.8
Overall RMS error
D1 D2 D3 D4 D5 D6 Display
Figure 6.4 Local guidance performance scores across six tethered displays. Horizontal axis is in increasing order of tether length, see Table 6.1.
168
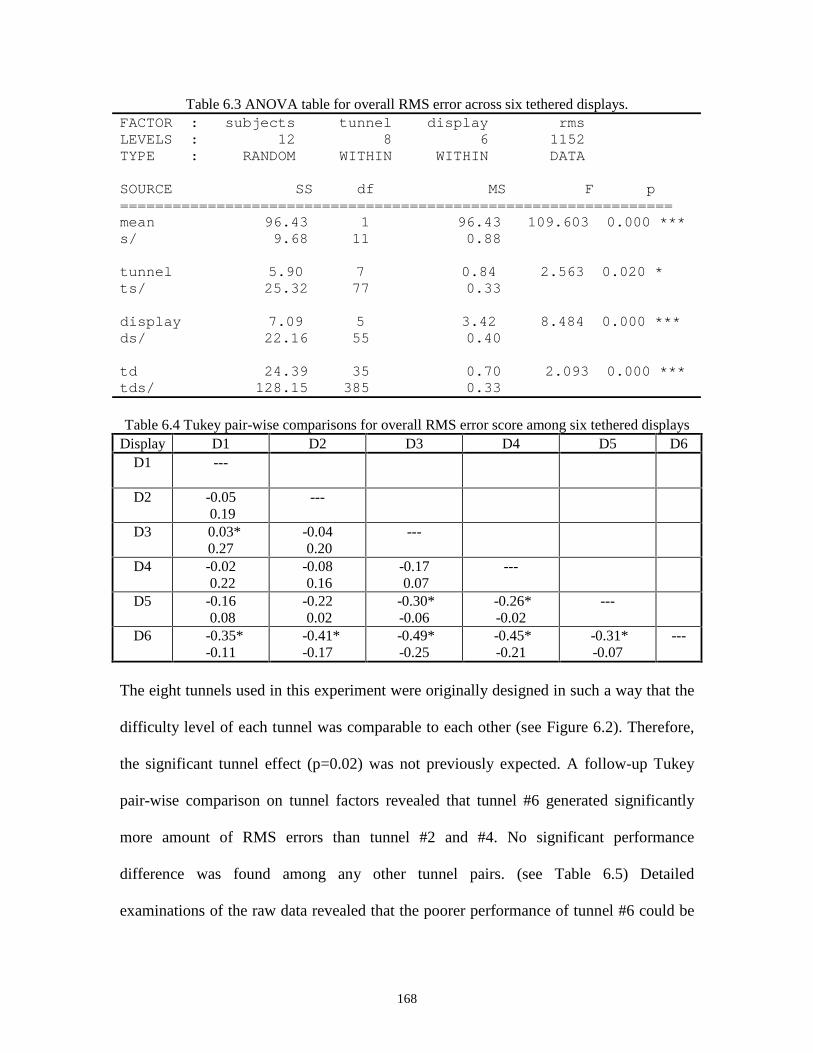
Table 6.3 ANOVA table for overall RMS error across six tethered displays. FACTOR : subjects tunnel display rms LEVELS : 12 8 6 1152 TYPE : RANDOM WITHIN WITHIN DATA SOURCE SS df MS F p =============================================================== mean 96.43 1 96.43 109.603 0.000 *** s/ 9.68 11 0.88 tunnel 5.90 7 0.84 2.563 0.020 * ts/ 25.32 77 0.33 display 7.09 5 3.42 8.484 0.000 *** ds/ 22.16 55 0.40 td 24.39 35 0.70 2.093 0.000 *** tds/ 128.15 385 0.33
Table 6.4 Tukey pair-wise comparisons for overall RMS error score among six tethered displays
Display D1 D2 D3 D4 D5 D6 D1
---
D2 -0.05 0.19
---
D3 0.03* 0.27
-0.04 0.20
---
D4 -0.02 0.22
-0.08 0.16
-0.17 0.07
---
D5 -0.16 0.08
-0.22 0.02
-0.30* -0.06
-0.26* -0.02
---
D6 -0.35* -0.11
-0.41* -0.17
-0.49* -0.25
-0.45* -0.21
-0.31* -0.07
---
The eight tunnels used in this experiment were originally designed in such a way that the
difficulty level of each tunnel was comparable to each other (see Figure 6.2). Therefore,
the significant tunnel effect (p=0.02) was not previously expected. A follow-up Tukey
pair-wise comparison on tunnel factors revealed that tunnel #6 generated significantly
more amount of RMS errors than tunnel #2 and #4. No significant performance
difference was found among any other tunnel pairs. (see Table 6.5) Detailed
examinations of the raw data revealed that the poorer performance of tunnel #6 could be

169
attributed to results from a few trials. However, there was not enough evidence to reject
these data.
Table 6.5 Tukey pair-wise comparisons for overall RMS error score among eight tunnels Tunnels #1 #2 #3 #4 #5 #6 #7 #8
#1
---
#2 -0.15 0.29
---
#3 -0.19 0.25
-0.26 0.18
---
#4 -0.15 0.29
-0.22 0.22
-0.1764 0.2580
---
#5 -0.25 0.18
-0.32 0.11
-0.2799 0.1545
-0.32 0.11
---
#6 -0.38 0.06
-0.45* -0.01
-0.4071 0.0273
-0.45* -0.01
-0.34 0.09
---
#7 -0.28 0.15
-0.35 0.08
-0.3122 0.1222
-0.35 0.08
-0.25 0.18
-0.12 0.31
---
#8 -0.22 0.21
-0.29 0.14
-0.2508 0.1836
-0.29 0.14
-0.19 0.25
-0.06 0.37
-0.16 0.28
---
To interpret the significant interaction between the display and the tunnel factors, the
overall RMS error scores generated by each display were broken down and plotted
against tunnel settings in Figure 6.5. It is apparent that performance from D2, D3, D4
showed relative consistent transition pattern across six tunnels. Performance transition
from D1, D5, and D6, however, showed a more irregular pattern. Theoretically, there is
not enough evidence to explain this significant interaction. An analysis into the frequency
domain might shed some light on this issue. However, due to the constraints currently
imposed by the DTS software, the frequency feature of each tunnel was not significantly
distinctive enough to elicit some meaningful results. With improvements on tunnel
generating algorithms, further experiments are expected to provide more insight into this.

170
6.4.2 Global Awareness
Participants’ tunnel recognition scores are summarized in Table 6.6 and plotted in Figure
6.6. The mean scores showed an apparent improvement in global awareness with the
increase of tether length. Approximately only half the recognitions (55%) were correct
for the shortest tethered viewpoint display D1 (l = 0.5). In contrast, the longest tethered
viewpoint display D6 (l = 12) produced better scores (83%). An analysis of variance
showed a significant main display effect (F(5, 55) = 15.479, p<0.001). A post hoc Tukey
pair wise comparison (p<0.05) showed that D1 (l = 0.5) and D2 (l = 1) produced
significantly lower scores than the rest four displays, D3 (l = 0.5) produced significantly
lower score than D6 (l = 12). A significant tunnel effect (F(7, 77) = 3.662, p=0.002) and a
significant interaction between the display and tunnel (F(35, 385) = 1.759, p=0.006) were
also found. Results of ANOVA and Tukey test are summarized in Tables 6.7 and 6.8
respectively.
Figure 6.5 Overall RMS errors produced by each display across tunnel conditions
Overall RMS error
Tunnel
0
0.1
0.2
0.3
0.4
0.5
0.6
0.7
0.8
0.9
D1 D2 D3 D4 D5 D6
#1
#2
#3
#4
#5
#6
#7
#8
Display

171
Table 6.6 Tunnel shape recognition scores across six displays.
Display N MEAN SD D1 192 0.55 0.50 D2 192 0.55 0.50 D3 192 0.69 0.47 D4 192 0.70 0.46 D5 192 0.79 0.41 D6 192 0.83 0.38
Table 6.7 ANOVA table for overall RMS error across six tethered displays. FACTOR : subjects tunnel display global LEVELS : 12 8 6 1152 TYPE : RANDOM WITHIN WITHIN DATA SOURCE SS df MS F p =============================================================== mean 539.01 1 539.01 266.645 0.000 *** s/ 22.24 11 2.02 tunnel 6.93 7 0.99 3.662 0.002 ** ts/ 20.82 77 0.27 display 13.01 5 2.60 15.479 0.000 *** ds/ 9.24 55 0.17 td 11.13 35 0.32 1.759 0.006 ** tds/ 69.62 385 0.18
0
0.1
0.2
0.3
0.4
0.5
0.6
0.7
0.8
0.9
1Path recognition score
D1 D2 D3 D4 D5 D6 Display
Figure 6.6 Tunnel shape recognition scores across six tethered displays. Horizontal axis is in increasing order of tether length, see Table 6.1.

172
Table 6.8 Tukey pair-wise comparisons for tunnel shape recognition score among displays. Display D1 D2 D3 D4 D5 D6
D1
---
D2 -0.14 0.13
---
D3 -0.28* -0.01
-0.27* -0.01
---
D4 -0.28* -0.02
-0.28* -0.01
-0.14 0.13
---
D5 -0.37* -0.11
-0.37* -0.10
-0.23 0.04
-0.22 0.04
---
D6 -0.41* -0.15
-0.41* -0.14
-0.27* -0.01
-0.26 0.01
-0.17 0.09
---
6.4.3 Analyzing Tunnel Shape Recognition Score Using Information Channel Theory The tunnel shape recognition score was a binary measure in which a correct judgment
yielded a score of one, whereas a mistaken judgment yielded a score of zero. One
shortcoming with this method is that it does not distinguish between situations where
participants were totally disoriented and those that they were only partially disoriented.
For example, in some cases, participants were able to recognize certain feature of the
tunnel, but failed to make the correct judgment. These situations could be descried as
being partially disoriented. The previously calculated tunnel shape recognition scores did
not consider these situations. To address this problem, participants’ responses were re-
analyzed using the information channel theory (see Sheridan and Ferrell, 1974 for a
discussion of information channels). Each display was regarded as an information
channel. The amount of input information was determined by the number of tunnel
configuration. The amount of output information was decided by participants’ responses.
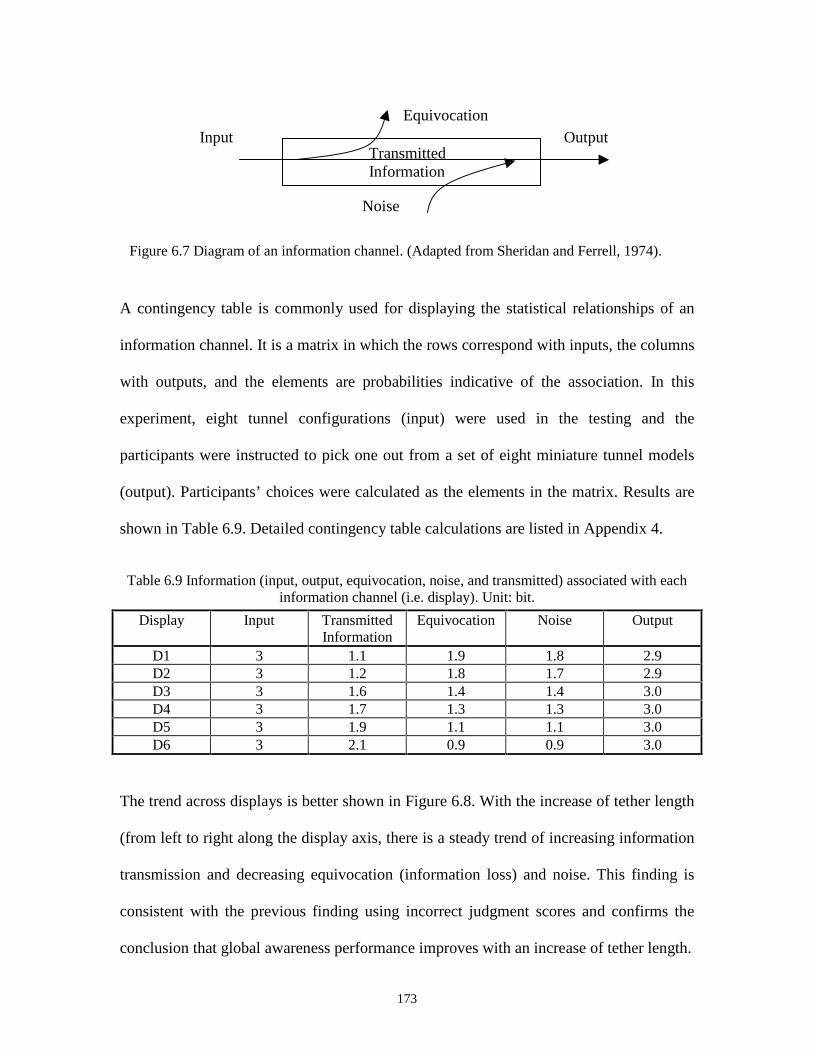
A diagram illustrating an information channel is shown in Figure 6.7.
173
A contingency table is commonly used for displaying the statistical relationships of an
information channel. It is a matrix in which the rows correspond with inputs, the columns
with outputs, and the elements are probabilities indicative of the association. In this
experiment, eight tunnel configurations (input) were used in the testing and the
participants were instructed to pick one out from a set of eight miniature tunnel models
(output). Participants’ choices were calculated as the elements in the matrix. Results are
shown in Table 6.9. Detailed contingency table calculations are listed in Appendix 4.
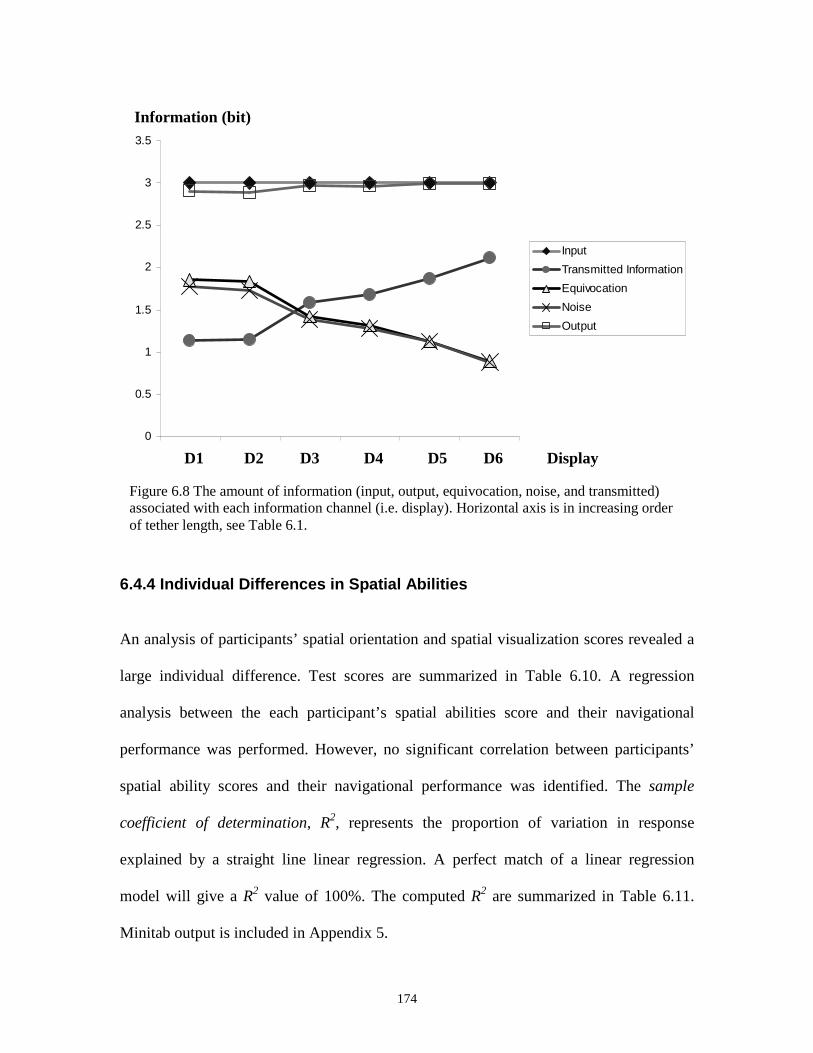
Table 6.9 Information (input, output, equivocation, noise, and transmitted) associated with each information channel (i.e. display). Unit: bit.
Display Input Transmitted Information
Equivocation Noise Output
D1 3 1.1 1.9 1.8 2.9 D2 3 1.2 1.8 1.7 2.9 D3 3 1.6 1.4 1.4 3.0 D4 3 1.7 1.3 1.3 3.0 D5 3 1.9 1.1 1.1 3.0 D6 3 2.1 0.9 0.9 3.0
The trend across displays is better shown in Figure 6.8. With the increase of tether length
(from left to right along the display axis, there is a steady trend of increasing information
transmission and decreasing equivocation (information loss) and noise. This finding is
consistent with the previous finding using incorrect judgment scores and confirms the
conclusion that global awareness performance improves with an increase of tether length.
Transmitted Information
Input Output Equivocation
Noise
Figure 6.7 Diagram of an information channel. (Adapted from Sheridan and Ferrell, 1974).
174
6.4.4 Individual Differences in Spatial Abilities
An analysis of participants’ spatial orientation and spatial visualization scores revealed a
large individual difference. Test scores are summarized in Table 6.10. A regression
analysis between the each participant’s spatial abilities score and their navigational
performance was performed. However, no significant correlation between participants’
spatial ability scores and their navigational performance was identified. The sample
coefficient of determination, R2, represents the proportion of variation in response
explained by a straight line linear regression. A perfect match of a linear regression
model will give a R2 value of 100%. The computed R2 are summarized in Table 6.11.
Minitab output is included in Appendix 5.
0
0.5
1
1.5
2
2.5
3
3.5
1 2 3 4 5 6
Input
Transmitted Information
Equivocation
Noise
Output
Information (bit)
D1 D2 D3 D4 D5 D6 Display
Figure 6.8 The amount of information (input, output, equivocation, noise, and transmitted) associated with each information channel (i.e. display). Horizontal axis is in increasing order of tether length, see Table 6.1.

175
Table 6.10 Participants’ spatial orientation and spatial visualization scores using Guilford-
Zimmerman Aptitude Survey. Participant Spatial orientation score Spatial visualization score
s1 8.3 19.3 s2 24.0 25.5 s3 13.8 18.3 s4 33.8 19.8 s5 30.0 20.0 s6 18.0 16.3 s7 34.3 23.5 s8 30.3 19.5 s9 20.5 16.0 s10 31.0 19.0 s11 13.0 12.3 s12 18.0 22.3
Table 6.11 Sample coefficient of determination, R2, obtained from the regression analysis.
R2 Spatial orientation score Spatial visualization score Local guidance 12.7% 3.4%
Global awareness 4.8% 2.1%
6.5 DISCUSSION OF RESULTS
6.5.1 Major Findings
1. Comparing tethered viewpoint displays with the same dynamic properties, global
awareness improves and local guidance performance deteriorates with the increase of
tether length.
2. Tethered viewpoint display with extreme length conditions (i.e. zero or very long
length) fail to support overall navigation. The overall best navigational performance is
obtained by a medium length tethered viewpoint display.
176
6.5.2. Spatial Abilities and Their Relations to Global Awareness
Theoretically, participants’ navigational performances (especially, global awareness) are
influenced by their individual spatial abilities. However, the experiment results failed to
reveal any significant correlation between participants spatial ability test scores and their
performance scores. Similar results were also reported in several other studies (e.g.
Satalich, 1995; Chen, 2000).
There could be two reasons for accounting this finding. (1) Spatial ability is a generic
term used to describe a set of human abilities. Besides visualization and orientation
ability, it also includes speed of closure, flexibility of closure, perceptual speed etc. The
two tests used in this study were mainly focused on two aspects of spatial ability. As
Istance and Hand (1998) pointed out, “it remains to be demonstrated that performance on
a particular single test can adequately characterise the component spatial abilities used
when completing tasks requiring the acquisition of navigational knowledge from virtual
environments.” This partial measurement of participants’ spatial ability might be the
reason why there was no significant correlation between participants’ spatial ability
scores and their awareness performance. (2) The Guilford-Zimmerman tests itself was
originally designed for aircraft personnel working in aviation scenario. Like many of
spatial ability test packages, the GZAS tests were validated with subjects’ navigational
performance in real geographical environments. Since the simulation used in this study
was carried out in a software simulation, in other words, in a virtual environments. It is
possible that the tests themselves are not a good representation of user’s spatial ability in

177
virtual environments. No empirical data is available to address this right now. Further
research is required.
6.5.3 Experiment 2 Results Revisited
The findings in Experiment 3 provided additional context for interpreting the results in
Experiment 2. A constant tether length (2 graphical units) was adopted for all tethered
displays in Experiment 2. Participants’ tunnel shape recognition scores did not reveal any
significant performance differences across all tethered viewpoint displays. Due to the
high performance scores, it was suggested that a ceiling effect was observed in
participants’ global awareness performance.
In the current Experiment, display D3 had the same tether length as those displays tested
in Experiment 2. As manifested in the results of Experiment 3, a tether length of 2
graphical units is the threshold for supporting optimal global awareness under the
simulation task used in this study. In other words, a tethered display with a length of 2
graphical units is long enough to support optimal global awareness performance.
Elongating the tether length beyond this threshold will not significantly improve global
awareness, as indicated in the results. This confirms the ceiling effect claimed in the
global awareness performance in Experiment 2.
178
6.5.4 Optimal Tether Length
The performance trade-off between the local guidance and global awareness tasks
showed that the optimal tethered display for the current task simulation was display D3
which had a length of 2 graphical units. It was claimed in the experimental conclusion
that best overall navigational performance was supported by a medium length tethered
display. The use of the word medium here was trying to emphasize the fact that the
optimal tether length does not coincident with extreme tether length conditions. This is
also an indication of the trade-off between display preview information and its spatial
resolution.
Considering the fact that the possible tether lengths for the current simulation ranged
from 0 (i.e. the egocentric case) to 15 (i.e. the exocentric case, in which the viewpoint can
survey the whole cubic environment) graphical units. An optimal tether length of 2
graphical units lies in the short tether range. As manifested in the RMS error diagram (see
Figure 6.4), the optimal tether length was mainly decided by the local guidance task
performance. Difficulties in guidance task were reported by participants during the
experiment, in other words, the local guidance task was the bottleneck in the testing
scenario. On the basis of the navigation framework proposed by Wickens and Prevett
(1995) (see Chapter 2 for detailed descriptions), it is predictable that an optimal display
for supporting the current experimental tasks shall lie on the egocentric end of the display
centricity continuum. The current finding of a short optimal tether confirms the validity
of the framework.
179
Following the same principle, further predictions of optimal tether length can be made
with respect to the task difficulties. For example, the optimal tether length will increase if
the difficulties of local guidance tasks reduce (e.g. slow down the constant airplane flying
speed) or if the difficulties of global awareness tasks increase (e.g. more complicated
environments, harder awareness tasks etc.). The shift of task difficulties between the local
guidance and global awareness tasks imposes a change of requirements on the integrating
of information from the egocentric and exocentric frames of references. Dynamic
viewpoint tethering has shown its flexibility in supporting the achievement of
maximizing navigation efficiency.