CHAPTER 6 EMISSION FORECASTING Introduction … · 6.1 INTRODUCTION This chapter presents the three...
29
CHAPTER 6 EMISSION FORECASTING Introduction Emission Forecast Emission Inventories Conclusions
Transcript of CHAPTER 6 EMISSION FORECASTING Introduction … · 6.1 INTRODUCTION This chapter presents the three...

CHAPTER 6
EMISSION FORECASTING
Introduction
Emission Forecast
Emission Inventories
Conclusions

6 - 1
6. EMISSION FORECASTING
6.1 INTRODUCTION
This chapter presents the three emission inventory forecasts used in the development of this 2001
Clean Air Plan (2001 Plan). These inventories are the 2005, 2010, and 2015 Planning Emission
Inventory forecasts of reactive organic compounds (ROC) and oxides of nitrogen (NOx) emissions in
Santa Barbara County and the Outer Continental Shelf (OCS), offshore of Santa Barbara County.
The 2005, 2010, and 2015 Planning Emission Inventory forecasts are based on the 1999 Planning
Emission Inventory, which is described in Chapter 3, Emission Inventory. This 1999 Planning
Emission Inventory is the base year for emission forecasting and was developed by modifying the
1999 Annual Emission Inventory, (also described in Chapter 3). A Planning Emission Inventory is
essentially a modified subset of an Annual Emission Inventory and differs from an Annual Emission
Inventory in three ways. First, the creation of the Planning Emission Inventory involves adjusting
the Annual Emission Inventory to account for seasonal variation because most exceedances of the
state and federal 1-hour ozone standards occur during the April to October ozone season. This is
commonly referred to as a summer seasonal inventory. Second, the emissions from natural sources
such as biogenics, oil and gas seeps, and wildfires that are part of the Annual Emission Inventory are
excluded from the Planning Emission Inventory since they are not regulated or controlled through
implementation of emission control measures. Finally, the annual emissions in the Annual Emission
Inventory are converted to daily emissions in the Planning Emission Inventory.
6.2 EMISSION FORECAST
The 1999 Planning Emission Inventory forecast of emissions is used to demonstrate that the
emission control measures, described in Chapters 4 and 5 of this 2001 Plan, will reduce enough
emissions to maintain the federal 1-hour ozone standard from 1999 out to 2015, while accounting for
growth expected in the county. (Refer to Chapter 7, Redesignation Request and Maintenance Plan
for a detailed discussion of this topic).

6 - 2
To forecast future year emissions, estimates of the changes in the level of pollution producing
activities, known as “activity indicators”, are used to grow the 1999 Planning Emission Inventory.
In addition, emission reductions resulting from local control rules adopted by the APCD Board of
Directors and from statewide regulations adopted by the California Air Resources Board (ARB) are
estimated and accounted for in the future year forecasts.
Since we are using a 1999 emission inventory base year, future year forecasted emission inventories
must be adjusted to account for emission reduction credits (ERCs) that were in the Source Register
prior to the base year emission inventory. ERC’s are previous reductions in emissions that can be
credited to allow increased emissions from a new or modified stationary source. USEPA policy
mandates that ERC’s must be treated as potential growth in forecast years. Total available ERC’s
in the Source Register for Santa Barbara County, as of the 3rd quarter of 2001, were 0.1735 tons per
day of ROC and 0.4378 tons per day of NOx. These total ERC values are included in the emission
forecast tables presented at the end of this chapter. A detailed list of each source that owns these
ERC’s are listed in the table below.
SANTA BARBARA COUNTY SOURCE REGISTER ERC’s (As of 3rd Quarter 2001) (Tons per day)
ROC NOx Chevron 0.0194 0.0000
Grefco 0.0070 0.0000
Greka SMV, Inc. 0.0755 0.0112
McGhan Medical 0.0032 0.0000
Nuevo Energy Company 0.0633 0.0338
POPCO 0.0004 0.0005 US Air Force – VAFB 0.0047 0.3944 TOTAL SOURCE REGISTER ERC’s 0.1735 0.4399
ERC’s for the US Air Force – VAFB are only allowed to be used for projects at Vandenberg Air Force Base.
6 - 3
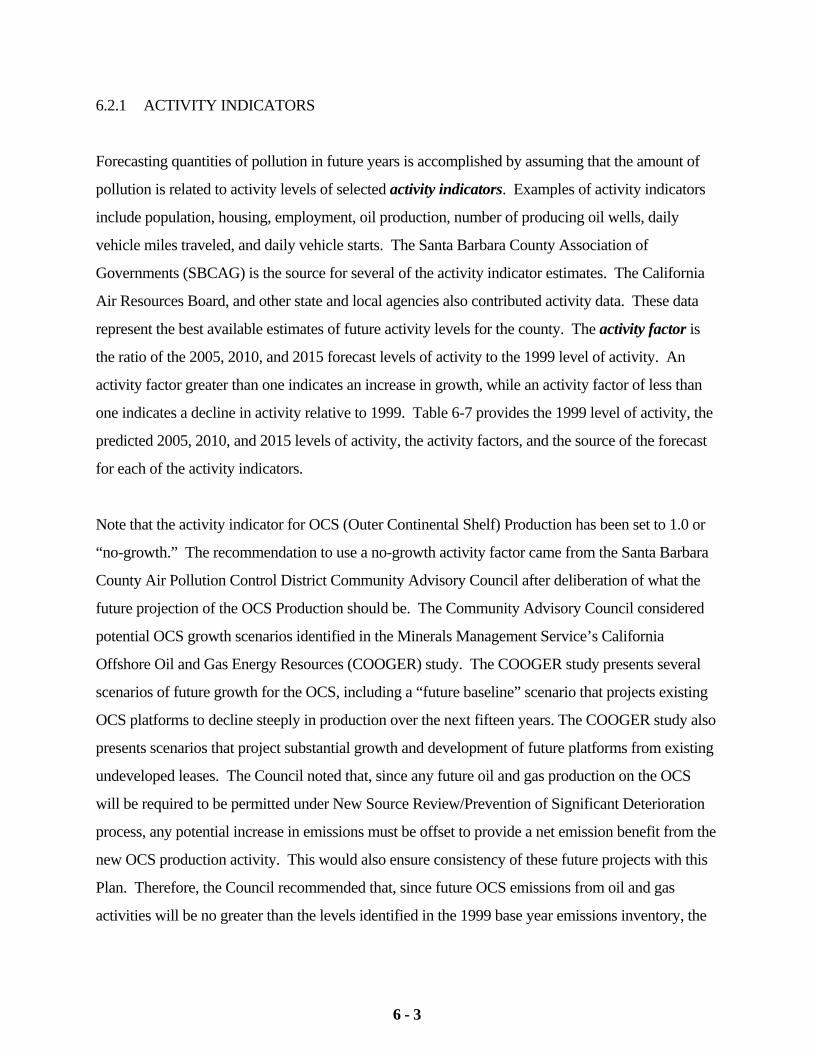
6.2.1 ACTIVITY INDICATORS
Forecasting quantities of pollution in future years is accomplished by assuming that the amount of
pollution is related to activity levels of selected activity indicators. Examples of activity indicators
include population, housing, employment, oil production, number of producing oil wells, daily
vehicle miles traveled, and daily vehicle starts. The Santa Barbara County Association of
Governments (SBCAG) is the source for several of the activity indicator estimates. The California
Air Resources Board, and other state and local agencies also contributed activity data. These data
represent the best available estimates of future activity levels for the county. The activity factor is
the ratio of the 2005, 2010, and 2015 forecast levels of activity to the 1999 level of activity. An
activity factor greater than one indicates an increase in growth, while an activity factor of less than
one indicates a decline in activity relative to 1999. Table 6-7 provides the 1999 level of activity, the
predicted 2005, 2010, and 2015 levels of activity, the activity factors, and the source of the forecast
for each of the activity indicators.
Note that the activity indicator for OCS (Outer Continental Shelf) Production has been set to 1.0 or
“no-growth.” The recommendation to use a no-growth activity factor came from the Santa Barbara
County Air Pollution Control District Community Advisory Council after deliberation of what the
future projection of the OCS Production should be. The Community Advisory Council considered
potential OCS growth scenarios identified in the Minerals Management Service’s California
Offshore Oil and Gas Energy Resources (COOGER) study. The COOGER study presents several
scenarios of future growth for the OCS, including a “future baseline” scenario that projects existing
OCS platforms to decline steeply in production over the next fifteen years. The COOGER study also
presents scenarios that project substantial growth and development of future platforms from existing
undeveloped leases. The Council noted that, since any future oil and gas production on the OCS
will be required to be permitted under New Source Review/Prevention of Significant Deterioration
process, any potential increase in emissions must be offset to provide a net emission benefit from the
new OCS production activity. This would also ensure consistency of these future projects with this
Plan. Therefore, the Council recommended that, since future OCS emissions from oil and gas
activities will be no greater than the levels identified in the 1999 base year emissions inventory, the
6 - 4
activity indicator for OCS Production should be set to no-growth as a reasonable assumption of
future oil and gas production emissions on the OCS.
An activity indicator was assigned to each Stationary Source and Area-Wide Source category
described in Chapter 3, with the exception of categories of On-Road Motor Vehicles and Other
Mobile Sources, which are derived from ARB’s EMFAC2000 and OFFROAD Models,
respectively. The ARB has provided the APCD with emission forecasts for all of these source
categories.
To forecast future year uncontrolled emissions, the quantity of emissions from each source in 1999
is multiplied by the activity factor of its assigned activity indicator. The assignments of activity
indicators to emission sources are documented in Appendix A, Emission Inventory and Forecasting
Documentation.
6.2.2 CONTROL MEASURES
The next step in forecasting future year emissions is to account for regulations and control measures
scheduled for implementation since 1990. Emission reductions are achieved through
implementation of federal, state and local controls on a variety of pollution sources, including
Stationary Sources, Area-Wide Sources, and Mobile Sources.
The emissions from each source were reduced according to the expected efficiency of any control
measures that apply to that source, taking into account any existing level of control. The efficiencies
for each control measure and how they are calculated are provided in Appendix B, Stationary Source
Emission Control Documentation. Estimated efficiencies take into account equipment (design)
efficiencies, exemptions, phased implementations, and expected rates of compliance (assumed to be
a default 80%, as recommended in USEPA guidelines). The resulting emissions after the application
of control measures represent a seasonally adjusted emission inventory forecast. A detailed
accounting of forecast emissions after control measure implementation for each source category is
presented in Appendix A.

6 - 5
6.2.3 VANDENBERG AIR FORCE BASE CONFORMITY GROWTH ALLOWANCE
Vandenberg Air Force Base (VAFB) requested that the APCD include a conformity growth
allowance into the 2001 Plan to account for an Airborne Laser (ABL) Mission that may potentially
come to VAFB. On November 15, 2001, the APCD Board of Directors approved this request, with
the condition that a portion of the emissions from the ABL Mission be offset by withdrawing
Emission Reduction Credits (ERC’s) from the VAFB Source Register. The remaining emissions
from the ABL Mission are included in the 2001 Plan as a growth allowance and have been listed as
line items in Tables 6-1, 6-3, and 6-5. The table below shows the emissions from the ABL Mission
estimated by VAFB, the ERC’s required from VAFB required to offset the ABL Mission, and the
remaining emissions that would be added as line items in the 2001 Plan.
VANDENBERG AIR FORCE BASE (VAFB) AIRBORNE LASER (ABL) MISSION
ROC NOx (Tons per day) (Tons per day)
Projected 2005 Emissions for the ABL Mission by VAFB 0.0552 0.0634
Projected 2010 Emissions for the ABL Mission by VAFB 0.0656 0.4867
Projected 2015 Emissions for the ABL Mission by VAFB 0.0656 0.4867
Source Register ERC’s required to offset the ABL Mission 0.0000 0.1265
2005 Emissions added to the 2001 Plan for the ABL 0.0552 0.0000
2010 Emissions added to the 2001 Plan for the ABL 0.0656 0.3602
2015 Emissions added to the 2001 Plan for the ABL 0.0656 0.3602

6 - 6
6.3 EMISSION INVENTORIES
The following is a summary of the 2005, 2010, and 2015 Planning Emission Inventory Forecasts, for
both Santa Barbara County and the Outer Continental Shelf (OCS). These emissions are presented
in greater detail in Tables 6-1 through 6-6 and Figures 6-1 through 6-6 located at the end of the
chapter.
6.3.1 2005 PLANNING EMISSION INVENTORY FORECAST:
SANTA BARBARA COUNTY
2005 Santa Barbara County ROC Planning Emissions: 32.83 tons per day
• 24% Stationary Sources (including Source Register ERC’s): 7.76 tons per day
• 25% Area-Wide Sources: 8.18 tons per day
• 51% Mobile Sources (including VAFB ABL): 16.90 tons per day
2005 Santa Barbara County NOx Planning Emissions: 40.96 tons per day
• 11% Stationary Sources (including Source Register ERC’s): 4.38 tons per day
• 3% Area-Wide Sources: 1.20 tons per day
• 86% Mobile Sources (including VAFB ABL): 35.38 tons per day
6.3.2 2005 PLANNING EMISSION INVENTORY FORECAST:
OUTER CONTINENTAL SHELF
2005 OCS ROC Planning Emissions: 2.69 tons per day
• 33% Stationary Sources: 0.89 tons per day
• 67% Mobile Sources: 1.80 tons per day
2005 OCS NOx Planning Emissions: 34.27 tons per day
• 2% Stationary Sources: 0.66 tons per day
• 98% Mobile Sources: 33.61 tons per day

6 - 7
6.3.3 2010 PLANNING EMISSION INVENTORY FORECAST:
SANTA BARBARA COUNTY
2010 Santa Barbara County ROC Planning Emissions: 28.26 tons per day
• 25% Stationary Sources (including Source Register ERC’s): 7.02 tons per day
• 30% Area-Wide Sources: 8.41 tons per day
• 45% Mobile Sources (including VAFB ABL): 12.83 tons per day
2010 Santa Barbara County NOx Planning Emissions: 34.74 tons per day
• 13% Stationary Sources (including Source Register ERC’s): 4.46 tons per day
• 3% Area-Wide Sources: 1.22 tons per day
• 84% Mobile Sources (including VAFB ABL): 29.05 tons per day
6.3.4 2010 PLANNING EMISSION INVENTORY FORECAST:
OUTER CONTINENTAL SHELF
2010 OCS ROC Planning Emissions: 2.71 tons per day
• 33% Stationary Sources: 0.89 tons per day
• 67% Mobile Sources: 1.82 tons per day
2010 OCS NOx Planning Emissions: 39.31 tons per day
• 2% Stationary Sources: 0.67 tons per day
• 98% Mobile Sources: 38.64 tons per day
6 - 8
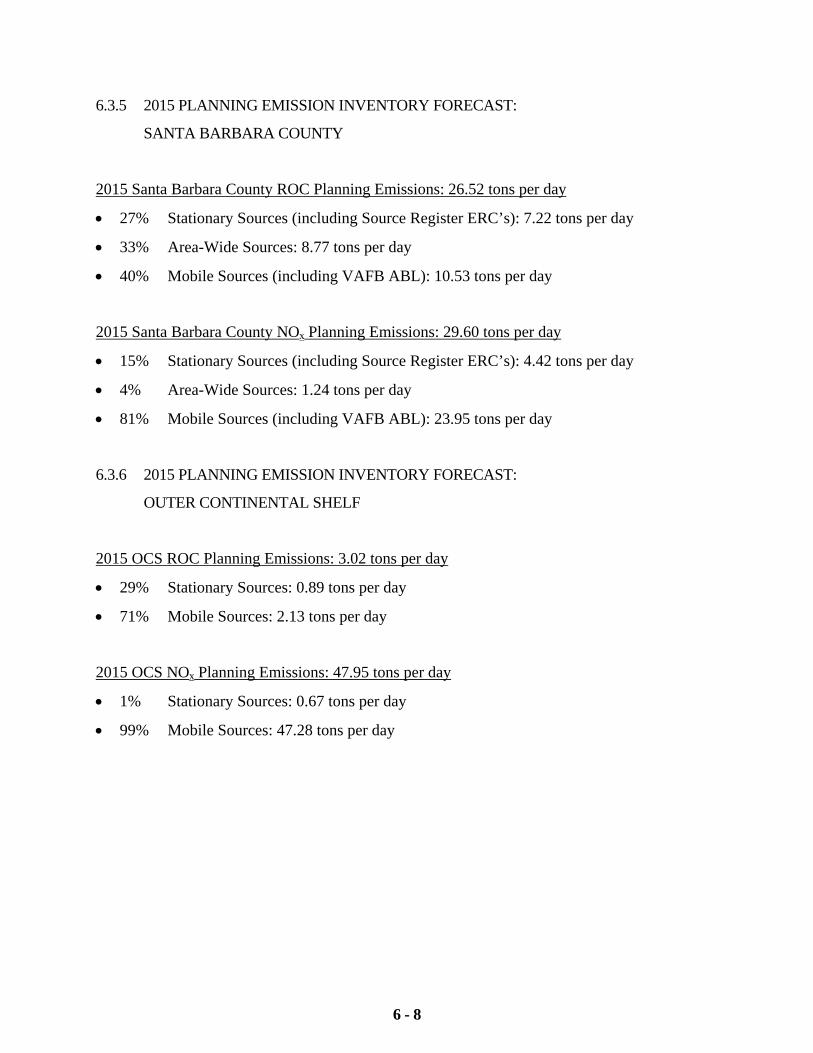
6.3.5 2015 PLANNING EMISSION INVENTORY FORECAST:
SANTA BARBARA COUNTY
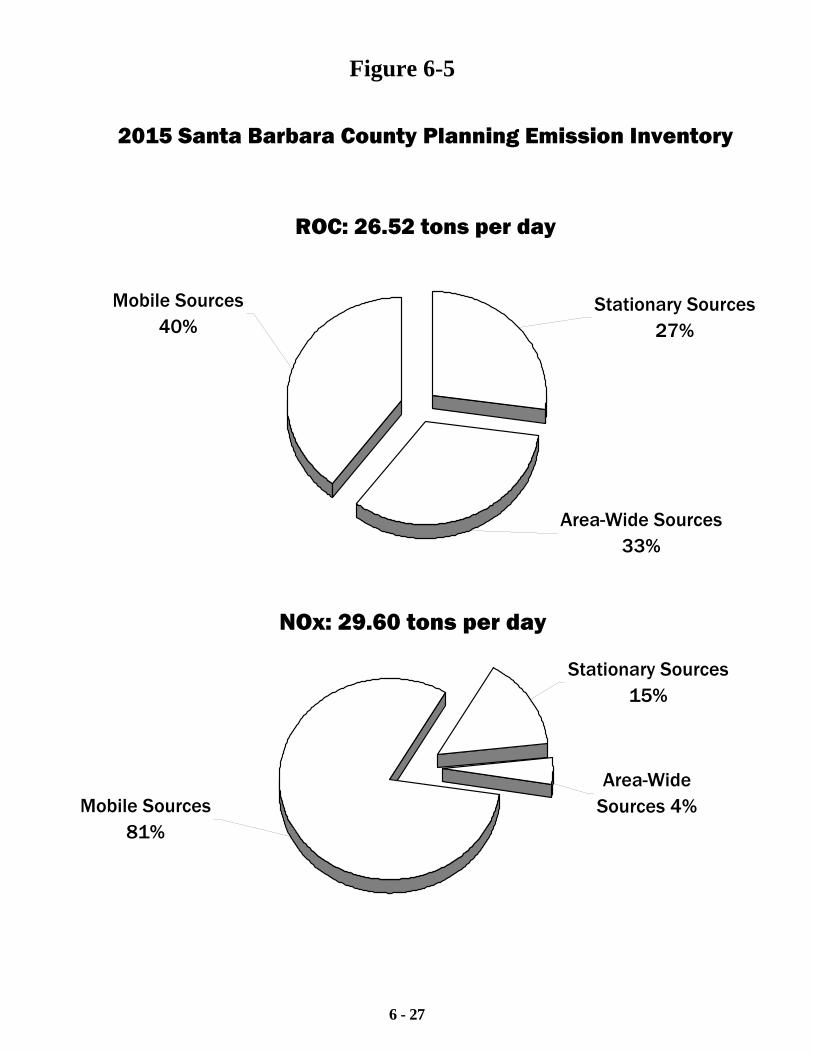
2015 Santa Barbara County ROC Planning Emissions: 26.52 tons per day
• 27% Stationary Sources (including Source Register ERC’s): 7.22 tons per day
• 33% Area-Wide Sources: 8.77 tons per day
• 40% Mobile Sources (including VAFB ABL): 10.53 tons per day
2015 Santa Barbara County NOx Planning Emissions: 29.60 tons per day
• 15% Stationary Sources (including Source Register ERC’s): 4.42 tons per day
• 4% Area-Wide Sources: 1.24 tons per day
• 81% Mobile Sources (including VAFB ABL): 23.95 tons per day
6.3.6 2015 PLANNING EMISSION INVENTORY FORECAST:
OUTER CONTINENTAL SHELF
2015 OCS ROC Planning Emissions: 3.02 tons per day
• 29% Stationary Sources: 0.89 tons per day
• 71% Mobile Sources: 2.13 tons per day
2015 OCS NOx Planning Emissions: 47.95 tons per day
• 1% Stationary Sources: 0.67 tons per day
• 99% Mobile Sources: 47.28 tons per day

6 - 9
6.4 CONCLUSIONS
This chapter presented the 2005, 2010, and 2015 Planning Emission Inventory Forecasts. The 1999
Planning Emission Inventory is used as the basis to calculate the 2005, 2010, and 2015 forecasts.
The following tables and figures display the detailed emissions in Santa Barbara County and the
Outer Continental Shelf for the years 2005, 2010, and 2015. Tables 6-1, 6-3, and 6-5 show the Santa
Barbara County emission inventories for the years 2005, 2010, and 2015, respectively. Mobile
Sources, primarily On-Road Motor Vehicles (Light-Duty Passenger and Light-Duty Trucks)
produce the majority of ROC and NOx, for each of these years, although the trend shows a large
decline in these emissions from 1999 to 2015. Tables 6-2, 6-4, and 6-6 show the same data for the
Outer Continental Shelf, offshore of the county. The majority of the ROC emissions are Stationary
Sources, primarily Oil and Gas Production, with the bulk of NOx emissions from Other Mobile
Sources, specifically Ships and Commercial Boats. The emission trend for the Outer Continental
Shelf shows a gradual decline in ROC emissions. However, NOx emissions on the OCS increase
during the forecast period due to increased shipping activity.
Figures 6-1, 6-3, and 6-5 graphically illustrate the relative contributions of the major emission
categories to the emissions of ROC and NOx in the county in 2005, 2010, and 2015, respectively.
Figures 6-2, 6-4, and 6-6 illustrate the same data for the Outer Continental Shelf offshore of the
county. The implications of these forecasts on our ability to maintain the federal 1-hour ozone
standard are discussed in Chapter 7, Redesignation Request and Maintenance Plan. Please refer to
Appendix A for additional forecast emission inventory information and documentation.

TABLE 6 – 1 2005 Planning Emission Inventory - Santa Barbara County
(Tons per day) ROC NOx
6 - 10
STATIONARY SOURCES FUEL COMBUSTION
010 ELECTRIC UTILITIES 0.0018 0.0826020 COGENERATION 0.0239 0.0754030 OIL AND GAS PRODUCTION (COMBUSTION) 0.6285 0.7085040 PETROLEUM REFINING (COMBUSTION) 0.0013 0.0225050 MANUFACTURING AND INDUSTRIAL 0.0377 0.5323052 FOOD AND AGRICULTURAL PROCESSING 0.1375 1.8586060 SERVICE AND COMMERCIAL 0.1498 0.3913099 OTHER (FUEL COMBUSTION) 0.0000 0.0000
FUEL COMBUSTION TOTAL 0.9805 3.6712 WASTE DISPOSAL
110 SEWAGE TREATMENT 0.0002 0.0086120 LANDFILLS 0.3670 0.0269130 INCINERATORS 0.0017 0.0133140 SOIL REMEDIATION 0.0000 0.0000199 OTHER (WASTE DISPOSAL) 0.0000 0.0000
WASTE DISPOSAL TOTAL 0.3689 0.0488 CLEANING AND SURFACE COATINGS
210 LAUNDERING 0.0598 0.0000220 DEGREASING 1.6307 0.0000230 COATINGS AND RELATED PROCESS SOLVENTS 1.7019 0.0000240 PRINTING 0.4837 0.0000250 ADHESIVES AND SEALANTS 0.8007 0.0000299 OTHER (CLEANING AND SURFACE COATINGS) 0.1057 0.0000
CLEANING AND SURFACE COATINGS TOTAL 4.7825 0.0000 PETROLEUM PRODUCTION AND MARKETING
310 OIL AND GAS PRODUCTION 0.9613 0.0767320 PETROLEUM REFINING 0.0094 0.0000330 PETROLEUM MARKETING 0.2863 0.0000
PETROLEUM PRODUCTION AND MARKETING TOTAL 1.2570 0.0767
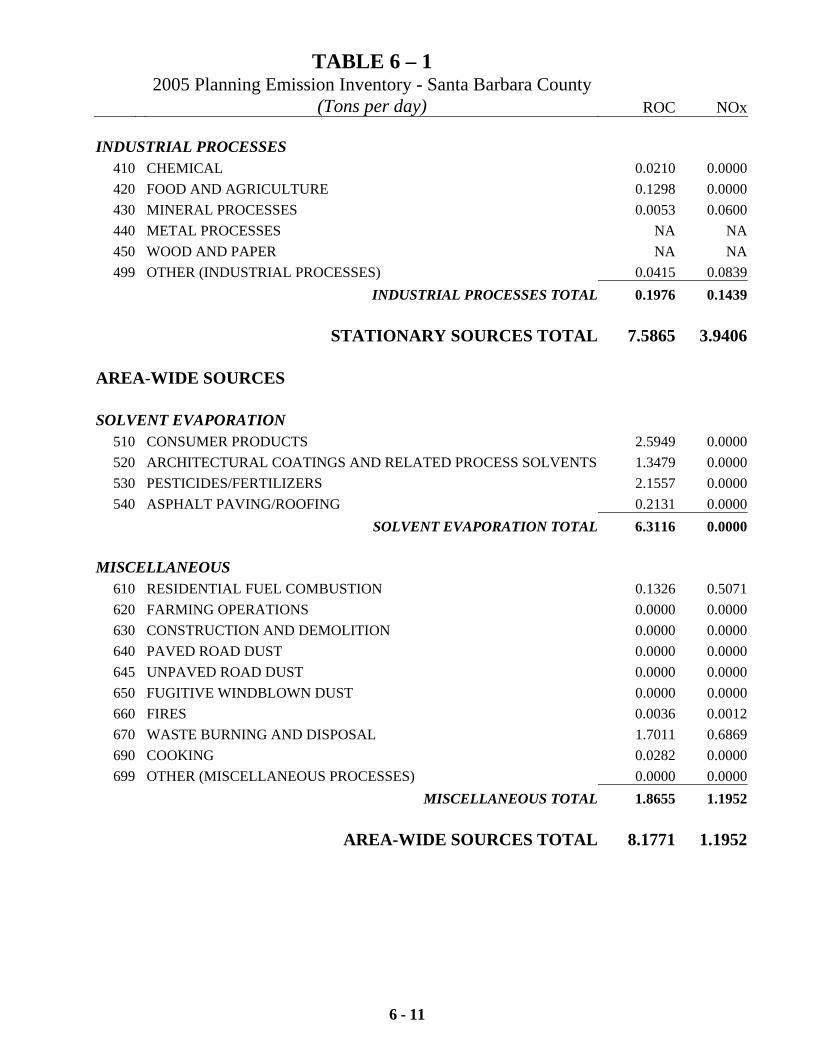
TABLE 6 – 1 2005 Planning Emission Inventory - Santa Barbara County
(Tons per day) ROC NOx
6 - 11
INDUSTRIAL PROCESSES 410 CHEMICAL 0.0210 0.0000420 FOOD AND AGRICULTURE 0.1298 0.0000430 MINERAL PROCESSES 0.0053 0.0600440 METAL PROCESSES NA NA450 WOOD AND PAPER NA NA499 OTHER (INDUSTRIAL PROCESSES) 0.0415 0.0839
INDUSTRIAL PROCESSES TOTAL 0.1976 0.1439 STATIONARY SOURCES TOTAL 7.5865 3.9406 AREA-WIDE SOURCES SOLVENT EVAPORATION
510 CONSUMER PRODUCTS 2.5949 0.0000520 ARCHITECTURAL COATINGS AND RELATED PROCESS SOLVENTS 1.3479 0.0000530 PESTICIDES/FERTILIZERS 2.1557 0.0000540 ASPHALT PAVING/ROOFING 0.2131 0.0000
SOLVENT EVAPORATION TOTAL 6.3116 0.0000 MISCELLANEOUS
610 RESIDENTIAL FUEL COMBUSTION 0.1326 0.5071620 FARMING OPERATIONS 0.0000 0.0000630 CONSTRUCTION AND DEMOLITION 0.0000 0.0000640 PAVED ROAD DUST 0.0000 0.0000645 UNPAVED ROAD DUST 0.0000 0.0000650 FUGITIVE WINDBLOWN DUST 0.0000 0.0000660 FIRES 0.0036 0.0012670 WASTE BURNING AND DISPOSAL 1.7011 0.6869690 COOKING 0.0282 0.0000699 OTHER (MISCELLANEOUS PROCESSES) 0.0000 0.0000
MISCELLANEOUS TOTAL 1.8655 1.1952 AREA-WIDE SOURCES TOTAL 8.1771 1.1952

TABLE 6 – 1 2005 Planning Emission Inventory - Santa Barbara County
(Tons per day) ROC NOx
6 - 12
MOBILE SOURCES ON-ROAD MOTOR VEHICLES
710 LIGHT DUTY PASSENGER (LDA) 5.00 4.30722 LIGHT DUTY TRUCKS - 1 (LDT1) 2.21 2.25723 LIGHT DUTY TRUCKS - 2 (LDT2) 1.75 2.46724 MEDIUM DUTY TRUCKS (MDV) 0.98 1.48732 LIGHT HEAVY DUTY GAS TRUCKS - 1 (LHDV1) 0.25 0.27733 LIGHT HEAVY DUTY GAS TRUCKS - 2 (LHDV2) 0.11 0.11734 MEDIUM HEAVY DUTY GAS TRUCKS (MHDV) 0.37 0.29736 HEAVY HEAVY DUTY GAS TRUCKS (HHDV) 0.39 0.92742 LIGHT HEAVY DUTY DIESEL TRUCKS - 1 (LHDV1) 0.02 0.30743 LIGHT HEAVY DUTY DIESEL TRUCKS - 2 (LHDV1) 0.02 0.22744 MEDIUM HEAVY DUTY DIESEL TRUCKS (MHDV) 0.05 1.52746 HEAVY HEAVY DUTY DIESEL TRUCKS (HHDV) 0.20 4.29750 MOTORCYCLES (MCY) 0.30 0.08760 HEAVY DUTY DIESEL URBAN BUSES (UB) 0.02 0.49762 HEAVY DUTY GAS URBAN BUSES (UB) 0.11 0.12770 SCHOOL BUSES (SB) 0.02 0.23780 MOTOR HOMES (MH) 0.11 0.25
ON-ROAD MOTOR VEHICLES TOTAL 11.91 19.59 OTHER MOBILE SOURCES
810 AIRCRAFT 0.6037 0.2571820 TRAINS 0.0984 2.1345830 SHIPS AND COMMERCIAL BOATS 0.1206 0.7253840 RECREATIONAL BOATS 0.5696 0.1012850 OFF-ROAD RECREATIONAL VEHICLES 0.3956 0.0270860 OFF-ROAD EQUIPMENT 1.6907 5.4493870 FARM EQUIPMENT 1.0928 7.0997890 FUEL STORAGE AND HANDLING 0.3596 0.0000
OTHER MOBILE SOURCES TOTAL 4.9310 15.7941 MOBILE SOURCES TOTAL 16.8410 35.3841 Vandenberg Air Force Base Airborne Laser (ABL) Mission 0.0552 0.0000 Source Register Emission Reduction Credits 0.1735 0.4399 SANTA BARBARA COUNTY EMISSION INVENTORY TOTAL 32.8333 40.9598

TABLE 6 – 2 2005 Planning Emission Inventory – Outer Continental Shelf
(Tons per day) ROC NOx
6 - 13
STATIONARY SOURCES
FUEL COMBUSTION 030 OIL AND GAS PRODUCTION (COMBUSTION) 0.1338 0.6334
FUEL COMBUSTION TOTAL 0.1338 0.6334
CLEANING AND SURFACE COATINGS 230 COATINGS AND RELATED PROCESS SOLVENTS 0.0508 0.0000
CLEANING AND SURFACE COATINGS TOTAL 0.0508 0.0000
PETROLEUM PRODUCTION AND MARKETING 310 OIL AND GAS PRODUCTION 0.7048 0.0313
PETROLEUM PRODUCTION AND MARKETING TOTAL 0.7048 0.0313
INDUSTRIAL PROCESSES 430 MINERAL PROCESSES 0.0000 0.0000
INDUSTRIAL PROCESSES TOTAL 0.0000 0.0000
STATIONARY SOURCES TOTAL 0.8894 0.6647
MOBILE SOURCES
OTHER MOBILE SOURCES 810 AIRCRAFT 0.0119 0.0096830 SHIPS AND COMMERCIAL BOATS 1.2643 33.4982840 RECREATIONAL BOATS 0.5252 0.1012
OTHER MOBILE SOURCES TOTAL 1.8014 33.6090
MOBILE SOURCES TOTAL 1.8014 33.6090
OUTER CONTINENTAL SHELF EMISSION INVENTORY TOTAL 2.6908 34.2737

TABLE 6 – 3 2010 Planning Emission Inventory - Santa Barbara County
(Tons per day) ROC NOx
6 - 14
STATIONARY SOURCES FUEL COMBUSTION
010 ELECTRIC UTILITIES 0.0018 0.0826020 COGENERATION 0.0154 0.0494030 OIL AND GAS PRODUCTION (COMBUSTION) 0.4036 0.4605040 PETROLEUM REFINING (COMBUSTION) 0.0008 0.0150050 MANUFACTURING AND INDUSTRIAL 0.0424 0.6055052 FOOD AND AGRICULTURAL PROCESSING 0.1487 2.0095060 SERVICE AND COMMERCIAL 0.1494 0.4145099 OTHER (FUEL COMBUSTION) 0.0000 0.0000
FUEL COMBUSTION TOTAL 0.7621 3.6370 WASTE DISPOSAL
110 SEWAGE TREATMENT 0.0002 0.0089120 LANDFILLS 0.4132 0.0303130 INCINERATORS 0.0018 0.0137140 SOIL REMEDIATION 0.0000 0.0000199 OTHER (WASTE DISPOSAL) 0.0000 0.0000
WASTE DISPOSAL TOTAL 0.4152 0.0529 CLEANING AND SURFACE COATINGS
210 LAUNDERING 0.0634 0.0000220 DEGREASING 0.7703 0.0000230 COATINGS AND RELATED PROCESS SOLVENTS 1.9042 0.0000240 PRINTING 0.5133 0.0000250 ADHESIVES AND SEALANTS 0.9019 0.0000299 OTHER (CLEANING AND SURFACE COATINGS) 0.1190 0.0000
CLEANING AND SURFACE COATINGS TOTAL 4.2721 0.0000 PETROLEUM PRODUCTION AND MARKETING
310 OIL AND GAS PRODUCTION 0.8277 0.0661320 PETROLEUM REFINING 0.0060 0.0000330 PETROLEUM MARKETING 0.2981 0.0000
PETROLEUM PRODUCTION AND MARKETING TOTAL 1.1318 0.0661

TABLE 6 – 3 2010 Planning Emission Inventory - Santa Barbara County
(Tons per day) ROC NOx
6 - 15
INDUSTRIAL PROCESSES 410 CHEMICAL 0.0237 0.0000420 FOOD AND AGRICULTURE 0.1385 0.0000430 MINERAL PROCESSES 0.0060 0.0676440 METAL PROCESSES NA NA450 WOOD AND PAPER NA NA499 OTHER (INDUSTRIAL PROCESSES) 0.1004 0.2036
INDUSTRIAL PROCESSES TOTAL 0.2686 0.2712
STATIONARY SOURCES TOTAL 6.8498 4.0272
AREA-WIDE SOURCES SOLVENT EVAPORATION
510 CONSUMER PRODUCTS 2.7307 0.0000520 ARCHITECTURAL COATINGS AND RELATED PROCESS SOLVENTS 1.4167 0.0000530 PESTICIDES/FERTILIZERS 2.1472 0.0000540 ASPHALT PAVING/ROOFING 0.2401 0.0000
SOLVENT EVAPORATION TOTAL 6.5347 0.0000 MISCELLANEOUS
610 RESIDENTIAL FUEL COMBUSTION 0.1394 0.5291620 FARMING OPERATIONS 0.0000 0.0000630 CONSTRUCTION AND DEMOLITION 0.0000 0.0000640 PAVED ROAD DUST 0.0000 0.0000645 UNPAVED ROAD DUST 0.0000 0.0000650 FUGITIVE WINDBLOWN DUST 0.0000 0.0000660 FIRES 0.0038 0.0013670 WASTE BURNING AND DISPOSAL 1.7029 0.6869690 COOKING 0.0301 0.0000699 OTHER (MISCELLANEOUS PROCESSES) 0.0000 0.0000
MISCELLANEOUS TOTAL 1.8762 1.2173
AREA-WIDE SOURCES TOTAL 8.4109 1.2173

TABLE 6 – 3 2010 Planning Emission Inventory - Santa Barbara County
(Tons per day) ROC NOx
6 - 16
MOBILE SOURCES ON-ROAD MOTOR VEHICLES
710 LIGHT DUTY PASSENGER (LDA) 3.00 2.67722 LIGHT DUTY TRUCKS - 1 (LDT1) 1.59 1.55723 LIGHT DUTY TRUCKS - 2 (LDT2) 1.41 1.91724 MEDIUM DUTY TRUCKS (MDV) 0.80 1.17732 LIGHT HEAVY DUTY GAS TRUCKS - 1 (LHDV1) 0.16 0.29733 LIGHT HEAVY DUTY GAS TRUCKS - 2 (LHDV2) 0.09 0.10734 MEDIUM HEAVY DUTY GAS TRUCKS (MHDV) 0.26 0.22736 HEAVY HEAVY DUTY GAS TRUCKS (HHDV) 0.29 0.56742 LIGHT HEAVY DUTY DIESEL TRUCKS - 1 (LHDV1) 0.02 0.22743 LIGHT HEAVY DUTY DIESEL TRUCKS - 2 (LHDV1) 0.02 0.17744 MEDIUM HEAVY DUTY DIESEL TRUCKS (MHDV) 0.04 1.18746 HEAVY HEAVY DUTY DIESEL TRUCKS (HHDV) 0.17 3.31750 MOTORCYCLES (MCY) 0.27 0.09760 HEAVY DUTY DIESEL URBAN BUSES (UB) 0.02 0.48762 HEAVY DUTY GAS URBAN BUSES (UB) 0.11 0.12770 SCHOOL BUSES (SB) 0.02 0.23780 MOTOR HOMES (MH) 0.06 0.18
ON-ROAD MOTOR VEHICLES TOTAL 8.32 14.44 OTHER MOBILE SOURCES
810 AIRCRAFT 0.6488 0.2658820 TRAINS 0.1230 2.1788830 SHIPS AND COMMERCIAL BOATS 0.1278 0.7627840 RECREATIONAL BOATS 0.4175 0.1089850 OFF-ROAD RECREATIONAL VEHICLES 0.4234 0.0286860 OFF-ROAD EQUIPMENT 1.3806 4.1813870 FARM EQUIPMENT 1.0179 6.7278890 FUEL STORAGE AND HANDLING 0.3008 0.0000
OTHER MOBILE SOURCES TOTAL 4.4398 14.2539 MOBILE SOURCES TOTAL 12.7598 28.6939 Vandenberg Air Force Base Airborne Laser (ABL) Mission 0.0656 0.3602 Source Register Emission Reduction Credits 0.1735 0.4399
SANTA BARBARA COUNTY EMISSION INVENTORY TOTAL 28.2596 34.7385

TABLE 6 – 4 2010 Planning Emission Inventory – Outer Continental Shelf
(Tons per day)
ROC NOx
6 - 17
STATIONARY SOURCES
FUEL COMBUSTION 030 OIL AND GAS PRODUCTION (COMBUSTION) 0.1338 0.6357
FUEL COMBUSTION TOTAL 0.1338 0.6357
CLEANING AND SURFACE COATINGS 230 COATINGS AND RELATED PROCESS SOLVENTS 0.0508 0.0000
CLEANING AND SURFACE COATINGS TOTAL 0.0508 0.0000
PETROLEUM PRODUCTION AND MARKETING 310 OIL AND GAS PRODUCTION 0.7048 0.0313
PETROLEUM PRODUCTION AND MARKETING TOTAL 0.7048 0.0313
INDUSTRIAL PROCESSES 430 MINERAL PROCESSES 0.0000 0.0000
INDUSTRIAL PROCESSES TOTAL 0.0000 0.0000
STATIONARY SOURCES TOTAL 0.8894 0.6670
MOBILE SOURCES
OTHER MOBILE SOURCES 810 AIRCRAFT 0.0119 0.0096830 SHIPS AND COMMERCIAL BOATS 1.4410 38.5258840 RECREATIONAL BOATS 0.3694 0.1089
OTHER MOBILE SOURCES TOTAL 1.8223 38.6443
MOBILE SOURCES TOTAL 1.8223 38.6443
OUTER CONTINENTAL SHELF EMISSION INVENTORY TOTAL 2.7117 39.3113
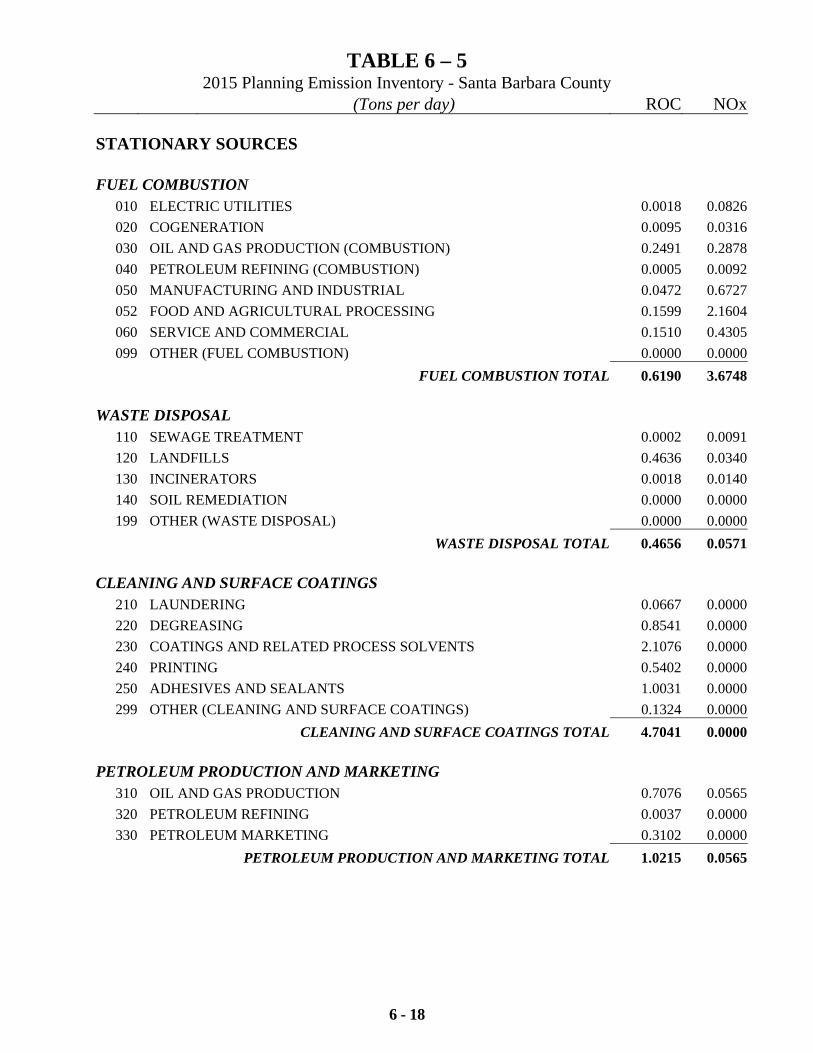
TABLE 6 – 5 2015 Planning Emission Inventory - Santa Barbara County
(Tons per day) ROC NOx
6 - 18
STATIONARY SOURCES FUEL COMBUSTION
010 ELECTRIC UTILITIES 0.0018 0.0826020 COGENERATION 0.0095 0.0316030 OIL AND GAS PRODUCTION (COMBUSTION) 0.2491 0.2878040 PETROLEUM REFINING (COMBUSTION) 0.0005 0.0092050 MANUFACTURING AND INDUSTRIAL 0.0472 0.6727052 FOOD AND AGRICULTURAL PROCESSING 0.1599 2.1604060 SERVICE AND COMMERCIAL 0.1510 0.4305099 OTHER (FUEL COMBUSTION) 0.0000 0.0000
FUEL COMBUSTION TOTAL 0.6190 3.6748 WASTE DISPOSAL
110 SEWAGE TREATMENT 0.0002 0.0091120 LANDFILLS 0.4636 0.0340130 INCINERATORS 0.0018 0.0140140 SOIL REMEDIATION 0.0000 0.0000199 OTHER (WASTE DISPOSAL) 0.0000 0.0000
WASTE DISPOSAL TOTAL 0.4656 0.0571 CLEANING AND SURFACE COATINGS
210 LAUNDERING 0.0667 0.0000220 DEGREASING 0.8541 0.0000230 COATINGS AND RELATED PROCESS SOLVENTS 2.1076 0.0000240 PRINTING 0.5402 0.0000250 ADHESIVES AND SEALANTS 1.0031 0.0000299 OTHER (CLEANING AND SURFACE COATINGS) 0.1324 0.0000
CLEANING AND SURFACE COATINGS TOTAL 4.7041 0.0000 PETROLEUM PRODUCTION AND MARKETING
310 OIL AND GAS PRODUCTION 0.7076 0.0565320 PETROLEUM REFINING 0.0037 0.0000330 PETROLEUM MARKETING 0.3102 0.0000
PETROLEUM PRODUCTION AND MARKETING TOTAL 1.0215 0.0565

TABLE 6 – 5 2015 Planning Emission Inventory - Santa Barbara County
(Tons per day) ROC NOx
6 - 19
INDUSTRIAL PROCESSES 410 CHEMICAL 0.0263 0.0000420 FOOD AND AGRICULTURE 0.1473 0.0000430 MINERAL PROCESSES 0.0067 0.0751440 METAL PROCESSES NA NA450 WOOD AND PAPER NA NA499 OTHER (INDUSTRIAL PROCESSES) 0.0580 0.1173
INDUSTRIAL PROCESSES TOTAL 0.2383 0.1924
STATIONARY SOURCES TOTAL 7.0485 3.9808
AREA-WIDE SOURCES SOLVENT EVAPORATION
510 CONSUMER PRODUCTS 2.8486 0.0000520 ARCHITECTURAL COATINGS AND RELATED PROCESS SOLVENTS 1.4749 0.0000530 PESTICIDES/FERTILIZERS 2.2955 0.0000540 ASPHALT PAVING/ROOFING 0.2670 0.0000
SOLVENT EVAPORATION TOTAL 6.8860 0.0000 MISCELLANEOUS
610 RESIDENTIAL FUEL COMBUSTION 0.1451 0.5469620 FARMING OPERATIONS 0.0000 0.0000630 CONSTRUCTION AND DEMOLITION 0.0000 0.0000640 PAVED ROAD DUST 0.0000 0.0000645 UNPAVED ROAD DUST 0.0000 0.0000650 FUGITIVE WINDBLOWN DUST 0.0000 0.0000660 FIRES 0.0039 0.0013670 WASTE BURNING AND DISPOSAL 1.7048 0.6869690 COOKING 0.0320 0.0000699 OTHER (MISCELLANEOUS PROCESSES) 0.0000 0.0000
MISCELLANEOUS TOTAL 1.8858 1.2351
AREA-WIDE SOURCES TOTAL 8.7718 1.2351
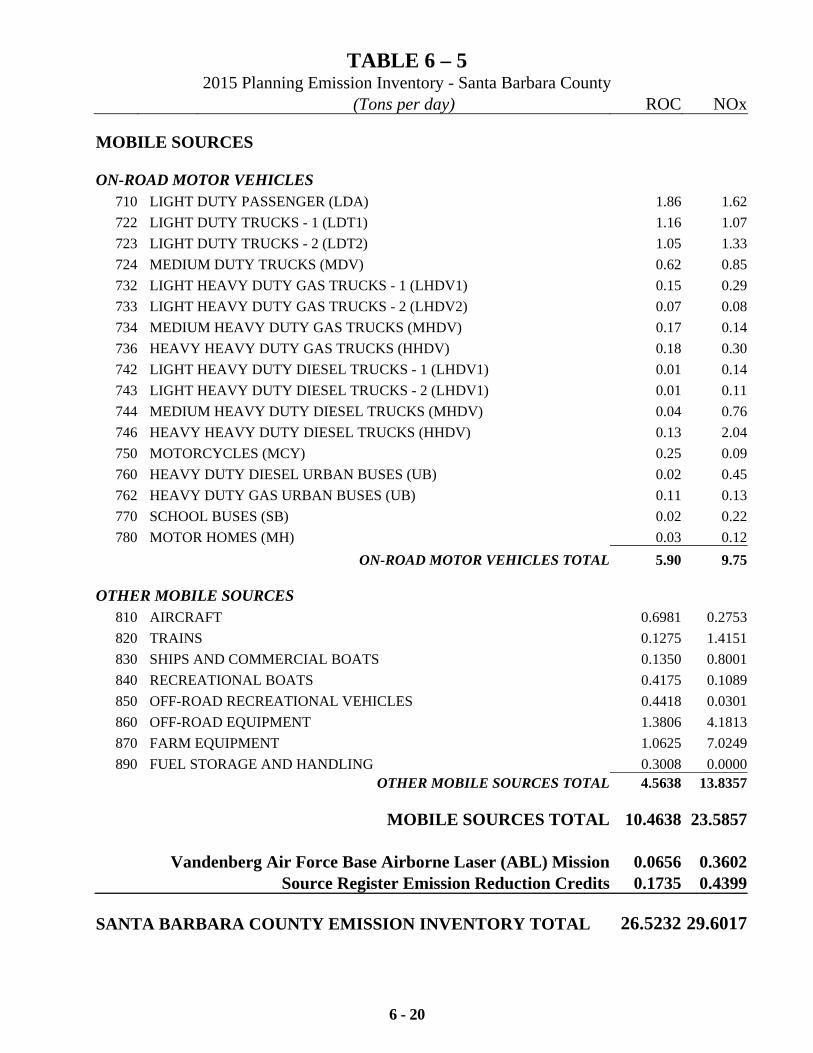
TABLE 6 – 5 2015 Planning Emission Inventory - Santa Barbara County
(Tons per day) ROC NOx
6 - 20
MOBILE SOURCES ON-ROAD MOTOR VEHICLES
710 LIGHT DUTY PASSENGER (LDA) 1.86 1.62722 LIGHT DUTY TRUCKS - 1 (LDT1) 1.16 1.07723 LIGHT DUTY TRUCKS - 2 (LDT2) 1.05 1.33724 MEDIUM DUTY TRUCKS (MDV) 0.62 0.85732 LIGHT HEAVY DUTY GAS TRUCKS - 1 (LHDV1) 0.15 0.29733 LIGHT HEAVY DUTY GAS TRUCKS - 2 (LHDV2) 0.07 0.08734 MEDIUM HEAVY DUTY GAS TRUCKS (MHDV) 0.17 0.14736 HEAVY HEAVY DUTY GAS TRUCKS (HHDV) 0.18 0.30742 LIGHT HEAVY DUTY DIESEL TRUCKS - 1 (LHDV1) 0.01 0.14743 LIGHT HEAVY DUTY DIESEL TRUCKS - 2 (LHDV1) 0.01 0.11744 MEDIUM HEAVY DUTY DIESEL TRUCKS (MHDV) 0.04 0.76746 HEAVY HEAVY DUTY DIESEL TRUCKS (HHDV) 0.13 2.04750 MOTORCYCLES (MCY) 0.25 0.09760 HEAVY DUTY DIESEL URBAN BUSES (UB) 0.02 0.45762 HEAVY DUTY GAS URBAN BUSES (UB) 0.11 0.13770 SCHOOL BUSES (SB) 0.02 0.22780 MOTOR HOMES (MH) 0.03 0.12
ON-ROAD MOTOR VEHICLES TOTAL 5.90 9.75 OTHER MOBILE SOURCES
810 AIRCRAFT 0.6981 0.2753820 TRAINS 0.1275 1.4151830 SHIPS AND COMMERCIAL BOATS 0.1350 0.8001840 RECREATIONAL BOATS 0.4175 0.1089850 OFF-ROAD RECREATIONAL VEHICLES 0.4418 0.0301860 OFF-ROAD EQUIPMENT 1.3806 4.1813870 FARM EQUIPMENT 1.0625 7.0249890 FUEL STORAGE AND HANDLING 0.3008 0.0000
OTHER MOBILE SOURCES TOTAL 4.5638 13.8357 MOBILE SOURCES TOTAL 10.4638 23.5857 Vandenberg Air Force Base Airborne Laser (ABL) Mission 0.0656 0.3602 Source Register Emission Reduction Credits 0.1735 0.4399
SANTA BARBARA COUNTY EMISSION INVENTORY TOTAL 26.5232 29.6017

TABLE 6 – 6 2015 Planning Emission Inventory – Outer Continental Shelf
(Tons per day)
ROC NOx
6 - 21
STATIONARY SOURCES
FUEL COMBUSTION 030 OIL AND GAS PRODUCTION (COMBUSTION) 0.1338 0.6357
FUEL COMBUSTION TOTAL 0.1338 0.6357
CLEANING AND SURFACE COATINGS 230 COATINGS AND RELATED PROCESS SOLVENTS 0.0508 0.0000
CLEANING AND SURFACE COATINGS TOTAL 0.0508 0.0000
PETROLEUM PRODUCTION AND MARKETING 310 OIL AND GAS PRODUCTION 0.7048 0.0313
PETROLEUM PRODUCTION AND MARKETING TOTAL 0.7048 0.0313
INDUSTRIAL PROCESSES 430 MINERAL PROCESSES 0.0000 0.0000
INDUSTRIAL PROCESSES TOTAL 0.0000 0.0000
STATIONARY SOURCES TOTAL 0.8894 0.6670
MOBILE SOURCES
OTHER MOBILE SOURCES 810 AIRCRAFT 0.0119 0.0096830 SHIPS AND COMMERCIAL BOATS 1.7446 47.1668840 RECREATIONAL BOATS 0.3694 0.1089
OTHER MOBILE SOURCES TOTAL 2.1259 47.2853
MOBILE SOURCES TOTAL 2.1259 47.2853
OUTER CONTINENTAL SHELF EMISSION INVENTORY TOTAL 3.01530 47.9523

6 - 22
TABLE 6 – 7 2001 CLEAN AIR PLAN ACTIVITY INDICATORS AND FACTORS FOR 2005, 2010 AND 2015
VALUE FACTOR ACTIVITY INDICATOR UNITS
1999 2005 2010 2015 2005 2010 2015
INFORMATION SOURCE
Agricultural Acres Acres 128,475 136,708 147,810 158,912 1.064 1.150 1.237 Agricultural Commissioner’s Crop Reports
Aircraft Operations Operations 303,267 358,900 387,300 418,300 1.183 1.277 1.379 Airport Master Plans / SBCAG (Santa Barbara County Association of Governments)
Daily Vehicle Miles 1,000 Miles Traveled 9,460 10,148 10,718 11,288 1.073 1.133 1.193 SBCAG
EMP. - Commercial Employees 88,586 96,200 102,700 109,200 1.086 1.159 1.233 SBCAG Draft 2001 Regional Growth Forecast
EMP. Industrial Employees 27,455 31,800 35,820 39,840 1.158 1.305 1.451 SBCAG Draft 2001 Regional Growth Forecast EMP. - Public Services Employees 38,209 40,800 42,000 43,200 1.068 1.099 1.131 SBCAG Draft 2001 Regional Growth Forecast
Housing Households 137,069 145,469 152,902 159,184 1.061 1.116 1.161 SBCAG Draft 2001 Regional Growth Forecast
Landfills 1,000 Tons in Place 16,124 18,638 20,983 23,545 1.156 1.301 1.460 Local Solid Waste Agencies
Locomotives Annual Train Passages 6,023 8,030 10,038 10,403 1.333 1.667 1.727 CalTrans / AMTRAK / Union Pacific No Growth No Units 1 1 1 1 1.000 1.000 1.000 Santa Barbara County Air Pollution Control District OCS Production No Units 1 1 1 1 1.000 1.000 1.000 SBCAPCD Community Advisory Council Pesticide Use Tons Pesticide Applied 3,011 2,948 2,937 3,139 0.979 0.975 1.043 CA Air Resources Board Petroleum Production 1,000 Barrels Oil 3,596 2,002 1,284 791 0.557 0.357 0.220 CA Division of Oil & Gas Petroleum Wells Producing & Inactive Wells 2,450 2,032 1,776 1,537 0.829 0.725 0.627 CA Division of Oil & Gas
Population Residents 396,331 432,900 459,400 483,500 1.092 1.159 1.220 SBCAG Draft 2001 Regional Growth Forecast
Prescribed Fires Acres 2,350 6,250 6,250 6,250 2.660 2.660 2.660 U.S. Forest Service
Ship Activity Vessel Transits 6,479 7,701 8,887 10,926 1.189 1.372 1.686 Marine Exchange of Port of Los Angeles / Long Beach

6 - 23
2005 Santa Barbara County Planning Emission Inventory
ROC: 32.83 tons per day
Stationary Sources 24%
Mobile Sources 51%
Area-Wide Sources 25%
NOx: 40.96 tons per day
Stationary Sources 11%
Area-Wide Sources 3%
Mobile Sources 86%
Figure 6-1

6 - 24
2005 OCS Planning Emission Inventory
ROC: 2.69 tons per day
Stationary Sources
33%
Mobile Sources 67%
NOx: 34.27 tons per day
Mobile Sources98%
Stationary Sources2%
Figure 6-2

6 - 25
2010 Santa Barbara County Planning Emission Inventory
ROC: 28.26 tons per day
Stationary Sources 25%
Mobile Sources 45%
Area-Wide Sources 30%
NOx: 34.74 tons per day
Stationary Sources 13%
Area-Wide Sources 3%Mobile Sources
84%
Figure 6-3
6 - 26
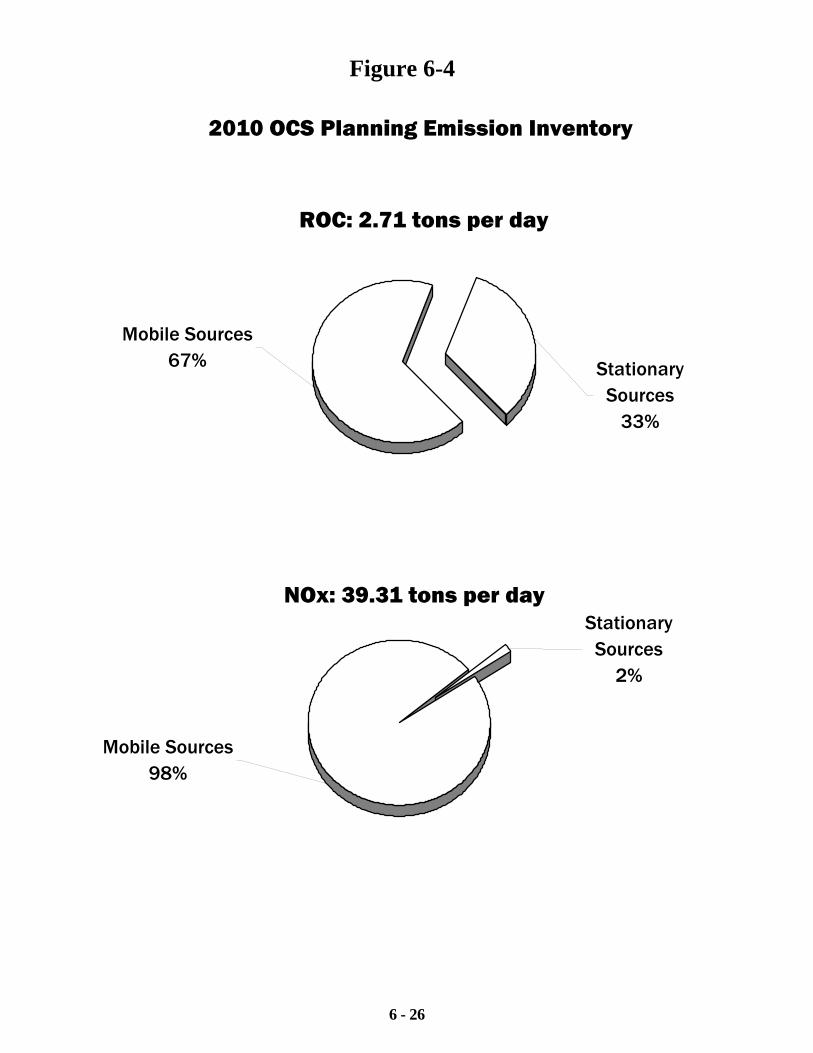
2010 OCS Planning Emission Inventory
ROC: 2.71 tons per day
Stationary Sources
33%
Mobile Sources 67%
NOx: 39.31 tons per day
Mobile Sources98%
Stationary Sources
2%
Figure 6-4
6 - 27
2015 Santa Barbara County Planning Emission Inventory
ROC: 26.52 tons per day
Stationary Sources 27%
Mobile Sources 40%
Area-Wide Sources 33%
NOx: 29.60 tons per day
Stationary Sources 15%
Area-Wide Sources 4%Mobile Sources
81%
Figure 6-5

6 - 28
2015 OCS Planning Emission Inventory
ROC: 3.02 tons per day
Stationary Sources
29%
Mobile Sources 71%
NOx: 47.95 tons per day
Mobile Sources99%
Stationary Sources1%
Figure 6-6