Chapter 6 Editing Pictures - LibreOffice · 4) Click Close to close the dialog when you have...
24
Draw Guide Chapter 6 Editing Pictures Raster Graphics
Transcript of Chapter 6 Editing Pictures - LibreOffice · 4) Click Close to close the dialog when you have...
Draw Guide
Chapter 6 Editing PicturesRaster Graphics
Copyright
This document is Copyright © 2011–2014 by the LibreOffice Documentation Team. Contributors are listed below. You may distribute or modify it under the terms of either the GNU General Public License (http://www.gnu.org/licenses/gpl.html), version 3 or later, or the Creative Commons Attribution License (http://creativecommons.org/licenses/by/4.0/), version 4.0 or later.
All trademarks within this guide belong to their legitimate owners.
ContributorsMartin Fox John Cleland Jean Hollis WeberJohn A Smith Peter Schofield
FeedbackPlease direct any comments or suggestions about this document to the Documentation Team’s mailing list: [email protected]
Note: Everything you send to a mailing list, including your email address and any other personal information that is written in the message, is publicly archived and cannot be deleted.
AcknowledgmentsThis chapter is based on an original French document written for OpenOffice.org 1.x by Michel Pinquier (translated into English by Alex Thurgood) and previous content revised by Jim Taylor. The chapter was revised for OpenOffice.org 2.0 by Linda Worthington, Daniel Carrera, Jean Hollis Weber, and Agnes Belzunce, and later translated into German by Wolfgang Uhlig. The German revisions were then translated into English and revised for OpenOffice.org 3.3 and LibreOffice 3.3 by Martin Fox. Other contributors included Peter Hillier-Brook, Hazel Russman, Gary Schnabl, and Claire Wood.
Publication date and software versionPublished 17 December 2014. Based on LibreOffice 4.3.
Note for Mac users
Some keystrokes and menu items are different on a Mac from those used in Windows and Linux. The table below gives some common substitutions for the instructions in this chapter. For a more detailed list, see the application Help.
Windows or Linux Mac equivalent Effect
Tools > Options menu selection
LibreOffice > Preferences Access setup options
Right-click Control+click or right-click depending on computer setup
Open a context menu
Ctrl (Control) ⌘ (Command) Used with other keys
F5 Shift+⌘+F5 Open the Navigator
F11 ⌘+T Open the Styles and Formatting window
Documentation for LibreOffice is available at http://www.libreoffice.org/get-help/documentation
Contents
Copyright.............................................................................................................................. 2Contributors................................................................................................................................. 2
Feedback..................................................................................................................................... 2
Acknowledgments........................................................................................................................ 2
Publication date and software version......................................................................................... 2
Note for Mac users...............................................................................................................2
Introduction.......................................................................................................................... 5
Importing graphics...............................................................................................................5Inserting....................................................................................................................................... 5
Embedding.................................................................................................................................. 6
Linking......................................................................................................................................... 6
Scanning...................................................................................................................................... 7
Copying and pasting.................................................................................................................... 7
Dragging and dropping................................................................................................................ 8
File inserting................................................................................................................................ 8
Exporting graphics.............................................................................................................. 9Exporting the entire file................................................................................................................ 9
Exporting objects....................................................................................................................... 10
Formatting raster objects..................................................................................................10
Picture toolbar....................................................................................................................10
Cropping............................................................................................................................. 12Crop........................................................................................................................................... 12
Scale.......................................................................................................................................... 13
Image size................................................................................................................................. 13
Graphic filter toolbar..........................................................................................................13Invert graphic filter..................................................................................................................... 13
Smooth graphic filter.................................................................................................................. 14
Sharpen graphic filter................................................................................................................. 15
Remove noise graphic filter....................................................................................................... 15
Solarization graphic filter............................................................................................................ 15
Aging graphic filter..................................................................................................................... 16
Posterize graphic filter............................................................................................................... 17
Pop art graphic filter................................................................................................................... 17
Charcoal sketch graphic filter..................................................................................................... 17
Relief graphic filter..................................................................................................................... 18
Mosaic graphic filter................................................................................................................... 18
Replacing colors................................................................................................................ 19Replacing colors........................................................................................................................ 19
Replacing transparent areas...................................................................................................... 20
Tolerance parameter.................................................................................................................. 20
Editing Pictures (Raster Graphics) 3
Conversion......................................................................................................................... 20Contour conversion.................................................................................................................... 20
Polygon Conversion................................................................................................................... 21Converting............................................................................................................................. 21Conversion options and controls........................................................................................... 21Breaking................................................................................................................................ 22Splitting................................................................................................................................. 22
Bitmap conversion..................................................................................................................... 22
Print options....................................................................................................................... 24
4 Editing Pictures (Raster Graphics)
Introduction
Earlier chapters of the Draw Guide have dealt only with vector graphics. However, Draw also contains a number of functions for handling raster graphics (bitmaps) such as photographs and scanned pictures, including import, export, and conversion from one format to another.
Draw can read all the majority of graphic file formats. It has a subset of capabilities similar to rastergraphics programs like Adobe Photoshop or Gimp.
Importing graphics
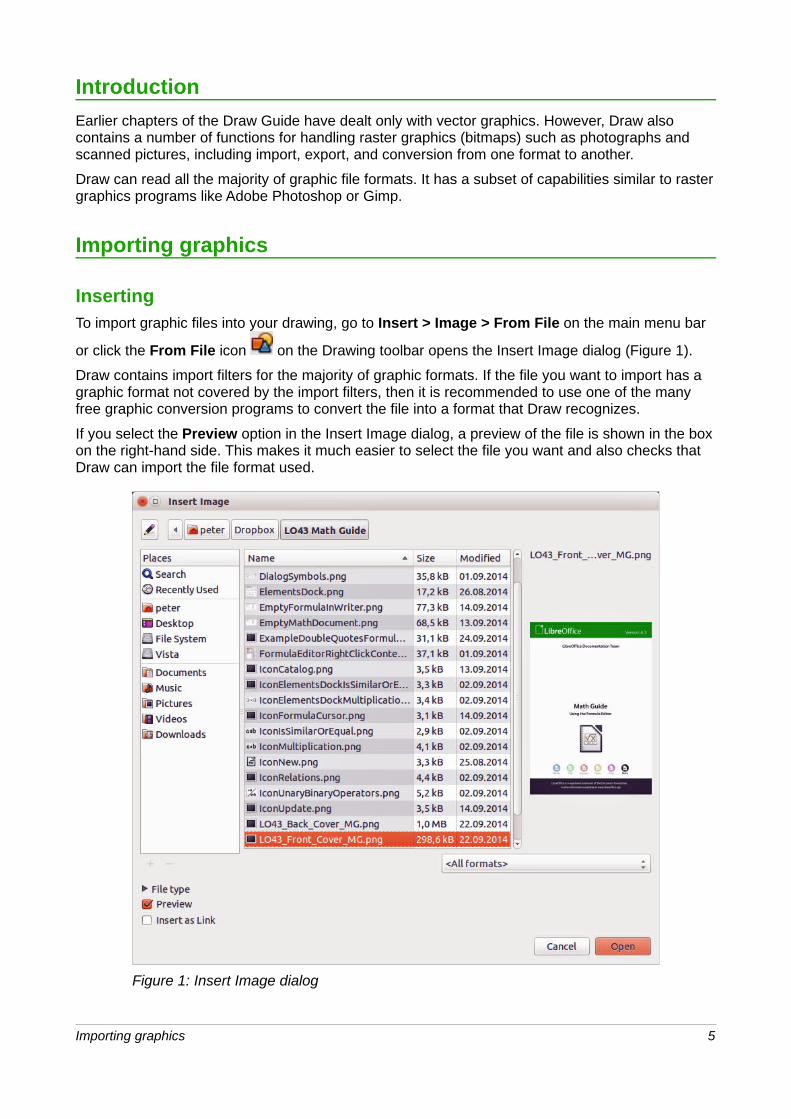
InsertingTo import graphic files into your drawing, go to Insert > Image > From File on the main menu bar
or click the From File icon on the Drawing toolbar opens the Insert Image dialog (Figure 1).
Draw contains import filters for the majority of graphic formats. If the file you want to import has a graphic format not covered by the import filters, then it is recommended to use one of the many free graphic conversion programs to convert the file into a format that Draw recognizes.
If you select the Preview option in the Insert Image dialog, a preview of the file is shown in the box on the right-hand side. This makes it much easier to select the file you want and also checks that Draw can import the file format used.
Figure 1: Insert Image dialog
Importing graphics 5
EmbeddingEmbedding a graphic into a drawing makes the graphic a permanent part of the drawing. Any changes you make to an embedded graphic will only appear in the drawing; the original graphic filewill not be affected.
Embedding happens when you import a graphic into a drawing using the Insert Image dialog, copying and pasting, scanning a graphic, or dragging and dropping.
The main advantage of embedding graphics into your drawing is that the graphic is always available no matter what computer is used to open the drawing.
The main disadvantage of embedding graphics is that it creates large file sizes, which may not be desirable if you have limited capacity for storing computer files. Also, if the original graphic is altered, then your drawing will not have an up to date version each time you open your document.
NoteWhen a graphic is embedded into a LibreOffice document or drawing, then the format of that graphic is automatically changed to PNG format. LibreOffice will only embed graphics into your document or drawing that can be converted into PNG format.
LinkingLinking a graphic to a drawing does not insert the graphic into the drawing, but a link is created to where the graphic file is located on your computer. Each time the drawing is opened, any linked graphics will be displayed in the drawing.
The main advantage of linking a graphic file to a drawing is if the original graphic file is altered or replaced by a new graphic with the same filename, then the next time you open the drawing, the latest version of the graphic will also open in the drawing.
The main disadvantage of linking graphics is that the link between the drawing and the graphic file must be maintained for linking to work correctly. If you move the drawing to another computer, thenany linked files must also be moved to the same computer and the same folder on that computer.
To link a graphic file to your drawing, select the Link option in the Insert Picture dialog (Figure 1) before selecting the file and clicking on the Open button.
NoteWhen a graphic file is linked to a LibreOffice document or drawing, the format of the linked graphic is not changed.
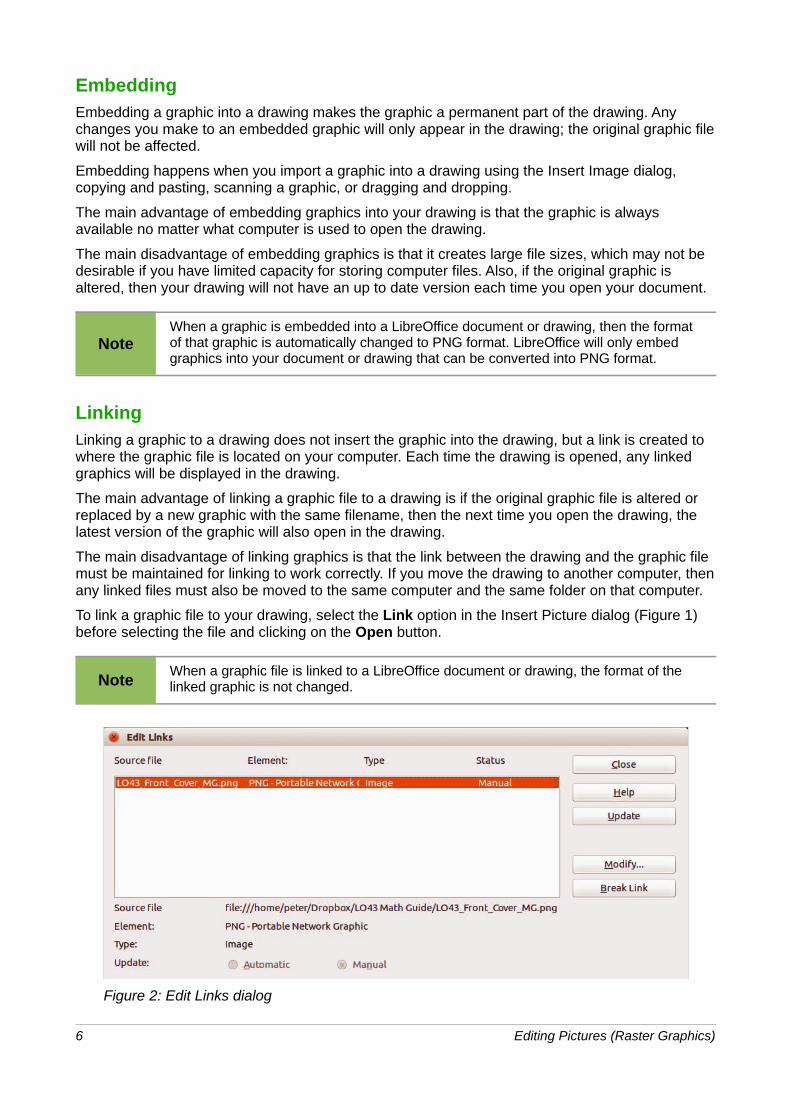
Figure 2: Edit Links dialog
6 Editing Pictures (Raster Graphics)
Any changes made to a linked graphic within a LibreOffice drawing will apply only to that copy of the graphic placed into your the drawing and will not affect the original graphic file that has been linked to your drawing.
Links can be updated, modified, or broken as follows:
1) Go to Edit > Links on the main menu bar to open the Edit Links dialog (Figure 2).
2) Select the link to be edited.
3) Click on Update, Modify or Break Link, as appropriate.
– Update – updates the selected link so that the most recently saved version of the linkedfile is displayed in the current document.
– Modify – changes the source file for the selected link.
– Break Link – breaks the link between the source file and the current document. The most recently updated contents of the source file are kept in the current document.
4) Click Close to close the dialog when you have finished editing the link.
NoteIf you click Break Link, then the linked graphic becomes embedded in your drawing and the graphic format is converted to PNG.
ScanningWith most scanners you can directly insert a scanned image into a drawing or document. Scanned images are embedded using PNG format. Make sure that your scanner is configured for the computer and supported by the SANE system for a Linux operating system, or TWAIN for a Windows or Mac operating system.
To insert an image from the scanner:
1) Place a document, drawing, or photograph in the scanner and make sure that the scanner is switched on and ready.
2) If this is the first time the scanner has been used, go to Insert > Image > Scan > Select Source on the main menu bar to select the scanner. If the scanner has been used before, go to Insert > Image > Scan > Request on the main menu bar.
Note
If there is more than one scanning device connected to the computer, you will be able to select the device when you select the source. This selection will then become the default source when using scan requests until another device is used as the scanning source.
3) The rest of the procedure depends on the scanner driver, interface, and computer operating system. You will normally be required to specify scanning options such as resolution, scan window, and so on. Consult the documentation that came with the scannerfor more information.
4) When the image has been scanned, Draw places it in the drawing. At this point it can be edited like any other graphic.
Copying and pastingCopying a graphic and then pasting the graphic into another drawing is another way of embedding graphics into a drawing (this is also called using the clipboard). The copied graphic can be an image already embedded in another document or drawing, or it can be a graphic file such as a drawing, document or photograph.
Importing graphics 7
After copying you can also choose the format when you paste a graphic into Draw using Edit > Paste Special on the main menu bar. Available formats will depend on the type of image copied onto the clipboard.
Dragging and droppingDragging and dropping is another method of embedding graphics into a drawing and can be used on graphics that have been embedded or linked. The way that dragging and dropping works is determined by the computer operating system. Behavior of dragging and dropping is normally controlled using the Ctrl or Ctrl+Shift keys in combination with the mouse.
Objects and images which are used frequently can be stored in the Draw Gallery. From the Gallery,a copy of the object or image can be simply dragged onto the drawing. Working with the Gallery is dealt with in Chapter 10 Advanced Draw Techniques.
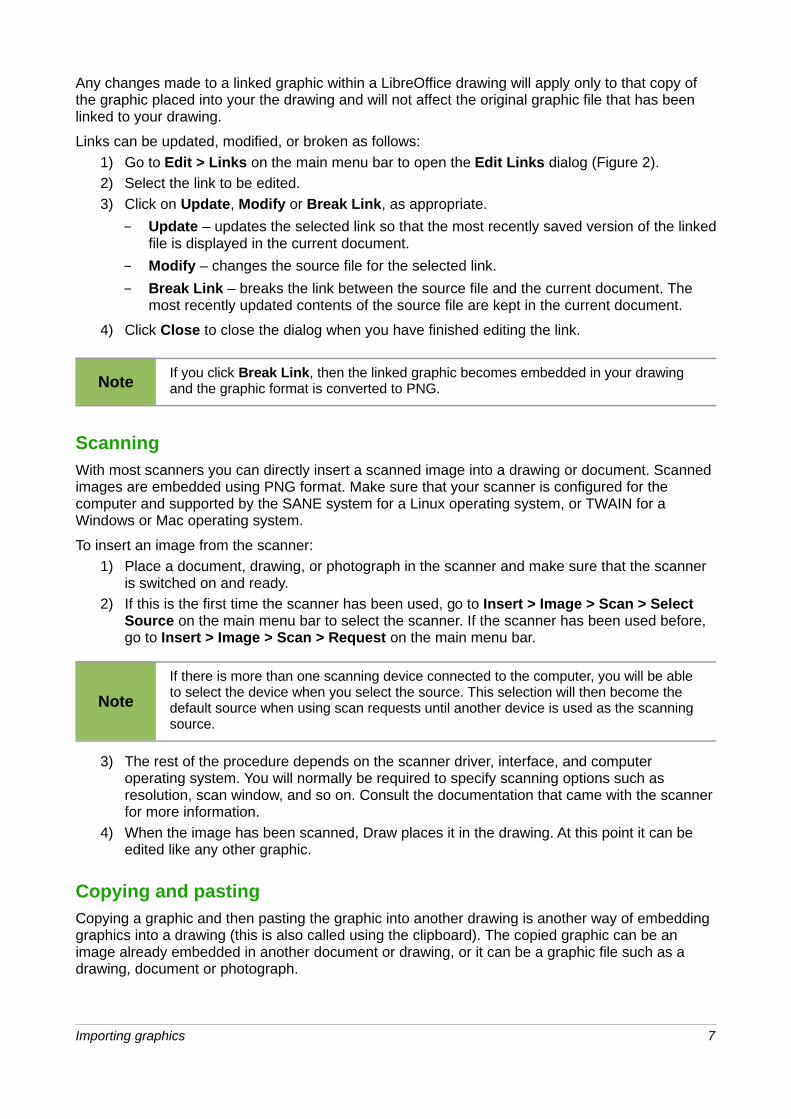
File insertingThe command Insert > File on the main menu bar allows you to insert from an existing Draw drawing (*.ODG), an Impress presentation (*.ODP), a Writer document (*.ODT), or a document in Rich Text Format (RTF), HTML format, or plain text. Any text file will be contained within a text frame with paragraph and character formatting options available.
When inserting a file, normally the complete file will be inserted into your drawing. However, when selecting a Draw or Impress file, you can also select individual slides or individual objects for insertion into your drawing.
After selecting a Draw or Impress file and clicking on Insert, the Insert Slides/Objects dialog (Figure 3) opens. To access individual slides or objects, click on the expansion symbol (usually a + or a small triangle, depending operating system) to the left of the file name in the selection area.
Figure 3: Insert Slides/Objects dialog
Select the slides or objects you want to insert and click OK to insert the selected items into your drawing.
If the inserted object was named in the source document, it keeps its original name unless the name already exists in the current document. If there is a name clash, you must give the object a new name before it is inserted. To rename an inserted object, right-click and choose Name from the context menu. Renaming has the advantage that the object is then listed in the Navigator.
8 Editing Pictures (Raster Graphics)
Exporting graphics
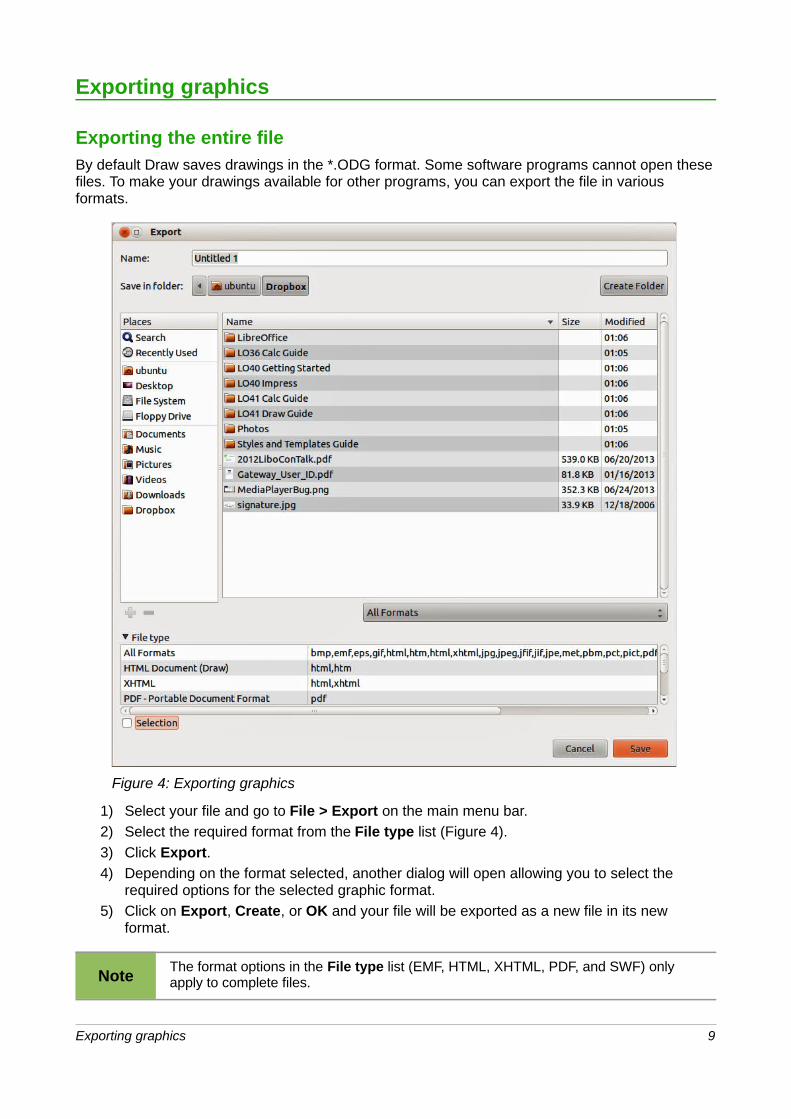
Exporting the entire fileBy default Draw saves drawings in the *.ODG format. Some software programs cannot open these files. To make your drawings available for other programs, you can export the file in various formats.
Figure 4: Exporting graphics
1) Select your file and go to File > Export on the main menu bar.
2) Select the required format from the File type list (Figure 4).
3) Click Export.
4) Depending on the format selected, another dialog will open allowing you to select the required options for the selected graphic format.
5) Click on Export, Create, or OK and your file will be exported as a new file in its new format.
NoteThe format options in the File type list (EMF, HTML, XHTML, PDF, and SWF) only apply to complete files.
Exporting graphics 9
Exporting objectsTo export individual objects from your drawing:
1) Select the objects and then go to File > Export on the main menu bar.
2) Select the required graphic format from the File type list.
3) Select the Selection option on the Export dialog (Figure 4).
4) Click Export.
5) Depending on the graphic format selected, another dialog will open allowing you to select the required options for that graphic format.
6) Click on Export, Create, or OK and your selected objects will be exported as a new file in its new format.
Formatting raster objects
Objects that are raster graphics can be formatted using the Format or context menus. The Picture toolbar is used to add or change filters and adjust the properties of lines, areas, and shadows.
The Transparency property in the Format menu does not relate to the transparency of the raster graphic itself but to the background area. To change the transparency of a raster graphic, you mustuse the Picture toolbar; see “Picture toolbar” below.
Some raster graphics may have a text element; for more information on formatting text, see Chapter 9 Adding and Formatting Text.
You can change position and size or rotate rotate raster graphics; for more information, see Chapter 3 Working with Objects and Object Points. Raster graphics can also be flipped (Modify > Flip on the main menu bar), but some metafile graphic formats may have problems flipping if they contain text.
Raster graphics included in a group behave like other objects when the properties of the group are modified.
It is recommended to name raster graphics using Modify > Name on the main menu bar or right-click and select Name on the context menu. Only named objects are visible in the Navigator and only named objects can be directly imported from another file.
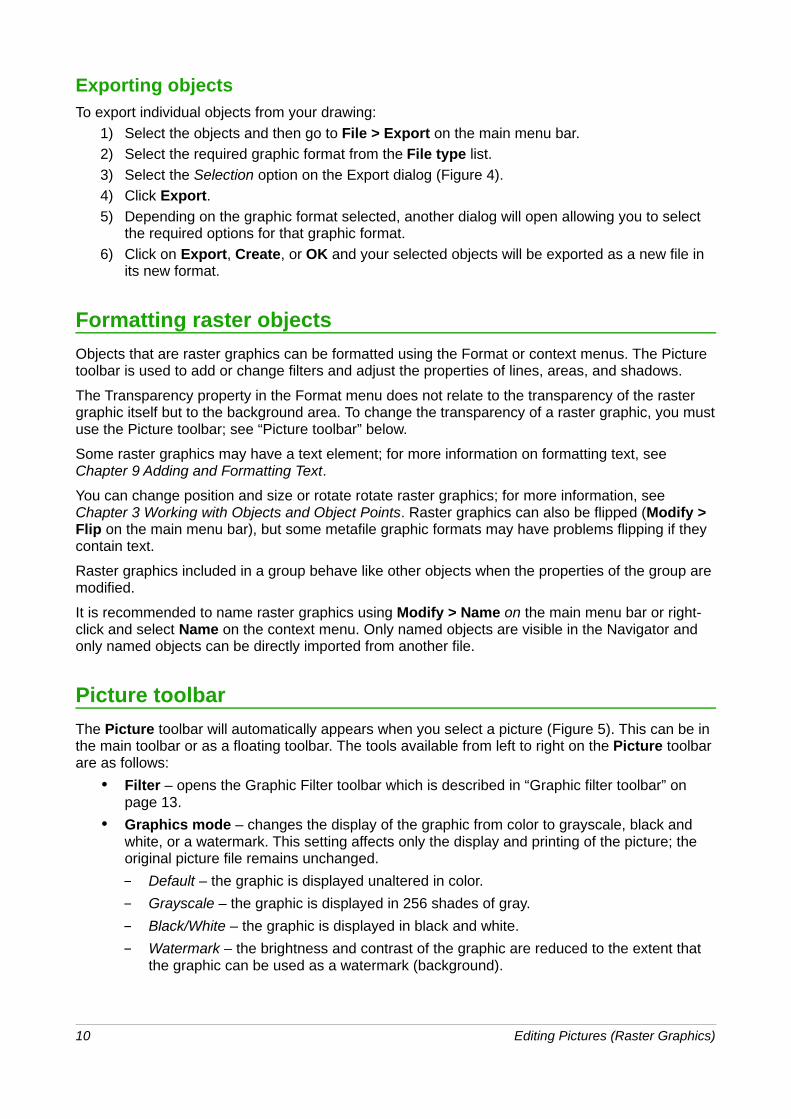
Picture toolbar
The Picture toolbar will automatically appears when you select a picture (Figure 5). This can be in the main toolbar or as a floating toolbar. The tools available from left to right on the Picture toolbar are as follows:
• Filter – opens the Graphic Filter toolbar which is described in “Graphic filter toolbar” on page 13.
• Graphics mode – changes the display of the graphic from color to grayscale, black and white, or a watermark. This setting affects only the display and printing of the picture; the original picture file remains unchanged.
– Default – the graphic is displayed unaltered in color.
– Grayscale – the graphic is displayed in 256 shades of gray.
– Black/White – the graphic is displayed in black and white.
– Watermark – the brightness and contrast of the graphic are reduced to the extent that the graphic can be used as a watermark (background).
10 Editing Pictures (Raster Graphics)
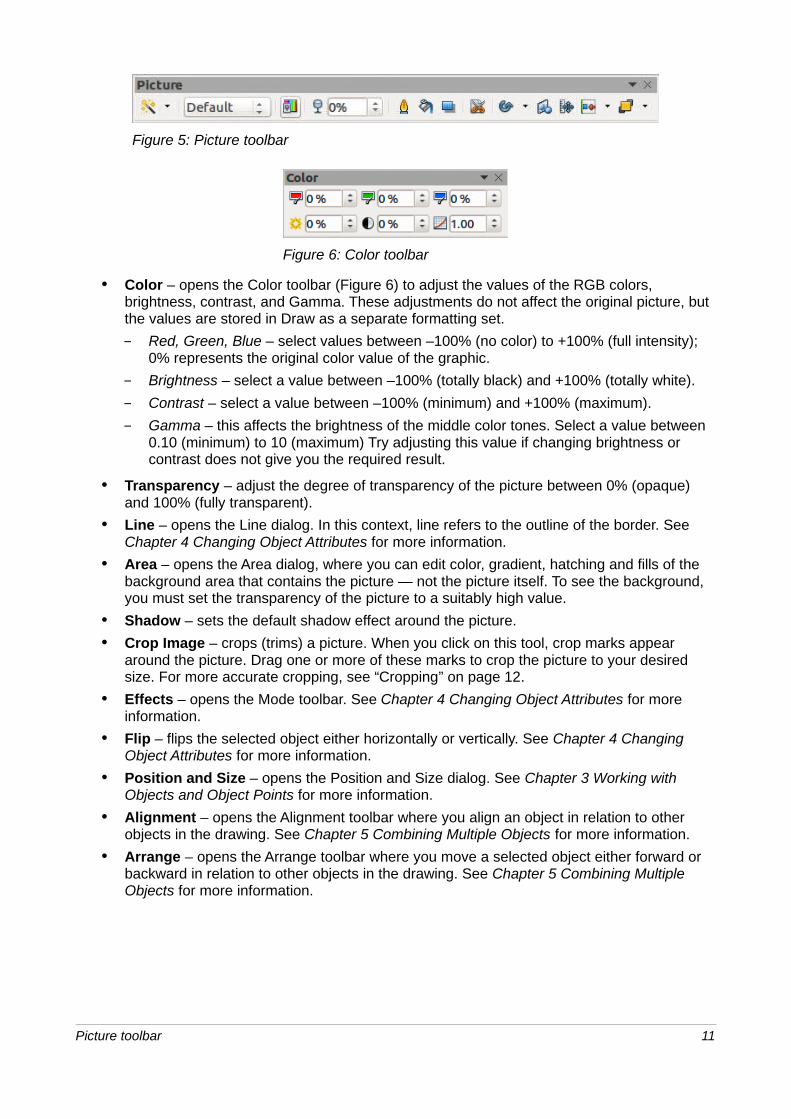
Figure 5: Picture toolbar
Figure 6: Color toolbar
• Color – opens the Color toolbar (Figure 6) to adjust the values of the RGB colors, brightness, contrast, and Gamma. These adjustments do not affect the original picture, but the values are stored in Draw as a separate formatting set.
– Red, Green, Blue – select values between –100% (no color) to +100% (full intensity); 0% represents the original color value of the graphic.
– Brightness – select a value between –100% (totally black) and +100% (totally white).
– Contrast – select a value between –100% (minimum) and +100% (maximum).
– Gamma – this affects the brightness of the middle color tones. Select a value between 0.10 (minimum) to 10 (maximum) Try adjusting this value if changing brightness or contrast does not give you the required result.
• Transparency – adjust the degree of transparency of the picture between 0% (opaque) and 100% (fully transparent).
• Line – opens the Line dialog. In this context, line refers to the outline of the border. See Chapter 4 Changing Object Attributes for more information.
• Area – opens the Area dialog, where you can edit color, gradient, hatching and fills of the background area that contains the picture — not the picture itself. To see the background, you must set the transparency of the picture to a suitably high value.
• Shadow – sets the default shadow effect around the picture.
• Crop Image – crops (trims) a picture. When you click on this tool, crop marks appear around the picture. Drag one or more of these marks to crop the picture to your desired size. For more accurate cropping, see “Cropping” on page 12.
• Effects – opens the Mode toolbar. See Chapter 4 Changing Object Attributes for more information.
• Flip – flips the selected object either horizontally or vertically. See Chapter 4 Changing Object Attributes for more information.
• Position and Size – opens the Position and Size dialog. See Chapter 3 Working with Objects and Object Points for more information.
• Alignment – opens the Alignment toolbar where you align an object in relation to other objects in the drawing. See Chapter 5 Combining Multiple Objects for more information.
• Arrange – opens the Arrange toolbar where you move a selected object either forward or backward in relation to other objects in the drawing. See Chapter 5 Combining Multiple Objects for more information.
Picture toolbar 11
Cropping
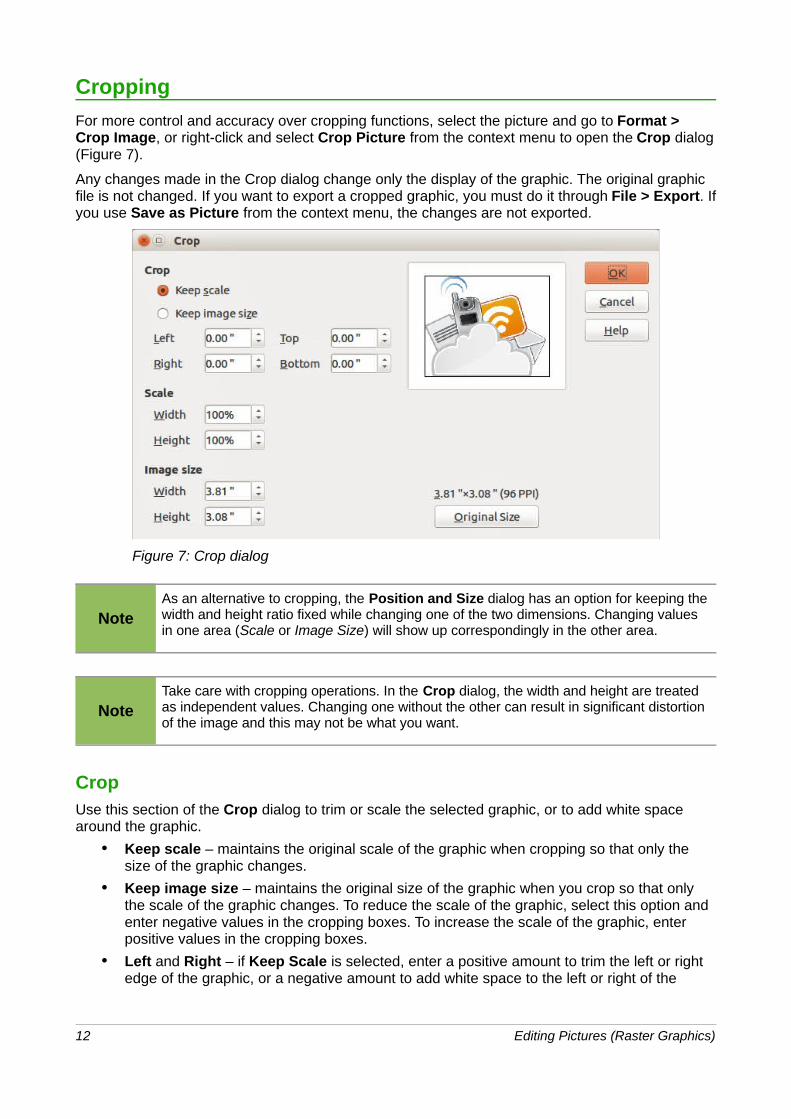
For more control and accuracy over cropping functions, select the picture and go to Format > Crop Image, or right-click and select Crop Picture from the context menu to open the Crop dialog(Figure 7).
Any changes made in the Crop dialog change only the display of the graphic. The original graphic file is not changed. If you want to export a cropped graphic, you must do it through File > Export. Ifyou use Save as Picture from the context menu, the changes are not exported.
Figure 7: Crop dialog
NoteAs an alternative to cropping, the Position and Size dialog has an option for keeping thewidth and height ratio fixed while changing one of the two dimensions. Changing values in one area (Scale or Image Size) will show up correspondingly in the other area.
NoteTake care with cropping operations. In the Crop dialog, the width and height are treated as independent values. Changing one without the other can result in significant distortion of the image and this may not be what you want.
CropUse this section of the Crop dialog to trim or scale the selected graphic, or to add white space around the graphic.
• Keep scale – maintains the original scale of the graphic when cropping so that only the size of the graphic changes.
• Keep image size – maintains the original size of the graphic when you crop so that only the scale of the graphic changes. To reduce the scale of the graphic, select this option and enter negative values in the cropping boxes. To increase the scale of the graphic, enter positive values in the cropping boxes.
• Left and Right – if Keep Scale is selected, enter a positive amount to trim the left or right edge of the graphic, or a negative amount to add white space to the left or right of the
12 Editing Pictures (Raster Graphics)
graphic. If Keep image size is selected, enter a positive amount to increase the horizontal scale of the graphic, or a negative amount to decrease the horizontal scale of the graphic.
• Top and Bottom – if Keep Scale is selected, enter a positive amount to trim the top or bottom of the graphic, or a negative amount to add white space above or below the graphic. If Keep image size is selected, enter a positive amount to increase the vertical scale of the graphic, or a negative amount to decrease the vertical scale of the graphic.
ScaleUse this section of the Crop dialog to change the scale of the selected graphic. In the Width and Height fields enter a value for the width or height of the selected graphic as a percentage.
Image sizeUse this section of the Crop dialog to change the size of the selected graphic. In the Width and Height fields enter a value for the width or height of the selected graphic.
Above the Original Size button, the original size of the graphic is displayed. Clicking on this buttonand then clicking OK resets the inserted image to the original image size.
Graphic filter toolbar
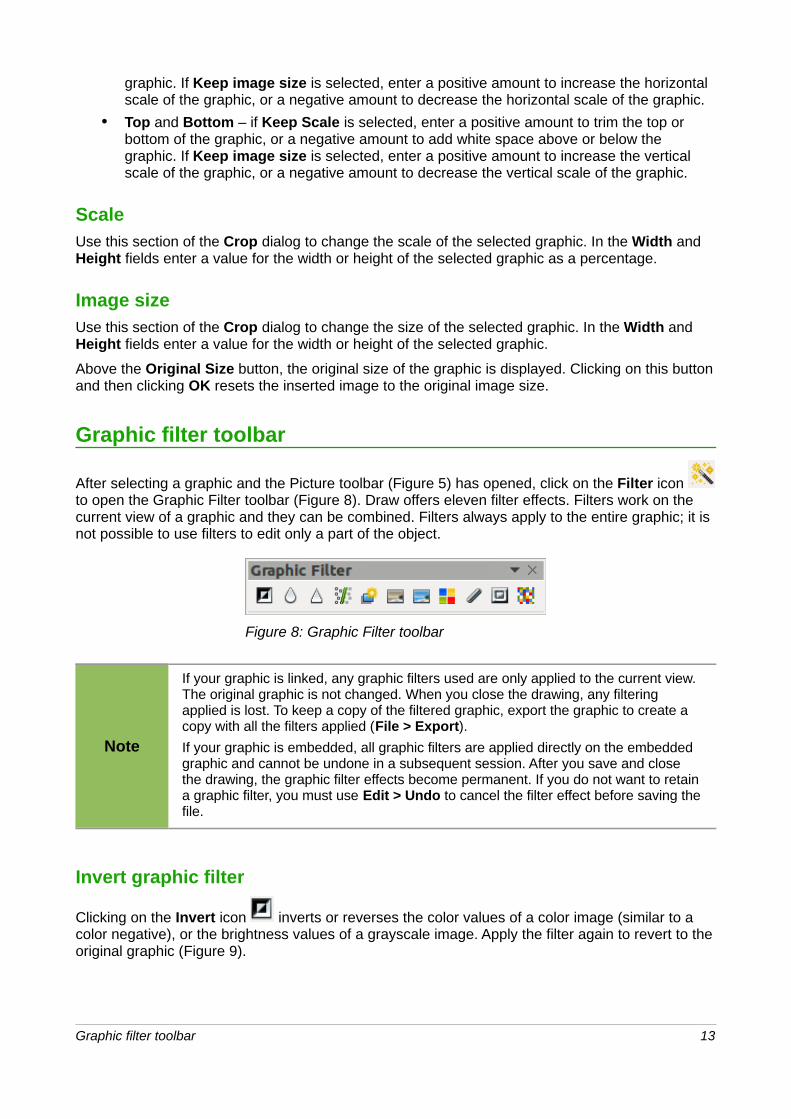
After selecting a graphic and the Picture toolbar (Figure 5) has opened, click on the Filter icon to open the Graphic Filter toolbar (Figure 8). Draw offers eleven filter effects. Filters work on the current view of a graphic and they can be combined. Filters always apply to the entire graphic; it is not possible to use filters to edit only a part of the object.
Figure 8: Graphic Filter toolbar
Note
If your graphic is linked, any graphic filters used are only applied to the current view. The original graphic is not changed. When you close the drawing, any filtering applied is lost. To keep a copy of the filtered graphic, export the graphic to create a copy with all the filters applied (File > Export).
If your graphic is embedded, all graphic filters are applied directly on the embedded graphic and cannot be undone in a subsequent session. After you save and close the drawing, the graphic filter effects become permanent. If you do not want to retaina graphic filter, you must use Edit > Undo to cancel the filter effect before saving thefile.
Invert graphic filter
Clicking on the Invert icon inverts or reverses the color values of a color image (similar to a color negative), or the brightness values of a grayscale image. Apply the filter again to revert to the original graphic (Figure 9).
Graphic filter toolbar 13
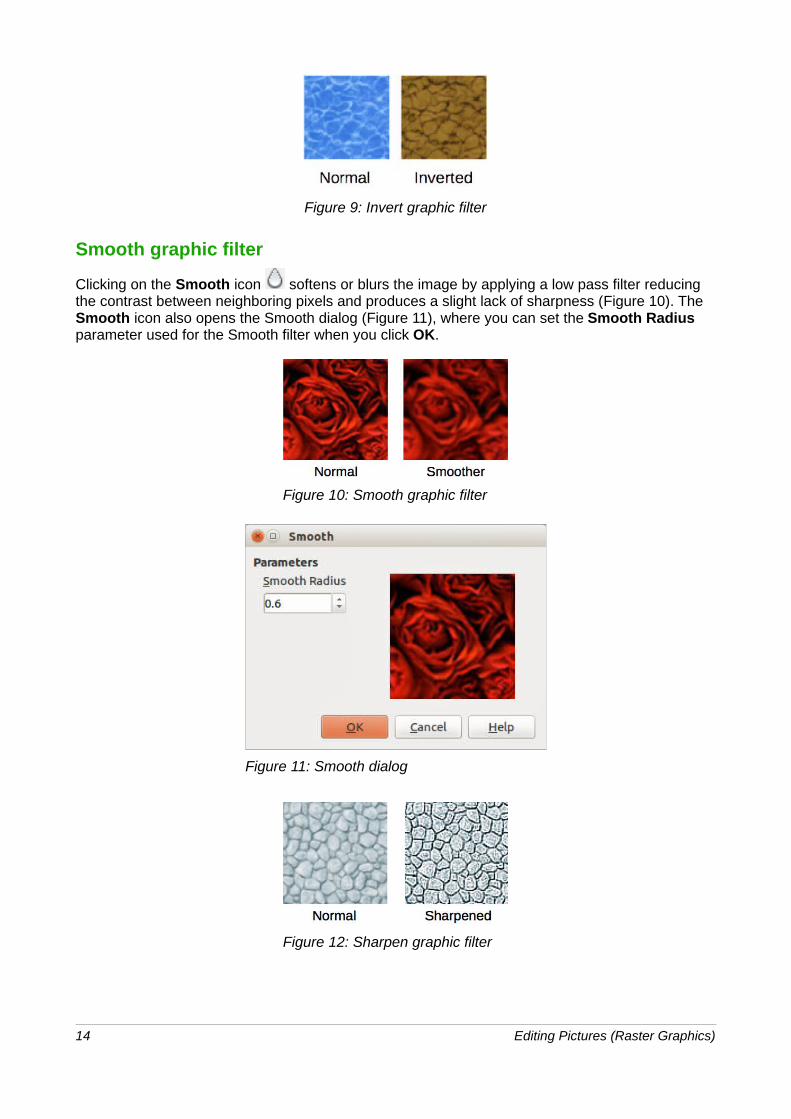
Figure 9: Invert graphic filter
Smooth graphic filter
Clicking on the Smooth icon softens or blurs the image by applying a low pass filter reducing the contrast between neighboring pixels and produces a slight lack of sharpness (Figure 10). The Smooth icon also opens the Smooth dialog (Figure 11), where you can set the Smooth Radius parameter used for the Smooth filter when you click OK.
Figure 10: Smooth graphic filter
Figure 11: Smooth dialog
Figure 12: Sharpen graphic filter
14 Editing Pictures (Raster Graphics)
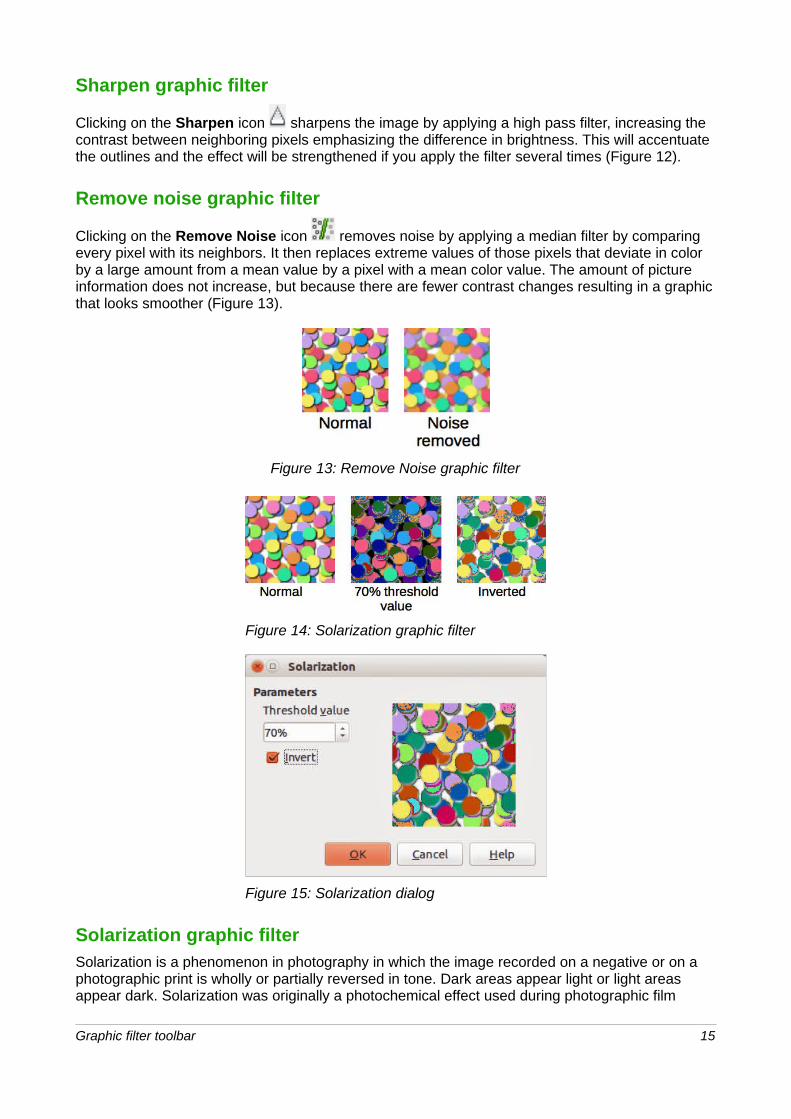
Sharpen graphic filter
Clicking on the Sharpen icon sharpens the image by applying a high pass filter, increasing the contrast between neighboring pixels emphasizing the difference in brightness. This will accentuate the outlines and the effect will be strengthened if you apply the filter several times (Figure 12).
Remove noise graphic filter
Clicking on the Remove Noise icon removes noise by applying a median filter by comparing every pixel with its neighbors. It then replaces extreme values of those pixels that deviate in color by a large amount from a mean value by a pixel with a mean color value. The amount of picture information does not increase, but because there are fewer contrast changes resulting in a graphic that looks smoother (Figure 13).
Figure 13: Remove Noise graphic filter
Figure 14: Solarization graphic filter
Figure 15: Solarization dialog
Solarization graphic filterSolarization is a phenomenon in photography in which the image recorded on a negative or on a photographic print is wholly or partially reversed in tone. Dark areas appear light or light areas appear dark. Solarization was originally a photochemical effect used during photographic film
Graphic filter toolbar 15
development and is now used in the digital world of computing to create a change or reversal of
color (Figure 14 and Figure 15). Clicking on the Solarization icon opens the Solarization dialog, where you can define the threshold value for solarization. Entering a Threshold value above 70% reverses the color values (center picture in Figure 14). Selecting the Invert option causes all the colors to be inverted (right picture in Figure 14).
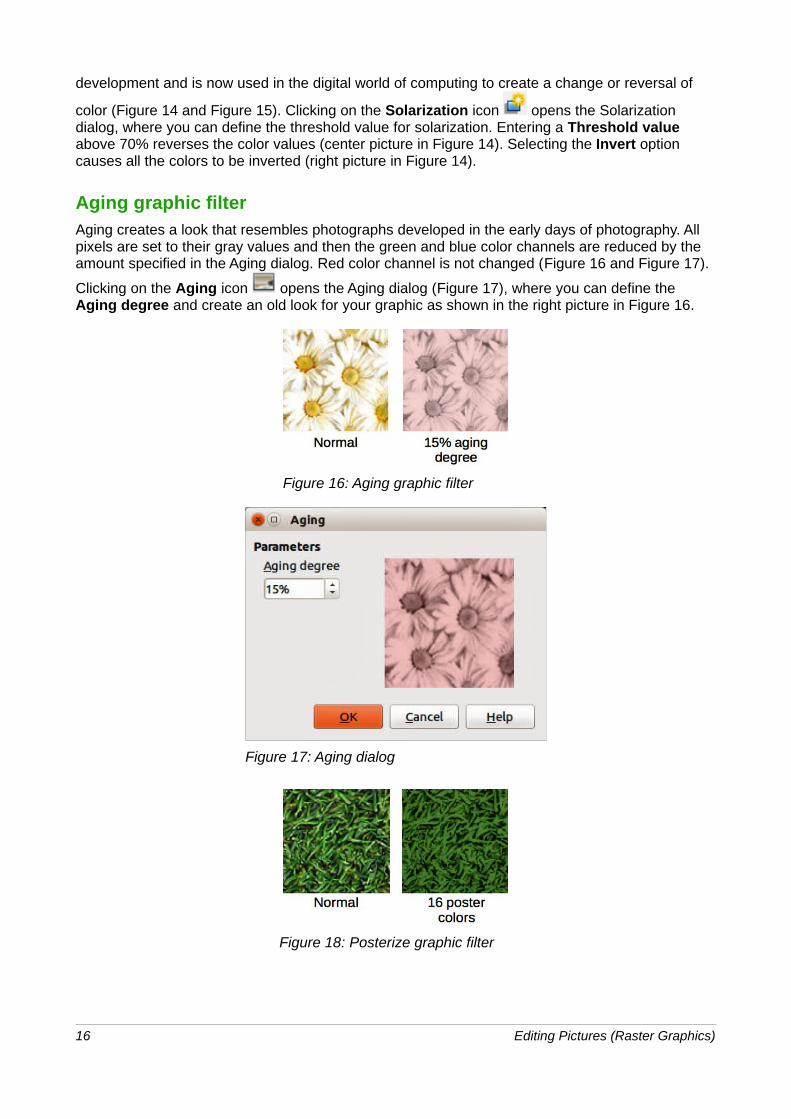
Aging graphic filterAging creates a look that resembles photographs developed in the early days of photography. All pixels are set to their gray values and then the green and blue color channels are reduced by the amount specified in the Aging dialog. Red color channel is not changed (Figure 16 and Figure 17).
Clicking on the Aging icon opens the Aging dialog (Figure 17), where you can define the Aging degree and create an old look for your graphic as shown in the right picture in Figure 16.
Figure 16: Aging graphic filter
Figure 17: Aging dialog
Figure 18: Posterize graphic filter
16 Editing Pictures (Raster Graphics)
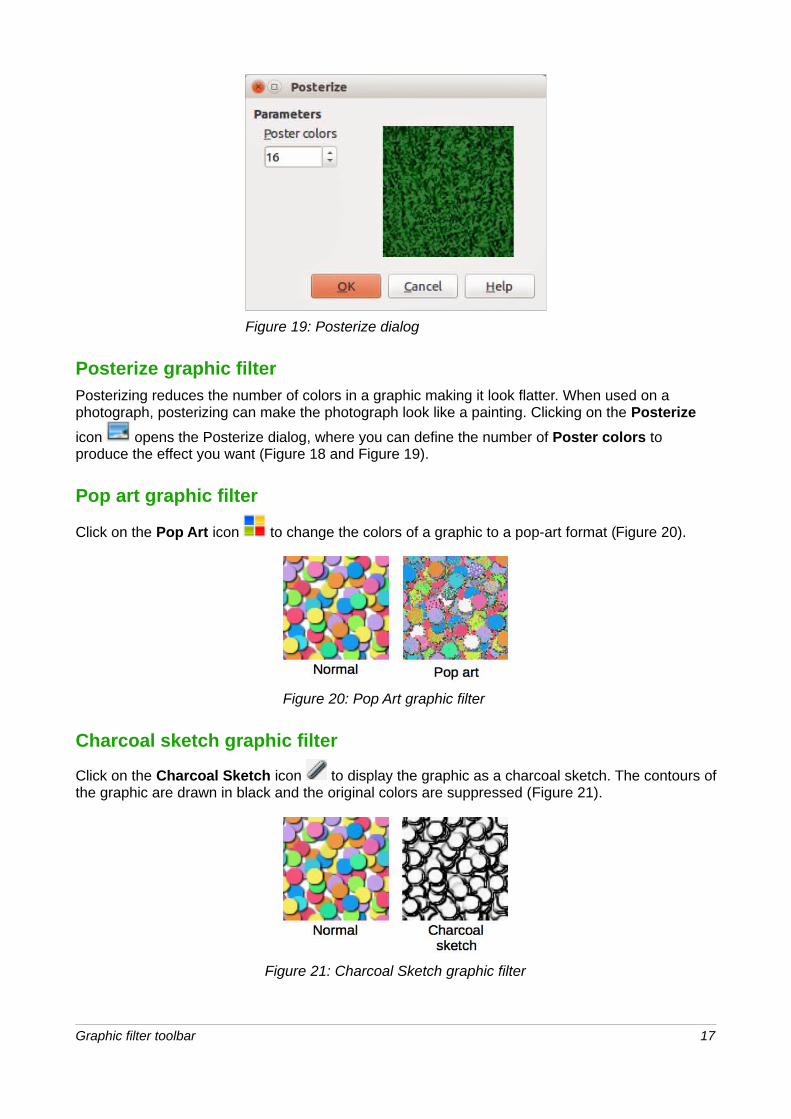
Figure 19: Posterize dialog
Posterize graphic filterPosterizing reduces the number of colors in a graphic making it look flatter. When used on a photograph, posterizing can make the photograph look like a painting. Clicking on the Posterize
icon opens the Posterize dialog, where you can define the number of Poster colors to produce the effect you want (Figure 18 and Figure 19).
Pop art graphic filter
Click on the Pop Art icon to change the colors of a graphic to a pop-art format (Figure 20).
Figure 20: Pop Art graphic filter
Charcoal sketch graphic filter
Click on the Charcoal Sketch icon to display the graphic as a charcoal sketch. The contours ofthe graphic are drawn in black and the original colors are suppressed (Figure 21).
Figure 21: Charcoal Sketch graphic filter
Graphic filter toolbar 17
Relief graphic filterThe Relief graphic filter calculates the edges of a graphic in relief as if the graphic is illuminated bya light source. Clicking on the Relief icon opens the Emboss dialog, where you can select the position of the Light source producing shadows that differ in direction and magnitude (Figure 22 and Figure 23).
Figure 22: Relief graphic filter
Figure 23: Emboss dialog
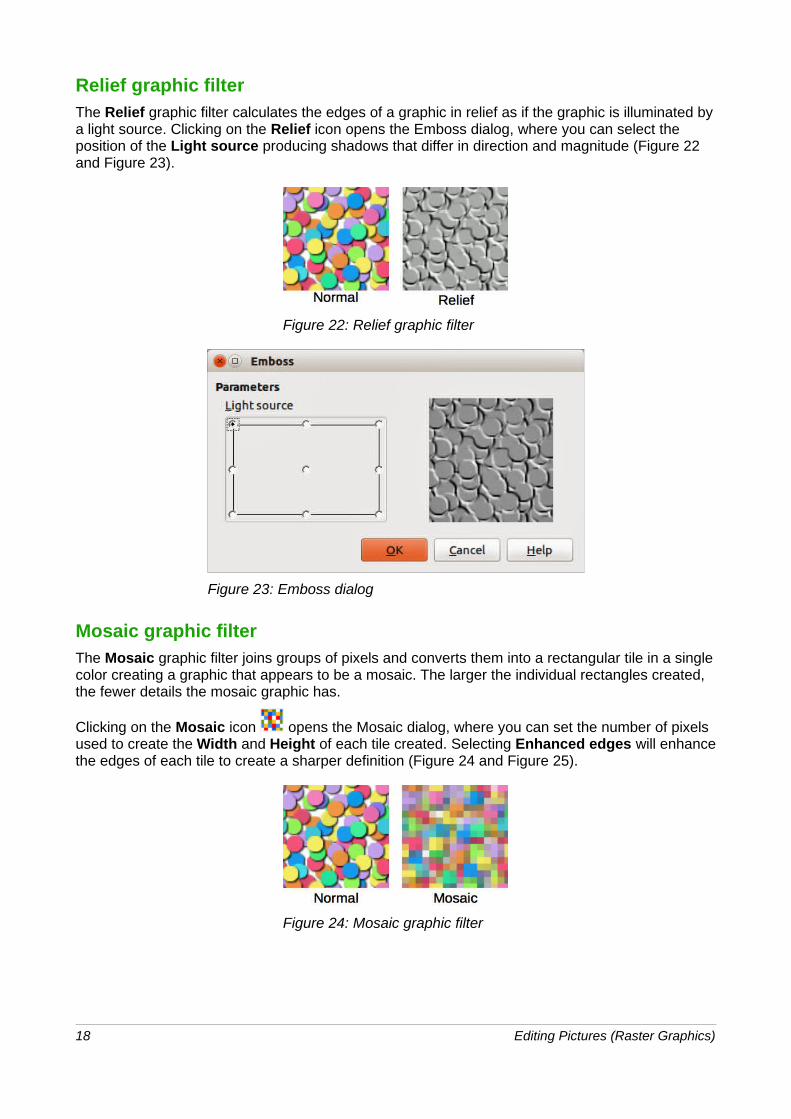
Mosaic graphic filterThe Mosaic graphic filter joins groups of pixels and converts them into a rectangular tile in a singlecolor creating a graphic that appears to be a mosaic. The larger the individual rectangles created, the fewer details the mosaic graphic has.
Clicking on the Mosaic icon opens the Mosaic dialog, where you can set the number of pixels used to create the Width and Height of each tile created. Selecting Enhanced edges will enhancethe edges of each tile to create a sharper definition (Figure 24 and Figure 25).
Figure 24: Mosaic graphic filter
18 Editing Pictures (Raster Graphics)
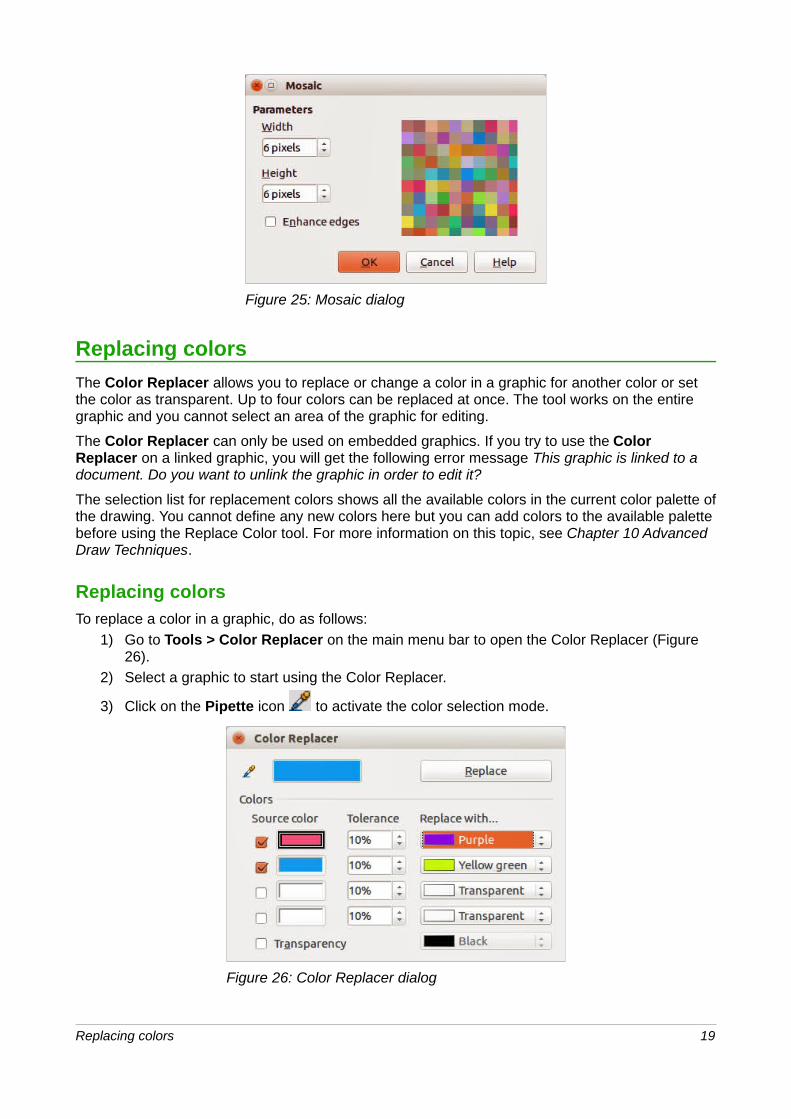
Figure 25: Mosaic dialog
Replacing colors
The Color Replacer allows you to replace or change a color in a graphic for another color or set the color as transparent. Up to four colors can be replaced at once. The tool works on the entire graphic and you cannot select an area of the graphic for editing.
The Color Replacer can only be used on embedded graphics. If you try to use the Color Replacer on a linked graphic, you will get the following error message This graphic is linked to a document. Do you want to unlink the graphic in order to edit it?
The selection list for replacement colors shows all the available colors in the current color palette ofthe drawing. You cannot define any new colors here but you can add colors to the available palette before using the Replace Color tool. For more information on this topic, see Chapter 10 Advanced Draw Techniques.
Replacing colorsTo replace a color in a graphic, do as follows:
1) Go to Tools > Color Replacer on the main menu bar to open the Color Replacer (Figure 26).
2) Select a graphic to start using the Color Replacer.
3) Click on the Pipette icon to activate the color selection mode.
Figure 26: Color Replacer dialog
Replacing colors 19
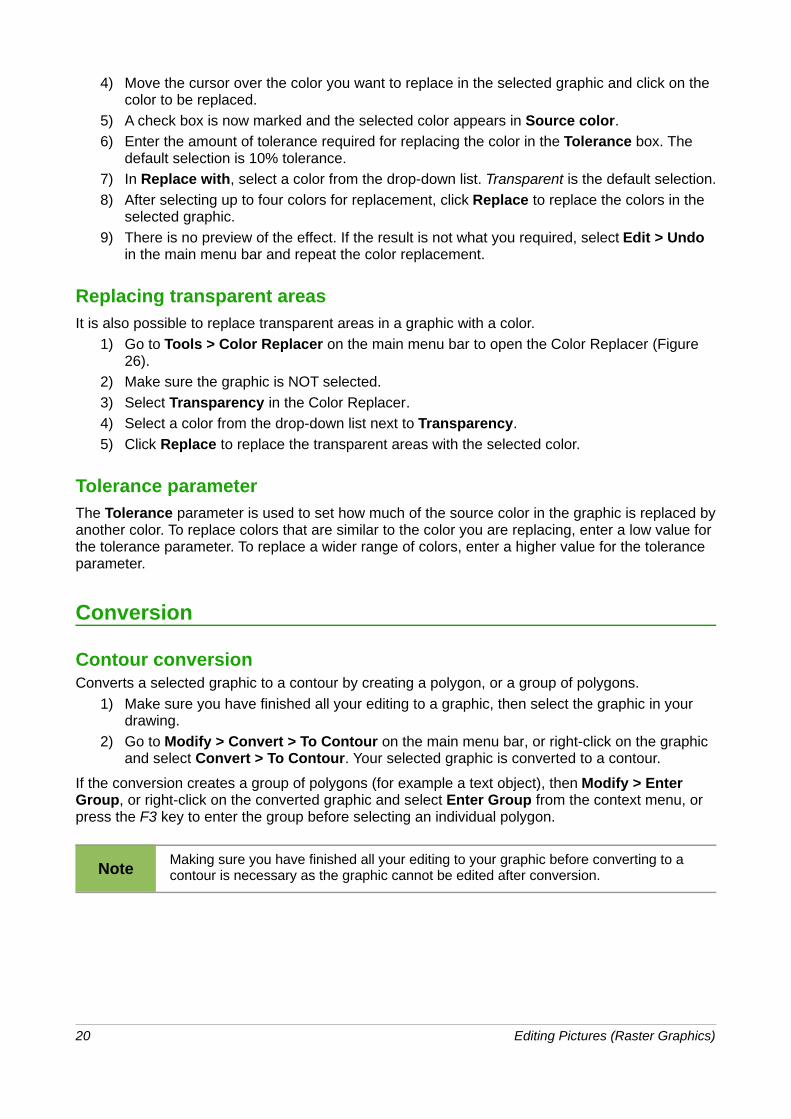
4) Move the cursor over the color you want to replace in the selected graphic and click on the color to be replaced.
5) A check box is now marked and the selected color appears in Source color.
6) Enter the amount of tolerance required for replacing the color in the Tolerance box. The default selection is 10% tolerance.
7) In Replace with, select a color from the drop-down list. Transparent is the default selection.
8) After selecting up to four colors for replacement, click Replace to replace the colors in the selected graphic.
9) There is no preview of the effect. If the result is not what you required, select Edit > Undo in the main menu bar and repeat the color replacement.
Replacing transparent areasIt is also possible to replace transparent areas in a graphic with a color.
1) Go to Tools > Color Replacer on the main menu bar to open the Color Replacer (Figure 26).
2) Make sure the graphic is NOT selected.
3) Select Transparency in the Color Replacer.
4) Select a color from the drop-down list next to Transparency.
5) Click Replace to replace the transparent areas with the selected color.
Tolerance parameterThe Tolerance parameter is used to set how much of the source color in the graphic is replaced byanother color. To replace colors that are similar to the color you are replacing, enter a low value for the tolerance parameter. To replace a wider range of colors, enter a higher value for the tolerance parameter.
Conversion
Contour conversionConverts a selected graphic to a contour by creating a polygon, or a group of polygons.
1) Make sure you have finished all your editing to a graphic, then select the graphic in your drawing.
2) Go to Modify > Convert > To Contour on the main menu bar, or right-click on the graphic and select Convert > To Contour. Your selected graphic is converted to a contour.
If the conversion creates a group of polygons (for example a text object), then Modify > Enter Group, or right-click on the converted graphic and select Enter Group from the context menu, or press the F3 key to enter the group before selecting an individual polygon.
NoteMaking sure you have finished all your editing to your graphic before converting to a contour is necessary as the graphic cannot be edited after conversion.
20 Editing Pictures (Raster Graphics)
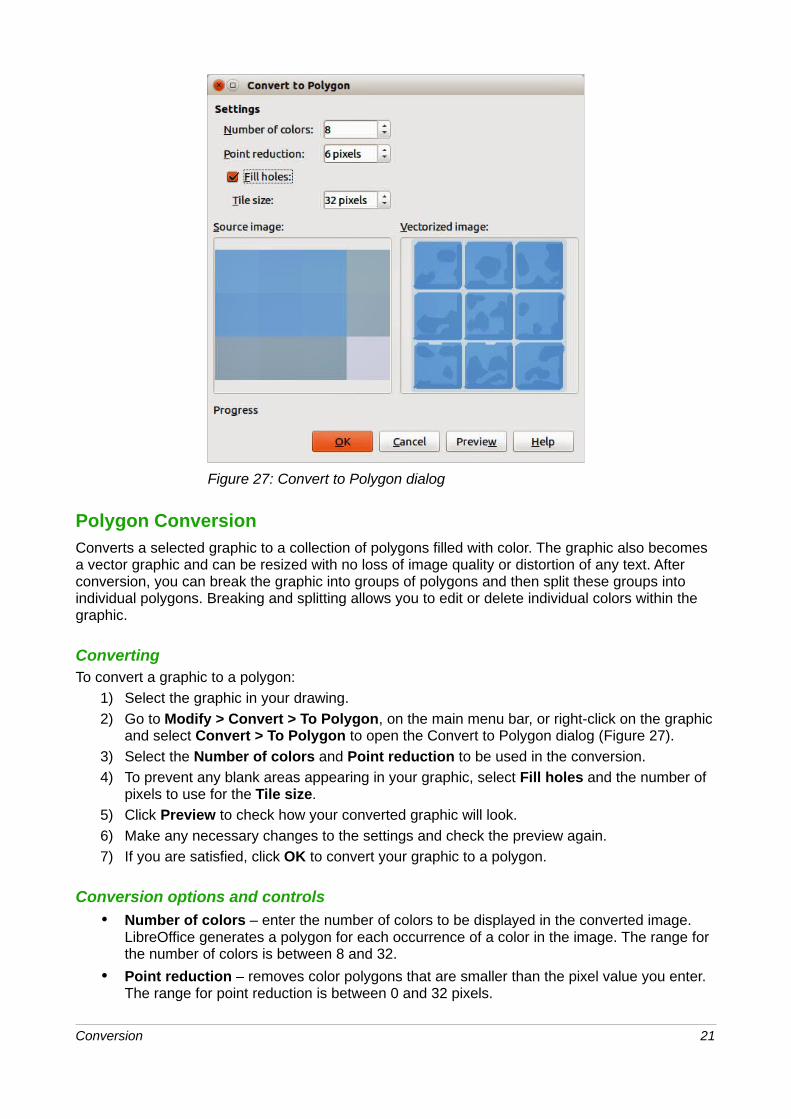
Figure 27: Convert to Polygon dialog
Polygon ConversionConverts a selected graphic to a collection of polygons filled with color. The graphic also becomes a vector graphic and can be resized with no loss of image quality or distortion of any text. After conversion, you can break the graphic into groups of polygons and then split these groups into individual polygons. Breaking and splitting allows you to edit or delete individual colors within the graphic.
ConvertingTo convert a graphic to a polygon:
1) Select the graphic in your drawing.
2) Go to Modify > Convert > To Polygon, on the main menu bar, or right-click on the graphic and select Convert > To Polygon to open the Convert to Polygon dialog (Figure 27).
3) Select the Number of colors and Point reduction to be used in the conversion.
4) To prevent any blank areas appearing in your graphic, select Fill holes and the number of pixels to use for the Tile size.
5) Click Preview to check how your converted graphic will look.
6) Make any necessary changes to the settings and check the preview again.
7) If you are satisfied, click OK to convert your graphic to a polygon.
Conversion options and controls
• Number of colors – enter the number of colors to be displayed in the converted image. LibreOffice generates a polygon for each occurrence of a color in the image. The range for the number of colors is between 8 and 32.
• Point reduction – removes color polygons that are smaller than the pixel value you enter. The range for point reduction is between 0 and 32 pixels.
Conversion 21
• Fill holes – fills the blank areas in the graphic that can be created when applying a point reduction.
• Tile size – enter the size of the rectangle for the background fill. The range of tile sizes is between 8 and 128 pixels.
• Source picture – preview of the original image.
• Vectorized image – preview of the converted image. Click Preview to generate the vectorized image.
• Progress – displays a progress bar during conversion.
• Preview – creates a preview of the converted image without applying any changes.
• OK – converts your graphic to polygons.
BreakingAfter converting a graphic to polygons, you can break the graphic into groups of polygons. Each group of polygons consists of one color.
1) Convert your graphic to polygons, see “Converting” above.
2) Make sure your graphic is selected and go to Modify > Break on the main menu bar, or right-click on your graphic and select Break from the context menu to break your convertedgraphic into groups of polygons.
3) Click on a color in your graphic then drag the group of polygons filled with that color out of your graphic to create a new graphic OR press the Delete key and delete the color from your graphic.
SplittingAfter converting a graphic to polygons and breaking the graphic into groups of polygons, you can then split these groups into individual polygons.
1) Convert your graphic to polygons, see “Converting” above.
2) Break your graphic into groups of polygons, see “Breaking” above.
3) Make sure your graphic is selected and go to Modify > Split on the main menu bar, right-click on the graphic and select Split from the context menu, or use the keyboard combination Ctrl+Alt+Shift+K to split groups of polygons into individual polygons.
4) Click on an individual polygon in your graphic and drag it out of your graphic or a polygon group OR press the Delete key and delete the polygon from your graphic.
Bitmap conversionAll drawing objects placed into a LibreOffice drawing are vector graphics and these vector graphicscan be converted to a bitmap in PNG format. Any transparency effects in the original vector graphicare lost during conversion even though the PNG format used does support transparencies.
To convert a vector graphic to a bitmap, go to Modify > Convert > To Bitmap on the main menu bar or right-click on the graphic and select Convert > To Bitmap from the context menu.
22 Editing Pictures (Raster Graphics)
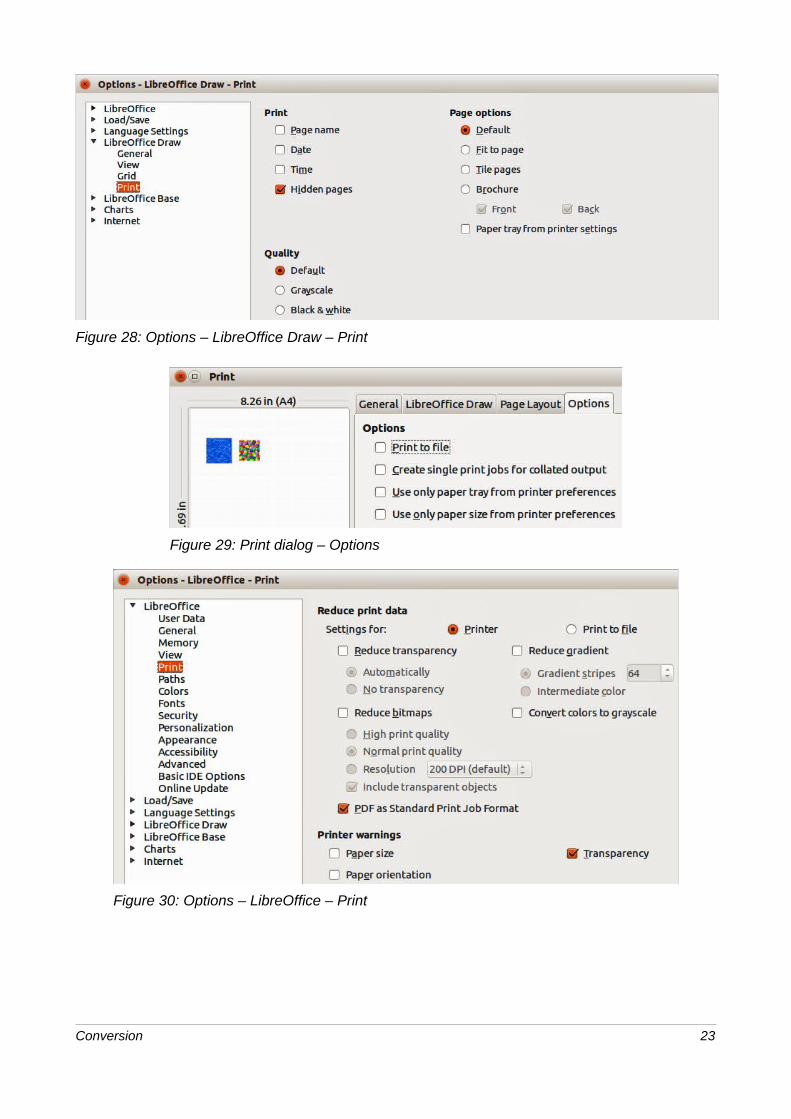
Figure 28: Options – LibreOffice Draw – Print
Figure 29: Print dialog – Options
Figure 30: Options – LibreOffice – Print
Conversion 23
Print options
If you have only a monochrome (single color) printer or are experiencing problems with printing, then the following settings may help with printing your drawing. You can set up printing so that all text and all graphics are printed either in grayscale or black and white.
The general settings are in Tools > Options > LibreOffice Draw > Print (Figure 28) and will only apply to all drawings that you print using LibreOffice Draw.
To set printing options for the current document only, go to File > Print or use the keyboard combination Ctrl+P and click on the Options tab in the Print dialog (Figure 29).
To set printing options for all the modules in LibreOffice, go to Tools > Options > LibreOffice > Print (Figure 30). These printing options allow you to reduce print data sent to a printer or file, and to give any printer warnings if the wrong paper size or orientation and transparency is set.
24 Editing Pictures (Raster Graphics)


![Motion Editing and Retargetting Jinxiang Chai. Outline Motion editing [video, click here]here Motion retargeting [video, click here]here.](https://static.fdocuments.us/doc/165x107/56649d2e5503460f94a06474/motion-editing-and-retargetting-jinxiang-chai-outline-motion-editing-video.jpg)