![Chapter 1 DP Title 1 · Web viewChapter 1 Introduction Chapter 5 Study Methods and Procedures Chapter 6 Existing Noise Environment [Blue Text = Instructions/guidance to be deleted]](https://static.fdocuments.us/doc/165x107/601773c02cd33d788160410b/chapter-1-dp-title-1-web-view-chapter-1-introduction-chapter-5-study-methods-and.jpg)
Chapter 6 dp&c 6-1 “Education in Pursuit of Supply Chain Leadership” Chapter 6 dp&c Demand...
74
“Education in Pursuit of Supply Chain Leadership” Chapter 6 Chapter 6 dp&c Demand Management
-
Upload
osborne-lambert -
Category
Documents
-
view
244 -
download
3
Transcript of Chapter 6 dp&c 6-1 “Education in Pursuit of Supply Chain Leadership” Chapter 6 dp&c Demand...

Chapter 6dp&c6-1
“Education in Pursuit of Supply Chain Leadership”
Chapter 6
Chapter 6dp&c
Demand Management
Chapter 6dp&c6-2
Learning Objectives
• Define demand management
• Detail the components of demand management
• Formulate demand management strategies
• Determine the process of demand planning
• Perform demand planning
• Perform marketing planning
• Perform sales planning
• Develop the demand forecast

Chapter 6dp&c6-3
Learning Objectives (cont.)
• Perform production and resource planning
• Perform inventory and distribution planning
• Understand balancing the demand and supply plans
• Detail the foundations of S&OP
• Work with S&OP planning grids
• Perform the monthly S&OP process

Chapter 6dp&c6-4
Inventory Management Basics
Chapter 6
Demand Management
Defining Demand Management

Chapter 6dp&c6-5
Demand Management Definitions
1) The function of recognizing all demands for goods and services to support the marketplace. It involves prioritizing demand when supply is lacking. Proper demand management facilitates the planning and use of resources for profitable business results.2) In marketing, the process of planning, executing, controlling, and monitoring the design, pricing, promotion, and distribution of products and services to bring about transactions that meet organizational and individual needs
APICS Dictionary:
The proactive compilation of requirements information regarding demand (i.e., customers, sales, marketing, finance) and the firm's capabilities from the supply side (i.e., supply, operations and logistics management); the development of a consensus regarding the ability to match the requirements and capabilities; and the agreement upon a synthesized plan that can most effectively meet the customer requirements within the constraints imposed by supply chain capabilities
CSCMP:
Chapter 6dp&c6-6
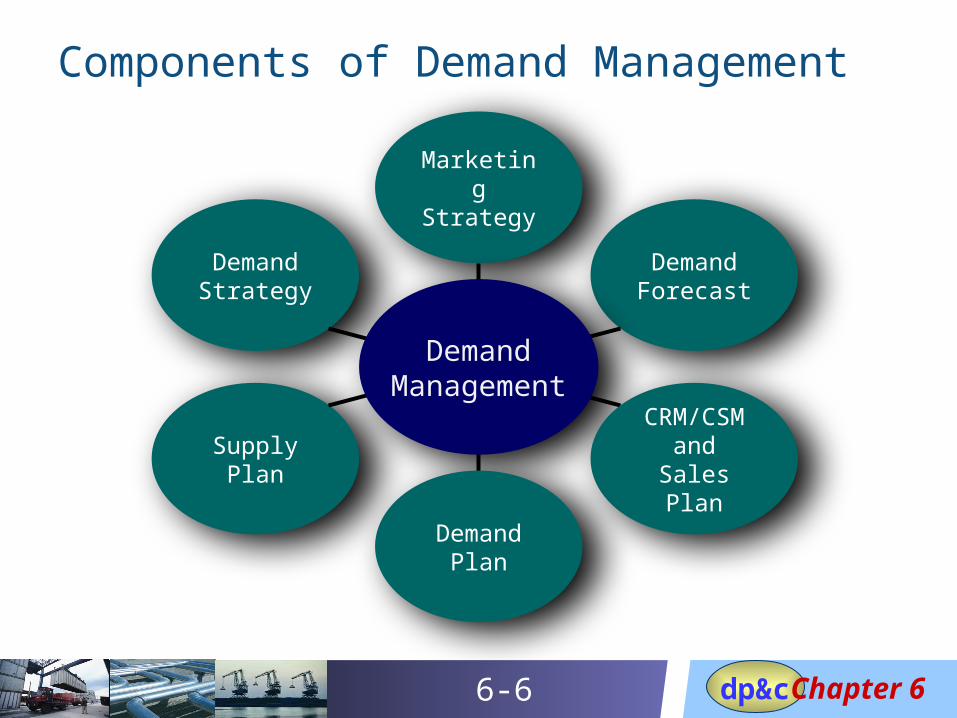
Components of Demand Management
Marketing Strategy
Demand Forecast
Demand Strategy
Supply Plan
DemandManagement
DemandManagement
CRM/CSM and Sales
Plan
Demand Plan

Chapter 6dp&c6-7
Demand Management Strategic Alternatives
Growth strategies
Portfolio strategies
Positioning strategies
Investment strategies
Focused on determining how companies can gain market share by developing internal competencies or leveraging synergies gained through merger or acquisition
Concerned with the type, scope, nature, and life cycles of the range of products and services offerings constituting the firm's value proposition
Seek to continuously renew supply chain structures that effectively place the right combination of products and services within the supply channel network based on demand and supply economics
Concerned with the creation of a flexible portfolio of assets that provide strategic planners with the capability to expand and channel capital, physical resources, and research investment to realize the best marketplace opportunities
Chapter 6dp&c6-8
Inventory Management Basics
Chapter 6
Demand Management
Creating the Demand Plan

Chapter 6dp&c6-9
Demand Planning - Definition
A process that weighs both customer demand and a firm’s output capabilities, and tries to balance the two
Planning demand
Communi-cating
demand
Influencingdemand
Prioritizingdemand
Demand management consists of planning demand, communicating demand, influencing demand, and prioritizing demand
Chapter 6dp&c6-10
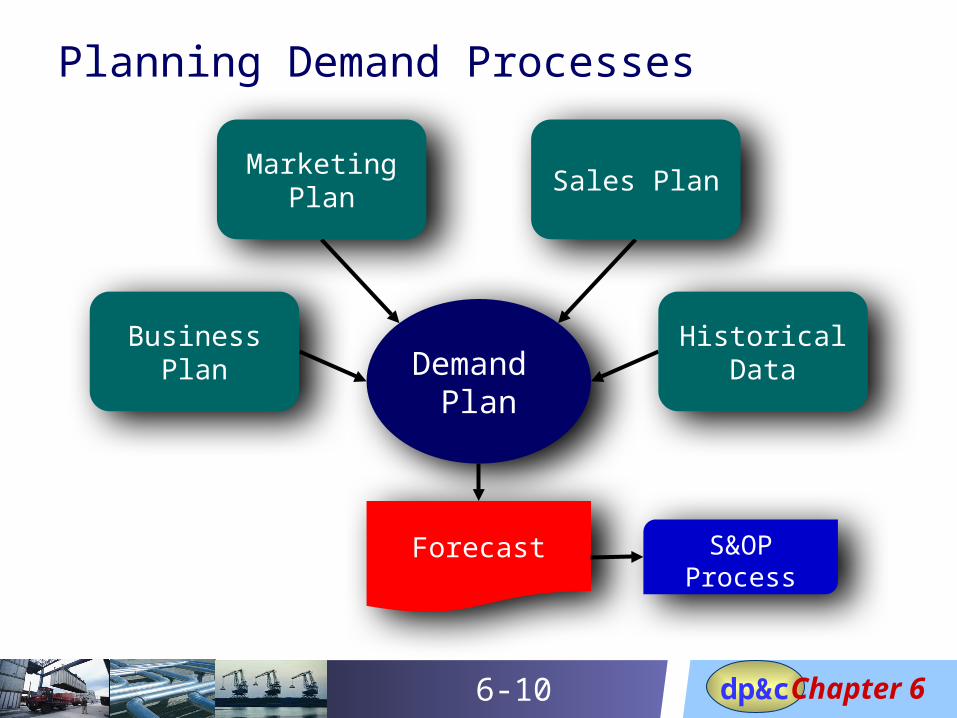
Planning Demand Processes
Demand Plan
Historical Data
Sales PlanMarketing
Plan
Business Plan
Forecast S&OP Process

Chapter 6dp&c6-11
Product Planning Process
Product OK?
Product Portfolio
Marketing Strategy
Life Cycles OK?
Strategy OK?
Services OK?
Product Classifications
Product Life Cycle
Services Strategy
Brand Strategy
Chapter 6dp&c6-12
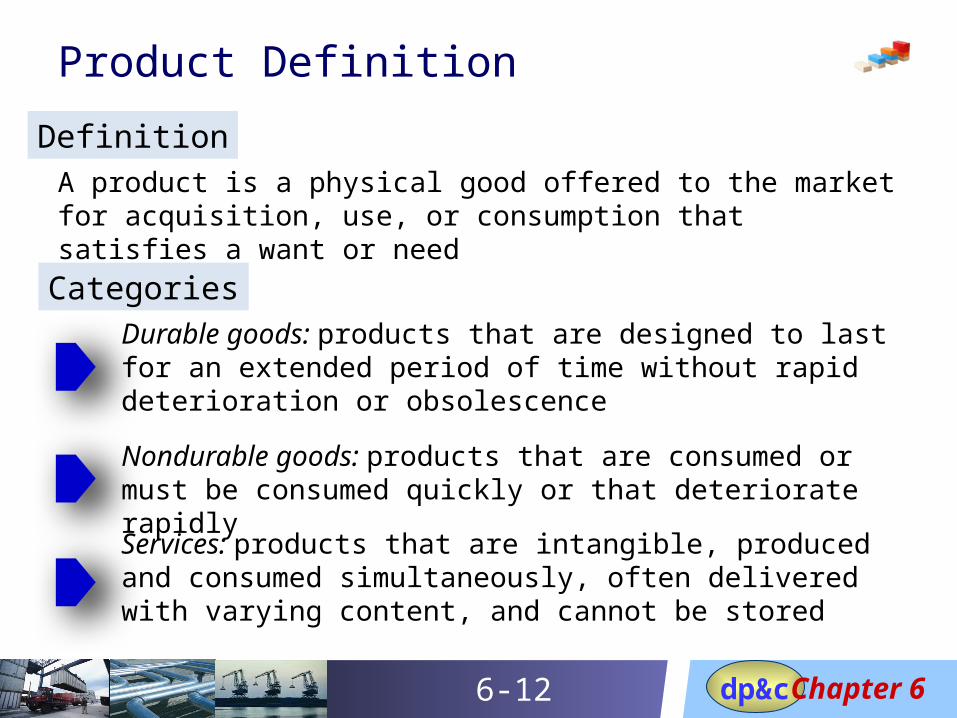
Product Definition
DefinitionA product is a physical good offered to the market for acquisition, use, or consumption that satisfies a want or need
CategoriesDurable goods: products that are designed to last for an extended period of time without rapid deterioration or obsolescence
Nondurable goods: products that are consumed or must be consumed quickly or that deteriorate rapidly
Services: products that are intangible, produced and consumed simultaneously, often delivered with varying content, and cannot be stored

Chapter 6dp&c6-13
Product Hierarchy
Product Levels
Product Family
Product Class
Product Line
Product Type
Product SKU

Chapter 6dp&c6-14
Categories – Industrial Goods
Raw materials and components
Farm and natural products, such as foodstuffs, lumber, petroleum and iron ore, and fabricated or manufactured components used by manufacturers who convert them into finished products
Capital goods
Equipment such as generators, computers, automobiles, material handling equipment, and office furniture. Products in this category are considered finished goods
MROConsumer-type goods such as paint, nails, office supplies, small tools, lubricants, and fuels

Chapter 6dp&c6-15
Categories – Consumer Goods
Convenience goods
Products usually purchased frequently, immediately, and with the minimum of effort in comparison or buying. Examples include staples (bread and milk) impulse goods (candy), and emergency goods (medical supplies)
Shopping goods
Products customers normally will shop for in many locations and compare price, quality, performance, and suitability before a decision to purchase is made. Examples include fashion apparel and appliances
Specialty goods
Products possessing unique characteristics or brand recognition for which customers are willing to expend a significant effort to acquire them. Examples include automobiles and women's fashions.

Chapter 6dp&c6-16
Additional Product Characteristics
Form. Refers to the size, shape, color, or physical structure of a product
Replacement rate. Refers to the frequency with which a product is purchased or manufactured
Level of service. Some products require specific levels of service such as training, warranty, repair, or other activities
Conformance to quality. Describes the degree to which products are identical to and meet the promised specifications
Durability. Refers to the duration of a product's functional life under normal operating conditions
Chapter 6dp&c6-17
Additional Product Characteristics (cont.)
Reliability. Refers to the probability that a product will not fail within a specified time span
Degree of customization. Nonstandardized products often require special assistance for installation, training, or other forms of servicing that must be performed by the producer

Chapter 6dp&c6-18
Product Life Cycle Dynamics
NEW GROWTH
DECLINE MATURE
Invest&
Grow
Grow&
Profit
Profit&
Protect
Re-invest&
Divest
High
Low HighMarket Share
MarketGrowth

Chapter 6dp&c6-19
Product Life Cycle Characteristics
Characteristic Introduction Growth Mature Decline
Product availability Low Increase Level Low
Product volume Low Increase Level Low
Sales volume Low Increase Level Low
Complexity of supply channel structure
MinimumIncreased
complexityComplex Minimum
Investment Very high High Level Low
Competitive attribute
Product featuresQuality and availability
Price and dependability
Availability

Chapter 6dp&c6-20
Services Characteristics
IntangibleService is usually an intangible exchange of value, in contrast to the tangible value found in a physical product such as bread, butter, and jam
Immediate consumption
Services are often produced and consumed simultaneously
UniqueThe services received by a customer are often unique to that customer
Lack of precise
definition
While products are rigorously defined as to fit, form, and function, services normally consist of a core value around which a variety of different outcomes can occur
Chapter 6dp&c6-21
Services Dimensions
Intrinsic Services
• Described as being almost “commodity” in nature because they directly accompany the product
• Examples include warranties, packaging, rebates, and training allow customers to receive additional value with the receipt of the tangible product
Extrinsic Services
• Described as not directly accompany the product
• Examples include discounting, improved supply channel efficiency, credit, and product assortment add value to products by reducing customer internal costs, facilitating the flow of business information, and improving productivity

Chapter 6dp&c6-22
Services Life Cycle
DevelopmentMarketers will experiment with new forms of services they anticipate will provide a point of differentiation separating their firms from the competition
Growth
Planners are still investing in services development, but customers are beginning to see that the new service is providing sufficient value to persuade them to purchase the product
Maturity
Investment declines as the service becomes standardized, while increasing customer market demand for the product and accompanying services allow cost recovery and profit
SaturationCustomers feel the service is part of the product offering, often requiring that it be offered with little or no charge attached

Chapter 6dp&c6-23
Product Brand Definition
A name, term, sign, symbol, or design, or a
combination of them, intended to identify
the goods or services of one seller or group
of sellers and to differentiate them from
those of competitors
Brand can be tangible and functional when related to the performance of a physical product; it can also be intangible and emotional when the brand acts as a symbol

Chapter 6dp&c6-24
Importance of Product Brand
Brand enables the marketplace to easily identify the product or service producer or distributor. Customers learn about brands through past experiences and through the firm's marketing programs
Brands provide important information for the firm such as organizing their products and accounting records
Branding enables companies to legally protect unique attributes and designs through registered trademarks and copyrights
Brands leave an indelible impression on customers regarding certain levels of quality, functional predictability, and purchase peace-of-mind possessed above the physical product or service (often termed brand equity) that cannot be duplicated by even the best replicas created by competitors
Chapter 6dp&c6-25
Definition of Marketing
The activity, set of institutions, and processes for creating, communicating, delivering, and exchanging offerings that
have value for customers, clients, partners, and society at large
American Marketing Association

Chapter 6dp&c6-26
Marketing Planning Process
Customers OK?
Corporate Strategies
Marketing Plan
Products OK?
Distribution OK?
Prices OK?
Marketplace Definition
Products and Services
Pricing and Promotions
Supply Channel

Chapter 6dp&c6-27
Developing Markets
Mass Market Strategy
A strategy whereby the seller engages in the mass production, mass distribution, and mass promotion of a single product or narrow product line targeted at all potential customers.
Segmented or Niche Market Strategy
• Segment the customer base into groups sharing common wants and needs, resources, geographical locations, buying attitudes, and practices
• Target those market segments that manifest the proper size and growth, are attractive in regard to a lack of competitors, match existing products and services, and leverage the business's internal and external strengths and resources
• Position the company's image, products, services, and brands so that customers within selected market segments understand the firm's competitive value

Chapter 6dp&c6-28
Marketing Strategy of One
Marketing in the Internet Age
This strategy requires marketers to have a firm grasp of the product, service, service, brand, and delivery strengths that give them a competitive advantage.
Once this is done, they must advance to a position that views each customer as if they were each a separate market. A key element is using technology to enable the customer to determine exactly how, what, and at
what price they want to buy

Chapter 6dp&c6-29
Sales Planning Process
Goals OK?
Corporate Strategies
Marketing Plan
Targets OK?
Sales OK?
Organization OK?
Sales Objectives
Sales StrategySales
Structure and Capacities
Sales Performance
Chapter 6dp&c6-30
Demand Forecast
The demand forecast enables the business to make assumptions (what demand will happen in the future) and
view occurrences (what demand has actually happened in the past and how it impacted performance and forecast accuracy)
about marketplace demand that is used as a roadmap to guide the performance requirements of the sales and
operations teams. Forecast assumptions are concerned with internal actions that will shape future customer demand.
Assumptions are also concerned with how the anticipated affect of events occurring in the external environment will
affect marketplace demand

Chapter 6dp&c6-31
Forecast Hierarchy
Enterprise Levels
Company
Business Unit
Market Segment
Aggregate
End-Product
End-Product by Customer
Forecast Data Type
Aggregate Financial
Business Unit Financial
Aggregate Sales Value
Product Family
Item-Level Usage
Item-Level Sales Value by Customer

Chapter 6dp&c6-32
Using Product Families in Forecasting
Product families should be organized to match the actual SKUs the supply channel sells to the marketplace as well as how they are processed or purchased
Since product families should never exceed more than perhaps a dozen or so, they are easily identifiable
Product families permit sales to use detailed financial and demand history data. This data can be “rolled-up” from actual SKUs and summarized into the product families to which they belong
As actual sales occurs through time and the data is rolled-up into the appropriate product families, sales is provided with a more accurate view of the viability of their forecasts

Chapter 6dp&c6-33
Pyramid Forecasting – Overview
Individual product units andmonetary value sold
Product family unitsand monetary value sold
Totalbusiness volume
Marketing andsales roll-upforecast
Managementforces down
forecast

Chapter 6dp&c6-34
Pyramid Forecasting – Example
• Product level demand: - value
- units
US$1,960
US$1,400
Family A Family BUS$600 (43%)40,000 units
US$800 (57%)60,000 units
A1 (50%) A2 (50%) B1 (66%) B2 (33%)
US$400 20,000 units
US$40040,000 units
US$20020,000 units
US$40020,000 units
Unit costs:US$10 US$20 US$20 US$10
• Product family level roll-up and forecast: - value
- units
• Business level forecast: - value
• Business level total product family demand roll-up: - value
S&OP process disaggregation
US$ (000)
100,000 units

Chapter 6dp&c6-35
Exercise 6-1 Pyramid Forecasting
Forecast Roll-up
July ForecastBase Family Forecast 8443.75Family Level Percent ForecastProduct Family A 38.1% 3,217.8Product Family B 61.9% 5,225.9
Total 8,443.8SKU Forecasts Percent ForecastItem A1 39.1% 1,258.1Item A2 31.6% 1,016.2Item A3 29.3% 943.6Item B1 38.9% 2,032.3Item B2 34.3% 1,790.4Item B3 26.9% 1,403.3
Historical Demand March April May Product Family A & B/units 8,100 8,450 8,500
Detail Demand for June/SKUs Actual Demand PercentItem A1 1,300 39.1%Item A2 1,050 31.6%Item A3 975 29.3%
Family A Total 3,325 100.0%Item B1 2,100 38.9%Item B2 1,850 34.3%Item B3 1,450 26.9%
Family B Total 5,400 100.0%Combined Total 8,725
Forecast Disaggregation

Chapter 6dp&c6-36
Inventory Management Basics
Chapter 6
Demand Management
Creating the Supply Plan

Chapter 6dp&c6-37
Supply Plan Components
Resource requirements planning
Inventory plan
Distribution planning
Performance measurements
Production Plan
Historical data
Operations dataMaster files
Supply Plan

Chapter 6dp&c6-38
Production Planning Process
Strategy OK?
Corporate Strategies
Supply Plan
Costs OK?
Performance OK?
Rates OK?
Production Strategy
Financial PlanProduction
Rates
Production Performance

Chapter 6dp&c6-39
Production Strategies
Level =Chase = Combo =
0
1
2
3
4
5
1 2 3 4 5 6 7 8 9 10 11
Sales ($millions)Sales =
Time (Periods)
Production =

Chapter 6dp&c6-40
Level Production Plan Graphic
Months
Quantity
5,000
5,500
6,000
6,500
7,000
7,500
8,000
8,500
9,000
9,500
March April May June July August Sept
Forecast
Prod Plan
Inv Plan

Chapter 6dp&c6-41
Level Production Plan Example
Product Family Flat Screen TVsEnding Inventory Target/units 7,000Unit of Measure 100 units
Past Periods Forecasted Periods
January February March April May June July August Sept
SALES FORECAST 8,000 8,000 8,000 8,250 8,500 8,500 9,000 9,000 9,250
ACTUAL SALES 7,500 7,800
PRODUCTION RATE 8,000 8,000 8,771 8,771 8,771 8,771 8,771 8,771 8,771
ACTUAL RATE 7,800 7,750
INVENTORY PLAN 6,000 6,200 6,871 7,393 7,664 7,936 7,707 7,479 7,000
ACTUAL INVENTORY 5,500 6,100
Production rate = (7,000 – 6,100) + 60,500
7 months= 8,771 (rounded)

Chapter 6dp&c6-42
Chase Production Plan Graphic
Months
Quantity
5,000
6,000
7,000
8,000
9,000
10,000
March April May June July August Sept
Forecast
Prod Plan
Inv Plan

Chapter 6dp&c6-43
Chase Production Plan Example
Product Family Flat Screen TVsUnit of Measure 100 units
Past Periods Forecasted Periods
January February March April May June July August Sept
SALES FORECAST 7,000 8,000 8,000 8,250 8,500 8,500 9,000 9,000 9,250
ACTUAL SALES 6,910 7,600
PRODUCTION RATE 7,000 8,000 8,000 8,250 8,500 8,500 9,000 9,000 9,250
ACTUAL RATE 7,800 7,750
INVENTORY PLAN 7,000 7,400 7,050 7,050 7,050 7,050 7,050 7,050 7,050
ACTUAL INVENTORY 6,900 7,050

Chapter 6dp&c6-44
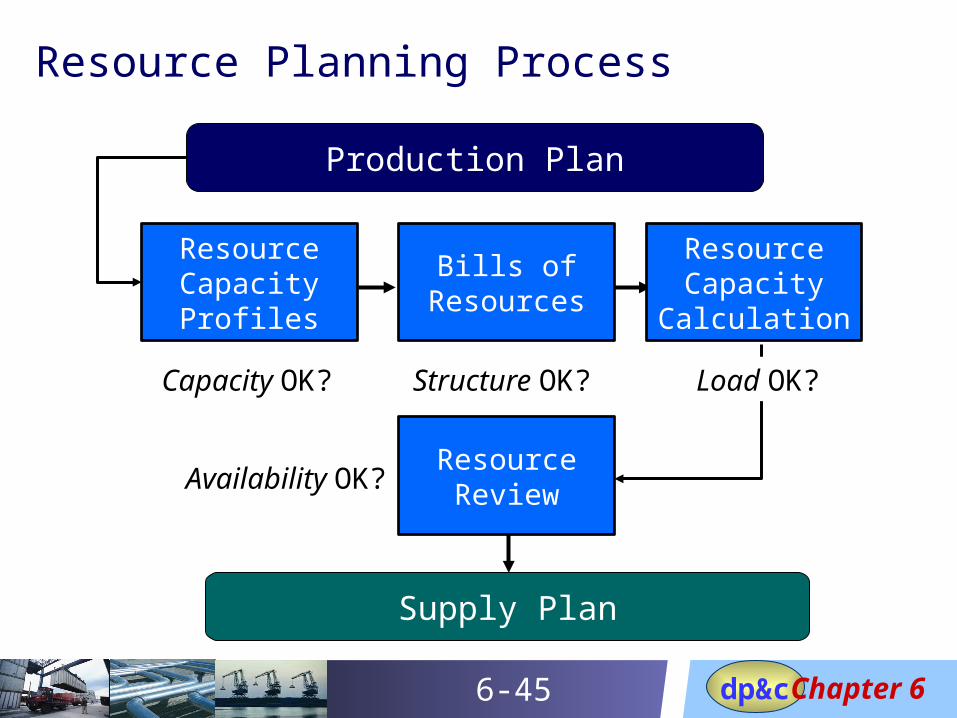
Resource Planning – Definition
Capacity planning conducted at the business plan level.
The process of establishing, measuring, and adjusting
limits or levels of long-range capacity. Resource planning
is normally based on the production plan but may be
driven by higher level plans beyond the time horizon for
the production plan (e.g., the business plan). It
addresses those resources that take long periods of time
to acquire. Resource planning decisions always require
top management approval.
Chapter 6dp&c6-45
Resource Planning Process
Capacity OK?
Production Plan
Supply Plan
Structure OK?
Availability OK?
Load OK?
Resource Capacity Profiles
Bills of Resources
Resource Capacity
Calculation
Resource Review

Chapter 6dp&c6-46
Resource Profile and Bill of Resources
Resource Profile:
Bill of Resources:
RESOURCE PROFILE UNIT OF MEASURE
Monthly Capacity
MACHINE SHOP HOURS 19,000WELDING LINE HOURS 27,500ASSEMBLY A HOURS 30,000ASSEMBLY B HOURS 9,250FINISHING LINE Cu Ft 3,600.0
BILL OF RESOURCES UNIT OF MEASURE
Product Family A
Product Family B
Product Family C
Product Family D
MACHINE SHOP HOURS 5 5 4 3WELDING LINE HOURS 3 7 8 5ASSEMBLY A HOURS 6 8 5 6ASSEMBLY B HOURS 2 2 2 2FINISHING LINE Cu Ft 0.5 0.5 1.0 1.5
Chapter 6dp&c6-47
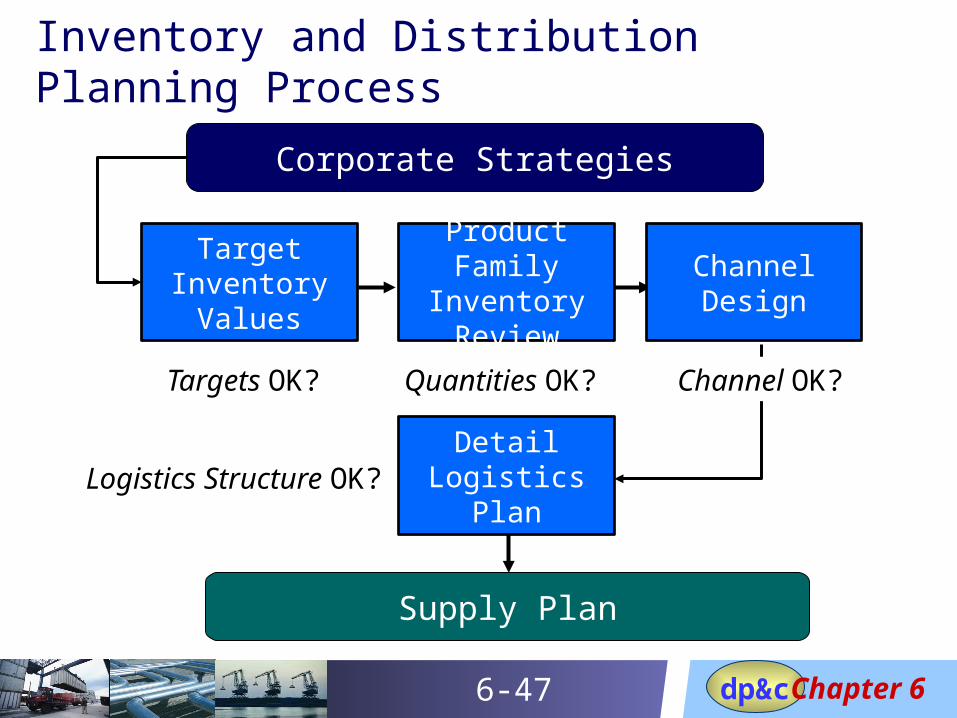
Inventory and Distribution Planning Process
Targets OK?
Corporate Strategies
Supply Plan
Quantities OK?
Logistics Structure OK?
Channel OK?
Target Inventory
Values
Product Family Inventory Review
Channel Design
Detail Logistics Plan

Chapter 6dp&c6-48
Inventory Planning Grid Review
Product Family Flat Screen TVsOpening Balanace 700Target inventory: March 500 June 500 Sept 500 Dec 500
Maximum Inventory 1,100Minimum Inventory 250
Original Inventory Plan
January February March April May June July August SeptNext 3 Months
12 MO TOTAL
SALES FORECAST 13,400 13,200 12,900 12,500 12,100 11,800 11,400 11,100 12,300 36,000 146,700
PRODUCTION PLAN 13,100 13,100 13,100 12,133 12,133 12,133 11,600 11,600 11,600 36,000 146,500
INVENTORY PLAN 400 300 500 133 167 500 700 1200 500 500
TARGET INVENTORY 500 500 500 500
MIN VIOLATION
MAX VIOLATION
Product Family Flat Screen TVsOpening Balanace 700Target inventory: March 500 June 500 Sept 500 Dec 500
Maximum Inventory 1,100Minimum Inventory 250
Original Inventory Plan
January February March April May June July August SeptNext 3 Months
12 MO TOTAL
SALES FORECAST 13,400 13,200 12,900 12,500 12,100 11,800 11,400 11,100 12,300 36,000 146,700
PRODUCTION PLAN 13,100 13,100 13,100 12,133 12,133 12,133 11,600 11,600 11,600 36,000 146,500
INVENTORY PLAN 400 300 500 133 167 500 700 1200 500 500
TARGET INVENTORY 500 500 500 500
MIN VIOLATION OK OK OK MIN MIN OK OK OK OK OK
MAX VIOLATION OK OK OK OK OK OK OK MAX OK OK
Inventory Minimum Balance Violations

Chapter 6dp&c6-49
Warehouse Capacity Analysis
Product Family Flat Screen TVsOpening Ballance 1600.0Weight/Unit (lbs.) 8.0Quantity per Pallet 5Cube Space per Pallet (feet) 48
Current Year's Warehouse Plan
January February March April May June July August SeptNext 3 Months
12 MO TOTAL
INVENTORY PLAN 2,400 2,000 3,000 3,000 3,000 4,000 4,000 4,000 3,000 8,000WEIGHT (lbs.) 19,200 16,000 24,000 24,000 24,000 32,000 32,000 32,000 24,000 64,000 291,200CUBE SPACE (feet) 23,040 19,200 28,800 28,800 28,800 38,400 38,400 38,400 28,800 76,800 349,440PALLETS 480 400 600 600 600 800 800 800 600 1,600 7,280CAPACITY/Cube (feet) 40,000 40,000 40,000 40,000 40,000 40,000 40,000 40,000 40,000 120,000 480,000PERCENT USAGE 57.6% 48.0% 72.0% 72.0% 72.0% 96.0% 96.0% 96.0% 72.0% 64.0% 72.8%

Chapter 6dp&c6-50
Inventory Management Basics
Chapter 6
Demand Management
Balancing the Demand and Supply Plans
Chapter 6dp&c6-51
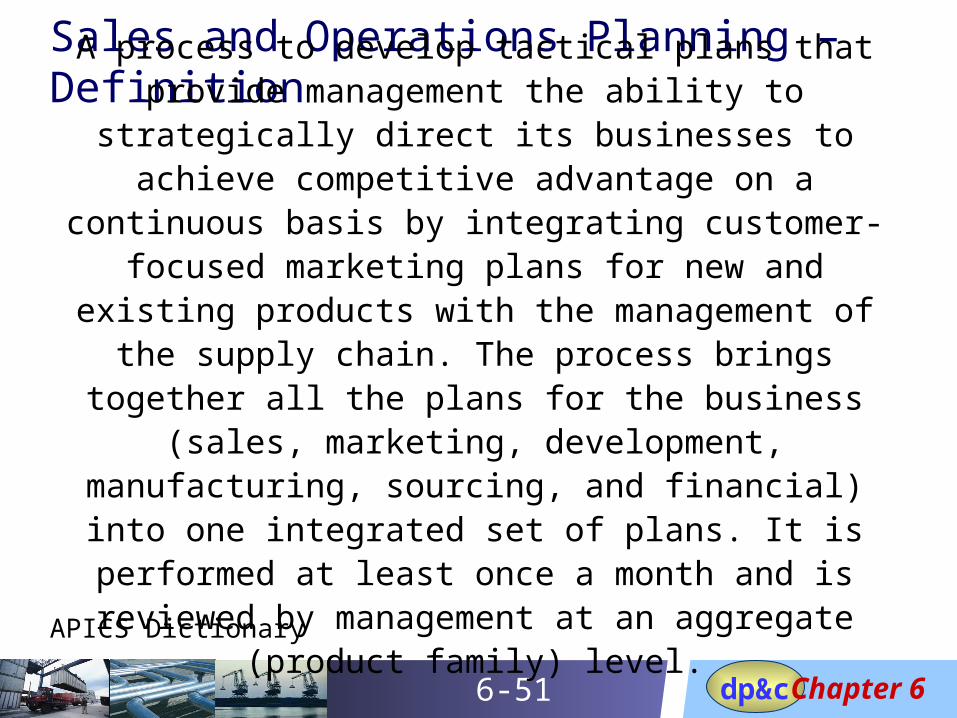
Sales and Operations Planning – Definition
A process to develop tactical plans that provide management the ability to strategically direct its
businesses to achieve competitive advantage on a continuous basis by integrating customer-focused
marketing plans for new and existing products with the management of the supply chain. The process brings
together all the plans for the business (sales, marketing, development, manufacturing, sourcing, and financial) into one integrated set of plans. It is performed at least once a month and is reviewed by management at an aggregate
(product family) level.
APICS Dictionary

Chapter 6dp&c6-52
S&OP - Characteristics It is a formal business process used by the firm’s leadership team to connect
corporate business planning with tactical planning, driving master scheduling and distribution planning
It provides managers with an opportunity to review and update the strategic business plan to meet organizational and marketplace changes as they occur through time
It ensures that the demand and supply plans are realistic, synchronized, and support the business plan
It provides sales and marketing with an opportunity to periodically review and revise demand plans so that they are closely synchronized with actual sales occurring in the marketplace
It enables operations managers to review and revise production and inventory plans that support the demand plan while optimizing productive and financial assets
It uses the aggregate data of sales, production, and inventory along with aggregate planning time buckets and product families to ensure greater planning accuracy. S&OP rarely uses individual products

Chapter 6dp&c6-53
S&OP – A Balancing Act
S&OPProcess
Demand Supply
DemandForecasts
ActualOrders
SupplyOrders
Resources/CapacityInventory

Chapter 6dp&c6-54
Demand and Supply Volume and Mix
Business Plan
VOLUMES&OP
DemandPlan
SupplyPlan
PRODUCT MIXMaster Scheduling
MRP
Plant and Supplier Scheduling
FORECASTING&
DEMAND
MGMT
RESOURCE
PLANNING
DEMAND
SUPPLY

Chapter 6dp&c6-55
S&OP Foundation Components
S&OP
S&OP Teams and
RolesProduct Families
Historical Data
Demand Plan
Grids and Graphs
Supply Plan

Chapter 6dp&c6-56
S&OP Teams and Roles
Executive S&OP team. This team is composed of the senior executives of the firm. The primary role of this team is to provide strong leadership and commitment and making final demand and supply decisions
Executive sponsor. This individual is usually a member of the executive team assigned to champion the S&OP process. The primary role of the executive sponsor is to set clear performance expectations for top management, authorize necessary resources, and clear obstacles hindering an effective S&OP process
S&OP process owner. This individual chairs the S&OP team meetings. Responsibilities include maintaining the S&OP implementation project schedule, manage the list of issues arising from the team meetings, assist in issue resolution, and report problems to the executive S&OP team

Chapter 6dp&c6-57
S&OP Teams and Roles (cont.)
Demand planning team. This team is composed of managers responsible for demand management product analysis, customer service, sales administration, marketing, and account managers, as well as forecast analysts, new product coordinators, field sales, and the S&OP process owner The primary role of this team is to generate the new management forecast for the next fifteen to eighteen months into the future
Supply planning team. This team is composed of managers responsible for plant management, purchasing, materials, production control, logistics, quality, accounting and distribution as well as the master scheduler, new products coordinator, and the S&OP process owner. The primary role of this team is to generate the production and inventory plans
Chapter 6dp&c6-58
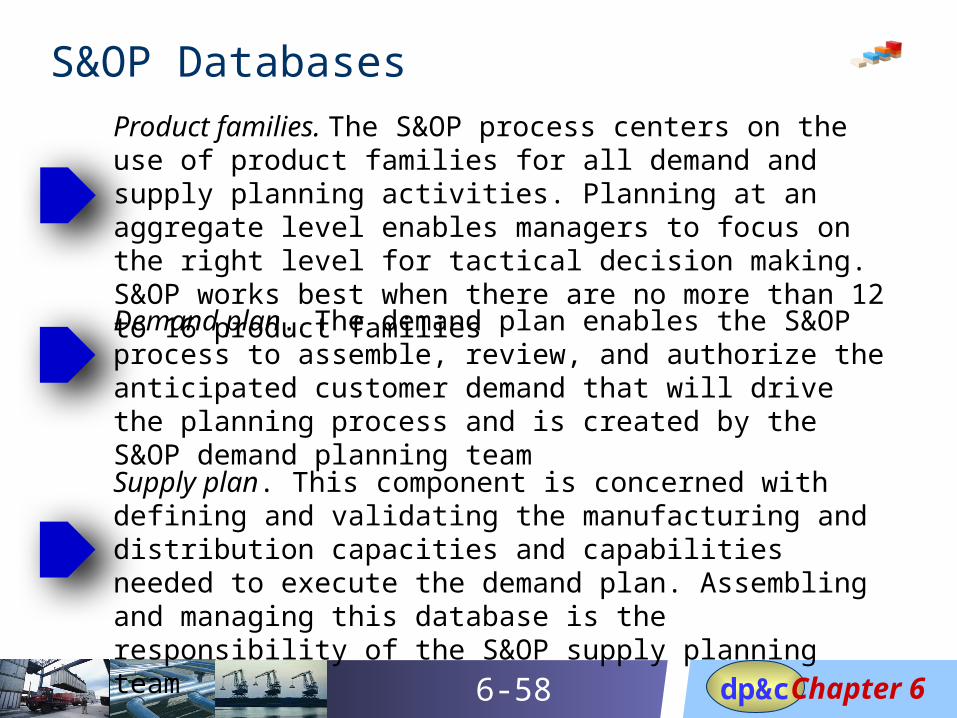
S&OP Databases
Product families. The S&OP process centers on the use of product families for all demand and supply planning activities. Planning at an aggregate level enables managers to focus on the right level for tactical decision making. S&OP works best when there are no more than 12 to 16 product families
Demand plan. The demand plan enables the S&OP process to assemble, review, and authorize the anticipated customer demand that will drive the planning process and is created by the S&OP demand planning team
Supply plan. This component is concerned with defining and validating the manufacturing and distribution capacities and capabilities needed to execute the demand plan. Assembling and managing this database is the responsibility of the S&OP supply planning team

Chapter 6dp&c6-59
S&OP Databases (cont.)
Historical data. This component is concerned with the collection and management of the firm's historical forecast, sales, production, and transaction database histories. Assembling and ensuring the accuracy of these databases is the responsibility of all individuals in the company

Chapter 6dp&c6-60
S&OP Planning Grids – MTS
FINISHED GOODS INVENTORY
PLAN 1000 1000 1050 1100 900 1100 1300 1450 1600 1750
ACTUAL 950 1000 800 800
DIFF. MO -50 0 -250 -300
CUM -50 -50 -300 -600
DIFF. % -5.0% -2.5% -9.8% -14.5%
DAYS ON HAND 9.7 9.1 7.4 7.6 8.6 10.5 12.1 13.5 14.9
PRODUCTION
PLAN 2,000 2,000 2,050 2,100 2,200 2,300 2,300 2,300 2,300 2,300
ACTUAL 1,950 2,000 2,000 2,150
DIFF. MO -50 0 -50 50
CUM -50 -50 -100 -50
DIFF. % -2.50% -1.25% -1.65% -0.61%
Past PeriodsCurrent Period
Forecasted Periods
SALES January February March April May June July August Sept OctFORECAST 2,000 2,000 2,000 2,050 2,100 2,100 2,100 2,150 2,150 2,150
ACT SALES 2,150 1,950 2,200 2,150
DIFF. MO 150 -50 200 100
CUM 150 100 300 400
DIFF. % 7.50% 2.50% 5.00% 4.97%
Chapter 6dp&c6-61
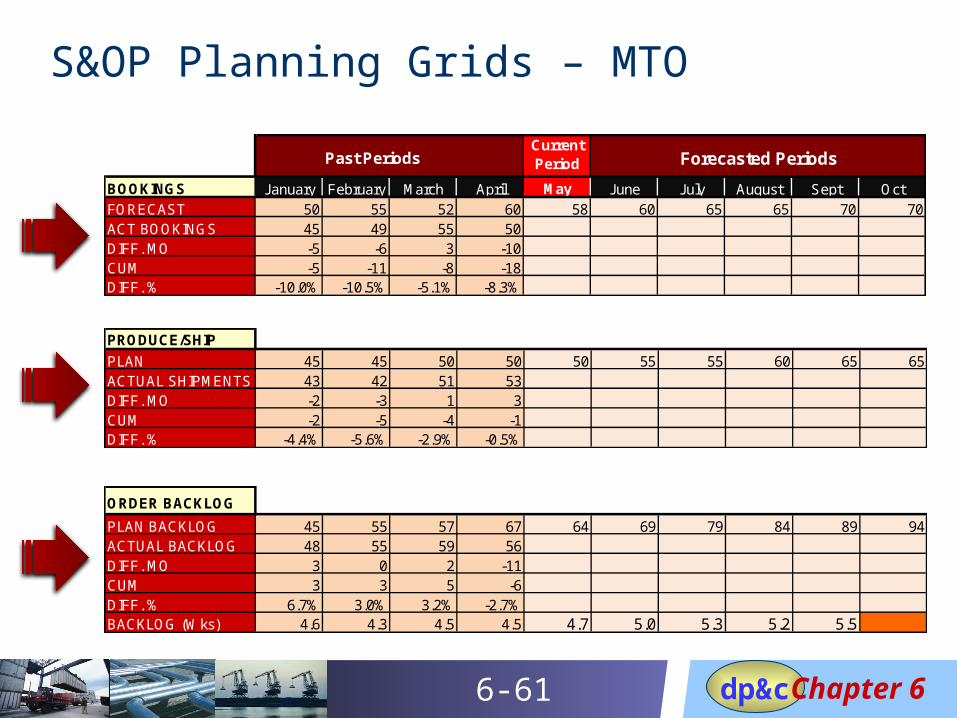
S&OP Planning Grids – MTO
Past PeriodsCurrent Period Forecasted Periods
BOOKINGS January February March April May June July August Sept OctFORECAST 50 55 52 60 58 60 65 65 70 70ACT BOOKINGS 45 49 55 50DIFF. MO -5 -6 3 -10CUM -5 -11 -8 -18DIFF. % -10.0% -10.5% -5.1% -8.3%
PRODUCE/SHIP
PLAN 45 45 50 50 50 55 55 60 65 65ACTUAL SHIPMENTS 43 42 51 53DIFF. MO -2 -3 1 3CUM -2 -5 -4 -1DIFF. % -4.4% -5.6% -2.9% -0.5%
ORDER BACKLOG
PLAN BACKLOG 45 55 57 67 64 69 79 84 89 94ACTUAL BACKLOG 48 55 59 56DIFF. MO 3 0 2 -11CUM 3 3 5 -6DIFF. % 6.7% 3.0% 3.2% -2.7%BACKLOG (Wks) 4.6 4.3 4.5 4.5 4.7 5.0 5.3 5.2 5.5

Chapter 6dp&c6-62
Inventory Management Basics
Chapter 6
Demand Management
Monthly S&OP Process

Chapter 6dp&c6-63
Monthly S&OP Process
S&OP data gathering
Step 1
Demand planning
Step 2Supply planning
Step 3
Pre-Executive S&OP meeting
Step 4
Executive S&OP Meeting
Step 5
Actual sales, forecast, backlog supply, and inventory data
S&OP grid – first pass
Resource plan grid – second pass
Scenarios, issues, recommendations for meeting
Decisions & updated S&OP plan – S&OP grid final pass
S&OP grid – third pass

Chapter 6dp&c6-64
• Update previous month’s data files
• Generate information for new statistical forecast by sales and marketing
• Share information with appropriate people
• Automate feeds to S&OP planning grids
Step 1 – Data Gathering

Chapter 6dp&c6-65
• Demand Management team reviews demand information and forecast variances
• Update the existing statistical forecast
• Forecast by product families
• Forecast includes any product lifecycle changes for the time frame covered by planning horizon
• Generate the S&OP MTS forecast
• Create first pass MTS S&OP grids
• Executive authorization
Step 2 – Demand Planning

Chapter 6dp&c6-66
• Supply management team reviews supply performance to plan
• First-pass MTS and MTO grids reviewed against current family-level capacity plans for possible change
• Adjust supply plan to meet inventory/backlog targets
• Run resource requirements planning and readjust the supply plan where needed
• Develop alternative scenarios for resource problems needing review at S&OP pre-meeting
• Create second pass S&OP resource grids
Step 3 – Supply Planning

Chapter 6dp&c6-67
Exercise 6-2 Resource Requirements Calculation
Production and ForecastProduct Family Month -1 Month 1 Month 2 Month 3 Month 4 Month 5 TotalPC-1500 150 150 165 175 175 175 990PC-1600 110 105 105 105 110 110 645PC-1700 100 105 105 105 105 105 625
Total 360 360 375 385 390 390 2,260
Step 1: Create grid of past production and new forecast
Step 2: Create load profile for each product familyProduct Load Profile
Product Family Work Center K200-1 AssemblyPC-1500 1.5 hrs/unitPC-1600 1.8 hrs/unitPC-1700 2 hrs/unit

Chapter 6dp&c6-68
Exercise 6-2 Resource Requirements (cont.) Calculation
Step 3: Calculate the product family resource profile
Step 4: Create resource requirements planning (RRP) report
Resource Profile (in standard hours)Product Family Month -1 Month 1 Month 2 Month 3 Month 4 Month 5 Total/hrsPC-1500 225 225 247.5 262.5 262.5 262.5 1,485PC-1600 198 189 189 189 198 198 1,161PC-1700 200 210 210 210 210 210 1,250
Total 623 624 646.5 661.5 670.5 670.5 3,896
RRP Report
Work Center K200-1 Month -1 Month 1 Month 2 Month 3 Month 4 Month 5 Total/hrsStd hrs required 623 624 646.5 661.5 670.5 670.5 3,896Capacity avail. 625 625 625 625 625 625 3,750Over/under load 2 1 -21.5 -36.5 -45.5 -45.5 -146Cum over/under 2 3 -18.5 -55 -100.5 -146 -315

Chapter 6dp&c6-69
Exercise 6-2 Resource Requirements (cont.) Calculation
600605610615620625630635640645650655660665670675680
Month -1 Month 1 Month 2 Month 3 Month 4 Month 5
623 624
646.5
661.5
670.5 670.5
Std hrs required
Capacity avail.
Step 5: Graph RRP results

Chapter 6dp&c6-70
Step 4 – Pre-Executive S&OP Meeting
• Initial set of performance goals and metrics
• Explanation of data gathering process
• Updated financial view of the S&OP plan
• Decisions/recommendations for each product family
• Decisions/recommendations for each resource requiring change
• Areas where a consensus could not be reached
• Explanation of the S&OP grids and graphs – 3rd pass
• Explanation of the preparation for the Executive Meeting: topics, flow, roles, responsibilities, agenda
Chapter 6dp&c6-71
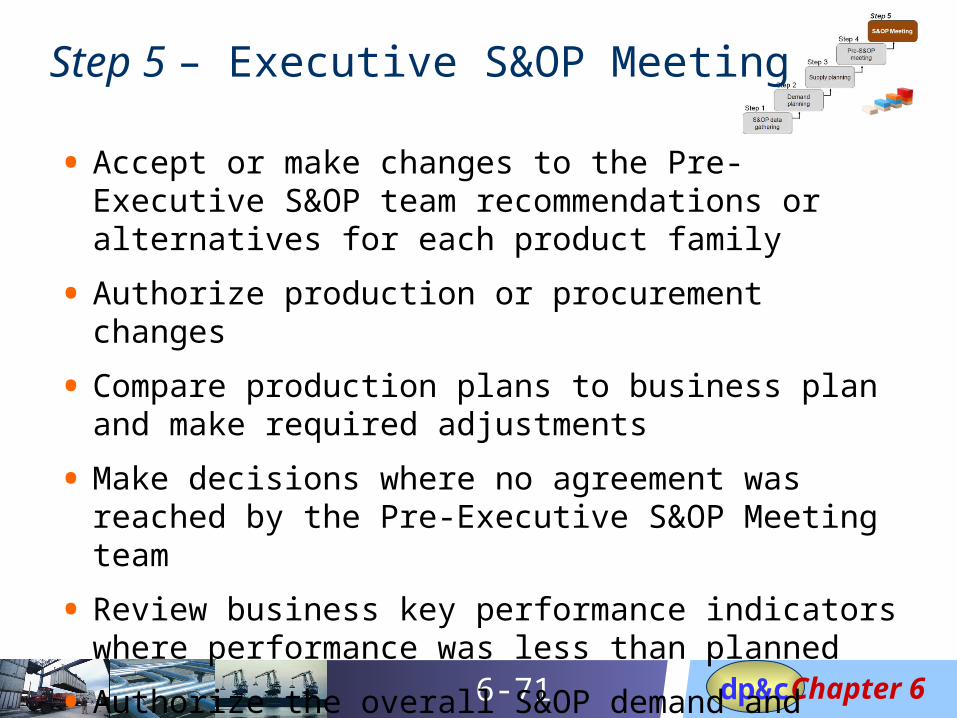
Step 5 – Executive S&OP Meeting
• Accept or make changes to the Pre-Executive S&OP team recommendations or alternatives for each product family
• Authorize production or procurement changes
• Compare production plans to business plan and make required adjustments
• Make decisions where no agreement was reached by the Pre-Executive S&OP Meeting team
• Review business key performance indicators where performance was less than planned
• Authorize the overall S&OP demand and supply plan
Chapter 6dp&c6-72
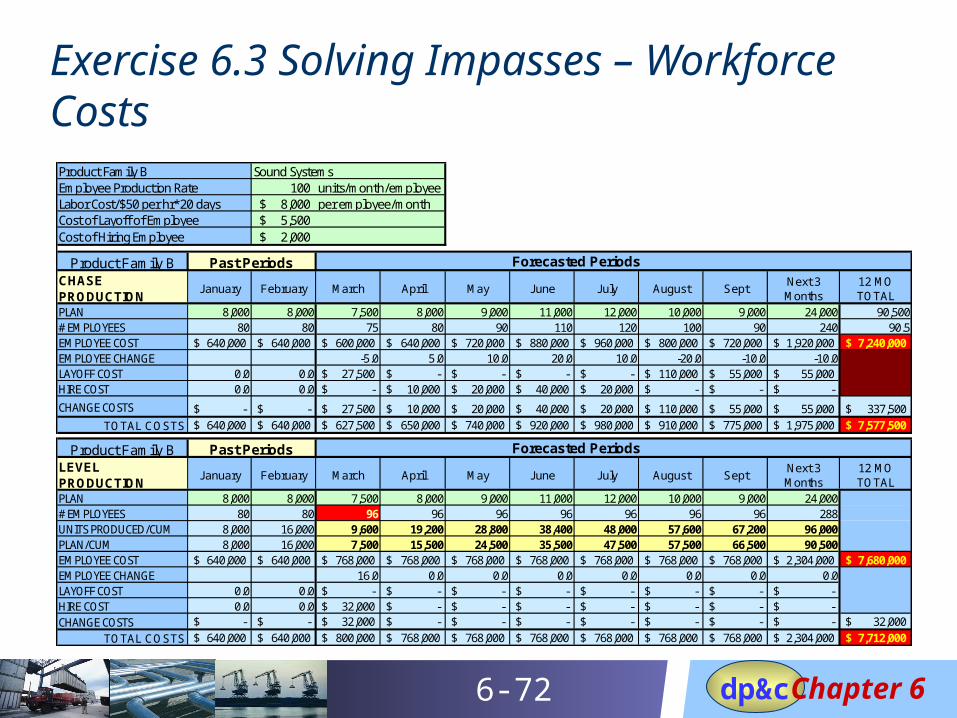
Exercise 6.3 Solving Impasses – Workforce Costs
Product Family B Sound SystemsEmployee Production Rate 100 units/month/employeeLabor Cost/$50 per hr*20 days 8,000$ per employee/monthCost of Layoff of Employee 5,500$ Cost of Hiring Employee 2,000$
Product Family B Past Periods Forecasted PeriodsCHASE PRODUCTION
January February March April May June July August SeptNext 3 Months
12 MO TOTAL
PLAN 8,000 8,000 7,500 8,000 9,000 11,000 12,000 10,000 9,000 24,000 90,500# EMPLOYEES 80 80 75 80 90 110 120 100 90 240 90.5EMPLOYEE COST 640,000$ 640,000$ 600,000$ 640,000$ 720,000$ 880,000$ 960,000$ 800,000$ 720,000$ 1,920,000$ 7,240,000$ EMPLOYEE CHANGE -5.0 5.0 10.0 20.0 10.0 -20.0 -10.0 -10.0LAYOFF COST 0.0 0.0 27,500$ -$ -$ -$ -$ 110,000$ 55,000$ 55,000$ HIRE COST 0.0 0.0 -$ 10,000$ 20,000$ 40,000$ 20,000$ -$ -$ -$
CHANGE COSTS -$ -$ 27,500$ 10,000$ 20,000$ 40,000$ 20,000$ 110,000$ 55,000$ 55,000$ 337,500$
TOTAL COSTS 640,000$ 640,000$ 627,500$ 650,000$ 740,000$ 920,000$ 980,000$ 910,000$ 775,000$ 1,975,000$ 7,577,500$
Product Family B Past Periods Forecasted PeriodsLEVEL PRODUCTION
January February March April May June July August SeptNext 3 Months
12 MO TOTAL
PLAN 8,000 8,000 7,500 8,000 9,000 11,000 12,000 10,000 9,000 24,000# EMPLOYEES 80 80 96 96 96 96 96 96 96 288UNITS PRODUCED/CUM 8,000 16,000 9,600 19,200 28,800 38,400 48,000 57,600 67,200 96,000PLAN/CUM 8,000 16,000 7,500 15,500 24,500 35,500 47,500 57,500 66,500 90,500EMPLOYEE COST 640,000$ 640,000$ 768,000$ 768,000$ 768,000$ 768,000$ 768,000$ 768,000$ 768,000$ 2,304,000$ 7,680,000$ EMPLOYEE CHANGE 16.0 0.0 0.0 0.0 0.0 0.0 0.0 0.0LAYOFF COST 0.0 0.0 -$ -$ -$ -$ -$ -$ -$ -$ HIRE COST 0.0 0.0 32,000$ -$ -$ -$ -$ -$ -$ -$ CHANGE COSTS -$ -$ 32,000$ -$ -$ -$ -$ -$ -$ -$ 32,000$
TOTAL COSTS 640,000$ 640,000$ 800,000$ 768,000$ 768,000$ 768,000$ 768,000$ 768,000$ 768,000$ 2,304,000$ 7,712,000$

Chapter 6dp&c6-73
• Establishes operational plans consistent with the business plan
• Continually updates the production, financial, and sales plan
• Provides for cross-functional planning
• Establishes regular meetings with senior executives to resolve demand versus supply trade-offs
• Checks availability of resources to validate the production plan
• Increases teamwork and collaborative skills
Benefits of the S&OP Process

Chapter 6dp&c6-74
Chapter 6
End of Session
“Education in Pursuit of Supply Chain Leadership”
Chapter 6dp&c