Chapter 6 DATA ANALYSIS AND...
54
263 Chapter 6 DATA ANALYSIS AND INTERPRETATION 6.1. Introduction In the present world powerful new technologies are used to advance sustainable development for all the people. E-Governance is one of the most plausible engines of development for people and societies across the world. The development of new technologies contributed to improvement in political activities. It encouraged individual participation in political activities. It is also argued that technology shapes political structures by promoting particular values. Political parties and politicians are now shifting to an ICT enabled environment of politics. In the case of local governance in Kerala state, the digital transformation of governance process and procedures is imminent. However this transformation will be possible only with the support of political leaders. They are to motivate and gear up the public administration innovations in the field of E-Governance. This is possible only if the leaders are well familiarised with the operations and potentials of technology. Their perception and acceptance of E-Governance are the foundations of overall transformation of society. In this context the present chapter examines the Acceptance and Perception of E-Governance among the elected representatives of local bodies in Kannur district, Kerala. The chapter is divided into five sections, 1. Sample Design 2. Socio-Economic Profile of Respondents 3. Acceptance of E-Governance 4. Perception of E-Governance
Transcript of Chapter 6 DATA ANALYSIS AND...

263
Chapter 6
DATA ANALYSIS AND INTERPRETATION
6.1. Introduction
In the present world powerful new technologies are used to advance
sustainable development for all the people. E-Governance is one of the most
plausible engines of development for people and societies across the world.
The development of new technologies contributed to improvement in
political activities. It encouraged individual participation in political
activities. It is also argued that technology shapes political structures by
promoting particular values. Political parties and politicians are now shifting
to an ICT enabled environment of politics.
In the case of local governance in Kerala state, the digital
transformation of governance process and procedures is imminent. However
this transformation will be possible only with the support of political leaders.
They are to motivate and gear up the public administration innovations in the
field of E-Governance. This is possible only if the leaders are well familiarised
with the operations and potentials of technology. Their perception and
acceptance of E-Governance are the foundations of overall transformation of
society. In this context the present chapter examines the Acceptance and
Perception of E-Governance among the elected representatives of local bodies
in Kannur district, Kerala.
The chapter is divided into five sections,
1. Sample Design
2. Socio-Economic Profile of Respondents
3. Acceptance of E-Governance
4. Perception of E-Governance
264
5. Barriers to the Acceptance of E-Governance
6. Conclusion
6.1.1 Sample Design
The study was conducted in Kannur District of Kerala state. The
respondents were the elected representatives of Gram Panchayats and
Municipalities in Kannur district. There are 81 Gram Panchayats and six
Municipalities in the district. In the case of municipalities samples were taken
from all the six municipalities. Gram Panchayats were divided on the basis of
geography and samples were taken from East, West, South, North and Central
parts of the district. In this effort 51% of the Gram Panchayats were covered.
For sampling purpose, a multistage sampling method was adopted.
Initially, quota was assigned to Municipalities and Panchayats. From each
category, further quota was designed on the basis of gender. This was done in
tune with the reservation of seats in the local bodies. The individual samples
were taken according to stratified random sampling technique.. Thus the sample
contains 159 elected representatives of Local Bodies in the district. The data
were collected from the respondents during July 2011 to November 2011.
The study made use of questionnaires, field observation and
interviews. The respondents were provided with a questionnaire to gauge
their perception and acceptance of E-Governance. Acceptance of
E-Governance is measured in terms of the possession of tools and usage
patterns. It indicates the individual usage level in personal and public life.
Perception is defined in terms of attitudes and orientations measured with
psychological scales.
Government officials and subject experts in the field of Information
Technology and local governance were consulted before finalizing the
questionnaire. The workings of certain government initiatives that make use
265
of E-Governance were also examined. The results were subjected to analysis
using statistical techniques and tools including averages, dispersion,
percentages, independent sample t-test, one way ANOVA and paired sample
t-test. For this purpose SPSS 16.0 version was used. While analyzing the
data the confidence level was maintained at 95% level.
The major objectives of the analysis are,
1. To examine the level of acceptance of E-Governance among the
elected representatives of Local Bodies in Kannur District
2. To assess the perception of E-Governance among the elected
representatives of Local Bodies in Kannur District.
3. To identify the socio-economic characteristics of respondents and to
assess their acceptance and perception of E-Governance with respect
to selected socio-economic factors.
4. To find out the barriers to the acceptance of E-Governance among
the elected representatives of Local Bodies in Kannur District and to
give suggestions for improvement.
The general Hypothesis of the study are,
1. The acceptance of E-Governance (reflected in actual usage and
possession) among the elected representatives of Local Bodies in
Kannur District is low.
2. There is significant change in the acceptance of E-Governance
among elected representatives of Local Bodies in Kannur District
after getting elected.
3. There is significant change in the acceptance of E-Governance
among elected representatives of Local Bodies in Kannur District in
266
relation to selected socio-demographic factors- domicile status, sex,
religion, age, political affiliation, education and income.
4. There is significant change in the perception of E-Governance among
elected representatives of Local Bodies in Kannur District in relation
to selected socio-demographic factors- age, sex, domicile status,
religion, political affiliation, education, official status, term in office,
income, profession and degree of political engagement.
5. The elected representatives of Local Bodies in Kannur District
possess a high perception about the use of E-Governance.
6.2. Socio-Economic Profile of Respondents
The sample contained 78 males (49%) and 81 (51%) female
respondents. The selection was done according to the new Panchayat Raj Act
which provides for 50% reservation to women in local bodies in the state1.
Among the respondents 96.2% are married and remaining 3.8% are
unmarried. Majority of the respondents are from rural areas (84.9%). Only
15.1% belong to urban settings.
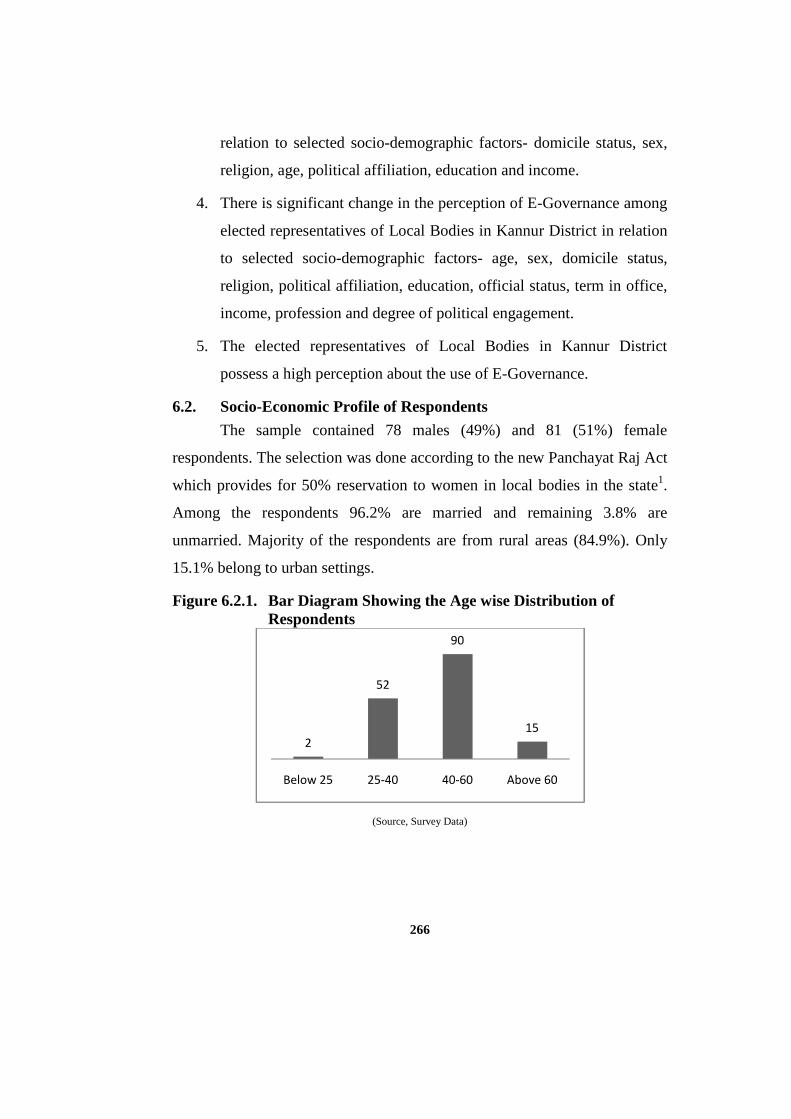
Figure 6.2.1. Bar Diagram Showing the Age wise Distribution of Respondents
(Source, Survey Data)
2
52
90
15
Below 25 25-40 40-60 Above 60

267
With respect to the age range of the respondents, it was found that
majority of the respondents belong to the age group 40-60 (56.6%). The age
group 25-40 comes second with 32.6 % and age group above 60 comes with
9.5% respondents. There are only 1.3% respondents in the age group below 25.
Table 6.2.1. Socio- Economic Profile of Respondents (n=159)
Profile Frequency Percentage
Sex Male 78 49
Female 81 51
Marital Status Married 153 96.2
Unmarried 6 3.8
Domicile Status Rural 135 84.9
Urban 24 15.1
Age Below 25 2 1.3
Between 25-40 52 32.6
Between 40-60 90 56.6
Above 60 15 9.5
Education- Primary 3 1.9
Secondary 25 15.7
Degree 114 71.7
PG and Professional 17 10.7
Religion-Hindu 111 69.8
Muslim 34 21.4
Christian 14 8.8
Monthly Income range 1000- 5000 75 47.2
5000-10000 37 23.3
Above 10000 47 29.5
Profession, Pensioner 24 15.1
Government Sector 26 16.4
Business 29 18.2
Private Sector 7 4.4
Kooli 8 5.1
House Wife 32 20.1
Farmer 21 13.2
Unemployed 12 7.5
(Source, Survey Data)

The majority of the respondents (71.7%) are educated in the range
higher secondary to Degree.
SSLC. 10.7% of r
degrees. 1.9% of the respondents
From the data it is evident that the respondents possess high educational
qualifications and thu
positive indicator in the matter of E
government.
Figure 6.2.
(Source, Survey Data)
It was found that majority (69.8%) of the respondents belong to
Hindu community. Muslim Community constituted 21.4% of respondents
and Christians 8.8%.
respondents belong to the 1000
respondents possess income above 10000.
representatives are in the 5000
financial status is not a major barrier in accessing technologies for the
respondents.
268
The majority of the respondents (71.7%) are educated in the range
higher secondary to Degree. 15.7% of the respondents are educated up
SSLC. 10.7% of respondents possess post graduation or professional
1.9% of the respondents were educated only up to primary level.
From the data it is evident that the respondents possess high educational
qualifications and thus are well tuned for innovations and changes. It is a
positive indicator in the matter of E-Governance initiatives in local
2.2. Religion wise Distribution of Respondents
(Source, Survey Data) *Percentages rounded to the near figure
It was found that majority (69.8%) of the respondents belong to
Hindu community. Muslim Community constituted 21.4% of respondents
and Christians 8.8%. From the survey it was found that majority of the
respondents belong to the 1000-5000 income bracket (47.2%). 29.5% of the
respondents possess income above 10000. Among the samples
representatives are in the 5000-1000 income bracket. It is inferred that
financial status is not a major barrier in accessing technologies for the
70%
21%
9%
Hindu
Muslim
Christian
The majority of the respondents (71.7%) are educated in the range of
are educated up to
or professional
up to primary level.
From the data it is evident that the respondents possess high educational
s are well tuned for innovations and changes. It is a
Governance initiatives in local
espondents*
figure)
It was found that majority (69.8%) of the respondents belong to the
Hindu community. Muslim Community constituted 21.4% of respondents
From the survey it was found that majority of the
bracket (47.2%). 29.5% of the
Among the samples 23.3% of the
1000 income bracket. It is inferred that
financial status is not a major barrier in accessing technologies for the

Figure 6.2.3 Income wise
(Source, Survey Data)
Majority of the respondents
place goes to those engaged in
respondents belong to the government sector which includes aided
and co-operative sector. Pensioners constitute 15.2% of
13.2% of the respondents are farmers while 4.4 %
private sector. 5.1% respondents work as Kooli (
of the respondents are unemployed.
5000-10000
23%
Above10000
30%
269
Income wise Distribution of Respondents*
(Source, Survey Data) *Percentages rounded to the near figure
Majority of the respondents are house wives (20.1%). The second
those engaged in business, with 18.2% respondents.16.4%
respondents belong to the government sector which includes aided schools
operative sector. Pensioners constitute 15.2% of the respondents.
13.2% of the respondents are farmers while 4.4 % are employed in
5.1% respondents work as Kooli (manual labour) while 7.5%
of the respondents are unemployed.
1000-5000
47%
The second
with 18.2% respondents.16.4%
schools
respondents.
are employed in the
) while 7.5%

270
Table 6.2.2. Political Profile of Respondents (n=159)
Profile Frequency Percentage
Party- UDF 72 45.2
LDF 84 52.9
Others 3 1.9
Official Status- Ordinary Member 90 56.6
Official 69 43.4
Term- First term in Office 116 72.9
Second term 30 18.9
Third term 10 6.3
Above Three terms 3 1.9
Political Activity -Low 5 3.1
Medium 11 6.9
High 82 51.6
Very High 61 38.4
(Source, Survey Data)
The majority of the respondents belong to LDF (52.9%). UDF
respondents constitute 45.2% of sample population. Others constitute 1.9% of
the sample. Others include respondents from BJP and independents. Among the
respondents majority were ordinary members (56.6%). 43.4% respondents were
officials in the local body. It included President/ Chairman/ Chairperson,
Vice President/Vice Chairman/Vice Chairperson and standing committee
President/Chairperson.

Figure 6.2.4
From the survey it was found that 72.9% of the respondents were
new comers to local body offices. 18.9% of respondents were
position for the second term.
of the respondents were occupying the seat for more than three times.
Another area of political profile was
purpose of this study the term
party politics and public activities.
political engagement level.
highly active in political life (51.6%).
highly active in public life. They occupy official party positions. 3.1% of the
respondents report low level of
medium level of political engagement
6.2.1. ICT Tools and Usage P
For the purpose of the present study, acceptance of E
measured in terms of possession of tools and
72
UDF
271
4. Political Affiliation of Respondents
(Source, Survey Data)
From the survey it was found that 72.9% of the respondents were
new comers to local body offices. 18.9% of respondents were occupying the
position for the second term. 6.3% of the samples were third timers and 1.9%
of the respondents were occupying the seat for more than three times.
Another area of political profile was degree of political engagement.
tudy the term political engagement was defined in terms of
party politics and public activities. The respondents were asked to rate their
level. It is found that majority of the respondents are
highly active in political life (51.6%). 38.4% of respondents were very
active in public life. They occupy official party positions. 3.1% of the
respondents report low level of political engagement and 6.9% reports
political engagement.
Tools and Usage Patterns
For the purpose of the present study, acceptance of E-Governance is
measured in terms of possession of tools and actual usage patterns. It was
84
3
LDF Others
From the survey it was found that 72.9% of the respondents were
occupying the
6.3% of the samples were third timers and 1.9%
of the respondents were occupying the seat for more than three times.
For the
was defined in terms of
The respondents were asked to rate their
It is found that majority of the respondents are
38.4% of respondents were very
active in public life. They occupy official party positions. 3.1% of the
6.9% reports
Governance is
patterns. It was

272
found that the respondents were well equipped with ICT tools. However the
ICT usage pattern of respondents gives a less bright view of the scenario.
Table 6.2.3. ICT Profile of Respondents (n=159)
Profile Frequency Percentage
Possession of Equipments No Equipment
1 0.6
Mobile/ Land Phone 107 67.3
Computer/ Laptop. 29 18.2
Internet Connection. 16 10.1
3G Connection 6 3.8
Computer Usage-Don’t Know 54 34.0
Have Knowledge, but not Using 55 34.6
Using Computer 45 28.3
Regular User 5 3.1
Computer in Office Not using
144 90.6
Using Office Computer 10 6.3
Computer for Self in Office 5 3.1
Mobile Usage Pattern- Not Using mobile
1 0.6
Only for Call 73 45.9
For Call and Message 34 21.4
For Call+ Message+ Photo+etc. 48 30.2
For Accessing Internet 3 1.9 (Source, Survey Data)
The data shows that majority of the respondents (99.4%) are in
possession of either land phone or mobile phone. 18.2% respondents possess
either computer or laptop and phone connection. 10.1% samples were
internet connected with computer and phone connectivity. 3.8% of

respondents are in possession of all
table along with 3G connection.
support at personal level for the respondents.
Figure 6.2.5. Possession of ICT
The profile shows that the level of computer usage among the
respondents is low. 68.6% of the samples are not using computer and 34%
among them are yet to acquire e
computers and among them 3.1% are regular users.
No Mobile/ Lap
Top
1
107
273
respondents are in possession of all categories of equipment detailed in the
table along with 3G connection. It is evident that there is good infrastructural
personal level for the respondents.
Possession of ICT Tools by the Respondents
(Source, Survey Data)
shows that the level of computer usage among the
68.6% of the samples are not using computer and 34%
to acquire e-literacy. 31.4% of the respondents are using
computers and among them 3.1% are regular users.
Mobile/ Lap
Top
Comp Internet
Connection
3G
107
2916 6
ICT Tools
categories of equipment detailed in the
It is evident that there is good infrastructural
shows that the level of computer usage among the
68.6% of the samples are not using computer and 34%
31.4% of the respondents are using
274
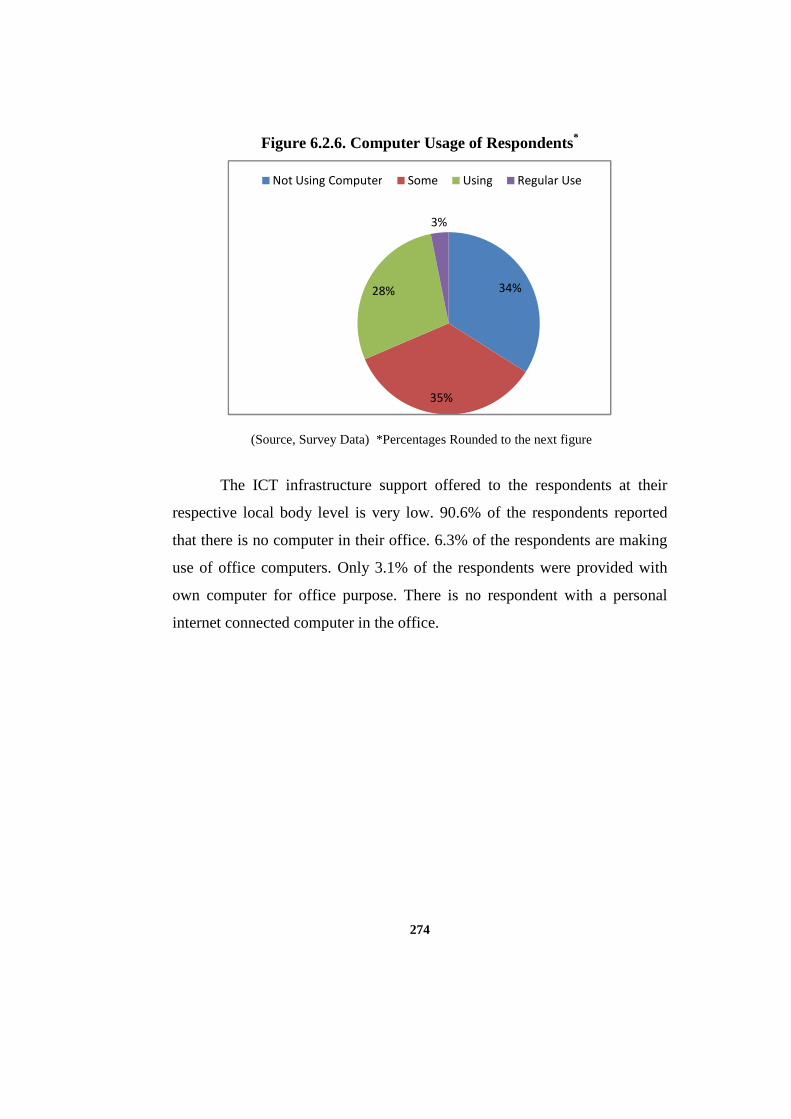
Figure 6.2.6. Computer Usage of Respondents*
(Source, Survey Data) *Percentages Rounded to the next figure
The ICT infrastructure support offered to the respondents at their
respective local body level is very low. 90.6% of the respondents reported
that there is no computer in their office. 6.3% of the respondents are making
use of office computers. Only 3.1% of the respondents were provided with
own computer for office purpose. There is no respondent with a personal
internet connected computer in the office.
34%
35%
28%
3%
Not Using Computer Some Using Regular Use

Figure 6.
It was found that the majority of respondents use mobile phone only
for the purpose of making phone calls (45.9%).
message facility in the phone. A considerable section of the samples (30.2%)
make use of mobile cameras and other utility services like calculator,
convertors etc. Only 1.9% of the respondents gain internet access through
mobile phones.
144
0
20
40
60
80
100
120
140
160
Not Using Computer
in Office
275
Figure 6.2.7. Use of Computer in Office
(Source, Survey Data)
It was found that the majority of respondents use mobile phone only
for the purpose of making phone calls (45.9%). 21.4% people utilize the text
message facility in the phone. A considerable section of the samples (30.2%)
make use of mobile cameras and other utility services like calculator,
Only 1.9% of the respondents gain internet access through
10 5
Not Using Computer
in Office
Using Office
Computer
Computer for Self Use
It was found that the majority of respondents use mobile phone only
21.4% people utilize the text
message facility in the phone. A considerable section of the samples (30.2%)
make use of mobile cameras and other utility services like calculator,
Only 1.9% of the respondents gain internet access through

Figure
Table 6.2
Usage
Not Used
Used by S
Used by S
Widely Used
Total
The researcher attempted to measure the use of ICT by the
respondents in their
based text message
is found that majority of the respondents
election campaign (86.2%). In the case of 8.8% respondents, their supporters
276
Figure 6.2.8. Mobile Phone Usage Pattern of Respondents
(Source, Survey Data)
2.4. Usage of ICT in Election Campaign (n=159)
Usage Frequency Percentage
Not Used 137 86.2
Used by Supporters 14 8.8
Used by Self 6 3.8
Widely Used 2 1.2
Total 159 100
(Source, Survey Data)
The researcher attempted to measure the use of ICT by the
their election campaign. For this purpose the usage of mobile
based text messages, e-mails, blogs and websites were taken into account. It
is found that majority of the respondents had not resorted to ICT tools in
election campaign (86.2%). In the case of 8.8% respondents, their supporters
1
73
3448
espondents
(n=159)
The researcher attempted to measure the use of ICT by the
For this purpose the usage of mobile
were taken into account. It
not resorted to ICT tools in
election campaign (86.2%). In the case of 8.8% respondents, their supporters
3

used ICT in election campaign.
and among them 1.2% of respondents u
includes the use of text messages, e
Figure 6.2.9
Not Used in
Election
Canpaign
Workers used
137
277
used ICT in election campaign. Only five percent used ICT tools in person
d among them 1.2% of respondents used ICT tools on a wider scale that
includes the use of text messages, e-mails and blogs.
9. Usage of ICT in Election Campaign
(Source, Survey Data)
Workers used Self Use Wide Use
14 6 2
used ICT tools in person
n a wider scale that

278
Table 6:2.5. Profile of Online Activity (n=159)
Profile Frequency Percentage
Internet Usage- Not Using 128 80.5
Through Internet Cafe/ Dial-up Connection
7 4.4
Mobile 3 1.9
Broad Band 21 13.2
Mode of Internet Learning- Don’t Know
129 81.1
By Self 13 8.2
Training Course 11 6.9
Help of Friends 6 3.8
Usage of Online Services-Don’t Know 26 16.4
Know, but not Used 57 35.8
Used 73 45.9
Regular User 3 1.9
Online Money Transaction-Not used 153 96.2
Rail/Bus Ticket Online Booking 3 1.9
Online Phone Recharging 2 1.3
Internet Banking 1 0.6
Online interactions- No Interaction 145 91.2
Messaging 8 5.0
Campaign Page Visiting 4 2.5
Internet Discussion Forums 2 1.3
Observation on Internet Connectivity in the Constituency Don’t Know
81 50.9
Bad 42 26.4
Satisfactory 21 13.2
Very Good 15 9.5 (Source, Survey Data)

With respect to internet usage, majority of the respondents admitted
that they are not using internet (80.5%).
samples access internet through Broad Band connection. Mobile devices are
used by 1.9% respondents for internet access and 4.4% people depend
dial-up connection or internet cafe for connectivity.
8.2% of the respondents learned internet by self study whereas 6.9%
attended training courses and 3.8% sought the help of friends to acquire
internet skills. 81.1% of the respondents never acquired internet skills.
Figure 6.2.10.
The table shows that 16.4% of the respondents are not aware of
online services. 35.8% of respondents are aware of online services but never
used it. 47.8% of the respondents used online services and among them 1.9%
are regular users. The user level of online services is not linked with internet
skills as many respondents accessed online services with the help of others or
through Akshaya kiosks.
0
20
40
60
80
100
120
140
160
No Activity
145
279
to internet usage, majority of the respondents admitted
that they are not using internet (80.5%). It is observed that 13.2% of the
samples access internet through Broad Band connection. Mobile devices are
used by 1.9% respondents for internet access and 4.4% people depend
up connection or internet cafe for connectivity. The table shows that
2% of the respondents learned internet by self study whereas 6.9%
attended training courses and 3.8% sought the help of friends to acquire
internet skills. 81.1% of the respondents never acquired internet skills.
Online Activity Profile of Respondents
(Source, Survey Data)
The table shows that 16.4% of the respondents are not aware of
online services. 35.8% of respondents are aware of online services but never
used it. 47.8% of the respondents used online services and among them 1.9%
The user level of online services is not linked with internet
skills as many respondents accessed online services with the help of others or
No ActivityMessaging
Campaign
Page VisitInternet
Discussions
145
84
2
to internet usage, majority of the respondents admitted
It is observed that 13.2% of the
samples access internet through Broad Band connection. Mobile devices are
used by 1.9% respondents for internet access and 4.4% people depend on
The table shows that
2% of the respondents learned internet by self study whereas 6.9%
attended training courses and 3.8% sought the help of friends to acquire
internet skills. 81.1% of the respondents never acquired internet skills.
The table shows that 16.4% of the respondents are not aware of
online services. 35.8% of respondents are aware of online services but never
used it. 47.8% of the respondents used online services and among them 1.9%
The user level of online services is not linked with internet
skills as many respondents accessed online services with the help of others or

280
An attempt was made to assess the online transaction level of the
respondents. It was found that 96.2% of the respondents never made a money
transaction via internet. 1.9% used internet services to purchase Rail/Bus
Ticket and 1.3% made use of internet for phone recharge purpose. Only
0.6% of the respondents operates an internet linked bank account
It was found that majority of the respondents are having no online
activity (91.2%). Among the 8.8% online activists 5% use only e-mail
messages. They use internet to receive and forward e-mail messages. 2.5%
respondents are visitors to campaign pages and 1.3% people involve in
internet discussion groups.
The online activity profile shows that the majority of the respondents
(50.9%) are not sure about the connectivity status in their constituency. To
26.4%, the connectivity status is bad and 13.2% of respondents observed that
the present level of connectivity is satisfactory. In the observation of 9.5%
respondents, the connectivity in their constituency is very good.
6.3. Acceptance of E-Governance
The introduction of E-Governance in local governance is facing
many challenges. There are issues of digital divide, social taboos,
infrastructure and the like. However these issues can be well addressed if the
political leadership in the local community is well aware of the potentials of
E-Governance. For this, they have to internalise the digital transformation in
their public life. With this objective, the present research examines the level
of acceptance of E-Governance among elected representatives of local bodies
in Kannur district. Analysis is done by taking into account the pre-election
and post-election scenarios.

281
6.3.1. Scoring Key for Acceptance of E-Governance
For measuring acceptance of E-Governance 19 questions were used.
The maximum score for each question is set as four. From these questions,
the maximum possible score was fixed at 76. The score range 1 to 19 is set
as Very low (25%). Those who scored between 19-38 is adjudged as low
acceptance category. The score 38-57 is fixed as high acceptance and 57-76
is set as very high acceptance.
Table 6.3.1. Scoring Key for Acceptance of E-Governance
Score range Level of Acceptance
1 to19 Very low
19 to 38 Low
38 to 57 High
57 to 76 Very High

282
6.3.2. Acceptance of E-Governance Before Elected
Hypothesis H1. Acceptance of E-Governance among the elected
representatives of Local Bodies in Kannur District before being elected is
low.
Table 6.3.2. Acceptance of E-Governance Before Elected (n=159)
Mean 30.77
Median 29.01
Mode 27.00
Std. Deviation 7.907
Skewness 1.15
Kurtosis 1.07
Minimum 19.00
Maximum 56.00
(Source, Survey Data)
The mean score of the table is 30.77.The maximum point scored by
the respondents was 56 and minimum score was 19. The median score is
29.01 and mode was 27.00. The skewness of the data was found to be
positive (1.5) and Kurtosis is 1.07. The mean score of the table falls between
the category 19-38, which indicates low acceptance. Thus it is found that
acceptance of E-Governance among the elected representatives of Local
Bodies in Kannur District before the election was low.
283
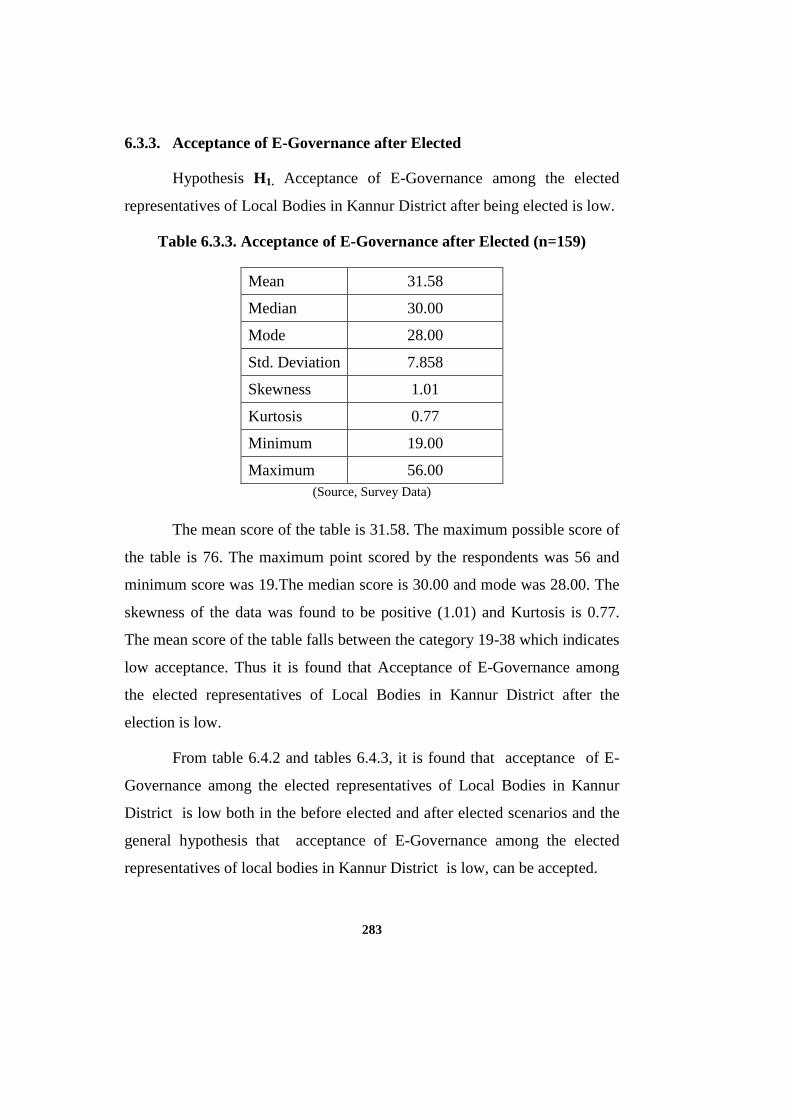
6.3.3. Acceptance of E-Governance after Elected
Hypothesis H1. Acceptance of E-Governance among the elected
representatives of Local Bodies in Kannur District after being elected is low.
Table 6.3.3. Acceptance of E-Governance after Elected (n=159)
Mean 31.58
Median 30.00
Mode 28.00
Std. Deviation 7.858
Skewness 1.01
Kurtosis 0.77
Minimum 19.00
Maximum 56.00 (Source, Survey Data)
The mean score of the table is 31.58. The maximum possible score of
the table is 76. The maximum point scored by the respondents was 56 and
minimum score was 19.The median score is 30.00 and mode was 28.00. The
skewness of the data was found to be positive (1.01) and Kurtosis is 0.77.
The mean score of the table falls between the category 19-38 which indicates
low acceptance. Thus it is found that Acceptance of E-Governance among
the elected representatives of Local Bodies in Kannur District after the
election is low.
From table 6.4.2 and tables 6.4.3, it is found that acceptance of E-
Governance among the elected representatives of Local Bodies in Kannur
District is low both in the before elected and after elected scenarios and the
general hypothesis that acceptance of E-Governance among the elected
representatives of local bodies in Kannur District is low, can be accepted.

284
6.3.4. Comparison of Acceptance of E-Governance Before Elected and After Elected
Hypothesis H1. There is significant change in the acceptance of
E-Governance among the elected representatives of Local Bodies in Kannur
District after elected.
Null Hypothesis H0. There is no significant change in the acceptance of
E-Governance among the elected representatives of Local Bodies in Kannur
District after elected.
Table 6.3.4. Acceptance of E-Governance Before and After Elected (n=159)
Group Mean N Std.
Deviation t Value Sign
Acceptance before elected
30.77 159 7.90 8.70 0.000**
Acceptance after elected 31.58 159 7.86
(Source, Survey Data) * *Significant at 0.001 level
Table 6.4.4 shows the mean value, standard deviation, t Value and
significance between the acceptance of E-Governance among elected
representatives of local bodies before elected and after elected. The mean value of
acceptance of E-Governance before elected is found to be 30.77 at a standard
deviation of 7.9 and mean score of acceptance of E-Governance after elected is
found to be 31.58 with a standard deviation of 7.86. The result reveals that there is
significant difference between the two scenarios in the acceptance of E-Governance
(p<0.001). Consequently the null hypothesis is rejected. Thus it can be stated that
there is significant change in the level of acceptance of E-Governance among
elected representatives of local bodies before elected and after elected. After

285
elected, the elected representatives of local bodies in Kannur district acquired a
better acceptance of E-Governance.
6.3.5. Acceptance of E-Governance (After Elected)
In this section the change in acceptance of E-Governance with
respect to selected socio-demographic factors - domicile status, sex, religion.
age, political affiliation, education and income are examined. For this study
the scenario considered is the position after being elected.
6.3.6. Acceptance of E-Governance on the Basis of Domicile Status
Hypothesis H1: There is significant change in the acceptance of
E-Governance among elected representatives of Local Bodies in Kannur
District in relation to their domicile status.
Null Hypothesis H0: There is no significant change in the acceptance of E-
Governance among elected representatives of Local Bodies in Kannur
District in relation to their domicile status.
Table 6.3.5. Acceptance of E-Governance on the Basis of Domicile Status
Domicile Status N Mean Std. Deviation t value Sig.
Rural 136 31.20 7.59
Urban 23 33.83 9.16 1.485 .140*
(Source, Survey Data) *Not Significant at 0.05 level.
The mean value of the table is 31.20 for rural group and 33.83 for
urban group. The standard deviation of rural group is 7.59 and for urban
group it is 9.16. The t value is found to be 1.485. From the table it is found
that there is no significant relation (p>0.05) between acceptance of E-
Governance among elected representative of local bodies in rural areas of

286
Kannur district and acceptance of E-Governance among elected
representative of local bodies in urban areas of Kannur district. Thus the null
hypothesis is accepted.
6.3.7 Acceptance of E-Governance on the Basis of Sex
Hypothesis H1: There is significant change in the acceptance of
E-Governance among elected representatives of Local Bodies in Kannur
District in relation to their sex.
Null Hypothesis H0: There is no significant change in the acceptance of
E-Governance among elected representatives of Local Bodies in Kannur
District in relation to their sex.
Table 6.3.6. Acceptance of E-Governance on the Basis of Sex
Sex N Mean Std. Deviation t value Sig.
Male 79 33.29 8.40 2.778 .006**
Female 80 29.90 6.94
(Source, Survey Data) **Significant at 0.01 level
From the analysis it was found that the mean score for male group is
33.29 and standard deviation is 8.40. For the female group the figures are
29.9 and 6.94. t value of the table is 2.778. The male respondents are in a
higher level of acceptance of E-Governance and the change between the
groups is significant (p<0.01). Thus the null hypothesis is rejected.
6.3.8. Acceptance of E-Governance with Respect to Religion
Hypothesis H1: There is significant change in the acceptance of
E-Governance among elected representatives of Local Bodies in Kannur
District in relation to their religion.
287
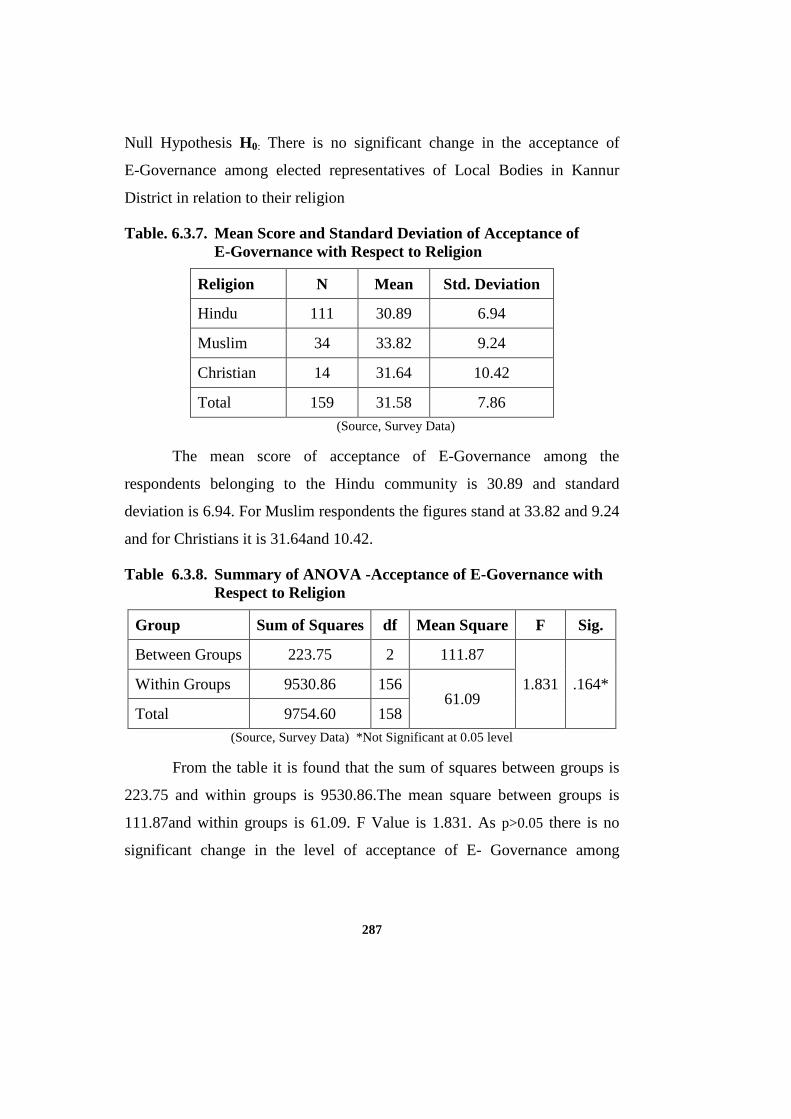
Null Hypothesis H0: There is no significant change in the acceptance of
E-Governance among elected representatives of Local Bodies in Kannur
District in relation to their religion
Table. 6.3.7. Mean Score and Standard Deviation of Acceptance of E-Governance with Respect to Religion
Religion N Mean Std. Deviation
Hindu 111 30.89 6.94
Muslim 34 33.82 9.24
Christian 14 31.64 10.42
Total 159 31.58 7.86
(Source, Survey Data)
The mean score of acceptance of E-Governance among the
respondents belonging to the Hindu community is 30.89 and standard
deviation is 6.94. For Muslim respondents the figures stand at 33.82 and 9.24
and for Christians it is 31.64and 10.42.
Table 6.3.8. Summary of ANOVA -Acceptance of E-Governance with Respect to Religion
Group Sum of Squares df Mean Square F Sig.
Between Groups 223.75 2 111.87
1.831 .164* Within Groups 9530.86 156 61.09
Total 9754.60 158
(Source, Survey Data) *Not Significant at 0.05 level
From the table it is found that the sum of squares between groups is
223.75 and within groups is 9530.86.The mean square between groups is
111.87and within groups is 61.09. F Value is 1.831. As p>0.05 there is no
significant change in the level of acceptance of E- Governance among
288
elected representative of local bodies in Kannur on the basis of their religion.
On the basis of the finding the null hypothesis is accepted.
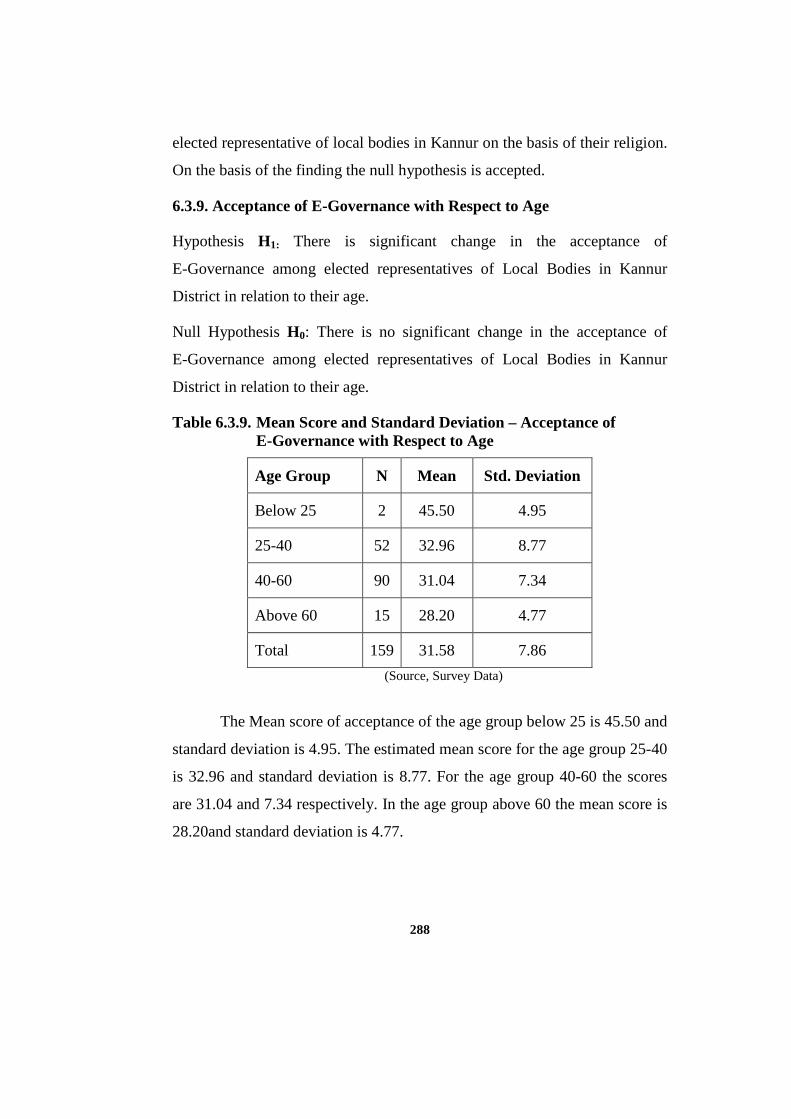
6.3.9. Acceptance of E-Governance with Respect to Age
Hypothesis H1: There is significant change in the acceptance of
E-Governance among elected representatives of Local Bodies in Kannur
District in relation to their age.
Null Hypothesis H0: There is no significant change in the acceptance of
E-Governance among elected representatives of Local Bodies in Kannur
District in relation to their age.
Table 6.3.9. Mean Score and Standard Deviation – Acceptance of E-Governance with Respect to Age
Age Group N Mean Std. Deviation
Below 25 2 45.50 4.95
25-40 52 32.96 8.77
40-60 90 31.04 7.34
Above 60 15 28.20 4.77
Total 159 31.58 7.86
(Source, Survey Data)
The Mean score of acceptance of the age group below 25 is 45.50 and
standard deviation is 4.95. The estimated mean score for the age group 25-40
is 32.96 and standard deviation is 8.77. For the age group 40-60 the scores
are 31.04 and 7.34 respectively. In the age group above 60 the mean score is
28.20and standard deviation is 4.77.
289
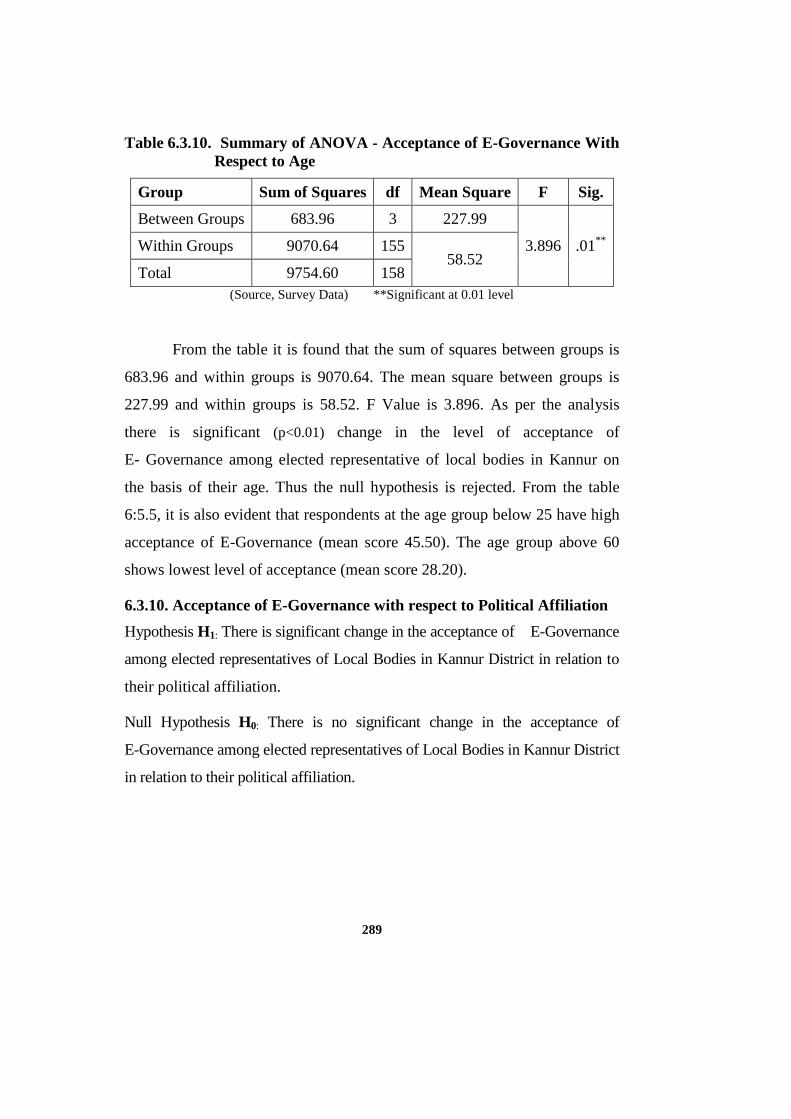
Table 6.3.10. Summary of ANOVA - Acceptance of E-Governance With Respect to Age
Group Sum of Squares df Mean Square F Sig.
Between Groups 683.96 3 227.99
3.896 .01** Within Groups 9070.64 155 58.52
Total 9754.60 158 (Source, Survey Data) **Significant at 0.01 level
From the table it is found that the sum of squares between groups is
683.96 and within groups is 9070.64. The mean square between groups is
227.99 and within groups is 58.52. F Value is 3.896. As per the analysis
there is significant (p<0.01) change in the level of acceptance of
E- Governance among elected representative of local bodies in Kannur on
the basis of their age. Thus the null hypothesis is rejected. From the table
6:5.5, it is also evident that respondents at the age group below 25 have high
acceptance of E-Governance (mean score 45.50). The age group above 60
shows lowest level of acceptance (mean score 28.20).
6.3.10. Acceptance of E-Governance with respect to Political Affiliation
Hypothesis H1: There is significant change in the acceptance of E-Governance
among elected representatives of Local Bodies in Kannur District in relation to
their political affiliation.
Null Hypothesis H0: There is no significant change in the acceptance of
E-Governance among elected representatives of Local Bodies in Kannur District
in relation to their political affiliation.

290
Table 6.3.11. Mean Score and Standard Deviation - Acceptance of E-Governance with Respect to Political Affiliation
Party N Mean Std. Deviation
UDF 72 30.87 7.78
LDF 84 31.89 7.55
Others 3 40.00 15.13
Total 159 31.58 7.86
(Source, Survey Data)
The table shows that the Mean score of acceptance of respondents
belonging to UDF is 30.87 with standard deviation 7.78. The estimated mean
score for LDF Respondents is 31.89 and standard deviation is 7.55. For the
group others, the scores are 40.00 and 15.13 respectively.
Table 6.3.12. Summary of ANOVA - Acceptance of E-Governance with Respect to Political Affiliation
Group Sum of Squares df Mean Square F Sig.
Between Groups 256.69 2 128.35
2.108 .125* Within Groups 9497.91 156 60.88
Total 9754.60 158
(Source, Survey Data) *Not Significant at 0.05 level
From the table it is found that the sum of squares between groups is
256.69 and within groups is 9497.91. The mean square between groups is
128.35 and within groups is 60.88. F Value is 2.108. As per the analysis
there is no significant (p>0.05) change in the level of acceptance of
291
E- Governance among elected representative of local bodies in Kannur on
the basis of their party. Thus the null hypothesis is accepted.
6.3.11 Acceptance of E-Governance with respect to Education
Hypothesis H1: There is significant change in the acceptance of
E-Governance among elected representatives of Local Bodies in Kannur
District in relation to their education.
Null Hypothesis H0: There is no significant change in the acceptance of
E-Governance among elected representatives of Local Bodies in Kannur
District in relation to their education.
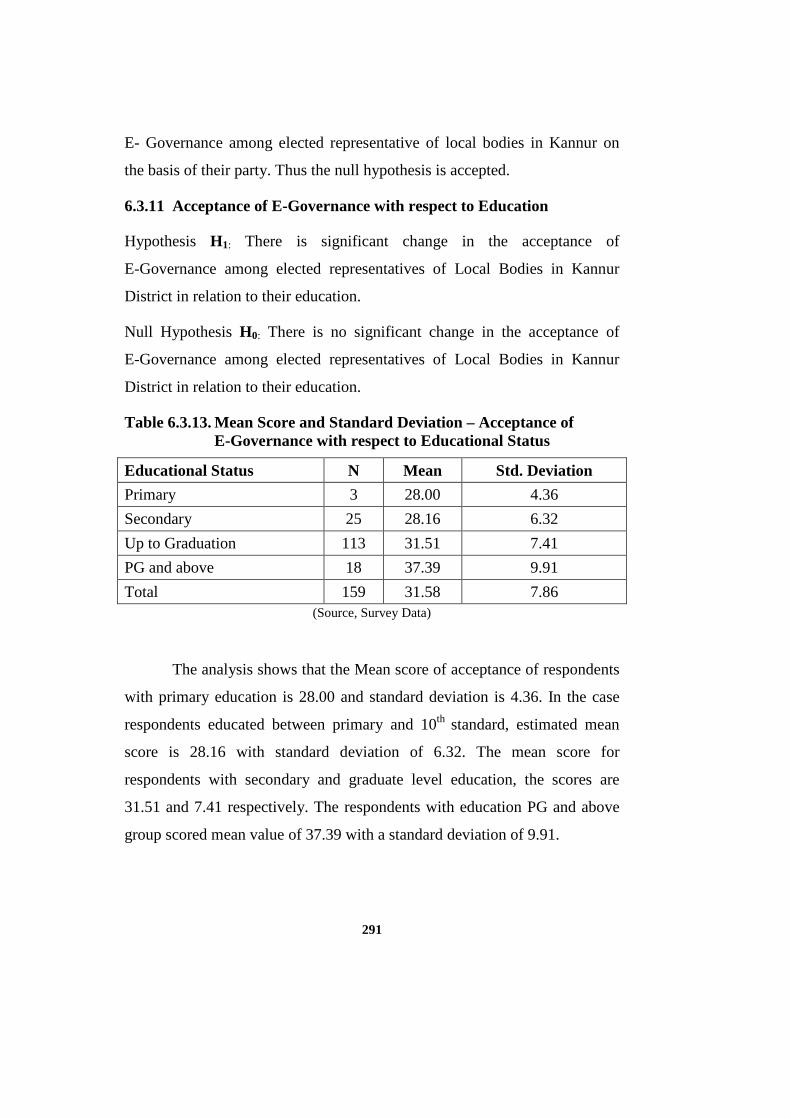
Table 6.3.13. Mean Score and Standard Deviation – Acceptance of E-Governance with respect to Educational Status
Educational Status N Mean Std. Deviation
Primary 3 28.00 4.36
Secondary 25 28.16 6.32
Up to Graduation 113 31.51 7.41
PG and above 18 37.39 9.91
Total 159 31.58 7.86 (Source, Survey Data)
The analysis shows that the Mean score of acceptance of respondents
with primary education is 28.00 and standard deviation is 4.36. In the case
respondents educated between primary and 10th standard, estimated mean
score is 28.16 with standard deviation of 6.32. The mean score for
respondents with secondary and graduate level education, the scores are
31.51 and 7.41 respectively. The respondents with education PG and above
group scored mean value of 37.39 with a standard deviation of 9.91.

292
Table 6.3.14. Summary of ANOVA - Acceptance of E-Governance with Respect to Educational Status
Education Sum of Squares df Mean Square F Sig.
Between Groups 938.74 3 312.92
5.502 .001** Within Groups 8815.87 155 56.88
Total 9754.607 158 (Source, Survey Data) **Significant at 0.001 level
The analysis shows that the sum of squares between groups is
938.74 and within groups is 8815.87.The mean square between groups is
312.92 and within groups is 56.88. F Value is 5.502. As per the analysis
there is significant (p<0.001) change in the level of acceptance of E-
Governance among elected representative of local bodies in Kannur on the
basis of their educational status. Thus the null hypothesis is rejected. From
Table, 6:5.10 it is found that the highly educated group, PG and above shows
high acceptance of E-Governance (Mean 37.39).
6.3.12. Acceptance of E-Governance with Respect to Income
Hypothesis H1: There is significant change in the acceptance of
E-Governance among elected representatives of Local Bodies in Kannur
District in relation to their Income.
Null Hypothesis H0: There is no significant change in the acceptance of
E-Governance among elected representatives of Local Bodies in Kannur
District in relation to their income.
293
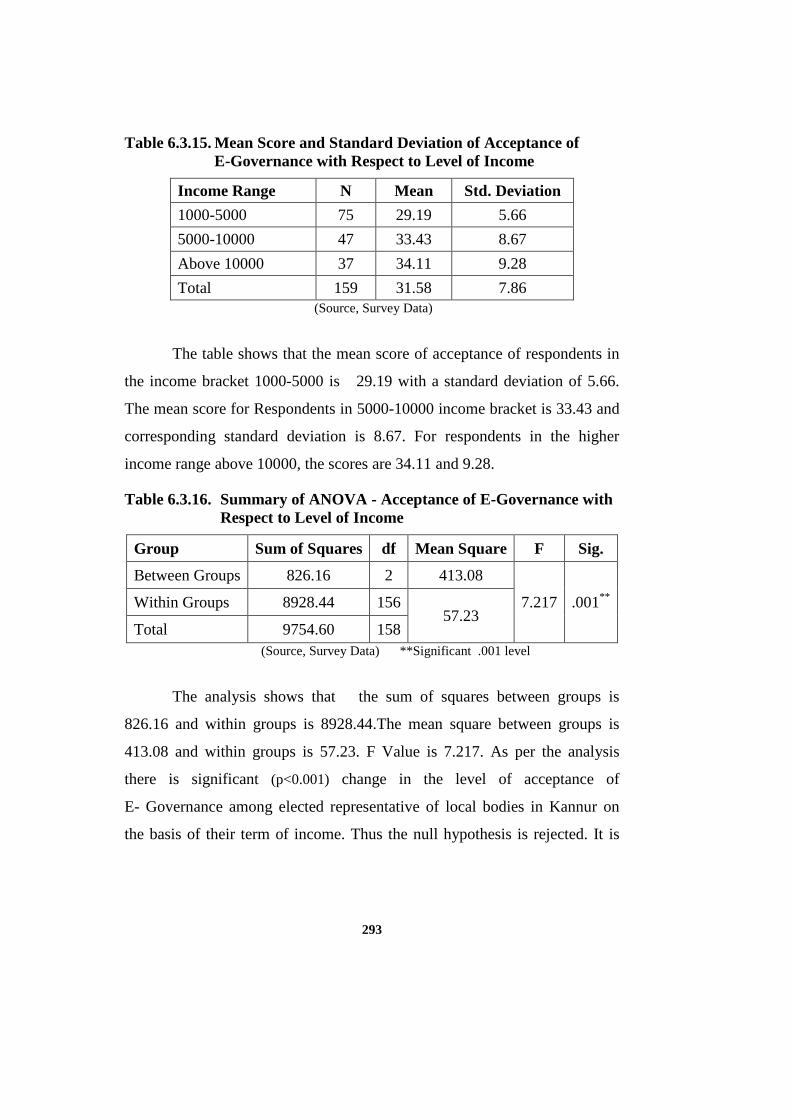
Table 6.3.15. Mean Score and Standard Deviation of Acceptance of E-Governance with Respect to Level of Income
Income Range N Mean Std. Deviation
1000-5000 75 29.19 5.66
5000-10000 47 33.43 8.67
Above 10000 37 34.11 9.28
Total 159 31.58 7.86 (Source, Survey Data)
The table shows that the mean score of acceptance of respondents in
the income bracket 1000-5000 is 29.19 with a standard deviation of 5.66.
The mean score for Respondents in 5000-10000 income bracket is 33.43 and
corresponding standard deviation is 8.67. For respondents in the higher
income range above 10000, the scores are 34.11 and 9.28.
Table 6.3.16. Summary of ANOVA - Acceptance of E-Governance with Respect to Level of Income
Group Sum of Squares df Mean Square F Sig.
Between Groups 826.16 2 413.08
7.217 .001** Within Groups 8928.44 156 57.23
Total 9754.60 158 (Source, Survey Data) **Significant .001 level
The analysis shows that the sum of squares between groups is
826.16 and within groups is 8928.44.The mean square between groups is
413.08 and within groups is 57.23. F Value is 7.217. As per the analysis
there is significant (p<0.001) change in the level of acceptance of
E- Governance among elected representative of local bodies in Kannur on
the basis of their term of income. Thus the null hypothesis is rejected. It is

294
found that the high income group possessed high acceptance of
E-Governance.
6.4 Perception of E-Governance
The study aims to measure the perception of E-Governance among
elected representatives of local bodies in Kannur district. For this purpose
perception is defined in terms of orientation and attitudes towards
E-Governance. For measuring perception psychological scales were also
used. A five point Likert scale is used for analysing the responses. Positive
questions were used to measure perception.
Table 6.4.1. Scoring Key for Measuring Perception
Sl. No. Observation Score
1 Strongly Disagree 0
2 Disagree 1
3 Neither Agree nor Disagree 2
4. Agree 3
5 Strongly Agree 4 (Source, Survey Data)
For measuring perception of E-Governance 14 questions were used.
The maximum score for each question is set as four. The total possible score
in this section is 56. The scoring pattern is given in table 6.6.2.
Table 6.4.2. Scoring Pattern for Perception of E-Governance
Score range Level of Perception
1 to14 Very low
14 to 28 Low
28 to 42 High
42 to 56 Very High

295
For measuring perception of E-Governance four ranges of scores is
taken. The first range 1 to 14 is rated as very low. Respondents scoring
between 14-28 is supposed to have low perception. The score between 28-42
is considered as high and the range 42 to 56 is considered as very high
perception
6.4.1. Perception of E-Governance Among Elected Representatives
Hypothesis H1. The elected representatives of Local Bodies in Kannur
District possess high perception about the use of E-Governance.
Table 6:4.3. Mean, Median, Mode and Standard Deviation of Perception of E-Governance
Mean 37.80
Median 38.00
Mode 38.00
Std. Deviation 3.37
Skewness .63
Kurtosis 1.34
Minimum 28.00
Maximum 50.00 (Source, Survey Data)
The mean score of the table is 37.80.The maximum point scored by
the respondents was 50.00 and minimum score was 28.00. The median score
is 38.00 and mode was 38.00. The skewness of the data was found to be
positive (.63) and Kurtosis was 1.34. The mean score of the table falls in
the category 28-42. It shows that the perception score is high. Thus it is
found that Perception of E-Governance among the elected representatives of
Local Bodies in Kannur District is high.

296
6.4.2. Perception of E-Governance in Relation to Selected Socio-Demographic Factors
The change in perception of E-Governance with respect to selected
socio-demographic factors- age, sex, domicile status, religion, political
affiliation, education, official status, income, profession and the degree of
political engagement are analysed in this section.
6.4.3. Perception of E-Governance with Respect to Age
Hypothesis H1: There is significant change in the perception of E-Governance
among elected representatives of Local Bodies in Kannur District in relation to
their age.
Null Hypothesis H0: There is no significant change in the perception of
E-Governance among elected representatives of Local Bodies in Kannur
District in relation to their age.
Table 6.4.4. Mean Score and Standard Deviation of Perception of E-Governance with Respect to Age
Age Group N Mean Std. Deviation
Below 25 2 39.00 4.24
25-40 53 38.30 4.16
40-60 90 37.54 2.87
Above 60 14 37.36 3.00
Total 159 37.80 3.37 (Source, Survey Data)
The Mean score of acceptance of the age group below 25 is 39.00 and
standard deviation is 4.24. The estimated mean score for the age group 25-40
is 38.30 and standard deviation is 4.16. For the age group 40-60 the scores

297
are 37.54 and 2.87 respectively. In the age group above 60 the mean score is
37.36 and standard deviation is 3.00.
Table 6.4.5. Summary of ANOVA - Perception of E-Governance with Respect to Age
Age Sum of Squares df Mean Square F Sig.
Between Groups 24.85 3 8.28
.726 .538* Within Groups 1768.71 155 11.41
Total 1793.56 158 (Source, Survey Data) *Not significant at 0.05 level
From the table it is found that the sum of squares between groups is
24.85and within groups is 1768.71.The mean square between groups is 8.28
and within groups is 11.41. F Value is .726. As per the analysis there is no
significant (p>0.05) change in the level of perception of E- Governance
among elected representative of local bodies in Kannur on the basis of their
age. Thus the null hypothesis is accepted.
6.4.4 Perception of E-Governance on the Basis of Sex
Hypothesis H1: There is significant change in the perception of E-Governance
among elected representatives of Local Bodies in Kannur District in relation to
their sex.
Null Hypothesis H0: There is no significant change in the perception of
E-Governance among elected representatives of Local Bodies in Kannur
District in relation to their sex
298
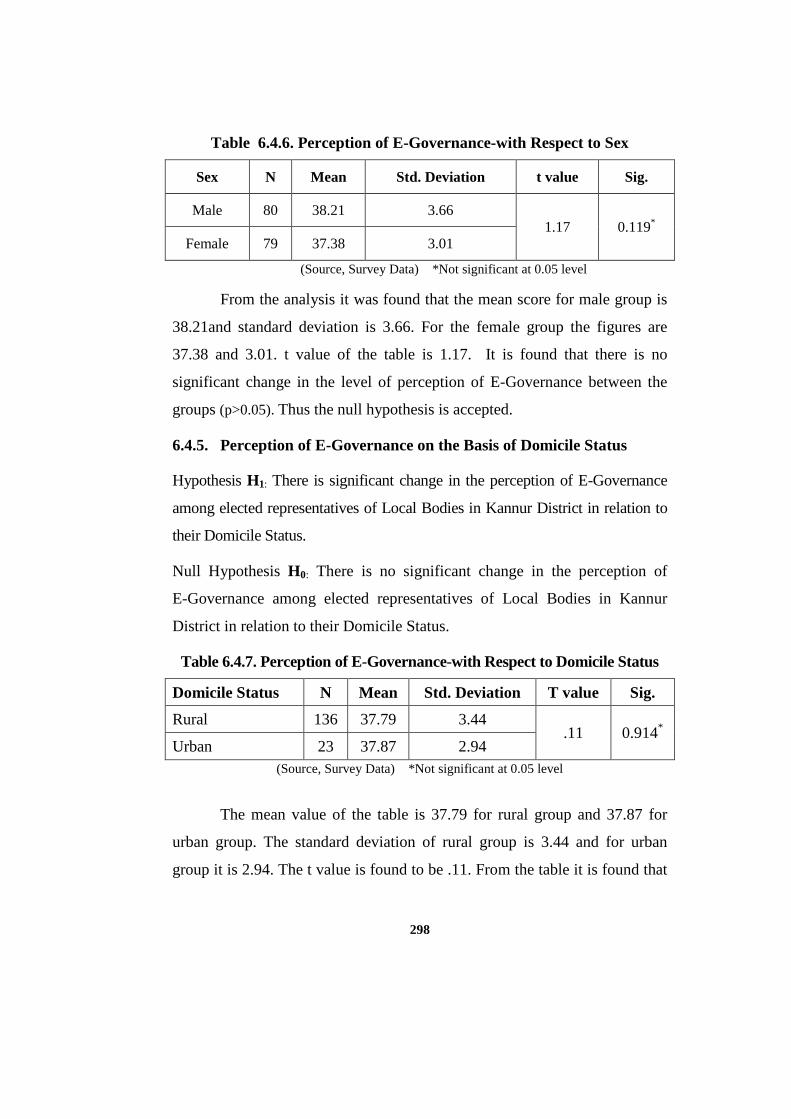
Table 6.4.6. Perception of E-Governance-with Respect to Sex
Sex N Mean Std. Deviation t value Sig.
Male 80 38.21 3.66 1.17 0.119*
Female 79 37.38 3.01
(Source, Survey Data) *Not significant at 0.05 level
From the analysis it was found that the mean score for male group is
38.21and standard deviation is 3.66. For the female group the figures are
37.38 and 3.01. t value of the table is 1.17. It is found that there is no
significant change in the level of perception of E-Governance between the
groups (p>0.05). Thus the null hypothesis is accepted.
6.4.5. Perception of E-Governance on the Basis of Domicile Status
Hypothesis H1: There is significant change in the perception of E-Governance
among elected representatives of Local Bodies in Kannur District in relation to
their Domicile Status.
Null Hypothesis H0: There is no significant change in the perception of
E-Governance among elected representatives of Local Bodies in Kannur
District in relation to their Domicile Status.
Table 6.4.7. Perception of E-Governance-with Respect to Domicile Status
Domicile Status N Mean Std. Deviation T value Sig.
Rural 136 37.79 3.44 .11 0.914*
Urban 23 37.87 2.94 (Source, Survey Data) *Not significant at 0.05 level
The mean value of the table is 37.79 for rural group and 37.87 for
urban group. The standard deviation of rural group is 3.44 and for urban
group it is 2.94. The t value is found to be .11. From the table it is found that
299
there is no significant relation (p>0.05) between perception of E-Governance
among elected representative of local bodies in rural areas of Kannur district
and perception of E-Governance among elected representative of local
bodies in urban areas of Kannur district. Thus the null hypothesis is
accepted.
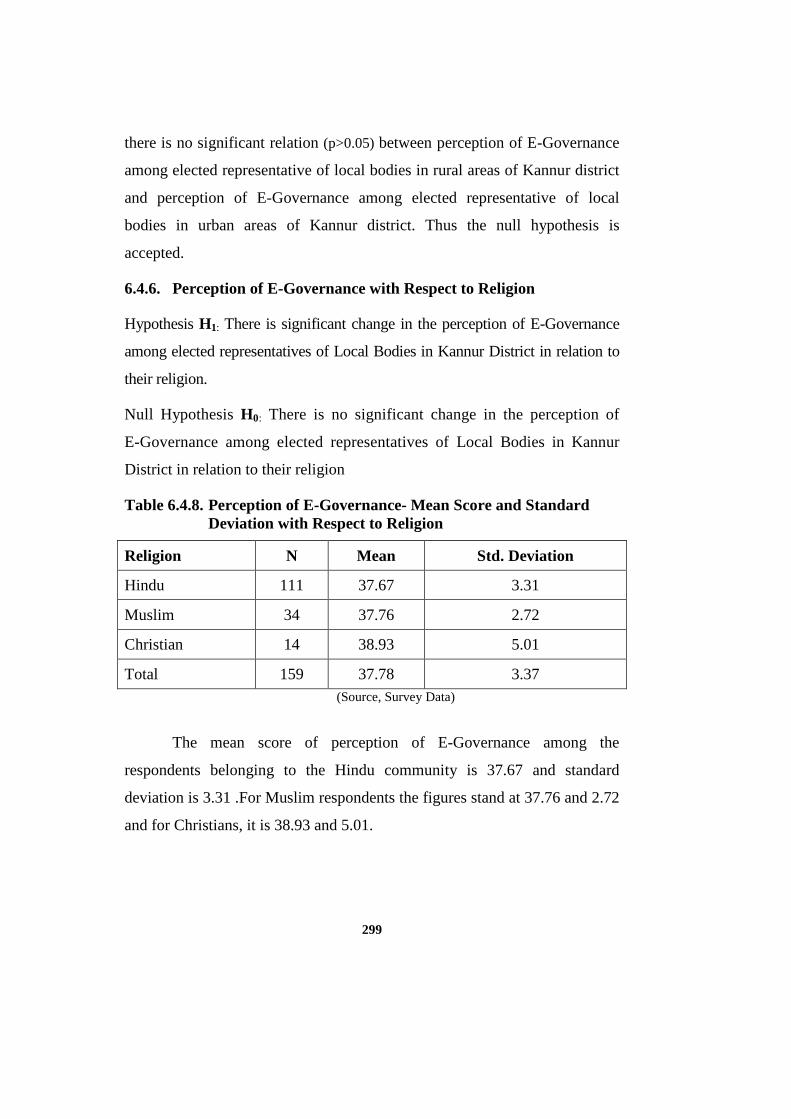
6.4.6. Perception of E-Governance with Respect to Religion
Hypothesis H1: There is significant change in the perception of E-Governance
among elected representatives of Local Bodies in Kannur District in relation to
their religion.
Null Hypothesis H0: There is no significant change in the perception of
E-Governance among elected representatives of Local Bodies in Kannur
District in relation to their religion
Table 6.4.8. Perception of E-Governance- Mean Score and Standard Deviation with Respect to Religion
Religion N Mean Std. Deviation
Hindu 111 37.67 3.31
Muslim 34 37.76 2.72
Christian 14 38.93 5.01
Total 159 37.78 3.37 (Source, Survey Data)
The mean score of perception of E-Governance among the
respondents belonging to the Hindu community is 37.67 and standard
deviation is 3.31 .For Muslim respondents the figures stand at 37.76 and 2.72
and for Christians, it is 38.93 and 5.01.

300
Table 6.4.9. Summary of ANOVA - Perception of E-Governance with Respect to Religion
Religion Sum of Squares df Mean Square F Sig.
Between Groups 19.85 2 9.92
.873 .420* Within Groups 1773.71 156 11.37
Total 1793.56 158 (Source, Survey Data) *Not Significant at 0.05 level
From the table it is found that the sum of squares between groups is
19.85 and within groups is 1773.71. The mean square between groups is 9.92
and within groups is 11.37. F Value is .873. As (p>0.05) there is no
significant change in the level of perception of E- Governance among elected
representative of local bodies in Kannur on the basis of their religion. The
null hypothesis is accepted.
6.4.7. Perception of E-Governance with Respect to Political Affiliation
Hypothesis H1: There is significant change in the perception of E-Governance
among elected representatives of Local Bodies in Kannur District in relation
to their political affiliation.
Null Hypothesis H0: There is no significant change in the perception of
E-Governance among elected representatives of Local Bodies in Kannur
District in relation to their political affiliation.
Table 6.4.10. Perception of E-Governance with Respect to Political Affiliation- Mean Score and Standard Deviation
Party N Mean Std. Deviation
UDF 72 37.05 3.04
LDF 84 38.44 3.56
Others 3 37.67 2.08
Total 159 37.80 3.37 (Source, Survey Data)
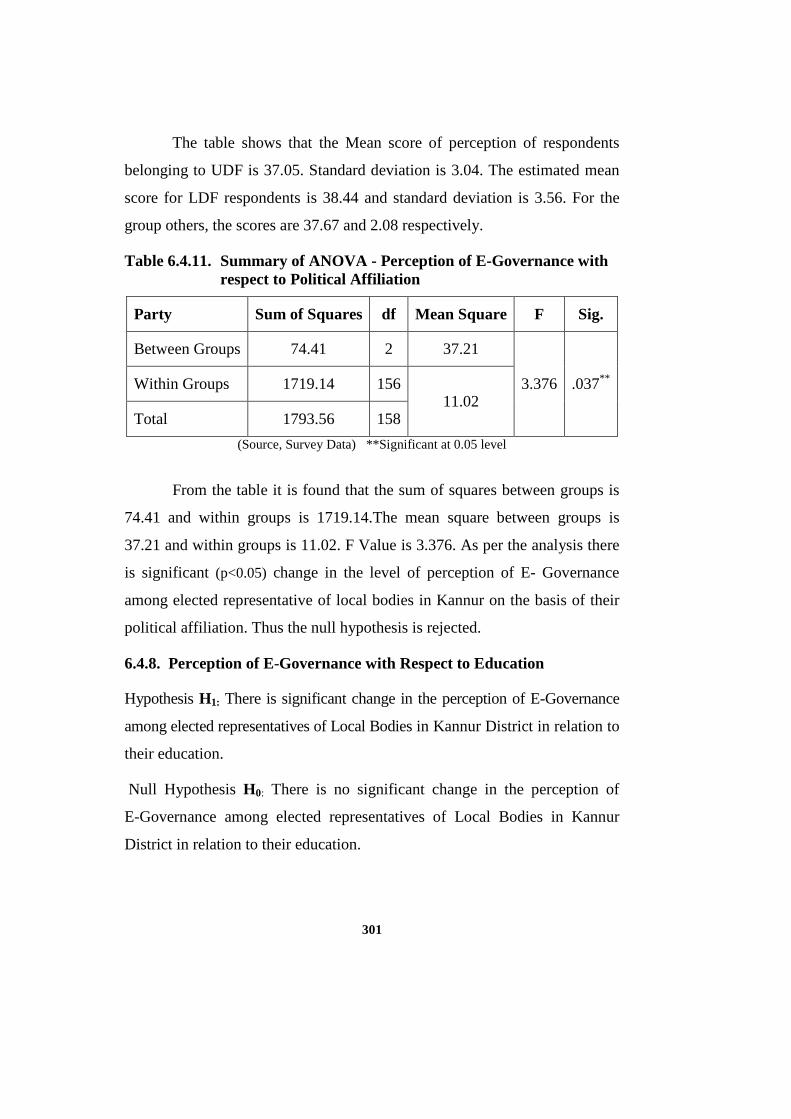
301
The table shows that the Mean score of perception of respondents
belonging to UDF is 37.05. Standard deviation is 3.04. The estimated mean
score for LDF respondents is 38.44 and standard deviation is 3.56. For the
group others, the scores are 37.67 and 2.08 respectively.
Table 6.4.11. Summary of ANOVA - Perception of E-Governance with respect to Political Affiliation
Party Sum of Squares df Mean Square F Sig.
Between Groups 74.41 2 37.21
3.376 .037** Within Groups 1719.14 156 11.02
Total 1793.56 158
(Source, Survey Data) **Significant at 0.05 level
From the table it is found that the sum of squares between groups is
74.41 and within groups is 1719.14.The mean square between groups is
37.21 and within groups is 11.02. F Value is 3.376. As per the analysis there
is significant (p<0.05) change in the level of perception of E- Governance
among elected representative of local bodies in Kannur on the basis of their
political affiliation. Thus the null hypothesis is rejected.
6.4.8. Perception of E-Governance with Respect to Education
Hypothesis H1: There is significant change in the perception of E-Governance
among elected representatives of Local Bodies in Kannur District in relation to
their education.
Null Hypothesis H0: There is no significant change in the perception of
E-Governance among elected representatives of Local Bodies in Kannur
District in relation to their education.

302
Table 6.4.12. Perception of E-Governance with Respect to Education - Mean Score and Standard Deviation
Education Level N Mean Std. Deviation
Primary 3 36.67 2.52
Secondary 25 36.84 2.60
Graduation 113 37.59 3.26
PG and Above 18 40.61 3.97
Total 159 37.80 3.37
(Source, Survey Data)
The analysis shows that the Mean score of perception of respondents
with primary education is 36.67and standard deviation is 2.52. In the case
respondents educated between primary and 10th standard, estimated mean
score is 36.84 and standard deviation is 2.60. The mean score for
respondents with secondary and graduate level education, the scores are
37.59 and 3.26 respectively. The respondents with education PG and above
group scored mean value of 40.61 with a standard deviation of 3.97.
Table 6.4.13. Summary of ANOVA - Perception of E-Governance with Respect to Education
Education Sum of Squares df Mean Square F Sig.
Between Groups 173.98 3 58.00
5.550 .001** Within Groups 1619.58 155 10.45
Total 1793.56 158
(Source, Survey Data) **Significant at 0.001 level

303
The analysis shows that the sum of squares between groups is
173.98 and within groups is 1619.58.The mean square between groups is
58.00 and within groups is 10.45. F Value is 5.55. As per the analysis there is
significant (p<0.001) change in the level of perception of E- Governance
among elected representative of local bodies in Kannur District on the basis
of their education. Thus the null hypothesis is rejected. The respondents with
higher education shows higher perception of E-Governance (PG and above
group -mean score 40.61).
6.4.9. Perception of of E-Governance with respect to Official Status
Hypothesis H1: There is significant change in the perception of E-Governance
among elected representatives of Local Bodies in Kannur District in relation to
their Official status.
Null Hypothesis H0: There is no significant change in the perception of
E-Governance among elected representatives of Local Bodies in Kannur
District in relation to their Official status.
Table 6.4.14. Perception of E-Governance with Respect to Official Status Official Status N Mean Std. Deviation t-value Sig.
Ordinary 90 37.51 3.37
1.23 0.220*
Official 69 38.17 3.36 (Source, Survey Data) *Not Significant at 0.05 level
The data analysis shows that the Mean score of perception of
ordinary members is 37.51 and standard deviation is 3.37. The estimated
mean score for office holders is 38.17 and standard deviation is 3.36. The t
value is 1.23. As per the analysis there is no significant (p>0.05) change in
the level of perception of E- Governance among elected representative of

304
local bodies in Kannur District on the basis of their official status. Thus the
null hypothesis is accepted.
6.4.10. Perception of E-Governance with Respect to Term in Office
Hypothesis H1: There is significant change in the perception of E-Governance
among elected representatives of Local Bodies in Kannur District in relation
to their term in office.
Null Hypothesis H0: There is no significant change in the perception of E-
Governance among elected representatives of Local Bodies in Kannur
District in relation to their term in office.
Table 6.4.15. Perception of E-Governance with Respect to Term in Office - Mean Score and Standard Deviation
(Source, Survey Data)
According to the analysis the Mean score of perception of
respondents with a single term in office is 37.98 with a standard deviation of
3.52. The mean score for Respondents with two terms is 38.03 and
respective standard deviation is 2.20. For the group with three terms in
office, the scores are 35.30 and 3.92 respectively. In the case of respondents
with more than three terms Mean score of perception is 36.67 with standard
deviation of 3.21.
Term in Office N Mean Std. Deviation
First Time 116 37.98 3.52
Two Terms 30 38.03 2.20
Three Terms 10 35.30 3.92
More than Three Terms 3 36.67 3.21
Total 159 37.80 3.37

305
Table 6.4.16. Summary of ANOVA - Perception of E-Governance with Respect to Term in Office
Term in Office Sum of Squares df Mean Square F Sig.
Between Groups 71.86 3 23.95
2.156 .095* Within Groups 1721.70 155 11.11
Total 1793.56 158
(Source, Survey Data) *Not significant at 0.05 level
The analysis shows that the sum of squares between groups is 71.86
and within groups is 1721.70 .The mean square between groups is 23.95 and
within groups is 11.11. F Value is. 2.156. As per the analysis there is no
significant (p>0.05) change in the level of perception of E- Governance
among elected representative of local bodies in Kannur District on the basis
of their term in office. Thus the null hypothesis is accepted.
6.4.11. Perception of E-Governance with Respect to Income
Hypothesis H1: There is significant change in the perception of E-Governance
among elected representatives of Local Bodies in Kannur District in relation to
their Income.
Null Hypothesis H0: There is no significant change in the perception of
E-Governance among elected representatives of Local Bodies in Kannur
District in relation to their income.
306
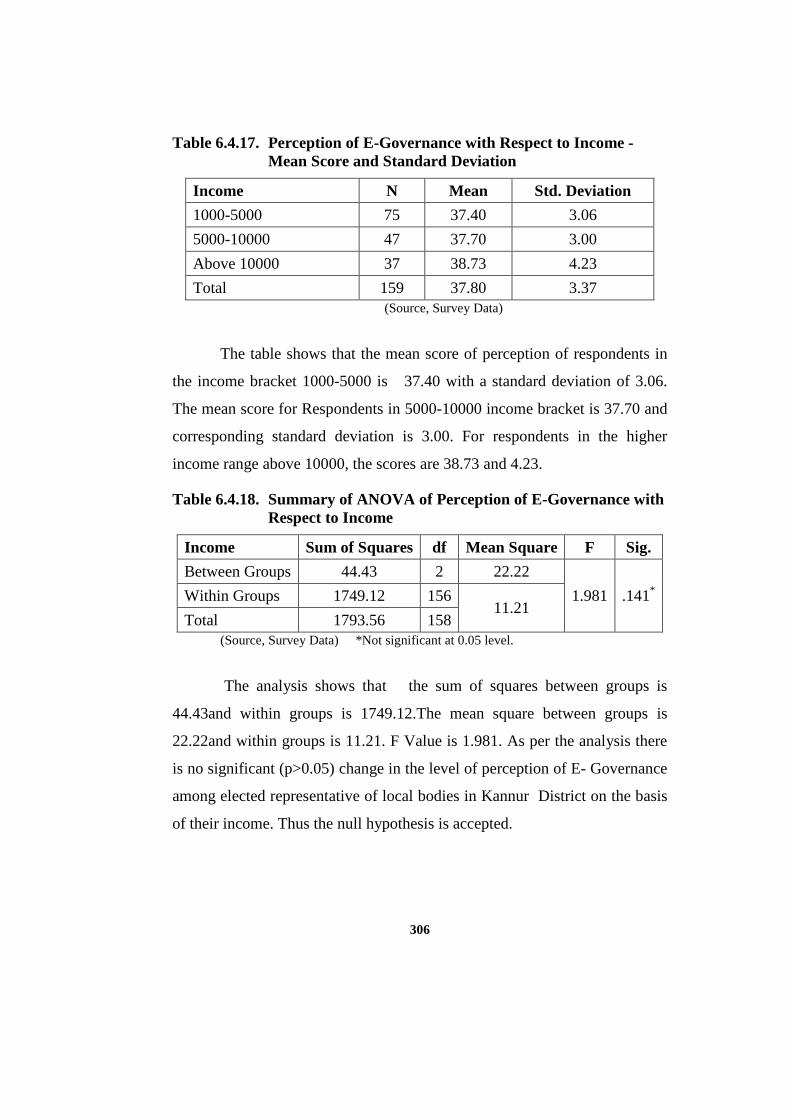
Table 6.4.17. Perception of E-Governance with Respect to Income - Mean Score and Standard Deviation
Income N Mean Std. Deviation
1000-5000 75 37.40 3.06
5000-10000 47 37.70 3.00
Above 10000 37 38.73 4.23
Total 159 37.80 3.37 (Source, Survey Data)
The table shows that the mean score of perception of respondents in
the income bracket 1000-5000 is 37.40 with a standard deviation of 3.06.
The mean score for Respondents in 5000-10000 income bracket is 37.70 and
corresponding standard deviation is 3.00. For respondents in the higher
income range above 10000, the scores are 38.73 and 4.23.
Table 6.4.18. Summary of ANOVA of Perception of E-Governance with Respect to Income
Income Sum of Squares df Mean Square F Sig.
Between Groups 44.43 2 22.22
1.981 .141* Within Groups 1749.12 156 11.21
Total 1793.56 158 (Source, Survey Data) *Not significant at 0.05 level.
The analysis shows that the sum of squares between groups is
44.43and within groups is 1749.12.The mean square between groups is
22.22and within groups is 11.21. F Value is 1.981. As per the analysis there
is no significant (p>0.05) change in the level of perception of E- Governance
among elected representative of local bodies in Kannur District on the basis
of their income. Thus the null hypothesis is accepted.

307
6.4.12. Perception of E-Governance with Respect to Profession
Hypothesis H1: There is significant change in the perception of E-Governance
among elected representatives of Local Bodies in Kannur District in relation to
their Profession.
Null Hypothesis H0: There is no significant change in the perception of
E-Governance among elected representatives of Local Bodies in Kannur
District in relation to their Profession
Table 6.4.19. Perception of E-Governance with Respect to Profession - Mean Score and Standard Deviation
Profession N Mean Std. Deviation
Pensioner 24 38.42 3.23
Government/Aided/Co-operative 26 38.42 4.28
Business 29 37.07 3.11
Private Sector 7 39.71 3.86
Kooli 8 38.87 2.75
House Wife 31 37.35 2.87
Farmer 22 37.00 3.38
Un-Employed 12 37.75 3.08
Total 159 37.78 3.37
(Source, Survey Data)
From the above analysis it is seen that the mean score for perception
of respondents who are pensioners is 38.42 with a standard deviation of 3.23.
For the respondents employed in Government/Aided/Co-operative sector, the
figure is 38.42 and 4.28. For business sector the mean value is 37.07 with
standard deviation of 3.11. The mean score for private sector is 39.71 with
corresponding standard deviation of 3.86. For respondents in Kooli category
the scores are 38.87 and 2.75 and for House Wife category it is 37.35 and

308
2.87. For farmers the mean score is 37.00 with standard deviation of 3.38. In
the last category of unemployed respondents, the score is 37.75 and 3.37.
Table 6.4.20. Summary of ANOVA - Perception of E-Governance with Respect to Profession
Profession Sum of Squares df Mean Square F Sig.
Between Groups 89.87 7 12.84
1.138 .342* Within Groups 1703.697 151 11.28
Total 1793.567 158 (Source, Survey Data) *Not significant at 0.05 level
From the analysis, it is evident that that the sum of squares between
groups is 89.87 and within groups is 1703.697.The mean square between
groups is 12.84 and within groups is 11.28. F Value is 1.138. As per the
analysis there is no significant (p>0.05) change in the level of perception of
E- Governance among elected representative of local bodies in Kannur
District on the basis of their of profession. Thus the null hypothesis is
accepted.
6.4.13. Perception of E-Governance with Respect to Degree of Political Engagement
Hypothesis H1: There is significant change in the perception of E-Governance
among elected representatives of Local Bodies in Kannur District in relation to
their degree of political engagement.
Null Hypothesis H0: There is no significant change in the perception of
E-Governance among elected representatives of Local Bodies in Kannur
District in relation to their degree of political engagement.
309
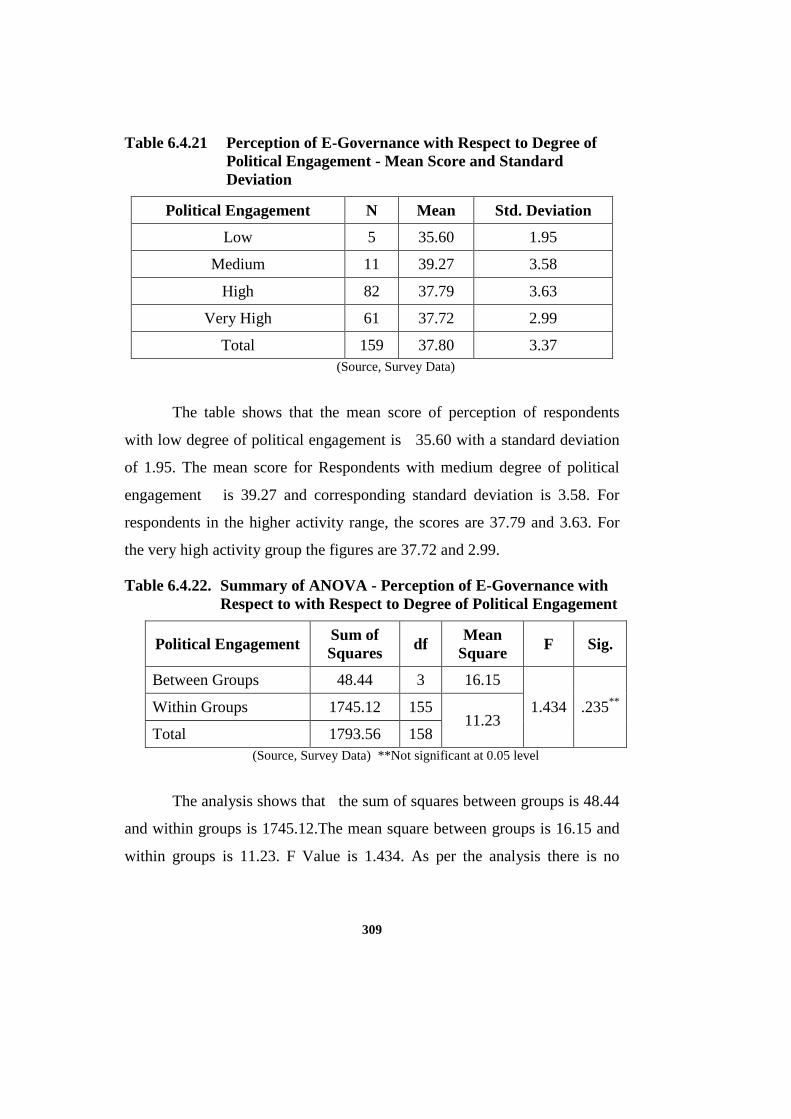
Table 6.4.21 Perception of E-Governance with Respect to Degree of Political Engagement - Mean Score and Standard Deviation
Political Engagement N Mean Std. Deviation
Low 5 35.60 1.95
Medium 11 39.27 3.58
High 82 37.79 3.63
Very High 61 37.72 2.99
Total 159 37.80 3.37 (Source, Survey Data)
The table shows that the mean score of perception of respondents
with low degree of political engagement is 35.60 with a standard deviation
of 1.95. The mean score for Respondents with medium degree of political
engagement is 39.27 and corresponding standard deviation is 3.58. For
respondents in the higher activity range, the scores are 37.79 and 3.63. For
the very high activity group the figures are 37.72 and 2.99.
Table 6.4.22. Summary of ANOVA - Perception of E-Governance with Respect to with Respect to Degree of Political Engagement
(Source, Survey Data) **Not significant at 0.05 level
The analysis shows that the sum of squares between groups is 48.44
and within groups is 1745.12.The mean square between groups is 16.15 and
within groups is 11.23. F Value is 1.434. As per the analysis there is no
Political Engagement Sum of Squares df
Mean Square F Sig.
Between Groups 48.44 3 16.15
1.434 .235** Within Groups 1745.12 155 11.23
Total 1793.56 158

310
significant (p>0.05) change in the perception of E- Governance among
elected representative of local bodies in Kannur District on the basis of their
with respect to degree of political engagement. Thus the null hypothesis is
accepted.
6.5 Barriers in the Acceptance of E-Governance
The acceptance of E-Governance among the elected representatives is
a major factor contributing to the diffusion and employment of ICT in local
governance. From the study it was found that the acceptance level of
E-Governance among the representatives is low. In this context the study
proceeds to identify the major barriers in the acceptance of E-Governance
among the elected representatives of local bodies in Kannur district.
<
Table 6.5.1. Availability of Training
Sl. No. Availability of Training Frequency Percentage
1 No Training 154 96.9
2 Some Training 1 0.6
3 Good Training 4 2.5
4 Very Good Training 0 0
Total 159 100
(Source, Survey Data)
From the table it is evident that majority of the respondents (96.9%)
were not given any ICT related training by any public agency. Only 2.5%
respondents reported good training and 2.5 % gained some training. It is
identified that the training needs of the representatives are yet to be met by
the public agencies and absence of adequate training remains a stumbling
block in the acceptance of E-Governance.
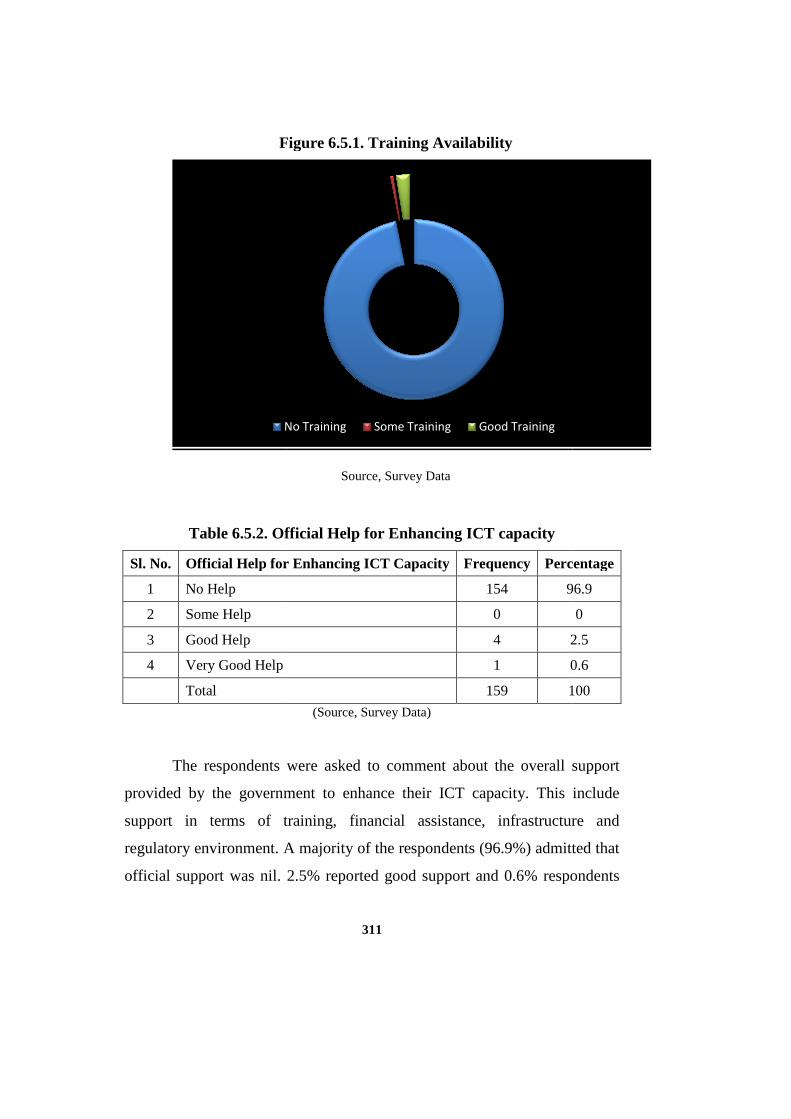
Figure 6.
Table 6.5.2. Official
Sl. No. Official Help for E
1 No Help
2 Some Help
3 Good Help
4 Very Good Help
Total
The respondents were asked to comment about the overall support
provided by the government to enhance their ICT capacity. This include
support in terms of training, financial assistance, infrastructure and
regulatory environment. A majority of the respondents (96.9%) admitted that
official support was nil.
No Training
311
Figure 6.5.1. Training Availability
Source, Survey Data
Official Help for Enhancing ICT capacity
Help for Enhancing ICT Capacity Frequency Percentage
154 96.
0
4 2.5
1 0.6
159 100
(Source, Survey Data)
The respondents were asked to comment about the overall support
provided by the government to enhance their ICT capacity. This include
support in terms of training, financial assistance, infrastructure and
A majority of the respondents (96.9%) admitted that
2.5% reported good support and 0.6% respondents
No Training Some Training Good Training
Percentage
96.9
0
2.5
0.6
100
The respondents were asked to comment about the overall support
provided by the government to enhance their ICT capacity. This include
support in terms of training, financial assistance, infrastructure and
A majority of the respondents (96.9%) admitted that
.6% respondents

312
reported very good official support. It shows that shortage/absence of
government initiatives and motivation is also affecting ICT development in
local government.
Table 6:5.3, Problems in E-Governance
Sl. No. Problems in E-Governance Frequency Percentage
1 Don’t know 88 55.4
2 No Problem 21 13.2
3 Complicated Technology 22 13.8
4 Security 28 17.6
Total 159 100
(Source, Survey Data)
The respondents identified security as a great concern in E-Governance
(17.6%). Complicated technology was the second concern with 13.6%
respondents commenting on it. Many felt that data in the computer and cyber
world is not secure. To others technology is complex by nature and
technology mediated governance is too complex for the ordinary. 55.4%
respondents were not aware of any issues in E-Governance while 13.3% felt
that there are no serious issues in the implementation of E-Governance. It is
found that the lack of proper awareness is a major concern in the acceptance
of E-Governance.
313
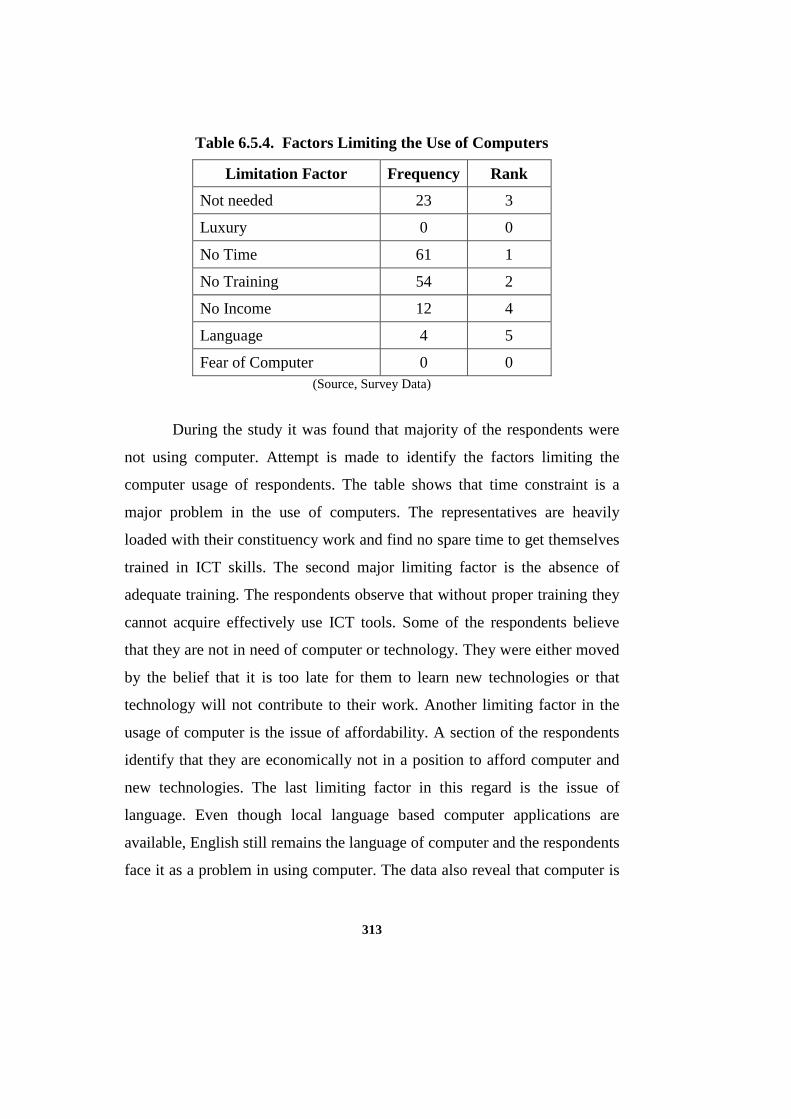
Table 6.5.4. Factors Limiting the Use of Computers
Limitation Factor Frequency Rank
Not needed 23 3
Luxury 0 0
No Time 61 1
No Training 54 2
No Income 12 4
Language 4 5
Fear of Computer 0 0 (Source, Survey Data)
During the study it was found that majority of the respondents were
not using computer. Attempt is made to identify the factors limiting the
computer usage of respondents. The table shows that time constraint is a
major problem in the use of computers. The representatives are heavily
loaded with their constituency work and find no spare time to get themselves
trained in ICT skills. The second major limiting factor is the absence of
adequate training. The respondents observe that without proper training they
cannot acquire effectively use ICT tools. Some of the respondents believe
that they are not in need of computer or technology. They were either moved
by the belief that it is too late for them to learn new technologies or that
technology will not contribute to their work. Another limiting factor in the
usage of computer is the issue of affordability. A section of the respondents
identify that they are economically not in a position to afford computer and
new technologies. The last limiting factor in this regard is the issue of
language. Even though local language based computer applications are
available, English still remains the language of computer and the respondents
face it as a problem in using computer. The data also reveal that computer is

314
no more seen as a luxury by the respondents and the fear of computer and
technology no longer exist among the respondents.
Table 6.5.5. Suggestions for the Improvement of E-Governance
Suggestions Frequency Rank
No suggestion 5 4
Computer literacy 78 1
More Awareness Campaign 53 2
More Internet Connection 1 6
Reducing Costs 3 5
More Touch Screens 3 5
Village Computer Centres 16 3 (Source, Survey Data)
Computer literacy is identified as the major step for the improvement
of E-Governance. The respondents are of the opinion the E-Literacy
campaign by Akshaya needs be launched with more commitment and vigor.
The second need is more awareness on technology mediated governance and
its role in social life. As a positive step the respondents also suggested the
establishment of more village computer centres to deliver ICT services and
training. Installation of people friendly ICT interfaces like touch screens and
reduction of costs secured fifth priority of the respondents. There was
demand for more internet connections also.

315
Table 6.5.6. Suggestions for Improving ICT Acceptance Among Elected Representatives
Suggestions Frequency Rank
No suggestion 2 6
Computer Training 126 1
Special Allowance 4 4
Free Computer/Subsidy 15 2
Free Internet Connection 4 4
Help of Employees 11 3
Strict Rules 3 5 (Source, Survey Data)
The respondents suggested training as the most important concern for
improving ICT acceptance among the respondents. Free computer/ subsidy
for purchasing computer was another suggestion. Third priority was given
to the support of office staff in the local bodies. Free internet connection and
provision of special allowance gained equal weight as the next most
important suggestion. Some respondents also suggested a better regulatory
environment for internalising ICT tools.
Table 6.5.7. Advantages of E-Governance- Observation of Respondents
Advantages Frequency Rank
No Advantage 3 5
Speed 83 1
Efficiency 24 3
Transparency 41 2
Less Costly 0 0
Simplicity 5 4 (Source, Survey Data)

316
Majority of the respondents identified speed as the most important
advantage of E-Governance. The second important advantage of E-
Governance was identified as transparency. Efficiency was identified as the
third important advantage. Simplicity of procedures was adjudged as another
advantage of E-Governance.
6.6. Conclusion
The data pertaining to Acceptance and perception of E-Governance
among elected representatives of local bodies in Kannur district shows low
acceptance of E-Governance among the respondents. But the respondents
possess high perception of E-Governance. There is also significant variation
of their acceptance of E-Governance after elected. It is also found that the e-
readiness of respondents reflected in level of education, possession of tools,
general ICT environment and regulatory environment is high. The major
problem in the acceptance of E-Governance is the constituency work load of
representatives and absence of training. Local bodies also show
unsatisfactory progress in providing connectivity and ICT infrastructure to
the elected representatives.
Note
1 Even though there is only 50% reservation in the local bodies, samples were taken beyond the quota because some women respondents held general quota seats.