CHAPTER 6 CONNECTING TO VALUE CHAINS: THE … · CHAPTER 6 CONNECTING TO VALUE CHAINS: THE ROLE OF...
26
165 CHAPTER 6 CONNECTING TO VALUE CHAINS: THE ROLE OF TRADE COSTS AND TRADE FACILITATION Contributed by the Organisation for Economic Co-operation and Development AID FOR TRADE AT A GLANCE 2015: REDUCING TRADE COSTS FOR INCLUSIVE, SUSTAINABLE GROWTH - © OECD, WTO 2015 Abstract: This chapter highlights the importance of trade costs for the participation of developing countries in Global and Regional Value Chains. It considers in particular the role of different trade facilitation aspects such as border procedures and quality of infrastructure and shows how developing countries can reduce trade costs through those two specific areas. It discusses then how regional co-operation can be an effective strategy to promote integration into value chains by addressing regional bottlenecks. In addition it reviews multi-country and regional aid for trade initiatives highlighting some of the projects which are yielding good results and others which have not seen as much progress.
Transcript of CHAPTER 6 CONNECTING TO VALUE CHAINS: THE … · CHAPTER 6 CONNECTING TO VALUE CHAINS: THE ROLE OF...
165
CHAPTER 6CONNECTING TO VALUE CHAINS: THE ROLE OF TRADE COSTS AND TRADE FACILITATIONContributed by the Organisation for Economic Co-operation and Development
AID FOR TRADE AT A GLANCE 2015: REDUCING TRADE COSTS FOR INCLUSIVE, SUSTAINABLE GROWTH - © OECD, WTO 2015
Abstract: This chapter highlights the importance of trade costs for the participation of developing countries in Global and Regional Value Chains. It considers in particular the role of different trade facilitation aspects such as border procedures and quality of infrastructure and shows how developing countries can reduce trade costs through those two specific areas. It discusses then how regional co-operation can be an effective strategy to promote integration into value chains by addressing regional bottlenecks. In addition it reviews multi-country and regional aid for trade initiatives highlighting some of the projects which are yielding good results and others which have not seen as much progress.
166
CHAPTER 6: CONNECTING TO VALUE CHAINS: THE ROLE OF TRADE COSTS AND TRADE FACILITATION
AID FOR TRADE AT A GLANCE 2015: REDUCING TRADE COSTS FOR INCLUSIVE, SUSTAINABLE GROWTH - © OECD, WTO 2015
INTRODUCTION
The internationalisation of production has given rise to complex cross-border flows of goods, know-how, investment, services and people, referred to as supply-chain trade. These chains can offer developing countries new opportunities to integrate into the global economy by allowing firms to join international production networks rather than having to build their own from scratch. They call however for a stronger focus on addressing policy and non-policy related trade costs so as to ensure that every stage of the production chain functions efficiently and that trade is as frictionless as possible.
The growing fragmentation of production across borders highlights the need for countries to have an open, predictable and transparent trade and investment regime as tariffs, non-tariff barriers and other restrictive measures affect not only foreign suppliers but also domestic producers. Success in international markets today depends as much on the capacity to import world class inputs as on the capacity to export. Barriers to imports of intermediate products increase the costs of production and reduce a country’s ability to compete in export markets: tariffs and other barriers on imports such as inefficient border procedures are a tax on exports.
Multilateral and regional trade agreements can help firms enter and grow in GVCs if they are consistent with regional production networks. Gains will be greatest when more countries participate and intermediate inputs can be sourced globally. However, regional trade and investment agreements can also be effective if they help deepen integration by covering as many dimensions of GVCs as possible, including tariffs, technical measures, services and trade facilitation measures, as well as competition policy, investment, intellectual property protection and dispute settlement.
Many of the costs that affect the smooth connection of various parts of the chain often seem to transcend national borders. In both developing and developed countries, trade facilitation in its narrow (World Bank Logistics Performance Indicator for customs) or broad (infrastructure, IPR, broadband and electricity) definition seems to be an important determinant of GVC participation. With goods crossing borders multiple times as a result of enhanced GVC activity, trade facilitation has become central to the smooth functioning of GVCs. For this reason initiatives to enhance connectivity which are undertaken at the regional level can often be more effective in addressing such costs than purely national initiatives. In response, several aid-for-trade projects have targeted regional constraints and successfully improved regional economic co-operation.
THE GLOBAL AND REGIONAL DIMENSIONS TO VALUE CHAINS
The international fragmentation of production has enabled firms to participate in an increasing array of tasks scattered across diverse international locations. Participating in international value chains means being linked to activities such as farming, extraction of natural resources, research and development, different types of manufacturing, design, management, marketing, distribution or post-sale services through the process of value creation. However, the complexity of production is growing, and bringing a product from conception to end-use now requires not just co-ordinating activities across different sites but also seamlessly moving products between these. Trade costs are therefore key to the well-functioning of GVCs, as is born out in a recent empirical assessment of the relative importance of the different determinants of GVC participation (OECD, 2015).
How do countries engage in GVCs?
Indicators of GVC participation distinguish between situations where firms use foreign goods and services as inputs into their exports (backward participation) and where firms supply intermediate goods and services for other countries’ export activities (forward participation). Backward participation is measured as the share of foreign value added in country’s gross exports, whereas forward participation is measured by the share in gross exports of domestic value added embodied in exported intermediate products, which are in turn used by firms in other countries to produce their own exports.
167
CHAPTER 6: CONNECTING TO VALUE CHAINS: THE ROLE OF TRADE COSTS AND TRADE FACILITATION
AID FOR TRADE AT A GLANCE 2015: REDUCING TRADE COSTS FOR INCLUSIVE, SUSTAINABLE GROWTH - © OECD, WTO 2015
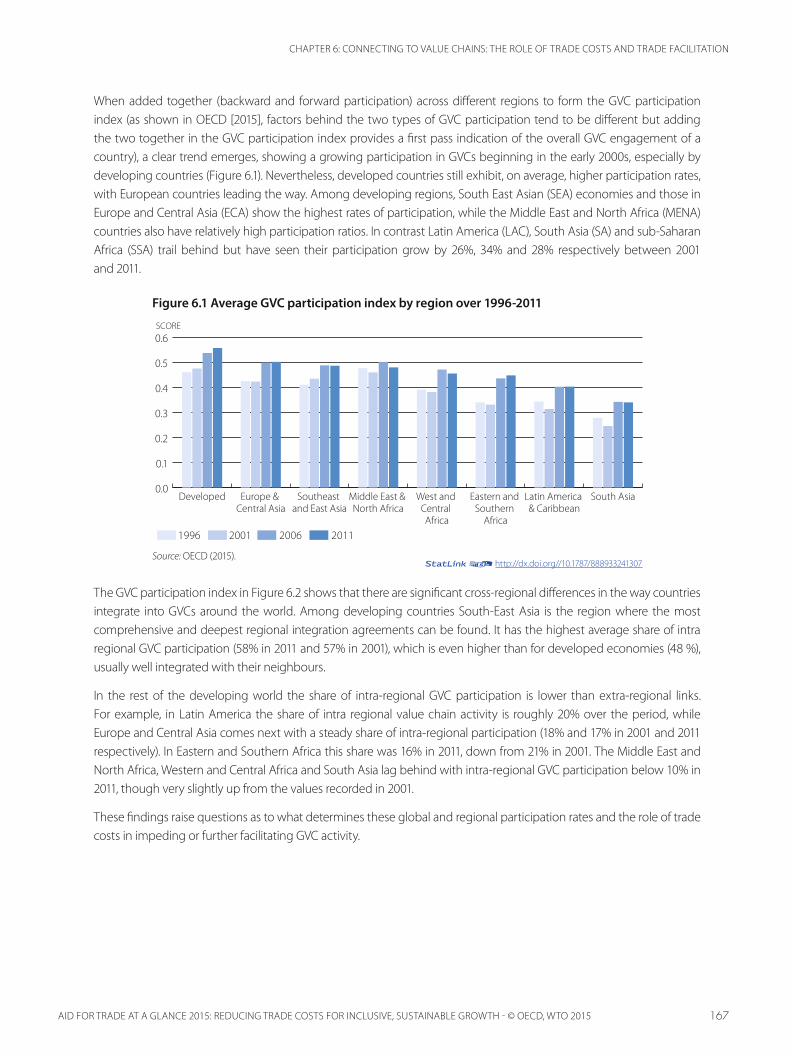
When added together (backward and forward participation) across different regions to form the GVC participation index (as shown in OECD [2015], factors behind the two types of GVC participation tend to be different but adding the two together in the GVC participation index provides a first pass indication of the overall GVC engagement of a country), a clear trend emerges, showing a growing participation in GVCs beginning in the early 2000s, especially by developing countries (Figure 6.1). Nevertheless, developed countries still exhibit, on average, higher participation rates, with European countries leading the way. Among developing regions, South East Asian (SEA) economies and those in Europe and Central Asia (ECA) show the highest rates of participation, while the Middle East and North Africa (MENA) countries also have relatively high participation ratios. In contrast Latin America (LAC), South Asia (SA) and sub-Saharan Africa (SSA) trail behind but have seen their participation grow by 26%, 34% and 28% respectively between 2001 and 2011.
Figure 6.1 Average GVC participation index by region over 1996-2011
Source: OECD (2015).
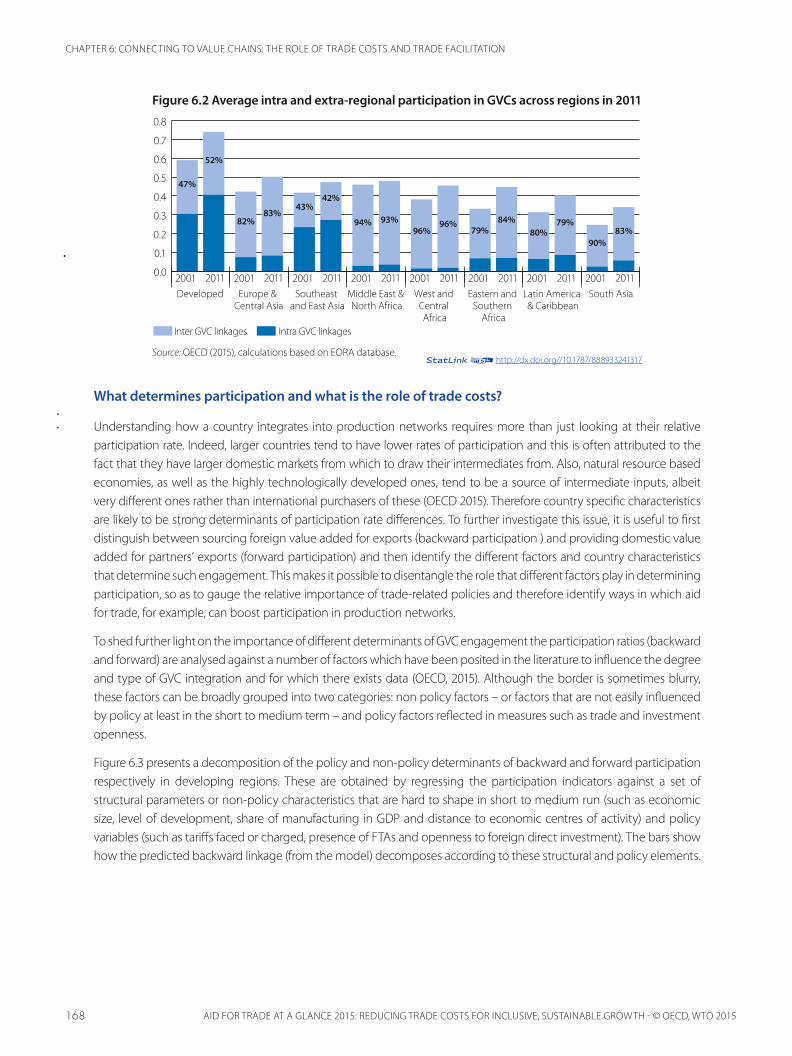
The GVC participation index in Figure 6.2 shows that there are significant cross-regional differences in the way countries integrate into GVCs around the world. Among developing countries South-East Asia is the region where the most comprehensive and deepest regional integration agreements can be found. It has the highest average share of intra regional GVC participation (58% in 2011 and 57% in 2001), which is even higher than for developed economies (48 %), usually well integrated with their neighbours.
In the rest of the developing world the share of intra-regional GVC participation is lower than extra-regional links. For example, in Latin America the share of intra regional value chain activity is roughly 20% over the period, while Europe and Central Asia comes next with a steady share of intra-regional participation (18% and 17% in 2001 and 2011 respectively). In Eastern and Southern Africa this share was 16% in 2011, down from 21% in 2001. The Middle East and North Africa, Western and Central Africa and South Asia lag behind with intra-regional GVC participation below 10% in 2011, though very slightly up from the values recorded in 2001.
These findings raise questions as to what determines these global and regional participation rates and the role of trade costs in impeding or further facilitating GVC activity.
1996 2001 2006 2011
SCORE
0.0
0.1
0.2
0.3
0.4
0.5
0.6
South AsiaLatin America & Caribbean
Eastern and Southern
Africa
West and Central Africa
Middle East & North Africa
Southeast and East Asia
Europe & Central Asia
Developed
12http://dx.doi.org//10.1787/888933241307
168
CHAPTER 6: CONNECTING TO VALUE CHAINS: THE ROLE OF TRADE COSTS AND TRADE FACILITATION
AID FOR TRADE AT A GLANCE 2015: REDUCING TRADE COSTS FOR INCLUSIVE, SUSTAINABLE GROWTH - © OECD, WTO 2015
Figure 6.2 Average intra and extra-regional participation in GVCs across regions in 2011
Source: OECD (2015), calculations based on EORA database.
What determines participation and what is the role of trade costs?
Understanding how a country integrates into production networks requires more than just looking at their relative participation rate. Indeed, larger countries tend to have lower rates of participation and this is often attributed to the fact that they have larger domestic markets from which to draw their intermediates from. Also, natural resource based economies, as well as the highly technologically developed ones, tend to be a source of intermediate inputs, albeit very different ones rather than international purchasers of these (OECD 2015). Therefore country specific characteristics are likely to be strong determinants of participation rate differences. To further investigate this issue, it is useful to first distinguish between sourcing foreign value added for exports (backward participation ) and providing domestic value added for partners’ exports (forward participation) and then identify the different factors and country characteristics that determine such engagement. This makes it possible to disentangle the role that different factors play in determining participation, so as to gauge the relative importance of trade-related policies and therefore identify ways in which aid for trade, for example, can boost participation in production networks.
To shed further light on the importance of different determinants of GVC engagement the participation ratios (backward and forward) are analysed against a number of factors which have been posited in the literature to influence the degree and type of GVC integration and for which there exists data (OECD, 2015). Although the border is sometimes blurry, these factors can be broadly grouped into two categories: non policy factors – or factors that are not easily influenced by policy at least in the short to medium term – and policy factors reflected in measures such as trade and investment openness.
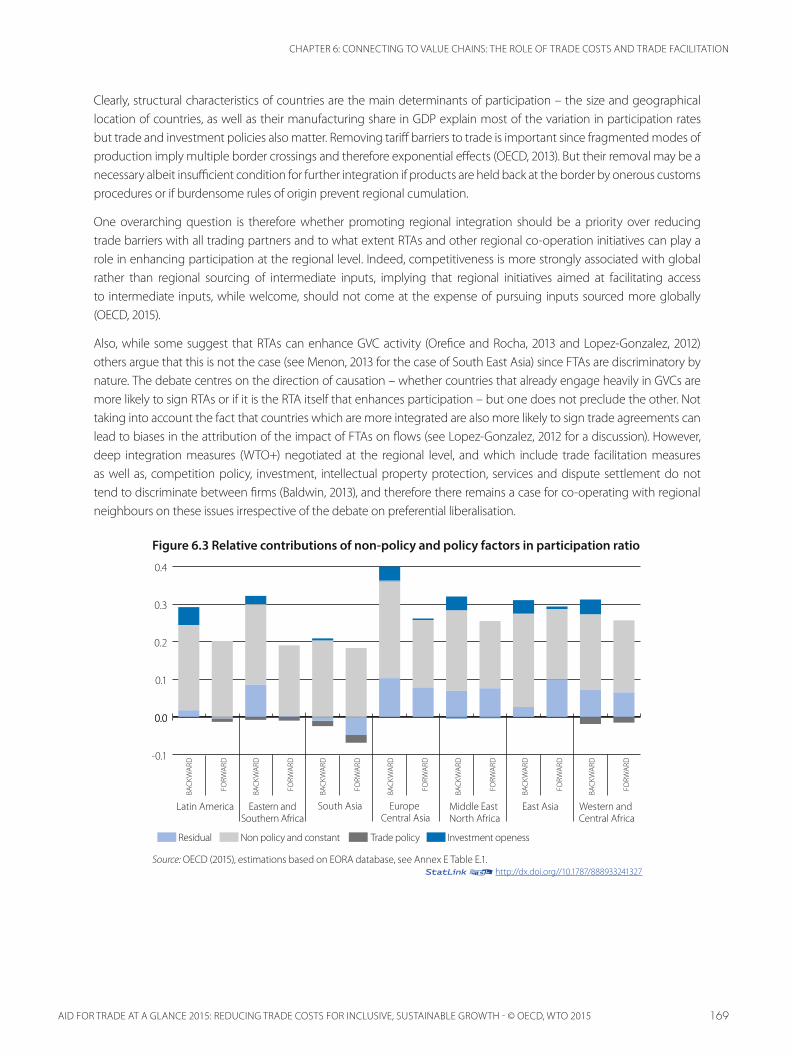
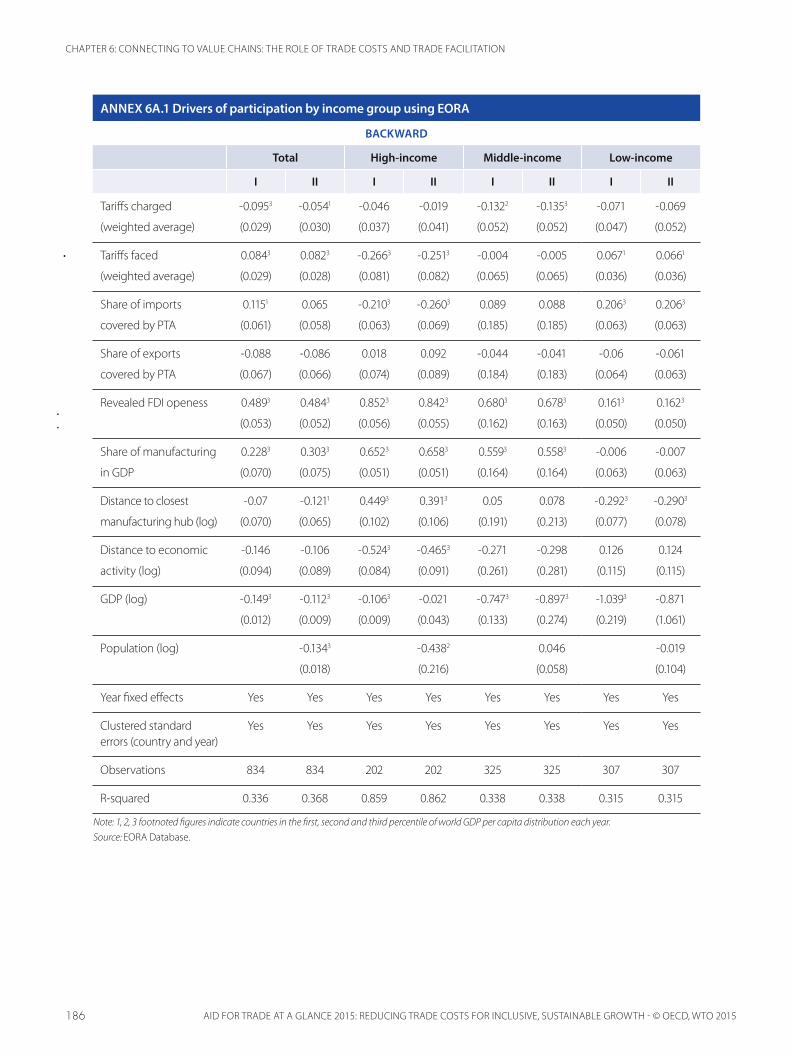
Figure 6.3 presents a decomposition of the policy and non-policy determinants of backward and forward participation respectively in developing regions. These are obtained by regressing the participation indicators against a set of structural parameters or non-policy characteristics that are hard to shape in short to medium run (such as economic size, level of development, share of manufacturing in GDP and distance to economic centres of activity) and policy variables (such as tariffs faced or charged, presence of FTAs and openness to foreign direct investment). The bars show how the predicted backward linkage (from the model) decomposes according to these structural and policy elements.
Inter GVC linkages Intra GVC linkages
0.0
0.1
0.2
0.3
0.4
0.5
0.6
0.7
0.8
2001 2011 2001 2011 2001 2011 2001 2011 2001 2011 2001 2011 2001 2011 2001 2011South AsiaLatin America
& CaribbeanEastern and
Southern Africa
West and Central Africa
Middle East & North Africa
Southeast and East Asia
Europe & Central Asia
Developed
47%
52%
82%83%
43%42%
94% 93%96%
96%79%
84%80%
79%
90%83%
12http://dx.doi.org//10.1787/888933241317
169
CHAPTER 6: CONNECTING TO VALUE CHAINS: THE ROLE OF TRADE COSTS AND TRADE FACILITATION
AID FOR TRADE AT A GLANCE 2015: REDUCING TRADE COSTS FOR INCLUSIVE, SUSTAINABLE GROWTH - © OECD, WTO 2015
Clearly, structural characteristics of countries are the main determinants of participation – the size and geographical location of countries, as well as their manufacturing share in GDP explain most of the variation in participation rates but trade and investment policies also matter. Removing tariff barriers to trade is important since fragmented modes of production imply multiple border crossings and therefore exponential effects (OECD, 2013). But their removal may be a necessary albeit insufficient condition for further integration if products are held back at the border by onerous customs procedures or if burdensome rules of origin prevent regional cumulation.
One overarching question is therefore whether promoting regional integration should be a priority over reducing trade barriers with all trading partners and to what extent RTAs and other regional co-operation initiatives can play a role in enhancing participation at the regional level. Indeed, competitiveness is more strongly associated with global rather than regional sourcing of intermediate inputs, implying that regional initiatives aimed at facilitating access to intermediate inputs, while welcome, should not come at the expense of pursuing inputs sourced more globally (OECD, 2015).
Also, while some suggest that RTAs can enhance GVC activity (Orefice and Rocha, 2013 and Lopez-Gonzalez, 2012) others argue that this is not the case (see Menon, 2013 for the case of South East Asia) since FTAs are discriminatory by nature. The debate centres on the direction of causation – whether countries that already engage heavily in GVCs are more likely to sign RTAs or if it is the RTA itself that enhances participation – but one does not preclude the other. Not taking into account the fact that countries which are more integrated are also more likely to sign trade agreements can lead to biases in the attribution of the impact of FTAs on flows (see Lopez-Gonzalez, 2012 for a discussion). However, deep integration measures (WTO+) negotiated at the regional level, and which include trade facilitation measures as well as, competition policy, investment, intellectual property protection, services and dispute settlement do not tend to discriminate between firms (Baldwin, 2013), and therefore there remains a case for co-operating with regional neighbours on these issues irrespective of the debate on preferential liberalisation.
Figure 6.3 Relative contributions of non-policy and policy factors in participation ratio
Source: OECD (2015), estimations based on EORA database, see Annex E Table E.1.
Residual Non policy and constant Trade policy Investment openess
0.0
0.1
0.2
0.3
0.4
-0.1
0.0
Western and Central Africa
East AsiaMiddle East North Africa
Europe Central Asia
South AsiaEastern andSouthern Africa
Latin America
BACK
WAR
D
FORW
ARD
BACK
WAR
D
FORW
ARD
BACK
WAR
D
FORW
ARD
BACK
WAR
D
FORW
ARD
BACK
WAR
D
FORW
ARD
BACK
WAR
D
FORW
ARD
BACK
WAR
D
FORW
ARD
12http://dx.doi.org//10.1787/888933241327
170
CHAPTER 6: CONNECTING TO VALUE CHAINS: THE ROLE OF TRADE COSTS AND TRADE FACILITATION
AID FOR TRADE AT A GLANCE 2015: REDUCING TRADE COSTS FOR INCLUSIVE, SUSTAINABLE GROWTH - © OECD, WTO 2015
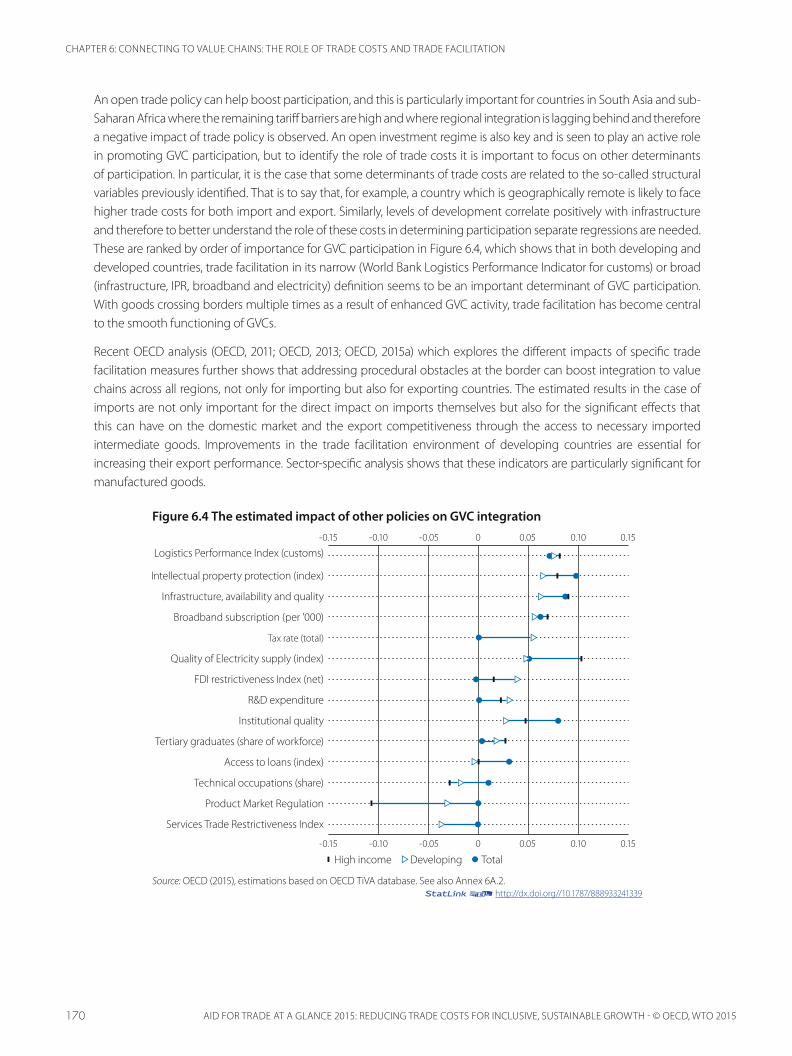
An open trade policy can help boost participation, and this is particularly important for countries in South Asia and sub-Saharan Africa where the remaining tariff barriers are high and where regional integration is lagging behind and therefore a negative impact of trade policy is observed. An open investment regime is also key and is seen to play an active role in promoting GVC participation, but to identify the role of trade costs it is important to focus on other determinants of participation. In particular, it is the case that some determinants of trade costs are related to the so-called structural variables previously identified. That is to say that, for example, a country which is geographically remote is likely to face higher trade costs for both import and export. Similarly, levels of development correlate positively with infrastructure and therefore to better understand the role of these costs in determining participation separate regressions are needed. These are ranked by order of importance for GVC participation in Figure 6.4, which shows that in both developing and developed countries, trade facilitation in its narrow (World Bank Logistics Performance Indicator for customs) or broad (infrastructure, IPR, broadband and electricity) definition seems to be an important determinant of GVC participation. With goods crossing borders multiple times as a result of enhanced GVC activity, trade facilitation has become central to the smooth functioning of GVCs.
Recent OECD analysis (OECD, 2011; OECD, 2013; OECD, 2015a) which explores the different impacts of specific trade facilitation measures further shows that addressing procedural obstacles at the border can boost integration to value chains across all regions, not only for importing but also for exporting countries. The estimated results in the case of imports are not only important for the direct impact on imports themselves but also for the significant effects that this can have on the domestic market and the export competitiveness through the access to necessary imported intermediate goods. Improvements in the trade facilitation environment of developing countries are essential for increasing their export performance. Sector-specific analysis shows that these indicators are particularly significant for manufactured goods.
Figure 6.4 The estimated impact of other policies on GVC integration
-0.05 0 0.05 0.10 0.15-0.10-0.15
-0.05 0 0.05 0.10 0.15-0.10-0.15
Services Trade Restrictiveness Index
High income Developing Total
Product Market Regulation
Technical occupations (share)
Access to loans (index)
Tertiary graduates (share of workforce)
Institutional quality
R&D expenditure
FDI restrictiveness Index (net)
Quality of Electricity supply (index)
Tax rate (total)
Broadband subscription (per '000)
Infrastructure, availability and quality
Intellectual property protection (index)
Logistics Performance Index (customs)
Source: OECD (2015), estimations based on OECD TiVA database. See also Annex 6A.2.12http://dx.doi.org//10.1787/888933241339

171
CHAPTER 6: CONNECTING TO VALUE CHAINS: THE ROLE OF TRADE COSTS AND TRADE FACILITATION
AID FOR TRADE AT A GLANCE 2015: REDUCING TRADE COSTS FOR INCLUSIVE, SUSTAINABLE GROWTH - © OECD, WTO 2015
Hence the ability of economies to integrate efficiently into the global economy depends to a great extent on the quality of both hard and soft infrastructure, ranging from transportation, telecommunications and financial services to border processes, customs practices and the business and regulatory environments. A regional co-operation approach to tackling these costs is likely to be beneficial since regional trade and indeed trade with partners located outside the region will need to transit through neighbouring countries on its way to its users (firms or consumers).
A REGIONAL PERSPECTIVE ON TRADE COSTS
The ESCAP-World Bank Trade Cost Database estimates that only 0-10% of trade costs are tariffs, while 10-30% correspond to natural trade costs (i.e. geographical and cultural factors). The remaining 60-80% relates to non tariff policy measures such as indirect costs of trade procedures, maritime connectivity and services, the business (regulatory) environment, currency fluctuations and the availability/use of ICT services (ESCAP, 2014). Cadot et al. (2015) found that SPS and TBT measures would increase import unit values by roughly 25% for food products. Figure 6.5 shows the ad valorem equivalent of trade costs estimated by Arvis et al. (2012).
Figure 6.5 Trade costs across regions
Note: Bars show ad valorem equivalents of trade costs calculated from Arvis et al. (2013) using the trade cost measure proposed in Novy (2013). Since the data is bilateral, here we show trade-weighted values per country for the year 2010.
Source: OECD (2015), calculations based on ESCAP-World Bank Trade Cost Database.
South East Asian (SEA) countries face the lowest costs among the developing regions under investigation, a factor which surely contributes to their impressive GVC integration. Although much of this might be due to non-policy-related factors, such as economies of scale in shipping (Haddad, 2007), it also reflects the important investment in the region in physical infrastructure. For example, Vietnam invests around 8-10% of its GDP in physical infrastructure (World Bank, 2010). The master plan on ASEAN connectivity, which explicitly aims to tackle trade facilitation issues, has also made an important contribution. It delimits a set of actions ASEAN countries have committed to implementing in view of enhancing connectivity, thereby supporting the goals of the EAC blueprint. In addition to its focus on upgrading physical infrastructure and multimodal transport systems, its institutional infrastructure dimension, with agreed frameworks on the facilitation of transit and inter-state transport as well as the national single window, is likely to bring about important efficiency gains. This not just in terms of connecting regional partners to each other but also in connecting these to other global poles of activity. This should help attract further investment (both domestic and foreign), thereby providing impetus for greater value chain integration.
AVERAGE TRADE COSTS (TRADE WEIGHTED)
CPV
NG
ACI
VG
HA
SEN
LBR
MRT MLI
CMR
BFA
BEN
TGO
GN
QTC
DN
ERG
MB
CAF
ZWE
ZAF
ZMB
KEN
TZA
ETH
MU
SM
WI
UG
AAG
OM
OZ
SDN
RWA
BDI
IND
PAK
AFG
LKA
BTN
NPL
MD
VKA
ZU
ZBM
KDG
EOM
DA
TJK
KGZ
ALB
AZE
ARM
CHL
BRA
CRI
ARG
GTM
HN
DPE
RCO
LEC
USL
VU
RYPA
NN
ICPR
YD
OM
BOL
VEN
DZA IS
RTU
RTU
NM
AR JOR
EGY
IRN
SYR
LBN
YEM
MYS
CHN
VNM
THA
PHL
IDN
PNG
LAO
KHM
KAZ
UZB
MKD
GEO
MD
ATJ
KKG
ZAL
BA
ZE
0
50
100
150
200
250
Central AsiaEast AsiaMiddle East & North Africa
Latin AmericaCentral AsiaSouth Asia
East & Southern Africa
Western & Central Africa
12http://dx.doi.org//10.1787/888933241349
172
CHAPTER 6: CONNECTING TO VALUE CHAINS: THE ROLE OF TRADE COSTS AND TRADE FACILITATION
AID FOR TRADE AT A GLANCE 2015: REDUCING TRADE COSTS FOR INCLUSIVE, SUSTAINABLE GROWTH - © OECD, WTO 2015
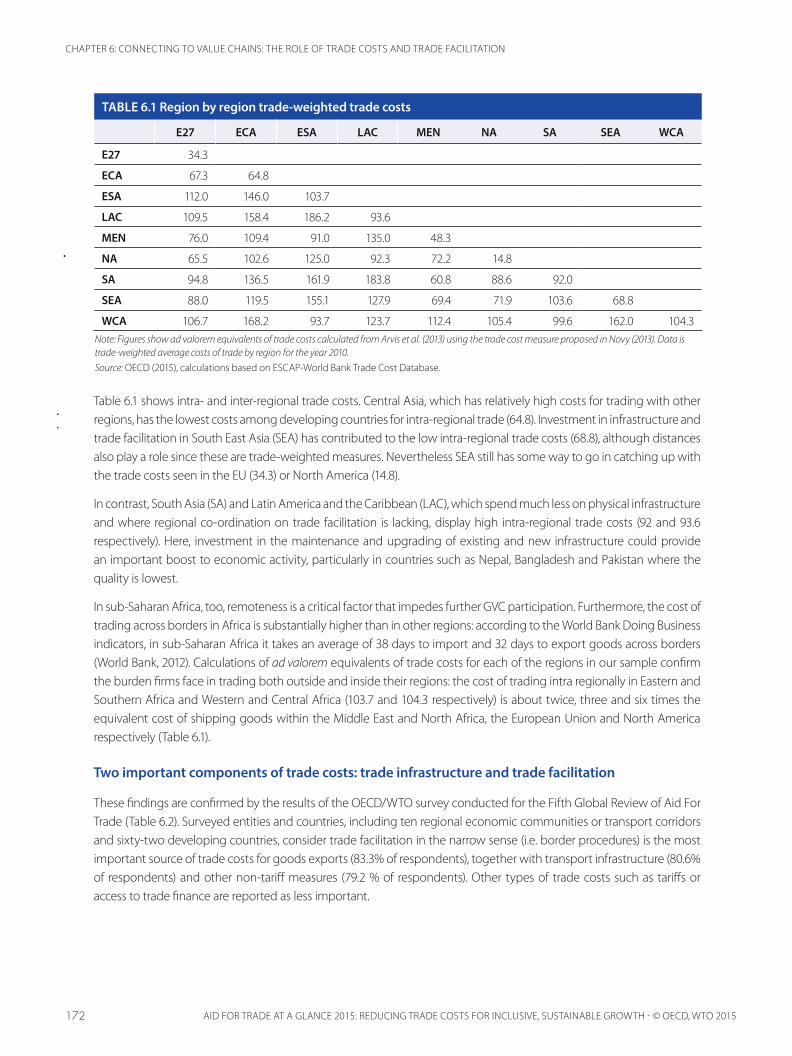
Table 6.1 shows intra- and inter-regional trade costs. Central Asia, which has relatively high costs for trading with other regions, has the lowest costs among developing countries for intra-regional trade (64.8). Investment in infrastructure and trade facilitation in South East Asia (SEA) has contributed to the low intra-regional trade costs (68.8), although distances also play a role since these are trade-weighted measures. Nevertheless SEA still has some way to go in catching up with the trade costs seen in the EU (34.3) or North America (14.8).
In contrast, South Asia (SA) and Latin America and the Caribbean (LAC), which spend much less on physical infrastructure and where regional co-ordination on trade facilitation is lacking, display high intra-regional trade costs (92 and 93.6 respectively). Here, investment in the maintenance and upgrading of existing and new infrastructure could provide an important boost to economic activity, particularly in countries such as Nepal, Bangladesh and Pakistan where the quality is lowest.
In sub-Saharan Africa, too, remoteness is a critical factor that impedes further GVC participation. Furthermore, the cost of trading across borders in Africa is substantially higher than in other regions: according to the World Bank Doing Business indicators, in sub-Saharan Africa it takes an average of 38 days to import and 32 days to export goods across borders (World Bank, 2012). Calculations of ad valorem equivalents of trade costs for each of the regions in our sample confirm the burden firms face in trading both outside and inside their regions: the cost of trading intra regionally in Eastern and Southern Africa and Western and Central Africa (103.7 and 104.3 respectively) is about twice, three and six times the equivalent cost of shipping goods within the Middle East and North Africa, the European Union and North America respectively (Table 6.1).
Two important components of trade costs: trade infrastructure and trade facilitation
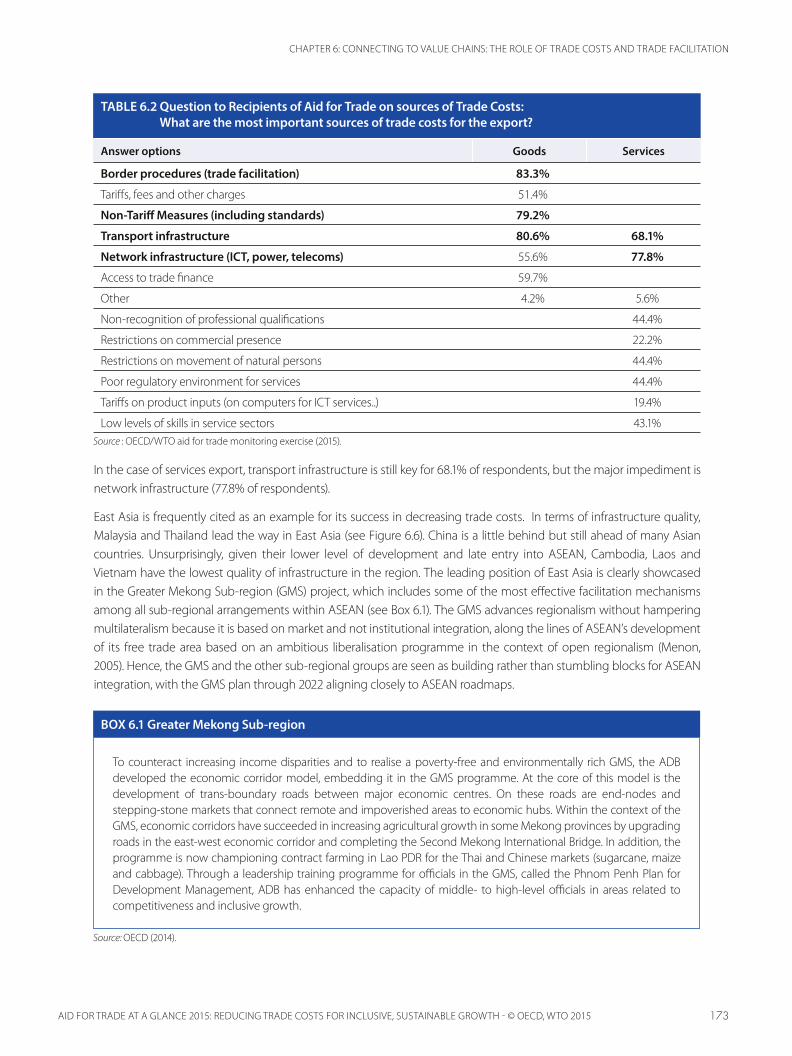
These findings are confirmed by the results of the OECD/WTO survey conducted for the Fifth Global Review of Aid For Trade (Table 6.2). Surveyed entities and countries, including ten regional economic communities or transport corridors and sixty-two developing countries, consider trade facilitation in the narrow sense (i.e. border procedures) is the most important source of trade costs for goods exports (83.3% of respondents), together with transport infrastructure (80.6% of respondents) and other non-tariff measures (79.2 % of respondents). Other types of trade costs such as tariffs or access to trade finance are reported as less important.
TABLE 6.1 Region by region trade-weighted trade costs
E27 ECA ESA LAC MEN NA SA SEA WCA
E27 34.3
ECA 67.3 64.8
ESA 112.0 146.0 103.7
LAC 109.5 158.4 186.2 93.6
MEN 76.0 109.4 91.0 135.0 48.3
NA 65.5 102.6 125.0 92.3 72.2 14.8
SA 94.8 136.5 161.9 183.8 60.8 88.6 92.0
SEA 88.0 119.5 155.1 127.9 69.4 71.9 103.6 68.8
WCA 106.7 168.2 93.7 123.7 112.4 105.4 99.6 162.0 104.3Note: Figures show ad valorem equivalents of trade costs calculated from Arvis et al. (2013) using the trade cost measure proposed in Novy (2013). Data is trade-weighted average costs of trade by region for the year 2010. Source: OECD (2015), calculations based on ESCAP-World Bank Trade Cost Database.
173
CHAPTER 6: CONNECTING TO VALUE CHAINS: THE ROLE OF TRADE COSTS AND TRADE FACILITATION
AID FOR TRADE AT A GLANCE 2015: REDUCING TRADE COSTS FOR INCLUSIVE, SUSTAINABLE GROWTH - © OECD, WTO 2015
In the case of services export, transport infrastructure is still key for 68.1% of respondents, but the major impediment is network infrastructure (77.8% of respondents).
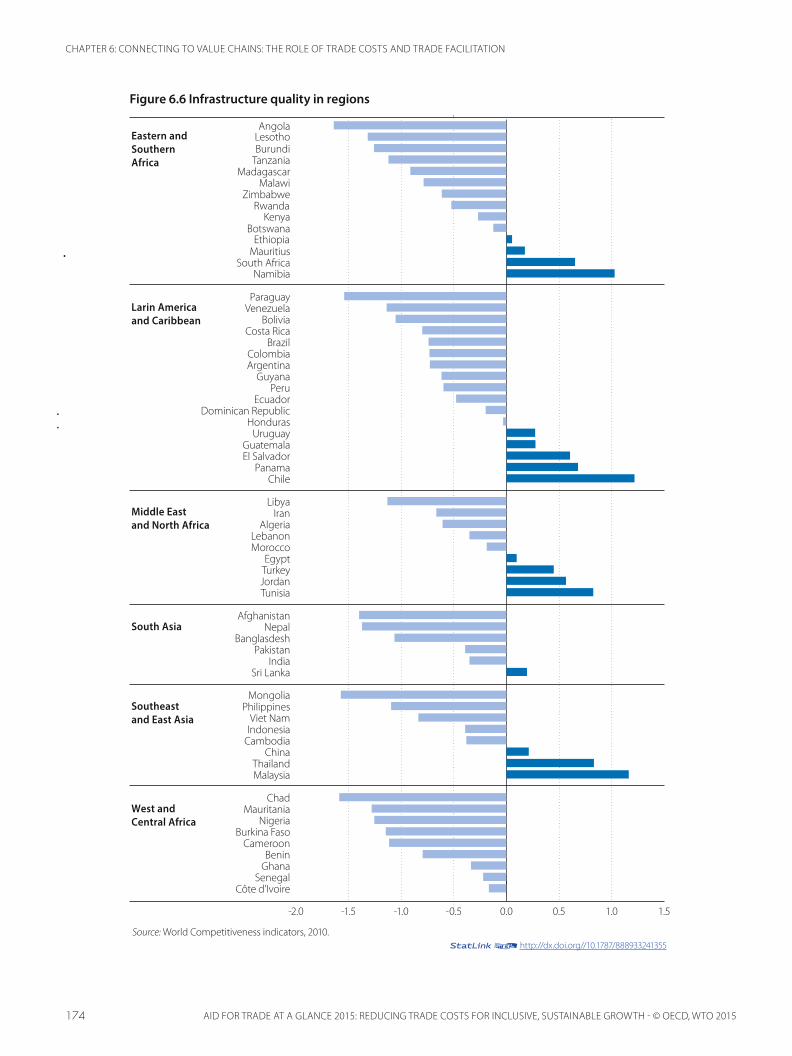
East Asia is frequently cited as an example for its success in decreasing trade costs. In terms of infrastructure quality, Malaysia and Thailand lead the way in East Asia (see Figure 6.6). China is a little behind but still ahead of many Asian countries. Unsurprisingly, given their lower level of development and late entry into ASEAN, Cambodia, Laos and Vietnam have the lowest quality of infrastructure in the region. The leading position of East Asia is clearly showcased in the Greater Mekong Sub-region (GMS) project, which includes some of the most effective facilitation mechanisms among all sub-regional arrangements within ASEAN (see Box 6.1). The GMS advances regionalism without hampering multilateralism because it is based on market and not institutional integration, along the lines of ASEAN’s development of its free trade area based on an ambitious liberalisation programme in the context of open regionalism (Menon, 2005). Hence, the GMS and the other sub-regional groups are seen as building rather than stumbling blocks for ASEAN integration, with the GMS plan through 2022 aligning closely to ASEAN roadmaps.
TABLE 6.2 Question to Recipients of Aid for Trade on sources of Trade Costs: What are the most important sources of trade costs for the export?
Answer options Goods Services
Border procedures (trade facilitation) 83.3%
Tariffs, fees and other charges 51.4%
Non-Tariff Measures (including standards) 79.2%
Transport infrastructure 80.6% 68.1%
Network infrastructure (ICT, power, telecoms) 55.6% 77.8%
Access to trade finance 59.7%
Other 4.2% 5.6%
Non-recognition of professional qualifications 44.4%
Restrictions on commercial presence 22.2%
Restrictions on movement of natural persons 44.4%
Poor regulatory environment for services 44.4%
Tariffs on product inputs (on computers for ICT services..) 19.4%
Low levels of skills in service sectors 43.1%Source : OECD/WTO aid for trade monitoring exercise (2015).
Source: OECD (2014).
To counteract increasing income disparities and to realise a poverty-free and environmentally rich GMS, the ADB developed the economic corridor model, embedding it in the GMS programme. At the core of this model is the development of trans-boundary roads between major economic centres. On these roads are end-nodes and stepping-stone markets that connect remote and impoverished areas to economic hubs. Within the context of the GMS, economic corridors have succeeded in increasing agricultural growth in some Mekong provinces by upgrading roads in the east-west economic corridor and completing the Second Mekong International Bridge. In addition, the programme is now championing contract farming in Lao PDR for the Thai and Chinese markets (sugarcane, maize and cabbage). Through a leadership training programme for officials in the GMS, called the Phnom Penh Plan for Development Management, ADB has enhanced the capacity of middle- to high-level officials in areas related to competitiveness and inclusive growth.
BOX 6.1 Greater Mekong Sub-region
174
CHAPTER 6: CONNECTING TO VALUE CHAINS: THE ROLE OF TRADE COSTS AND TRADE FACILITATION
AID FOR TRADE AT A GLANCE 2015: REDUCING TRADE COSTS FOR INCLUSIVE, SUSTAINABLE GROWTH - © OECD, WTO 2015
Figure 6.6 Infrastructure quality in regions
-2.0 -1.5 -1.0 -0.5 0.0 0.5 1.0 1.5
Côte d'IvoireSenegal
GhanaBenin
CameroonBurkina Faso
NigeriaMauritania
Chad
MalaysiaThailand
ChinaCambodiaIndonesiaViet Nam
PhilippinesMongolia
Sri LankaIndia
PakistanBanglasdesh
NepalAfghanistan
TunisiaJordanTurkeyEgypt
MoroccoLebanon
AlgeriaIran
Libya
ChilePanama
El SalvadorGuatemala
UruguayHonduras
Dominican RepublicEcuador
PeruGuyana
ArgentinaColombia
BrazilCosta Rica
BoliviaVenezuelaParaguay
NamibiaSouth Africa
MauritiusEthiopia
BotswanaKenya
RwandaZimbabwe
MalawiMadagascar
TanzaniaBurundiLesothoAngola
Eastern and Southern Africa
Larin America and Caribbean
Middle East and North Africa
South Asia
Southeast and East Asia
West and Central Africa
Source: World Competitiveness indicators, 2010. 12http://dx.doi.org//10.1787/888933241355
175
CHAPTER 6: CONNECTING TO VALUE CHAINS: THE ROLE OF TRADE COSTS AND TRADE FACILITATION
AID FOR TRADE AT A GLANCE 2015: REDUCING TRADE COSTS FOR INCLUSIVE, SUSTAINABLE GROWTH - © OECD, WTO 2015
The quality of infrastructure is below average in all countries of South Asia except Sri Lanka (see Figure 6.6), and this is likely to hamper integration not just domestically (i.e. connecting more remote regions) but also regionally and internationally. India’s and Pakistan’s performance stands, comparatively, between that of China and Indonesia, but the other South Asian countries are among the lowest performers in Asia, with landlocked Afghanistan, Bangladesh and Nepal scoring particularly low.
In comparison to other developing regions, Latin American and Caribbean countries on average outperform countries in Africa and South Asia in both road and rail density. Even in comparison to SEA, countries in LAC have denser railway networks though sparser road coverage (World Bank, 2015). A caveat is that measures of road and railway densities are imperfect indicators of the quantity of transport services relevant for the development of cross-border linkages to the extent that they do not convey whether production centres are effectively connected to markets. The quality of the road network, proxied by the share of unpaved roads, in LAC is relatively poor when contrasted with other developing regions: almost 70% of the roads in LAC are on average unpaved, contrasting with less than 30% of the roads in SEA and MENA and less than 50 % of the roads in South Asia. Hence, half of countries are well below the average of the quality infrastructure index.
Remoteness in the case of Africa cannot only be thought of in terms of geographical distance; critical elements related to the quality of infrastructure exacerbate this. Figure 6.6 illustrates that, with the exception of South Africa and a few smaller partners, most countries in the region score below the world average (the zero line) in quality of infrastructure. Landlocked countries may be disproportionally affected by the unreliability of supply routes, as firms face high levels of uncertainty over the supply of inputs through other jurisdictions and their production costs. According to anecdotal evidence, firms in Burundi and Zimbabwe, for example, are forced to hold inventories of imported inputs covering up to one year of production to prevent stocking out.
Source: OECD (2014).
Road transportAssessments as of 2006 indicate that more than 80% (3 777 km out of the 4 560 km) of the Lagos-Nouakchott trans-coastal road had been completed. Similarly, 3 894 km of the Dakar-Ndjamena trans-Sahelian road, representing 87% of the total length of 4 460 km, had been completed. In 2012, ECOWAS and the People’s Republic of China signed an agreement for economic co-operation. Part of the agreement covers the construction of a 2000 km long trans-West African coastal highway between Dakar and Lagos.
Rail transportA loan agreement between ECOWAS and the AfDB for a feasibility study on a sub-regional railway master plan was signed in 2002. The 1178 km-long rail line, estimated to cost USD 58.9 billion, which is to link Nigeria to Benin, Togo, Ghana and Côte d’Ivoire, has witnessed very slow progress. There are high expectations regarding the prospects of the project, which is considered as being capable of transforming the region’s transport system through the introduction of new high-speed goods and passenger rail services. The project has potential for greatly enhancing the movement of goods and passengers, generating employment, increasing efficiency, reducing international trade costs and ultimately boosting intra-regional trade.
BOX 6.2 Transport in ECOWAS
Both ECOWAS and UEMOA (West African Economic and Monetary Union) have given special attention to integrating road transport in the sub-region. ECOWAS adopted a priority road transport programme (PRTP), which entails the facilitation of cross-border road transport and the construction of a trans-west African road network that includes the Lagos-Nouakchott trans-coastal and the Dakar-N’Djamena trans-Sahelian roads. Another phase targets vertical
176
CHAPTER 6: CONNECTING TO VALUE CHAINS: THE ROLE OF TRADE COSTS AND TRADE FACILITATION
AID FOR TRADE AT A GLANCE 2015: REDUCING TRADE COSTS FOR INCLUSIVE, SUSTAINABLE GROWTH - © OECD, WTO 2015
interconnection of road segments (north-south) to link landlocked countries to coastal countries. Although yet to be completed, the West African road network is considered one of the most important achievements of the ECOWAS integration programme. The railway project in ECOWAS has been less successful. While the project has been backed by strong political will from the member countries of ECOWAS, it is less clear which donor agencies have committed to funding the project.
But decreasing trade costs is not only about trade infrastructures, it is also about facilitating trade procedures. As regards the disruptive impact burdensome border procedures can have on trade, the example of South Asia is quite revealing. The World Bank (2010) notes that for Nepal to trade goods with India it takes around 200 signatures while trading from India to Nepal requires around 140. But these bottlenecks are not exclusive to landlocked countries: in one important border point between Bangladesh and India, trucks are often required to wait over four days to cross the border (World Bank, 2010).
Source: OECD-WTO case stories (2015).
India and Pakistan share an important border point at Attari-Wagah, which is the only land route for trade between the two countries. Although cross-border trade at this border point is confined to only 137 products mutually agreed between the two countries, the importance of this border point for improving their bilateral trade is well understood. India’s major exports to Pakistan include soya meal cake, fresh fruits and vegetables, biscuits, fresh meat, cotton bales, household goods and polypropylene granules. On the other hand, India’s major imports from Pakistan include gypsum rock, clinker, gypsum powder, salt, soda ash, dry fruits, caustic flake, dry dates, herbs, hydrogen peroxide, limestone, calcium, sugar and household goods. In 2012, the government of India established an Integrated Check Post (ICP) at Attari in Indian Punjab, bordering Wagah in Pakistan Punjab
The government of India has a dedicated 4 700 m2 cargo terminal building, a 7 400 m2 import warehouse, a 3 400 m2 export warehouse and a 55 000 m2 parking area for efficient cargo processing. It provides one-stop integrated facilities such as quarantine, isolation rooms, fumigation centres, a weighbridge, a public address system, boom-barriers, and dormitories. Similar facilities are being developed at Wagah, the Pakistan side of this border point.
According to the data provided by the Indian Customs, in 2012-13, the total value of imports through this border was USD 292 million (54% of India’s total imports from Pakistan that year), against USD 161 million in 2011-12, while exports reached USD 509 million in 2012-13 (25% of India’s total exports to Pakistan that year), as compared to USD 229 million in 2011-12. This increase in trade was mainly attributed to the establishment of the ICP. Traders indicated that the launching of the ICP has significantly reduced their trade transaction costs and provided a speedy clearance of consignments across borders.
This ICP can now handle ten times the number of trucks, and the cargo movement between the two countries is allowed for 12 hours a day, as opposed to eight hours previously. Traffic congestion is negligible since the token system for traffic clearance was introduced. In short, since the establishment of this ICP the number of trucks and the volume of exports and imports has increased substantially.
BOX 6.3 Border post between India and Pakistan
The potential impact of border performance on trade volumes, trade costs, and indicators of GVC participation can be assessed more rigorously using the Trade Facilitation Indicators (TFIs). These were developed by the OECD to help governments schedule and prioritise action in the policy areas covered by the Trade Facilitation Agreement. Covering 152 countries across income levels, geographical regions and development stages, the OECD TFIs provide extensive insights into regional performance.

177
CHAPTER 6: CONNECTING TO VALUE CHAINS: THE ROLE OF TRADE COSTS AND TRADE FACILITATION
AID FOR TRADE AT A GLANCE 2015: REDUCING TRADE COSTS FOR INCLUSIVE, SUSTAINABLE GROWTH - © OECD, WTO 2015
Figure 6.7 provides an overall picture of trade facilitation performance across Asia, Europe and Central Asia (ECA), Middle East and North Africa, Latin America and the Caribbean and sub-Saharan Africa, highlighting the differences in the state of implementation of trade facilitation measures included in the WTO Trade Facilitation Agreement and the areas where the most substantial improvements could be introduced. The most significant performance disparities among regions are in the areas of consultations and opportunities to comment, advance rulings and, to a lesser extent, the simplification and harmonisation of documents. Trade facilitation also has the potential to spur intra-regional trade. This proves to be another important insight as trade facilitation measures can act as a catalyst for consolidating regional production networks.
Consultations and opportunities to comment, together with the availability of trade-related information, the proportionality and transparency of import and export fees and charges, the automation of border processes and the streamlining of border procedures, are key sets of measures for developing the supply side (forward-type linkages) of the value chain activity or the reference country’s export base (OECD, 2015a). On the other hand, advance rulings, the streamlining of border procedures and controls, the proportionality and transparency of import and export fees and charges, and the automation of border processes appear to encourage the most linkages on the demand side (backward-type linkages) of the value chain activity. These findings strongly highlight the importance of predictability and speed of the goods movement in shaping companies’ sourcing decisions.
The OECD TFI analysis also points to a strong positive correlation between trade facilitation performance improvements on the one hand and participation in GVCs on the other. The impact of trade facilitation measures seems to be most significant when the value added originates in medium-low tech industries, such as mining and quarrying or basic metals sectors, or in high and medium-high tech industries, such as transport equipment, chemicals and electrical and optical equipment, while the destination sector belongs to high and medium-high tech industries. Sufficient and easily accessible up-to-date trade-related information, as well as simplified and internationally-harmonised documentary requirements, appear particularly significant in the case of foreign input sourcing for transport equipment, chemicals, and electrical and optical equipment.
Figure 6.7 TFIs and geographic country groups
Sub-Saharan Africa
Latin America and the Caribbean
Middle East and North Africa
Europe (non OECD) and Central Asia
East Asia
South Asia
Governance and impartiality
Border agency cooperation – internal
Formalities – procedures
Formalities – automation
Formalities – documents
Fees and charges
Appeal procedures
Advance rulings
Involvement of trade community
Information availability
0.51.01.52.0
Note: The TFI values range between 0 and 2, where 2 corresponds to the best performance. The values indicate the average TFI performance by country group.
Source: OECD, Trade Facilitation Index. 12http://dx.doi.org//10.1787/888933241362
178
CHAPTER 6: CONNECTING TO VALUE CHAINS: THE ROLE OF TRADE COSTS AND TRADE FACILITATION
AID FOR TRADE AT A GLANCE 2015: REDUCING TRADE COSTS FOR INCLUSIVE, SUSTAINABLE GROWTH - © OECD, WTO 2015
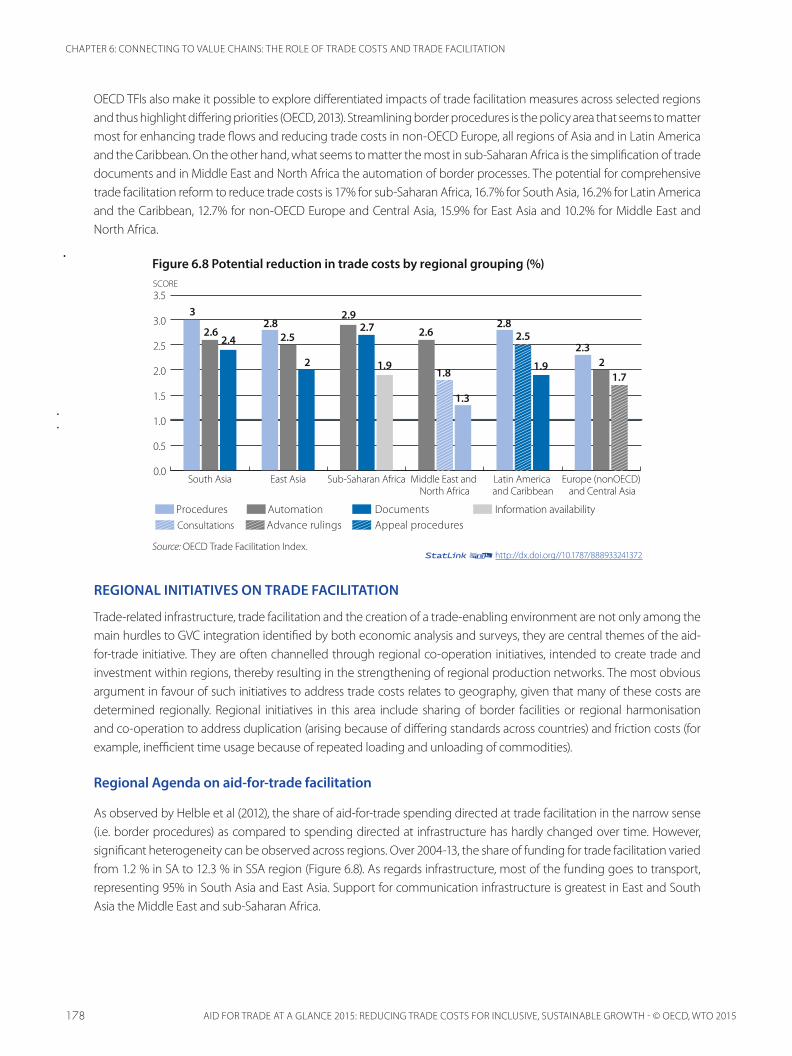
OECD TFIs also make it possible to explore differentiated impacts of trade facilitation measures across selected regions and thus highlight differing priorities (OECD, 2013). Streamlining border procedures is the policy area that seems to matter most for enhancing trade flows and reducing trade costs in non-OECD Europe, all regions of Asia and in Latin America and the Caribbean. On the other hand, what seems to matter the most in sub-Saharan Africa is the simplification of trade documents and in Middle East and North Africa the automation of border processes. The potential for comprehensive trade facilitation reform to reduce trade costs is 17% for sub-Saharan Africa, 16.7% for South Asia, 16.2% for Latin America and the Caribbean, 12.7% for non-OECD Europe and Central Asia, 15.9% for East Asia and 10.2% for Middle East and North Africa.
Figure 6.8 Potential reduction in trade costs by regional grouping (%)
Procedures Automation Documents Information availabilityConsultations Advance rulings Appeal procedures
SCORE
0.0
0.5
1.0
1.5
2.0
2.5
3.5
3.0
Europe (nonOECD) and Central Asia
Latin America and Caribbean
Middle East and North Africa
Sub-Saharan AfricaEast AsiaSouth Asia
3
2.62.4
2.82.5
2
2.92.7
1.9
2.6
1.8
1.3
2.82.5
1.9
2.32
1.7
Source: OECD Trade Facilitation Index.
REGIONAL INITIATIVES ON TRADE FACILITATION
Trade-related infrastructure, trade facilitation and the creation of a trade-enabling environment are not only among the main hurdles to GVC integration identified by both economic analysis and surveys, they are central themes of the aid-for-trade initiative. They are often channelled through regional co-operation initiatives, intended to create trade and investment within regions, thereby resulting in the strengthening of regional production networks. The most obvious argument in favour of such initiatives to address trade costs relates to geography, given that many of these costs are determined regionally. Regional initiatives in this area include sharing of border facilities or regional harmonisation and co-operation to address duplication (arising because of differing standards across countries) and friction costs (for example, inefficient time usage because of repeated loading and unloading of commodities).
Regional Agenda on aid-for-trade facilitation
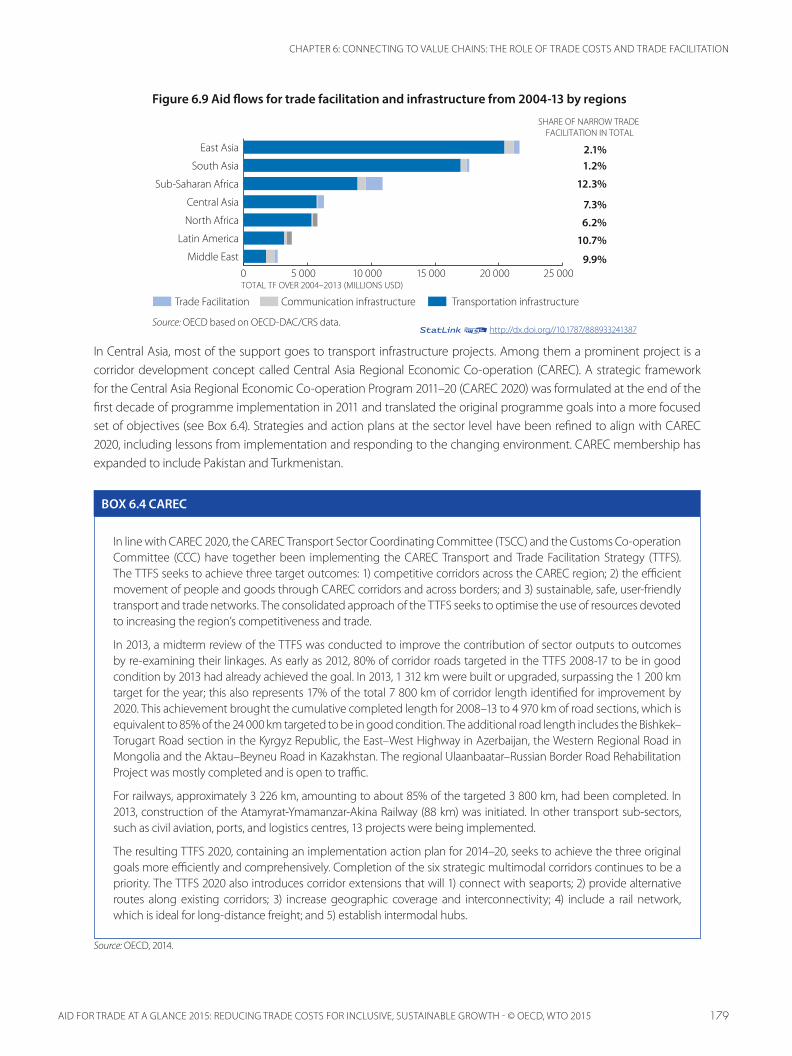
As observed by Helble et al (2012), the share of aid-for-trade spending directed at trade facilitation in the narrow sense (i.e. border procedures) as compared to spending directed at infrastructure has hardly changed over time. However, significant heterogeneity can be observed across regions. Over 2004-13, the share of funding for trade facilitation varied from 1.2 % in SA to 12.3 % in SSA region (Figure 6.8). As regards infrastructure, most of the funding goes to transport, representing 95% in South Asia and East Asia. Support for communication infrastructure is greatest in East and South Asia the Middle East and sub-Saharan Africa.
12http://dx.doi.org//10.1787/888933241372
179
CHAPTER 6: CONNECTING TO VALUE CHAINS: THE ROLE OF TRADE COSTS AND TRADE FACILITATION
AID FOR TRADE AT A GLANCE 2015: REDUCING TRADE COSTS FOR INCLUSIVE, SUSTAINABLE GROWTH - © OECD, WTO 2015
Figure 6.9 Aid flows for trade facilitation and infrastructure from 2004-13 by regions
0 5 000 10 000 15 000 20 000 25 000Middle East
Latin America
North Africa
Central Asia
Sub-Saharan Africa
South Asia
East Asia
Trade Facilitation Communication infrastructure Transportation infrastructure
SHARE OF NARROW TRADE FACILITATION IN TOTAL
TOTAL TF OVER 2004–2013 (MILLIONS USD)
9.9%
10.7%
6.2%
7.3%
12.3%
1.2%2.1%
Source: OECD based on OECD-DAC/CRS data.
In Central Asia, most of the support goes to transport infrastructure projects. Among them a prominent project is a corridor development concept called Central Asia Regional Economic Co-operation (CAREC). A strategic framework for the Central Asia Regional Economic Co-operation Program 2011–20 (CAREC 2020) was formulated at the end of the first decade of programme implementation in 2011 and translated the original programme goals into a more focused set of objectives (see Box 6.4). Strategies and action plans at the sector level have been refined to align with CAREC 2020, including lessons from implementation and responding to the changing environment. CAREC membership has expanded to include Pakistan and Turkmenistan.
Source: OECD, 2014.
In line with CAREC 2020, the CAREC Transport Sector Coordinating Committee (TSCC) and the Customs Co-operation Committee (CCC) have together been implementing the CAREC Transport and Trade Facilitation Strategy (TTFS). The TTFS seeks to achieve three target outcomes: 1) competitive corridors across the CAREC region; 2) the efficient movement of people and goods through CAREC corridors and across borders; and 3) sustainable, safe, user-friendly transport and trade networks. The consolidated approach of the TTFS seeks to optimise the use of resources devoted to increasing the region’s competitiveness and trade.
In 2013, a midterm review of the TTFS was conducted to improve the contribution of sector outputs to outcomes by re-examining their linkages. As early as 2012, 80% of corridor roads targeted in the TTFS 2008-17 to be in good condition by 2013 had already achieved the goal. In 2013, 1 312 km were built or upgraded, surpassing the 1 200 km target for the year; this also represents 17% of the total 7 800 km of corridor length identified for improvement by 2020. This achievement brought the cumulative completed length for 2008–13 to 4 970 km of road sections, which is equivalent to 85% of the 24 000 km targeted to be in good condition. The additional road length includes the Bishkek–Torugart Road section in the Kyrgyz Republic, the East–West Highway in Azerbaijan, the Western Regional Road in Mongolia and the Aktau–Beyneu Road in Kazakhstan. The regional Ulaanbaatar–Russian Border Road Rehabilitation Project was mostly completed and is open to traffic.
For railways, approximately 3 226 km, amounting to about 85% of the targeted 3 800 km, had been completed. In 2013, construction of the Atamyrat-Ymamanzar-Akina Railway (88 km) was initiated. In other transport sub-sectors, such as civil aviation, ports, and logistics centres, 13 projects were being implemented.
The resulting TTFS 2020, containing an implementation action plan for 2014–20, seeks to achieve the three original goals more efficiently and comprehensively. Completion of the six strategic multimodal corridors continues to be a priority. The TTFS 2020 also introduces corridor extensions that will 1) connect with seaports; 2) provide alternative routes along existing corridors; 3) increase geographic coverage and interconnectivity; 4) include a rail network, which is ideal for long-distance freight; and 5) establish intermodal hubs.
BOX 6.4 CAREC
12http://dx.doi.org//10.1787/888933241387
180
CHAPTER 6: CONNECTING TO VALUE CHAINS: THE ROLE OF TRADE COSTS AND TRADE FACILITATION
AID FOR TRADE AT A GLANCE 2015: REDUCING TRADE COSTS FOR INCLUSIVE, SUSTAINABLE GROWTH - © OECD, WTO 2015
Infrastructure and trade facilitation elements may also be combined in regional projects, such as the TTFS in CAREC, which also includes a trade facilitation component managed by the Customs Co-operation Committee. The combined aspects of the project helped reduce the average clearance time at border crossings by 8%, or almost an hour, from 10.9 hours in 2012 to 10.0 hours in 2013 (CAREC CPMM Annual Report 2013). In particular, road border-crossing times shortened remarkably, from an average of 8.9 hours to 5.6 hours due to shorter durations across almost all corridors.
An African road project which sought to combine trade facilitation components with transport infrastructure components, but with less success, is the Abidjan-Lagos trade transportation facilitation project (ALTTFP), initiated by ECOWAS. ALTTFP is not only about improvement of the corridor’s road infrastructure but also includes features such as co-ordination and corridor performance monitoring and evaluation. Eight indicators have been developed to measure the performance of the project. Interim assessment indicates that the project is proceeding gradually. However, it is confronted with implementation problems, particularly, insufficient country ownership of the project and problems relating to the data collection that would enable a better evaluation of performance.
Projects specifically focusing on trade facilitation are most prevalent in sub-Saharan Africa. Recently and in conformity with the New Partnership for Africa’s Development (NEPAD) action plan, ECOWAS and UEMOA developed a regional Interstate Road Transport and Transit Facilitation Programme for West Africa (ISRTTFP-WA) (the EU has committed EUR 63.8 million to this project from the 9th European Development Fund [EDF] to finance technical assistance). It involves the following activities: simplification and harmonisation of road transport regulations, procedures and documents, the establishment of joint border posts along interstate corridors and the creation of observatories to identify and analyse abnormal practices which impede traffic fluidity on road corridors. While some successes have been achieved, the implementation of the transport facilitation programmes by member states has encountered many difficulties. An analysis of the extent of implementation by the ECOWAS Commission and USAID highlights a number of factors stalling effective implementation, including a low-level of promulgation of ECOWAS Trade Liberalisation Scheme (ETLS) protocols into national laws and insufficient publication of rules and procedures. Economic operators are thus not adequately sensitised to the conventions of the ISRT. Hence numerous checkpoints and non-tariff barriers due to uncoordinated procedures for goods and passengers continue to exist.
The ECOWAS Joint Border Posts (JBPs) have also created high expectations but still face important challenges due to the lack of funding for remaining JBPs and inadequate capacity and knowledge within member states to support ECOWAS in implementing JBP projects, as noted in the recent review of the project.
Source: OECD (2014).
The programme includes the construction and equipment of JBPs, with scanners and weighbridges. Thus far, the Togo/Ghana and the Benin/Niger JBPs have been completed. Currently ongoing elements include the Nigeria/Benin, Benin/Togo and the Gambia/Senegal bridge. The latter two are being implemented by the African Development Bank. The three remaining JBPs that require funding include Elubo/Noé (Ghana/Côte d’Ivoire), Kouremale (Guinea/Mali) and Paga (Ghana/Burkina Faso).
The programme has also developed a generic regional text to guide the establishment and operation of JBPs in West Africa. The framework also includes a compendium of operational procedure manuals containing the step-by-step procedures governing each statutory border agency and customised to suit the situation of each border.
The JBP concept is based on the exchange of information and interconnection of customs administration systems. The use of ICT to ensure simultaneous inspection and border controls will be adopted. The World Customs Organization principles of integrated border management, single windows and risk management will be adopted and enshrined in the activities of border officials and agencies to minimise time and associated cost spent at borders. It also includes training of border control officials and sensitisation of users.
BOX 6.5 Joint border posts in ECOWAS
181
CHAPTER 6: CONNECTING TO VALUE CHAINS: THE ROLE OF TRADE COSTS AND TRADE FACILITATION
AID FOR TRADE AT A GLANCE 2015: REDUCING TRADE COSTS FOR INCLUSIVE, SUSTAINABLE GROWTH - © OECD, WTO 2015
The second most important recipient of aid-for-trade facilitation is Latin America. For instance, an international transit tool (TIM), in the form of an electronic system that efficiently manages goods in transit from Mexico to Panama, was implemented under the Mesoamerican Project and supported by the IDB (see Box 6.7). In Brazil, business and government co-operated to implement a foreign trade mapping process project to reduce behind-the-border barriers affecting trade in goods. The project, considered as a successful case of public-private partnership (see World Economic Forum “Enabling trade - catalysing trade facilitation agreement implementation in Brazil”), laid the basis for the implementation of Brazil s single window. Brazil also intends to help undertake similar projects in Uruguay and Paraguay, providing technical and finance assistance.
Source: OECD-WTO case studies, 2015
Brazil’s foreign trade mapping project was developed through a partnership of the National Confederation of Industry (CNI) and Aliança PROCOMEX (an alliance that involves companies and business associations to help modernise customs procedures in Brazil), with the Ministry of Finance (where the customs authority is located) and the Ministry of Development, Industry and Foreign Trade. The project involved undertaking a diagnosis of bottlenecks and elaborating recommendations to improve the import and export process. The results of the mapping were used by the government as a basis for the construction of Brazil s single window.
The project set out to produce for the government a map of the import and export processes as implemented by customs, identifying systems, rules and opportunities to make clearance and release processes in Brazil more efficient. It also resulted in a list of recommendations from the private sector based on the above map and a blueprint of the areas that should be better designed and rules that should be changed, elaborated jointly between the government authorities and the private sector.
The project unfolded through 59 meetings between the administration and the private sector, which included 118 big companies involved in the trade process, as well as business associations of the most important sectors. The mapping of four processes has already been completed: land, sea and air transport export processes and temporary admission procedures. The mapping of sea, land and air transport import processes and of specific regimes’ export processes is still ongoing..
BOX 6.6 Brazil’s foreign trade mapping
On the other hand, South Asia hosted few assistance projects focusing on narrow trade facilitation, although it is an important beneficiary of infrastructure for trade facilitation. Nevertheless, the trade facilitation reforms introduced at the Attari-Wagah border point have played an important role in improving trade between India and Pakistan and changed the livelihoods of people living in the border areas (see Box 6.3).
REGIONAL CO-OPERATION
As described above, regional aid for trade can significantly contribute to production networks and deepen involvement in value chains. The section below reviews regional actors and initiatives in favour of lowering barriers to the creation and expansion of production networks and of facilitating participation in value chains.
In Asia
Through various waves of unilateral liberalisation and regional co-operation, East Asia has become more outward oriented and linked to global production networks. This success is the result of co-operation in the framework of ASEAN. The transitional ASEAN economics tend to place more value on regional co-operation and have received more national aid for trade funds, which has facilitated the improvement of trade and foreign direct investment links. The blueprint for the Asean Economic Community (AEC), adopted in 2007, was designed to mobilise resources needed to achieve its goals, which could also be translated into the post-2015 development agenda.
182
CHAPTER 6: CONNECTING TO VALUE CHAINS: THE ROLE OF TRADE COSTS AND TRADE FACILITATION
AID FOR TRADE AT A GLANCE 2015: REDUCING TRADE COSTS FOR INCLUSIVE, SUSTAINABLE GROWTH - © OECD, WTO 2015
Effective implementation of programmes under the AEC blueprint is needed to keep ASEAN vibrantly integrated into the dynamic Asia-Pacific region. As a major facilitator of production networks in the region, the AEC will help link the region to global markets and thus provide employment in a context of open regionalism. This market-driven integration is now being fast-tracked by the intergovernmental decision to adopt an ASEAN charter, which has moved the association to a higher level of expected deliverables. However, some members are hesitant to pursue regional customs reforms (ASEAN single window, ASEAN customs declaration document and certificates of origin are slowly progressing); national-level aid for trade seems more effective and border administration across members is improving unequally.
The Asian Development Bank (ADB) has been supporting trade-related activities since even prior to the aid-for-trade initiative, including cross-border infrastructural projects, trade facilitation and customs modernisation, export promotion and diversification and policy and institutional support for trade regimes. Until the AEC was launched in 2007, however, the ADB did not take a regional approach in its operations regarding transport and energy. Now it is aligning them closely with the implementation of the AEC, including stepped-up regional co-operation initiatives in diverse areas such as logistics, trade and economic corridors. The ADB supports also various ASEAN activities which are central to the programme-wide strategies of the sub-regional programmes (like the GSM project detailed above).
In Latin America and the Caribbean
LAC countries have been incorporating trade facilitation measures through their regional initiatives and free trade agreements. Three-quarters of LACs preferential trade agreements (PTAs) include trade facilitation commitments. There is not one unique initiative grouping all countries as is the case with East Asia.
The framework agreement of the Pacific Alliance initiative includes a chapter on trade facilitation and customs co-operation, which contains trade facilitation provisions on the publication of information, advance rulings and procedures for appeal and review of administrative decisions, separation of the time of release of goods from the final assessment of customs duties and other fees and charges and the adoption of risk management systems. Moreover, the Pacific Alliance has been working closely with the private sector to incorporate the issues most important to Latin American businesses operating in the region.
Central American countries have put emphasis on harmonising customs processes and establishing the Central American Uniform Customs Code (CAUCC) and its regulations (RECAUCC), presently in their fourth version. This emphasis has accompanied notable advances at the domestic level, such as the foreign-trade single windows established in Costa Rica, Guatemala and Panama. These single windows link all agencies and government institutions responsible for foreign trade through a single point of contact and have boosted the facilitation of formalities for exports by reducing timeframes and costs.
The Mesoamerican Project focuses on trade facilitation and competitiveness and has developed initiatives like the International Customs Transfer for Merchandise (TIM) to facilitate the border crossing of goods by simplifying customs procedures, improving fiscal controls and traceability of commercial operations and implementing modern risk analysis systems (see Box 6.7). Similarly, in the Caribbean region the heads of state of the Association of Caribbean States created a working group on trade facilitation in 2014, and country customs offices in the region agreed to link their information systems and expand the TIM system.
183
CHAPTER 6: CONNECTING TO VALUE CHAINS: THE ROLE OF TRADE COSTS AND TRADE FACILITATION
AID FOR TRADE AT A GLANCE 2015: REDUCING TRADE COSTS FOR INCLUSIVE, SUSTAINABLE GROWTH - © OECD, WTO 2015
The Inter-American Development Bank has supported integration since its inception, and through the Ninth General Capital Increase of the Bank (GCI-9) has strengthened this institutional priority by establishing a financial goal for 2015 of investing 15% of its loans in integration projects. This important mandate to stimulate the global and regional integration of LAC requires more creative and dynamic solutions. The IDB fund is the major aid contributor to the infrastructure sector in Latin America. Hence, the estimated cost for all investment in the Mesoamerican Project in energy, commercial facilitation and transport is approximately USD 3 billion. The aid-for-trade resources directly devoted to the Mesoamerican Project represent USD 13.3 million, including USD 10.8 million managed by the IDB.
In Africa
There are a number of ongoing and planned multi-country and regional aid-for-trade projects in Africa. The projects are concentrated on the development of the transport networks, as well as facilitating movement of persons, goods and transport across countries of the sub-region. Many African Regional Economic Communities (RECs) and governments have in recent years implemented trade-facilitation initiatives. Most of their efforts are focused on removing non-physical transport barriers along major transit corridors, especially those connecting landlocked countries to seaports.
COMESA put in place the Trade and Transit Transport Facilitation Programme – including customs modernisation and automatisation – and the Advance Cargo Information System (ACIS), an integrated transport logistics management tool for tracking transport equipment and cargo on railways, through ports (port tracker), on roads (road tracker), etc.
ECOWAS and UEMOA have a number of programmes in place, including the West Africa Road Transport and Transit Facilitation programme, aiming to improve the access of Burkina Faso and Malian to Ghanaian ports, and the Abidjan–Lagos Transport and Trade Facilitation programme, a joint UEMOA–ECOWAS programme. Its objective is to reduce trade and transport barriers in the ports and on the roads along the corridor by defining a mechanism that grants positive discrimination for compliant operators.
Source: OECD-WTO Case studies, 2015.
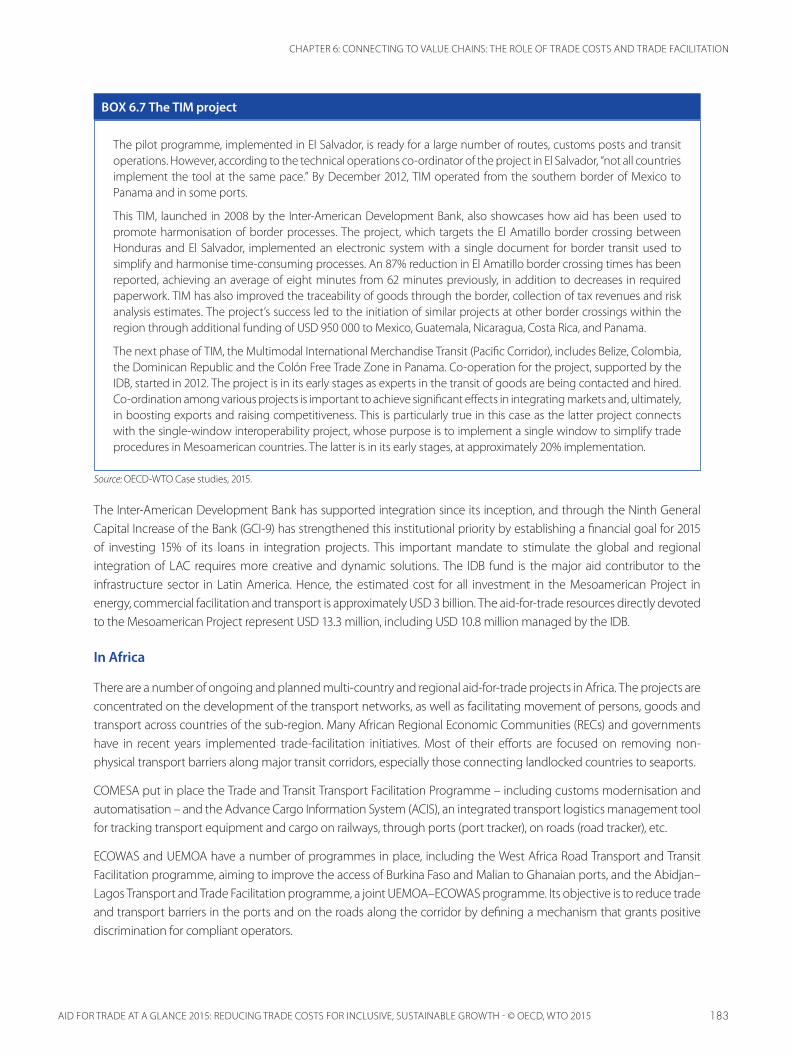
The pilot programme, implemented in El Salvador, is ready for a large number of routes, customs posts and transit operations. However, according to the technical operations co-ordinator of the project in El Salvador, “not all countries implement the tool at the same pace.” By December 2012, TIM operated from the southern border of Mexico to Panama and in some ports.
This TIM, launched in 2008 by the Inter-American Development Bank, also showcases how aid has been used to promote harmonisation of border processes. The project, which targets the El Amatillo border crossing between Honduras and El Salvador, implemented an electronic system with a single document for border transit used to simplify and harmonise time-consuming processes. An 87% reduction in El Amatillo border crossing times has been reported, achieving an average of eight minutes from 62 minutes previously, in addition to decreases in required paperwork. TIM has also improved the traceability of goods through the border, collection of tax revenues and risk analysis estimates. The project’s success led to the initiation of similar projects at other border crossings within the region through additional funding of USD 950 000 to Mexico, Guatemala, Nicaragua, Costa Rica, and Panama.
The next phase of TIM, the Multimodal International Merchandise Transit (Pacific Corridor), includes Belize, Colombia, the Dominican Republic and the Colón Free Trade Zone in Panama. Co-operation for the project, supported by the IDB, started in 2012. The project is in its early stages as experts in the transit of goods are being contacted and hired. Co-ordination among various projects is important to achieve significant effects in integrating markets and, ultimately, in boosting exports and raising competitiveness. This is particularly true in this case as the latter project connects with the single-window interoperability project, whose purpose is to implement a single window to simplify trade procedures in Mesoamerican countries. The latter is in its early stages, at approximately 20% implementation.
BOX 6.7 The TIM project
184
CHAPTER 6: CONNECTING TO VALUE CHAINS: THE ROLE OF TRADE COSTS AND TRADE FACILITATION
AID FOR TRADE AT A GLANCE 2015: REDUCING TRADE COSTS FOR INCLUSIVE, SUSTAINABLE GROWTH - © OECD, WTO 2015
EAC, together with its partner states, is implementing the East African Trade and Transport Facilitation Project (EATTF under the Northern Corridor Transit Transport Coordinating Authority). Its main objective is to reduce non-tariff barriers (NTBs) and the uncertainty of transit time along the key corridors.
The Southern African Development Community (SADC) has developed a Model Customs Act and has identified new trade corridors, some of which are already in the first pilot phase. In addition to the one-stop border post at Chirundu, efforts are under way to establish other posts between South Africa and Mozambique at Ressano Garcia/Lebombo and between South Africa and Zimbabwe at Beitbridge.
The AfDB has been closely involved in trade-facilitation activities. In March 2012 the AfDb established the Trade Fund (AfTra). AfTra is a trade-related, multi-million dollar technical assistance facility with the objective of accelerating the integration of Regional Member Countries (RMCs) and Regional Economic Communities (RECs) in regional and global trading systems. AfTra will notably focus on improving trade facilitation in RMCs and RECs: The fund will leverage technical assistance to support implementation of RMCs and RECs trade action plans. AfTra is currently one of the largest trade-related technical assistance financing facilities on the continent.
CONCLUSIONS
As testified by the increasing involvement in GVCs of many developing countries, fragmentation of production and formation of GVCs offer new opportunities for their firms and workers. While the extent and nature of GVC integration as well as benefits deriving from it depend on several factors such as endowments, size and geographical location of an economy, they also depend on a number of trade and trade-related policy factors. In particular, low import tariffs, both at home and in export markets, engagement in RTAs and inward FDI openness can all facilitate GVC engagement.
Several other areas of economic and institutional development which matter for GVCs fall within the purview of the aid-for-trade initiative. Trade facilitation and quality of infrastructure, as well as other trade facilitation-related components (property rights, for instance), in particular, are estimated to have strong impacts on GVC integration, which in some cases can actually dwarf those associated with conventional forms of trade policy. The important estimated role of trade facilitation in particular is consistent with the responses to the 2015 WTO-OECD surveys and underscores the rising awareness among partners and RECs about the need to address trade facilitation issues to decrease trade costs and raise participation in GVCs.
There is room for improvement in this area. Africa, South Asia and Latin America are significantly lagging behind in terms of trade costs due to poor quality of infrastructure and also slow reform progress in improving trade facilitation aspects, such as border procedures.
Regional co-operation can be an effective strategy to promote integration into value chains and enhance regional integration, particularly by addressing bottlenecks that are regional rather than national in character. The responses to the 2015 WTO-OECD surveys confirm that actions have been taken in the key areas. The analysis of multi-country and regional aid-for-trade initiatives shows that some of the projects are yielding good results, while others have not seen as much progress.
One major challenge for the future is the need for better co-ordination at the regional level of infrastructure projects with narrow trade facilitation projects, as is done in GSM or CAREC. For instance, in SSA narrow trade facilitation projects are presently and significantly funded but transport and communication infrastructures are missing to make those trade facilitation projects really efficient and cut trade costs. Conversely, East Asia has been very efficient in trade facilitation programmes, supported in parallel by important hard infrastructure projects to increase not only the quantity but the quality of transport and communications.
185
CHAPTER 6: CONNECTING TO VALUE CHAINS: THE ROLE OF TRADE COSTS AND TRADE FACILITATION
AID FOR TRADE AT A GLANCE 2015: REDUCING TRADE COSTS FOR INCLUSIVE, SUSTAINABLE GROWTH - © OECD, WTO 2015
REFERENCES
Arvis, J.-F. et al.(2013), “Trade costs in the developing world: 1995-2010”, World Bank Policy Research Working Paper, No. 6309.
Cadot O., A. Asprilla, J. Gourdon, C. Knebel and R.Peters (2015), Deep regional integration and non-tariff measures: A methodology for data analysis, UNCTAD Policy Issues in International Trade and Commodities, Study Series No. 69
Fugazza M. (2015), Maritime Connectivity and Trade , UNCTAD Policy Issues in International Trade and Commodities, Study Series No. 70
Gereffi, G. et al. (2001), “Globalisation, value chains and development”, IDS Bulletin, Vol. 32, No. 3, pp. 1-8.
Haddad, M. (2007), “Trade integration in East Asia: the role of China and production networks”, World Bank Policy Research Working Paper, No. 4160.
Hoekman, B. and B. Shepherd (2013), “Who profits from trade facilitation initiatives?”, CEPR Discussion Paper, No. 9490.
Helble M., C. Mann and J. Wilson (2012), “Aid-for-trade facilitation,” Review of World Economics (Weltwirtschaftliches Archiv), Springer, Vol. 148, No. 2, pp. 357-376.
Hummels, D., J. Ishii and K.-M. Yi (2001), “The nature and growth of vertical specialization in world trade”, Journal of International Economics, Vol. 54, No. 1, pp. 75–96.
Koopman, R. et al. (2011), Give credit where credit is due: tracing value added in global production chains, NBER Working Paper, No. 16426.
Koopman, R., Z. Wang and S-J. Wei (2012), “Tracing value-added and double counting in gross exports”, NBER Working Papers, No 18579, National Bureau of Economic Research, Inc.
Kowalski, P. et al. (2015), “Developing countries participation in global value chains and its implications for trade and trade related policies”, OECD Trade Policy Paper (forthcoming), OECD Publishing.
Kowalski P. and J.Lopez-Gonzalez (2015), “Trade, global value chains and inequality”, OECD Trade Policy Paper (forthcoming), OECD Publishing.
Mayer, F. and W. Milberg (2013), “Aid for trade in a world of global value chains: chain power, the distribution of rents, and implications for the form of aid”, Duke University Working Paper.
Moïsé, E., T. Orliac and P. Minor (2011), “Trade facilitation indicators: the impact on trade costs”, OECD Trade Policy Paper No. 118, OECD Publishing.
Moïsé, E. and S. Sorescu (2013), “Trade facilitation indicators: the potential impacts on developing countries’ trade”, OECD Trade Policy Paper No. 144, OECD Publishing.
Moïsé, E. and S. Sorescu (2015), “Contribution of trade facilitation measures to the operation of supply chains”, OECD Trade Policy Paper (forthcoming), OECD Publishing.
Novy, D. (2013), “Gravity redux: measuring international trade costs with panel data”, Economic Inquiry, Vol. 51, No. 1, pp. 101-121.
OECD (2014), “The regional perspectives on aid for trade”, OECD Series: The Development Dimension, OECD Publishing.
Wilson, J. S., C. L Mann and T. Otsuki (2003), “Trade facilitation and economic development: measuring the impact.” World Bank Working Paper, No. 2988.
Ahmed, S., S. Kelegama and E. Ghani (eds.) (2010), Promoting Economic Co-operation in South Asia, World Bank, Washington D.C..
World Bank (2015), “The structure of trade linkages and economic growth in the rise of the south”, Latin America Chief Economist Office, World Bank.
186
CHAPTER 6: CONNECTING TO VALUE CHAINS: THE ROLE OF TRADE COSTS AND TRADE FACILITATION
AID FOR TRADE AT A GLANCE 2015: REDUCING TRADE COSTS FOR INCLUSIVE, SUSTAINABLE GROWTH - © OECD, WTO 2015
ANNEX 6A.1 Drivers of participation by income group using EORA
BACKWARD
Total High-income Middle-income Low-income
I II I II I II I II
Tariffs charged -0.0953 -0.0541 -0.046 -0.019 -0.1322 -0.1353 -0.071 -0.069
(weighted average) (0.029) (0.030) (0.037) (0.041) (0.052) (0.052) (0.047) (0.052)
Tariffs faced 0.0843 0.0823 -0.2663 -0.2513 -0.004 -0.005 0.0671 0.0661
(weighted average) (0.029) (0.028) (0.081) (0.082) (0.065) (0.065) (0.036) (0.036)
Share of imports 0.1151 0.065 -0.2103 -0.2603 0.089 0.088 0.2063 0.2063
covered by PTA (0.061) (0.058) (0.063) (0.069) (0.185) (0.185) (0.063) (0.063)
Share of exports -0.088 -0.086 0.018 0.092 -0.044 -0.041 -0.06 -0.061
covered by PTA (0.067) (0.066) (0.074) (0.089) (0.184) (0.183) (0.064) (0.063)
Revealed FDI openess 0.4893 0.4843 0.8523 0.8423 0.6803 0.6783 0.1613 0.1623
(0.053) (0.052) (0.056) (0.055) (0.162) (0.163) (0.050) (0.050)
Share of manufacturing 0.2283 0.3033 0.6523 0.6583 0.5593 0.5583 -0.006 -0.007
in GDP (0.070) (0.075) (0.051) (0.051) (0.164) (0.164) (0.063) (0.063)
Distance to closest -0.07 -0.1211 0.4493 0.3913 0.05 0.078 -0.2923 -0.2903
manufacturing hub (log) (0.070) (0.065) (0.102) (0.106) (0.191) (0.213) (0.077) (0.078)
Distance to economic -0.146 -0.106 -0.5243 -0.4653 -0.271 -0.298 0.126 0.124
activity (log) (0.094) (0.089) (0.084) (0.091) (0.261) (0.281) (0.115) (0.115)
GDP (log) -0.1493 -0.1123 -0.1063 -0.021 -0.7473 -0.8973 -1.0393 -0.871
(0.012) (0.009) (0.009) (0.043) (0.133) (0.274) (0.219) (1.061)
Population (log) -0.1343 -0.4382 0.046 -0.019
(0.018) (0.216) (0.058) (0.104)
Year fixed effects Yes Yes Yes Yes Yes Yes Yes Yes
Clustered standard errors (country and year)
Yes Yes Yes Yes Yes Yes Yes Yes
Observations 834 834 202 202 325 325 307 307
R-squared 0.336 0.368 0.859 0.862 0.338 0.338 0.315 0.315
Note: 1, 2, 3 footnoted figures indicate countries in the first, second and third percentile of world GDP per capita distribution each year. Source: EORA Database.
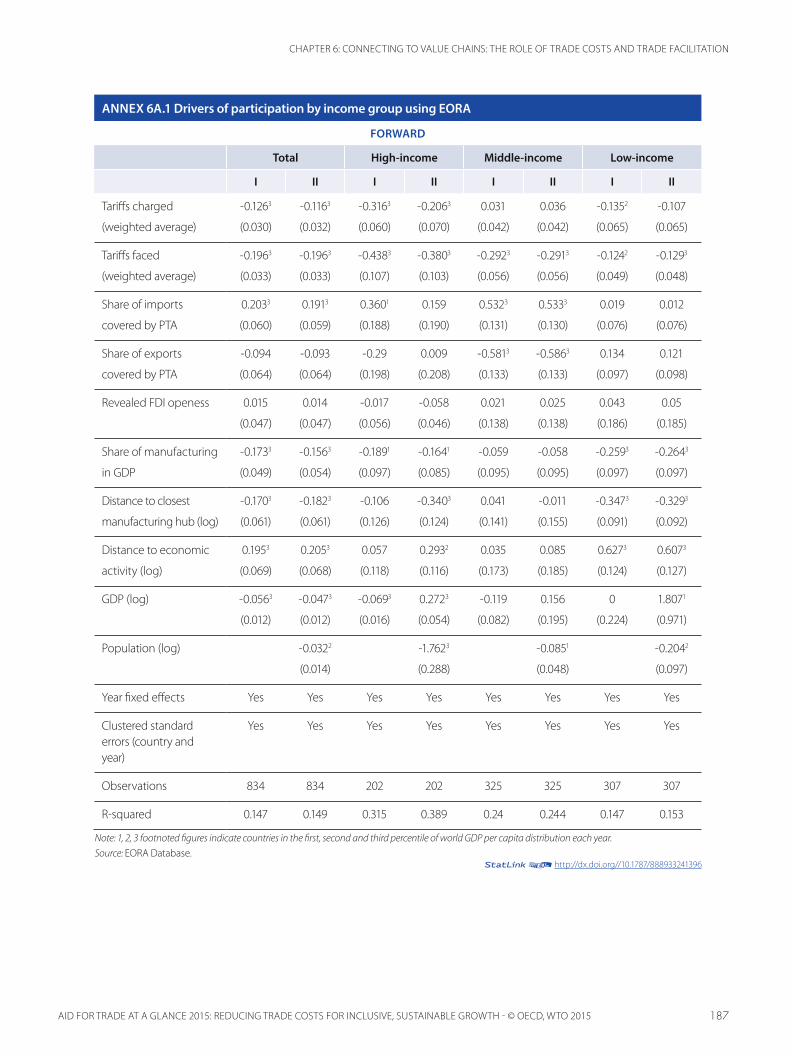
187
CHAPTER 6: CONNECTING TO VALUE CHAINS: THE ROLE OF TRADE COSTS AND TRADE FACILITATION
AID FOR TRADE AT A GLANCE 2015: REDUCING TRADE COSTS FOR INCLUSIVE, SUSTAINABLE GROWTH - © OECD, WTO 2015
ANNEX 6A.1 Drivers of participation by income group using EORA
FORWARD
Total High-income Middle-income Low-income
I II I II I II I II
Tariffs charged -0.1263 -0.1163 -0.3163 -0.2063 0.031 0.036 -0.1352 -0.107
(weighted average) (0.030) (0.032) (0.060) (0.070) (0.042) (0.042) (0.065) (0.065)
Tariffs faced -0.1963 -0.1963 -0.4383 -0.3803 -0.2923 -0.2913 -0.1242 -0.1293
(weighted average) (0.033) (0.033) (0.107) (0.103) (0.056) (0.056) (0.049) (0.048)
Share of imports 0.2033 0.1913 0.3601 0.159 0.5323 0.5333 0.019 0.012
covered by PTA (0.060) (0.059) (0.188) (0.190) (0.131) (0.130) (0.076) (0.076)
Share of exports -0.094 -0.093 -0.29 0.009 -0.5813 -0.5863 0.134 0.121
covered by PTA (0.064) (0.064) (0.198) (0.208) (0.133) (0.133) (0.097) (0.098)
Revealed FDI openess 0.015 0.014 -0.017 -0.058 0.021 0.025 0.043 0.05
(0.047) (0.047) (0.056) (0.046) (0.138) (0.138) (0.186) (0.185)
Share of manufacturing -0.1733 -0.1563 -0.1891 -0.1641 -0.059 -0.058 -0.2593 -0.2643
in GDP (0.049) (0.054) (0.097) (0.085) (0.095) (0.095) (0.097) (0.097)
Distance to closest -0.1703 -0.1823 -0.106 -0.3403 0.041 -0.011 -0.3473 -0.3293
manufacturing hub (log) (0.061) (0.061) (0.126) (0.124) (0.141) (0.155) (0.091) (0.092)
Distance to economic 0.1953 0.2053 0.057 0.2932 0.035 0.085 0.6273 0.6073
activity (log) (0.069) (0.068) (0.118) (0.116) (0.173) (0.185) (0.124) (0.127)
GDP (log) -0.0563 -0.0473 -0.0693 0.2723 -0.119 0.156 0 1.8071
(0.012) (0.012) (0.016) (0.054) (0.082) (0.195) (0.224) (0.971)
Population (log) -0.0322 -1.7623 -0.0851 -0.2042
(0.014) (0.288) (0.048) (0.097)
Year fixed effects Yes Yes Yes Yes Yes Yes Yes Yes
Clustered standard errors (country and year)
Yes Yes Yes Yes Yes Yes Yes Yes
Observations 834 834 202 202 325 325 307 307
R-squared 0.147 0.149 0.315 0.389 0.24 0.244 0.147 0.153
Note: 1, 2, 3 footnoted figures indicate countries in the first, second and third percentile of world GDP per capita distribution each year. Source: EORA Database.
12http://dx.doi.org//10.1787/888933241396

188
CHAPTER 6: CONNECTING TO VALUE CHAINS: THE ROLE OF TRADE COSTS AND TRADE FACILITATION
AID FOR TRADE AT A GLANCE 2015: REDUCING TRADE COSTS FOR INCLUSIVE, SUSTAINABLE GROWTH - © OECD, WTO 2015
ANNEX 6A.2 Policy-related drivers of value-added flows in a gravity setting
Value-added flow
Total High income Developing
Unit Labour Costs (OECD) Coefficient -0.007 -0.002Std Error (0.007) (0.012)Coefficient partner -0.0333 -0.0393
Std Error partner (0.007) (0.012)Observations 54 360 44 352 2 070R-square 0.156 0.161 0.417
Product Market Regulation (OECD) Coefficient -0.0313 -0.1073 -0.038Std Error (0.009) (0.016) (0.054)Coefficient partner -0.005 0.0232 -0.049Std Error partner (0.009) (0.012) (0.033)Observations 36 072 21 456 6 660R-square 0.119 0.163 0.107
Logistics Performance Index (customs) (World Bank)
Coefficient 0.0763 0.0813 0.0703
Std Error (0.004) (0.005) (0.012)Coefficient partner 0.0303 0.0173 0.0383
Std Error partner (0.004) (0.004) (0.008)Observations 109 314 68 472 40 842R-square 0.097 0.147 0.09
Tax rate (total) (World Development Indicators)
Coefficient 0.0553 -0.007 0.01Std Error (0.004) (0.006) (0.009)Coefficient partner 0.0102 0.0123 0.005Std Error partner (0.004) (0.005) (0.008)Observations 108 522 68 022 40 500R-square 0.099 0.146 0.09
Access to loans (index) (World Economic Forum)
Coefficient -0.004 -0.001 0.0311
Std Error (0.006) (0.006) (0.017)Coefficient partner 0.004 -0.005 0.016Std Error partner (0.006) (0.006) (0.011)Observations 73 746 46 854 26 892R-square 0.096 0.147 0.09
Intellectual property protection (index) (World Economic Forum)
Coefficient 0.0653 0.0793 0.0983
Std Error (0.005) (0.007) (0.018)Coefficient partner 0.0313 0.0183 0.0433
Std Error partner (0.005) (0.005) (0.011)Observations 73 746 46 854 26 892R-square 0.098 0.15 0.092
Quality of Electricity supply (index) (World Economic Forum)
Coefficient 0.0483 0.1033 0.0503
Std Error (0.005) (0.010) (0.014)Coefficient partner 0.0453 0.0303 0.0653
Std Error partner (0.005) (0.005) (0.011)Observations 73 746 46 854 26 892R-square 0.098 0.15 0.092
Broadband subscription (per ‘000) (ITU) Coefficient 0.0563 0.0693 0.0623
Std Error (0.004) (0.006) (0.019)Coefficient partner 0.0273 0.0122 0.0433
Std Error partner (0.004) (0.005) (0.008)Observations 136 782 88 416 48 366R-square 0.104 0.139 0.095
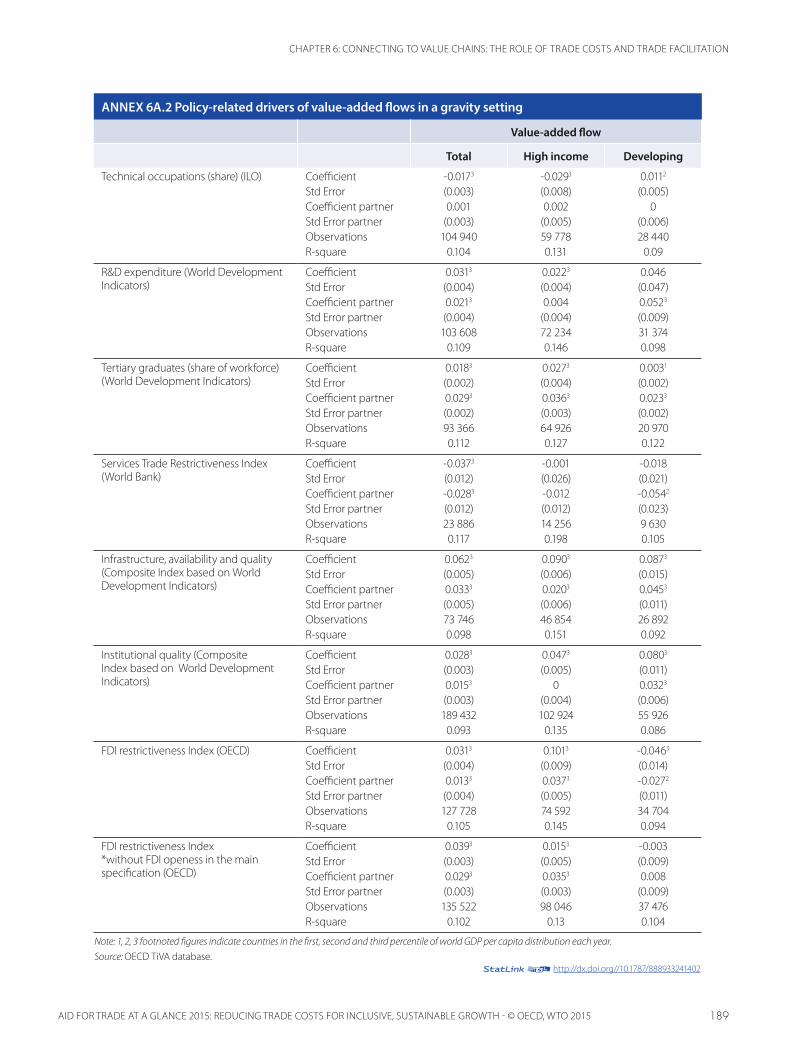
189
CHAPTER 6: CONNECTING TO VALUE CHAINS: THE ROLE OF TRADE COSTS AND TRADE FACILITATION
AID FOR TRADE AT A GLANCE 2015: REDUCING TRADE COSTS FOR INCLUSIVE, SUSTAINABLE GROWTH - © OECD, WTO 2015
ANNEX 6A.2 Policy-related drivers of value-added flows in a gravity setting
Value-added flow
Total High income Developing
Technical occupations (share) (ILO) Coefficient -0.0173 -0.0293 0.0112
Std Error (0.003) (0.008) (0.005)Coefficient partner 0.001 0.002 0Std Error partner (0.003) (0.005) (0.006)Observations 104 940 59 778 28 440R-square 0.104 0.131 0.09
R&D expenditure (World Development Indicators)
Coefficient 0.0313 0.0223 0.046Std Error (0.004) (0.004) (0.047)Coefficient partner 0.0213 0.004 0.0523
Std Error partner (0.004) (0.004) (0.009)Observations 103 608 72 234 31 374R-square 0.109 0.146 0.098
Tertiary graduates (share of workforce) (World Development Indicators)
Coefficient 0.0183 0.0273 0.0031
Std Error (0.002) (0.004) (0.002)Coefficient partner 0.0293 0.0363 0.0233
Std Error partner (0.002) (0.003) (0.002)Observations 93 366 64 926 20 970R-square 0.112 0.127 0.122
Services Trade Restrictiveness Index (World Bank)
Coefficient -0.0373 -0.001 -0.018Std Error (0.012) (0.026) (0.021)Coefficient partner -0.0283 -0.012 -0.0542
Std Error partner (0.012) (0.012) (0.023)Observations 23 886 14 256 9 630R-square 0.117 0.198 0.105
Infrastructure, availability and quality (Composite Index based on World Development Indicators)
Coefficient 0.0623 0.0903 0.0873
Std Error (0.005) (0.006) (0.015)Coefficient partner 0.0333 0.0203 0.0453
Std Error partner (0.005) (0.006) (0.011)Observations 73 746 46 854 26 892R-square 0.098 0.151 0.092
Institutional quality (Composite Index based on World Development Indicators)
Coefficient 0.0283 0.0473 0.0803
Std Error (0.003) (0.005) (0.011)Coefficient partner 0.0153 0 0.0323
Std Error partner (0.003) (0.004) (0.006)Observations 189 432 102 924 55 926R-square 0.093 0.135 0.086
FDI restrictiveness Index (OECD) Coefficient 0.0313 0.1013 -0.0463
Std Error (0.004) (0.009) (0.014)Coefficient partner 0.0133 0.0373 -0.0272
Std Error partner (0.004) (0.005) (0.011)Observations 127 728 74 592 34 704R-square 0.105 0.145 0.094
FDI restrictiveness Index*without FDI openess in the main specification (OECD)
Coefficient 0.0393 0.0153 -0.003Std Error (0.003) (0.005) (0.009)Coefficient partner 0.0293 0.0353 0.008Std Error partner (0.003) (0.003) (0.009)Observations 135 522 98 046 37 476R-square 0.102 0.13 0.104
Note: 1, 2, 3 footnoted figures indicate countries in the first, second and third percentile of world GDP per capita distribution each year.Source: OECD TiVA database.
12http://dx.doi.org//10.1787/888933241402