Chapter 6
44
Copyright © 2010 Pearson Education, Inc. Chapter 6 Mendelian and Quantitative Genetics Are You Only As Smart As Your Genes?
-
Upload
renee-odonnell -
Category
Documents
-
view
21 -
download
0
description
Chapter 6. Mendelian and Quantitative Genetics Are You Only As Smart As Your Genes?. Chapter 6 Section 1 The Inheritance of Traits. 6.1 The Inheritance of Traits. The Inheritance of Traits Offspring resemble their parents, but not exactly. Siblings resemble each other, but not exactly. - PowerPoint PPT Presentation
Transcript of Chapter 6
Copyright © 2010 Pearson Education, Inc.
Chapter 6
Mendelian and Quantitative Genetics
Are You Only As Smart As Your Genes?

Copyright © 2010 Pearson Education, Inc.
Chapter 6 Section 1
The Inheritance of Traits

Copyright © 2010 Pearson Education, Inc.
6.1 The Inheritance of Traits
The Inheritance of Traits Offspring resemble their parents, but not
exactly. Siblings resemble each other, but not
exactly. How much is because of environment? How much is inherited?
Nature Versus Nurture
Copyright © 2010 Pearson Education, Inc. Figure 6.1
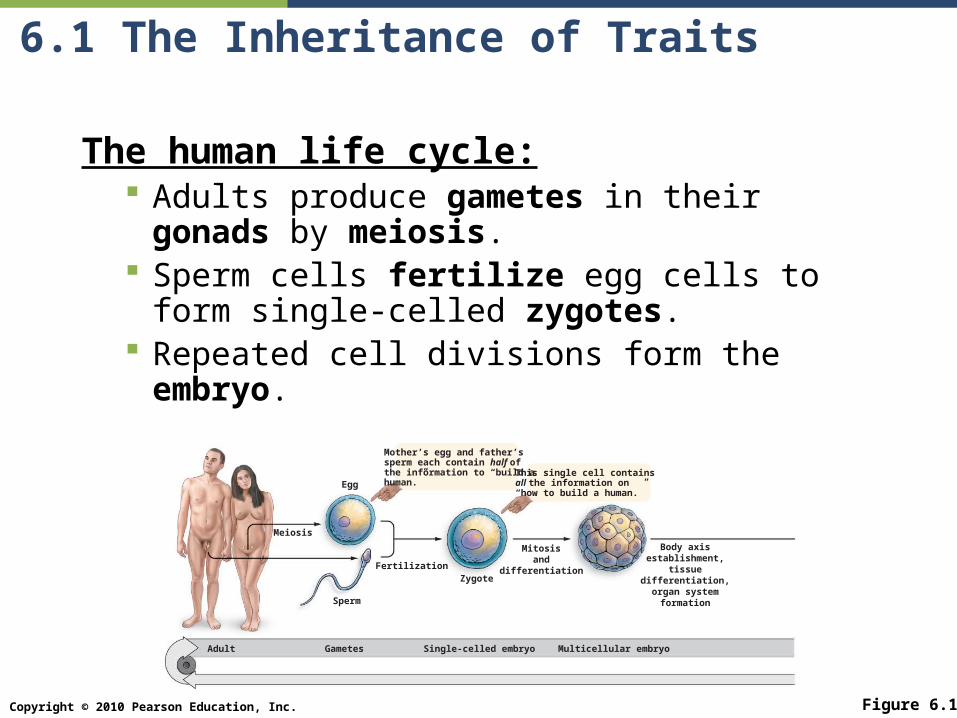
Adult Gametes Single-celled embryo Multicellular embryo
Sperm
FertilizationZygote
Body axisestablishment,
tissuedifferentiation,organ system
formation
Mitosisand
differentiation
Egg
Mother’s egg and father’ssperm each contain half of the information to “build ahuman.”
This single cell containsall the information on“how to build a human.”
Meiosis
6.1 The Inheritance of Traits
The human life cycle: Adults produce gametes in their gonads by
meiosis. Sperm cells fertilize egg cells to form single-
celled zygotes. Repeated cell divisions form the embryo.

Copyright © 2010 Pearson Education, Inc.
6.1 The Inheritance of Traits
The human life cycle, cont.: The embryo grow to become a fetus. After birth, the individual continues to grow
until reaching adulthood.
Figure 6.1
Fetus
Mitosisand
differentiation
Birth
Mitosisand
differentiation
Mitosisand
differentiation
Baby Child Adult
Copyright © 2010 Pearson Education, Inc.
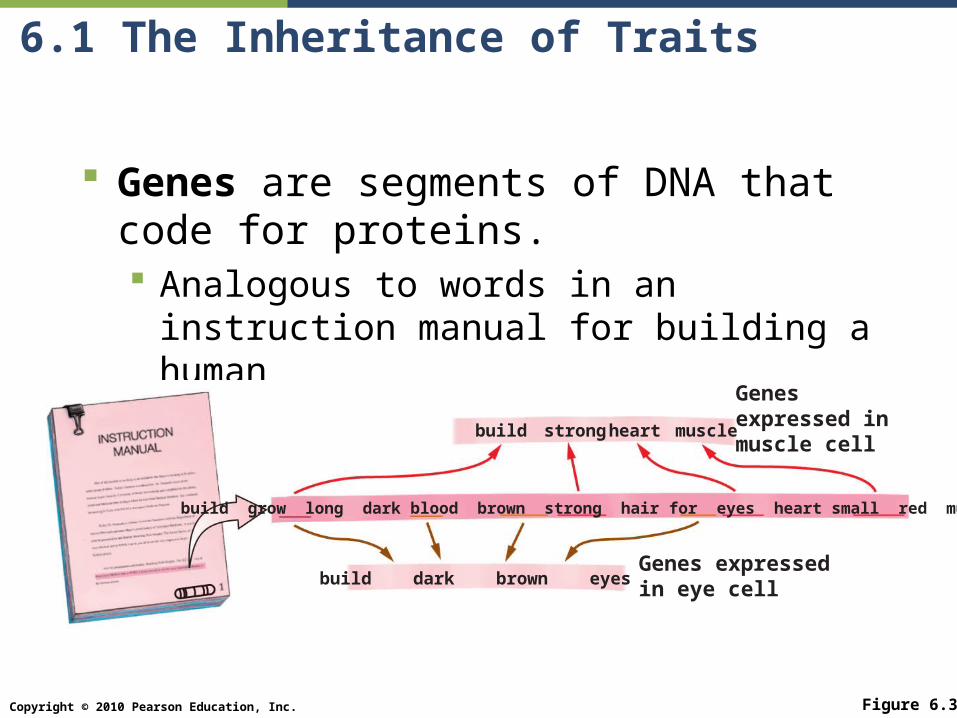
6.1 The Inheritance of Traits
Genes are segments of DNA that code for proteins. Analogous to words in an instruction manual
for building a human
Figure 6.3
Genesexpressed inmuscle cell
build
build dark brown eyes Genes expressedin eye cell
strong heart muscle
build grow long dark blood brown strong hair for eyes heart small red muscle

Copyright © 2010 Pearson Education, Inc.
6.1 The Inheritance of Traits
Chromosomes are analogous to pages in the instruction manual. Each “page” contains thousands of “words” Different types of cells use different words, in
different orders

Copyright © 2010 Pearson Education, Inc.
6.1 The Inheritance of Traits - Producing Diversity in Offspring
Mistakes in copying DNA (mutations) produce different versions of genes (alleles), with different results.
Figure 6.4
nerve
nzrve
strong
string
grey
gray
Normal allele:
Mutant allele:
Mutation Mutation Mutation
(a) The mutant allele has the samemeaning (mutant allele functionthe same as the original allele).
(b) The mutant allele has a differentmeaning (mutant allele functionsdifferently than the original allele).
(c) The mutant allele has nomeaning (mutant allele isno longer functional).
Original CopyOriginal Copy Original Copy

Copyright © 2010 Pearson Education, Inc.
6.1 The Inheritance of Traits - Producing Diversity in Offspring
Parent cell has two complete copies of the manual: 23-page copy from mom and 23-page copy from dad 23 pairs of homologous chromosomes
Figure 6.5
+ =
Egg Sperm Zygote
The 23 pages of each instruction manualare roughly equivalent to the 23chromosomes in each egg and sperm.
The zygote has 46pages, equivalent to 46chromosomes.

Copyright © 2010 Pearson Education, Inc.
6.1 The Inheritance of Traits - Producing Diversity in Offspring
Meiosis creates variation in offspring Segregation: in meiosis, one member of
each homologous pair goes into a gamete Gamete gets just one copy of each page of
the manual Independent assortment randomly
determines which member of a pair of chromosomes goes into a gamete Due to random alignment during
metaphase I About 8 million different combinations of
chromosomes.
Copyright © 2010 Pearson Education, Inc.
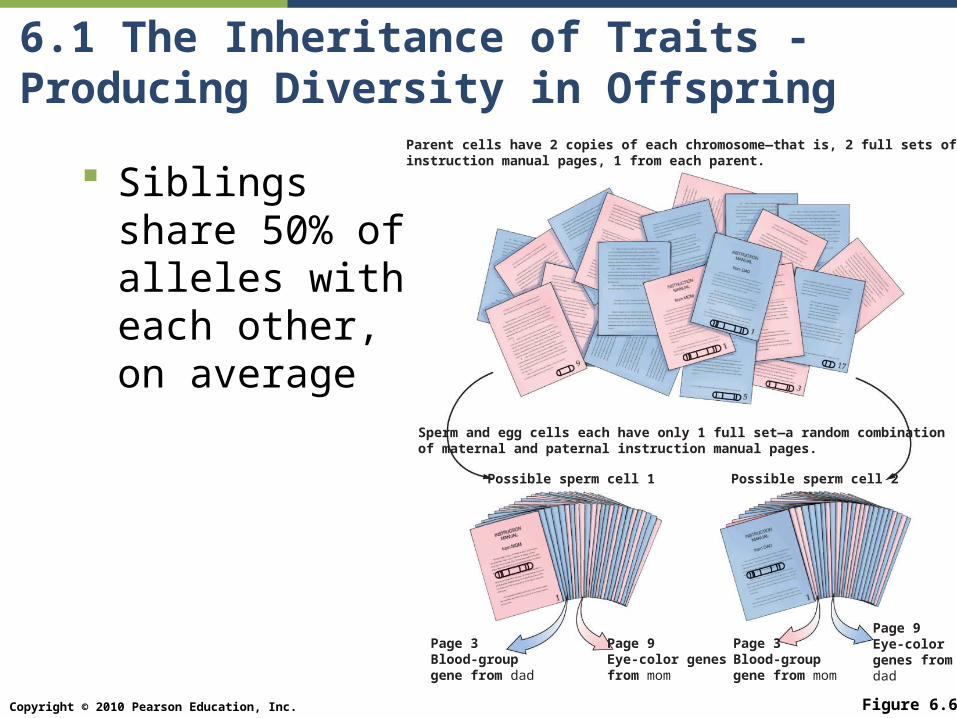
6.1 The Inheritance of Traits - Producing Diversity in Offspring
Siblings share 50% of alleles with each other, on average
Figure 6.6
Possible sperm cell 1 Possible sperm cell 2
Sperm and egg cells each have only 1 full set—a random combinationof maternal and paternal instruction manual pages.
Parent cells have 2 copies of each chromosome—that is, 2 full sets ofinstruction manual pages, 1 from each parent.
Page 3Blood-groupgene from dad
Page 9Eye-color genesfrom mom
Page 3Blood-groupgene from mom
Page 9Eye-colorgenes fromdad

Copyright © 2010 Pearson Education, Inc.
6.1 The Inheritance of Traits - Producing Diversity in Offspring
Random fertilization produces more diversity: 64 trillion possibilities!
No two humans are genetically identical, except for monozygotic twins.
Figure 6.7
ZygoteZygote Zygote
EmbryoEmbryo Embryo
Embryosplits
Twoembryos
50% identical (no moresimilar than siblings born at
different times)
100% genetically identical
Egg SpermEgg Sperm Egg Sperm
(a) Dizygotic (fraternal) twins (b) Monozygotic (identical) twins

Copyright © 2010 Pearson Education, Inc.
6.1 The Inheritance of Traits
Processes that create variation in offspring1. Crossing-Over: in prophase I homologous
chromosomes exchange segments2. Segregation: one member of each homologous
pair goes into a gamete3. Independent assortment: randomly determines
which member of a pair of chromosomes goes into a gamete Due to random alignment during metaphase I
4. Random Fertilization: Which sperm will fertilize an egg.
Leads to about 64 trillion genetic possibilities from two parents!
Copyright © 2010 Pearson Education, Inc.
6.1 The Inheritance of Traits
End Chapter 6 Section 1
The Inheritance of Traits
Copyright © 2010 Pearson Education, Inc.
6.2 Mendelian Genetics
Chapter 6 Section 2
Mendelian Genetics
Copyright © 2010 Pearson Education, Inc.
6.2 Mendelian Genetics: When the Role of Genes Is Clear
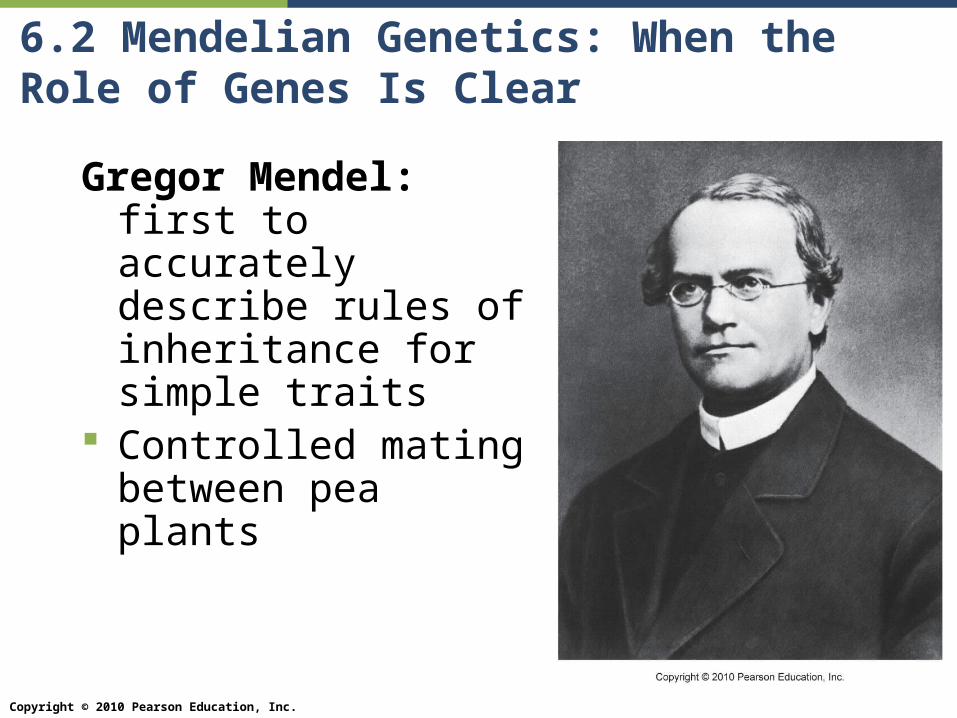
Gregor Mendel: first to accurately describe rules of inheritance for simple traits
Controlled mating between pea plants

Copyright © 2010 Pearson Education, Inc.
6.2 Mendelian Genetics: When the Role of Genes Is Clear
Gregor Mendel Studied traits due to a
single gene with a few alleles
Discovered that both parents contribute equally to offspring (genetically)
Mendel’s principles also apply to many genetic diseases in humans

Copyright © 2010 Pearson Education, Inc.
6.2 Mendelian Genetics: When the Role of Genes Is Clear
Phenotype: physical traits of an individual Genotype: description of the alleles for a
particular gene in an individual Homozygous (-ote): both alleles for a gene
are identical Heterozygous (-ote): the gene has two
different alleles Recessive: the phenotype of an allele is
seen only when homozygous Dominant: the phenotype is seen when
homozygous or heterozygous

Copyright © 2010 Pearson Education, Inc.
6.2 Mendelian Genetics - Genetic Diseases in Humans
Genetic Diseases in Humans Cystic fibrosis: a recessive human
genetic disease Defect in chloride ion transport Causes recurrent lung infections,
dramatically shortened lifespans Heterozygotes (carriers) do not show the
symptoms Most common recessive disease among
Europeans

Copyright © 2010 Pearson Education, Inc.
6.2 Mendelian Genetics - Genetic Diseases in Humans
Huntington’s disease a dominant human genetic disease Progressive, incurable, always fatal Symptoms occur in middle age Mutant protein forms clumps inside nerve
cell nuclei, killing the cells Having a normal allele cannot compensate
for this

Copyright © 2010 Pearson Education, Inc.
6.2 Mendelian Genetics
Using Punnett Squares to Predict Offspring Genotypes & Phenotypes
Punnett square: graphic way to predict possible outcomes of a cross
Consider a cross between two cystic fibrosis carriers
“F” = normal dominant allele; “f” = recessive disease allele The cross would be: F f x F f What offspring could result?

Copyright © 2010 Pearson Education, Inc.
6.2 Mendelian Genetics - Using Punnett Squares to Predict Offspring Genotypes
Figure 6.13
FF
Ff
Ff
ff
F
f
25% chance that a child willnot have cystic fibrosis
50% chance that a child willbe an unaffected carrier ofthe cystic fibrosis allele
25% chance that a child willhave cystic fibrosis
Femalecarrier Ff
SpermsampleFf
Ff
Possible types of eggs
Poss
ible
types
of
sperm
Copyright © 2010 Pearson Education, Inc.
6.2 Mendelian Genetics
END Chapter 6 Section 2
Mendelian Genetics
Copyright © 2010 Pearson Education, Inc.
6.3
Chapter 6 Section 3
Quantitative & Qualitative Genetics

Copyright © 2010 Pearson Education, Inc.
6.3 Quantitative Genetics: When Genes and Environment Interact
Qualitative traits are on or off traits
- such as yellow or green peas
Quantitative traits show continuous variation Large range of phenotypes E.g., height, weight, intelligence
Variation due to both genetic and environmental differences
Heritability: proportion of the variation within a population due to genetic differences among individuals

Copyright © 2010 Pearson Education, Inc.
6.3 Quantitative Genetics: When Genes and Environment Interact
Distribution of Phenotypes in Population Mean: sum up all the phenotypic values
and divide by the number of individuals; same as the average.
Figure 6.16aHeight (ft, in)
Mean
Bell-shapedcurve
(a) Normal distribution of student height in onecollege class
5 ft, 10 in (1.78 m )
Variability
Num
ber
of
men

Copyright © 2010 Pearson Education, Inc.
6.3 Quantitative Genetics: When Genes and Environment Interact
Variance: a measure of how much variability there is in the population The amount an individual varies from the
mean, on average
Figure 6.16b
Weight (lbs)
Mean = 114 lbs(51.7 kg)
(b) Variance describes the variability around themean.
Low variance
High variance
Nu
mber
of
jock
eys
Nu
mber
of
14
-year-
old
boys
Copyright © 2010 Pearson Education, Inc.
6.3 Quantitative Genetics -
Why Traits Are Quantitative Quantitative traits, with continuous
variation, are polygenic traits. Result of several genes Each with more than one allele
Interaction of multiple genes with multiple alleles results in many phenotypes.
Example: human eye color

Copyright © 2010 Pearson Education, Inc.
6.3 Quantitative Genetics
Why Traits Are Quantitative
Usually influenced by both genes and environment
Monozygotic twins, genetically identical, but different environments
Figure 6.17
Copyright © 2010 Pearson Education, Inc.
6.3 Quantitative Genetics
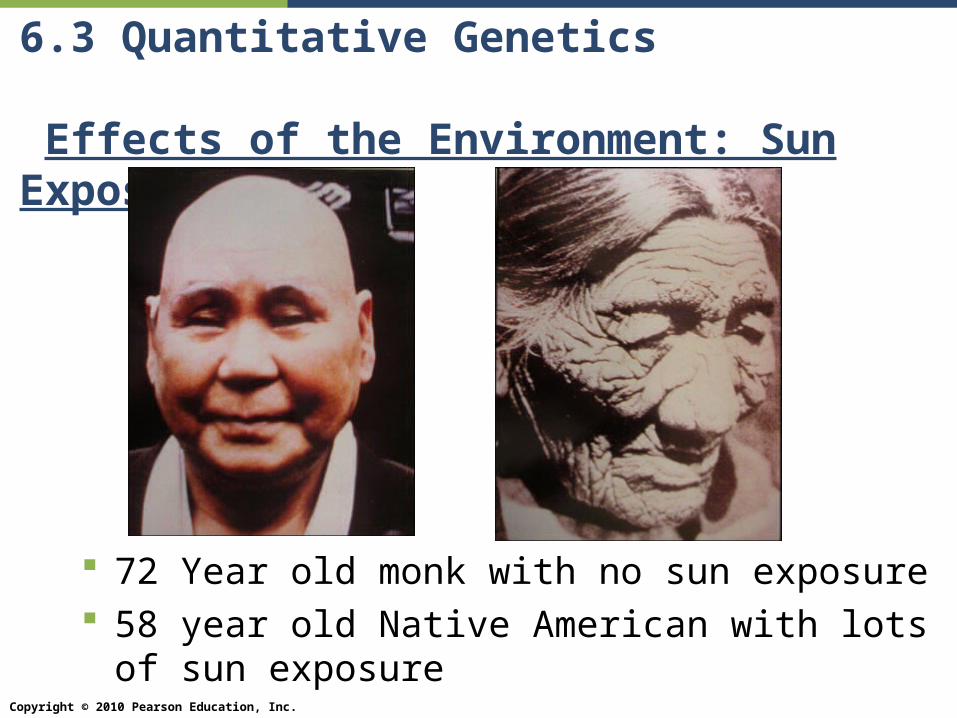
Effects of the Environment: Sun Exposure
72 Year old monk with no sun exposure 58 year old Native American with lots of sun
exposure

Copyright © 2010 Pearson Education, Inc.
6.3 Quantitative Genetics –
Measuring Heritability in Animals
Artificial selection: Only the cow giving
the most milk was allowed to breed
The next generation has a higher mean milk production
Milk production has a high heritability

Copyright © 2010 Pearson Education, Inc.
6.3 Quantitative Genetics –
Measuring Heritability in Animals
When artificial selection is impossible, correlations between relatives estimates heritability.
Figure 6.20
StrongAverageWeak
On average,parents andoffspring hadsame level ofimmunity.
Points represent parent-offspringpairs with matching immunity levels.
Blue tit parent immune response
Blu
e t
it c
hic
k im
mune r
esp
onse
Copyright © 2010 Pearson Education, Inc.
6.3 Quantitative Genetics –
Calculating Heritability in Human Populations Have to use correlation to measure heritability in
humans Scientists seek “natural experiments”,
situations in which either the overlap in genes or environment is removed
Twins are often used Dizygotic twins share environment, but only half their
genes Heritability of IQ from such twin studies estimated to
be about 0.52 Similar treatment of twins might explain why their
IQs are so similar

Copyright © 2010 Pearson Education, Inc.
6.3 Quantitative Genetics –
Calculating Heritability in Human Populations
Another approach: Monozygotic twins raised apart share all
genes Estimates of IQ heritability for such twins is
0.72 Drawback: limited number of such twins to
study
Copyright © 2010 Pearson Education, Inc.
6.3
END Chapter 6 Section 3
Quantitative & Qualitative Genetics
Copyright © 2010 Pearson Education, Inc.
6.4
Chapter 6 Section 4
Genes, Environment, and the Individual
Copyright © 2010 Pearson Education, Inc.
6.4 Genes, Environment, and the Individual –
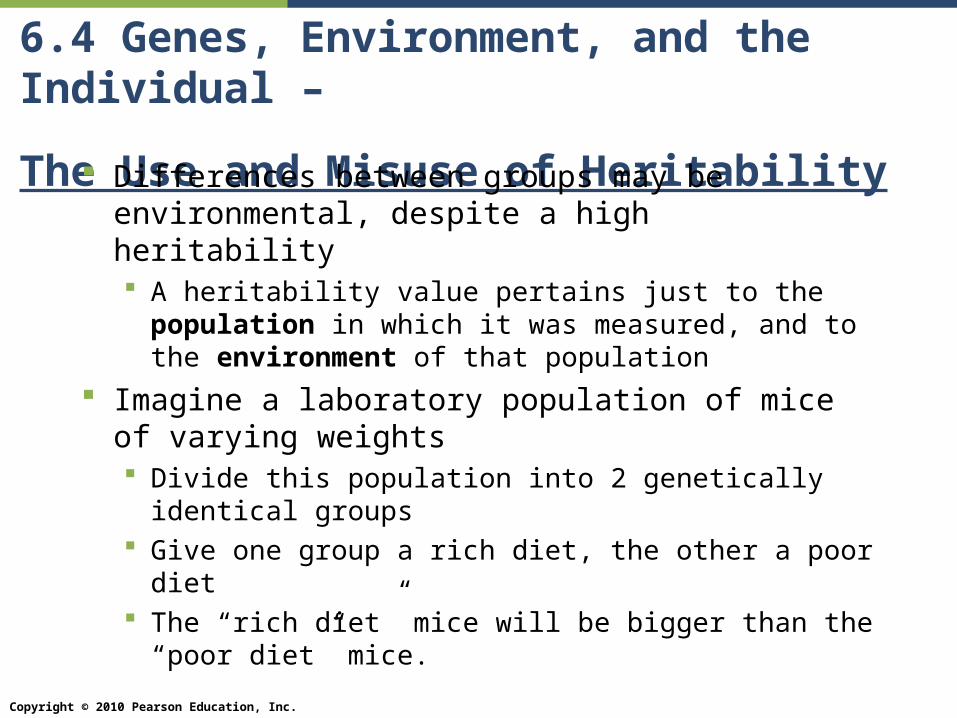
The Use and Misuse of Heritability Differences between groups may be
environmental, despite a high heritability A heritability value pertains just to the population in
which it was measured, and to the environment of that population
Imagine a laboratory population of mice of varying weights Divide this population into 2 genetically identical
groups Give one group a rich diet, the other a poor diet The “rich diet” mice will be bigger than the “poor
diet” mice.

Copyright © 2010 Pearson Education, Inc.
3
2
1 Start with a population ofmice that are variable in size.
Randomly divide miceinto two groups. Feedhalf a poor diet and theother half a rich diet.
Allow the mice in bothgroups to breed.Measure the weight ofadult offspring.
Average weight of the mice in therich- diet environment is twice theaverage weight of the population inthe poor- diet environment.However, there is no geneticdifference between the two groups.
6.4 Genes, Environment, and the Individual –
The Use and Misuse of Heritability Allow the mice in each
group to breed, maintaining their diets.
Measure the weight of adult offspring; correlation with parents shows high heritability
Figure 6.22
Copyright © 2010 Pearson Education, Inc.
6.4 Genes, Environment, and the Individual –
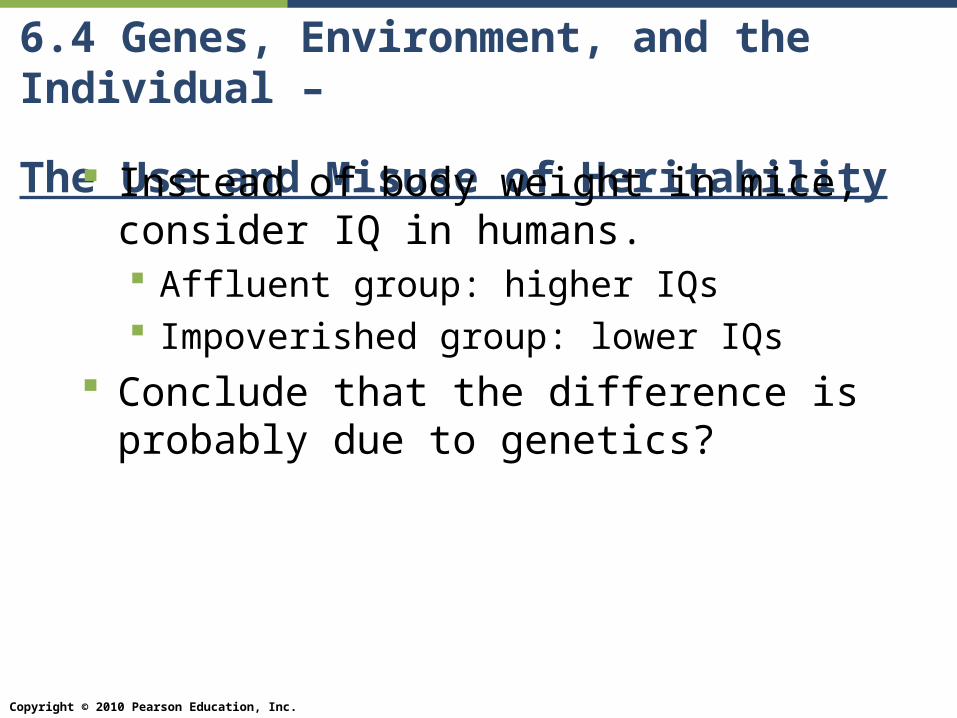
The Use and Misuse of Heritability Instead of body weight in mice, consider
IQ in humans. Affluent group: higher IQs Impoverished group: lower IQs
Conclude that the difference is probably due to genetics?

Copyright © 2010 Pearson Education, Inc.
6.4 Genes, Environment, and the Individual –
The Use and Misuse of Heritability A highly heritable trait can still respond to
environmental change. Example: Maze-learning ability is highly
heritable in rats. Bright rats have bright offspring Dull rats have dull offspring
Still, no rats learned well in a restricted environment.
All rats learned better in an enriched environment
Copyright © 2010 Pearson Education, Inc.
6.4 Genes, Environment, and the Individual –
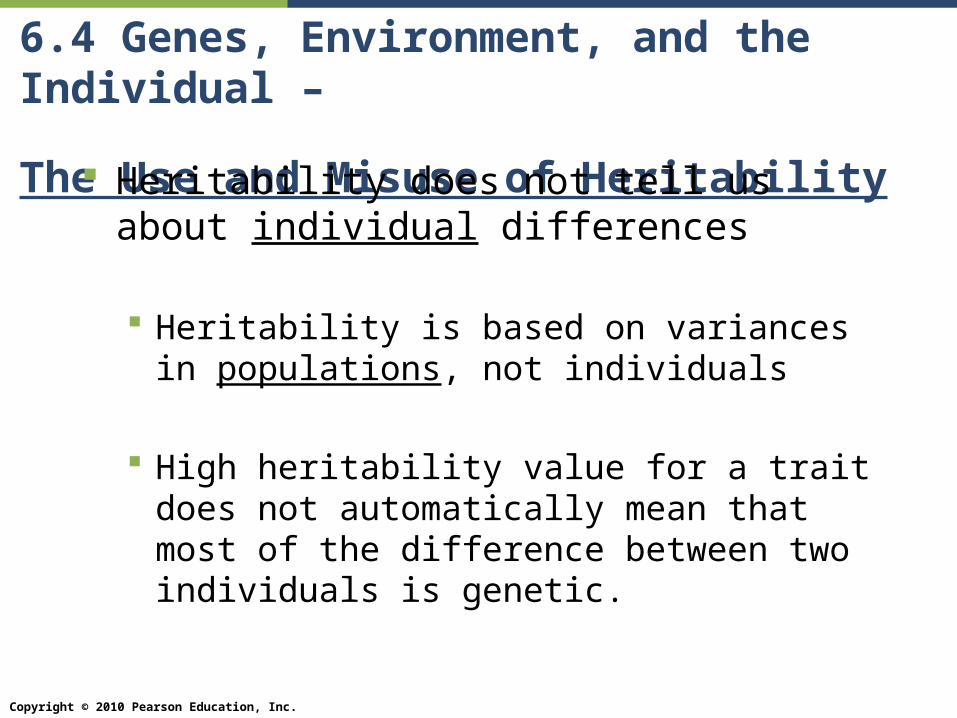
The Use and Misuse of Heritability Heritability does not tell us about individual
differences
Heritability is based on variances in populations, not individuals
High heritability value for a trait does not automatically mean that most of the difference between two individuals is genetic.

Copyright © 2010 Pearson Education, Inc.
6.4 Genes, Environment, and the Individual –
How Do Genes Matter? Genes have a strong influence on even
complex traits. But, independent assortment of multiple
genes with multiple alleles produces a large number of phenotypes.
Environment can also have a big effect. For quantitative traits, it is difficult to
predict the phenotype of children from the phenotypes of the parents

Copyright © 2010 Pearson Education, Inc.
6.4
END Chapter 6 Section 4
Genes, Environment, and the Individual

Copyright © 2010 Pearson Education, Inc.
END Chapter 6
Mendelian and Quantitative Genetics
Are You Only As Smart As Your Genes?