Chapter 5 – Wear Behavior of Metallic Glass Gears Chapter 5 – Wear Behavior of Metallic Glass...
42
73 Chapter 5 – Wear Behavior of Metallic Glass Gears Introduction Metallic glasses have a range of advantageous properties which are well known in the literature. They are considered to be high strength, tough, 1,2 good in corrosion, 3,4 and highly processable 5 to name a few. This chapter will focus on another oft-cited property of metallic glasses: wear resistance. Wear and friction have been the focus of study since the 1970s. 6 In the interim, many systems have been studied many different ways. To help aid with the uniformity of study, the American Society for Testing and Materials (ASTM) has created standards by which wear tests should be performed. 7 These standards, as described below, will be adhered to as closely as possible in this study. Many previous studies have been performed on metallic glasses in wear, but a main issue is the variety of different ways it can be measured. ASTM offers more than twenty different standards and methods by which wear, and wear-related properties, can be measured in metals. Figure 5-1 outlines some of the most frequent methods used to study wear. The most common test is pin-on-disk, where a pin (either a cylinder or ball) is held stationary while the disc is rotated. This test can be performed in the geometry shown, with the pin being pushed up from the bottom, or with the apparatus rotated to the side. Depending on how the test is oriented, wear debris can collect on the sample differently, causing differing amounts of wear at extended periods of time. Some studies also use the sample under study to be the pin, and others the disc. The second test is shown in (c), a reciprocating pin on plate. This geometry was used for many of the early MetGlas experiments from the literature. A pin (typically a stainless steel alloy) is held stationary while the ribbon is reciprocated underneath it. The geometry has
-
Upload
truongdien -
Category
Documents
-
view
221 -
download
0
Transcript of Chapter 5 – Wear Behavior of Metallic Glass Gears Chapter 5 – Wear Behavior of Metallic Glass...

73 Chapter 5 – Wear Behavior of Metallic Glass Gears
Introduction
Metallic glasses have a range of advantageous properties which are well known in the
literature. They are considered to be high strength, tough,1,2 good in corrosion,3,4 and highly
processable5 to name a few. This chapter will focus on another oft-cited property of metallic
glasses: wear resistance. Wear and friction have been the focus of study since the 1970s.6 In the
interim, many systems have been studied many different ways. To help aid with the uniformity
of study, the American Society for Testing and Materials (ASTM) has created standards by which
wear tests should be performed.7 These standards, as described below, will be adhered to as
closely as possible in this study.
Many previous studies have been performed on metallic glasses in wear, but a main
issue is the variety of different ways it can be measured. ASTM offers more than twenty
different standards and methods by which wear, and wear-related properties, can be measured
in metals. Figure 5-1 outlines some of the most frequent methods used to study wear. The most
common test is pin-on-disk, where a pin (either a cylinder or ball) is held stationary while the
disc is rotated. This test can be performed in the geometry shown, with the pin being pushed up
from the bottom, or with the apparatus rotated to the side. Depending on how the test is
oriented, wear debris can collect on the sample differently, causing differing amounts of wear at
extended periods of time. Some studies also use the sample under study to be the pin, and
others the disc. The second test is shown in (c), a reciprocating pin on plate. This geometry was
used for many of the early MetGlas experiments from the literature. A pin (typically a stainless
steel alloy) is held stationary while the ribbon is reciprocated underneath it. The geometry has

74
Figure 5-1: Common wear test geometries: (a) pin-on-disc with circular track (b) pin-on-disc with spiral track (c) pin-on-plate (d) block-on-ring (e) disc-on-wheel (f) thrust washer (g) ball-on-prism (h) four ball. Pin-on-disc and pin-on-plate may be identified as ball-on-disc or ball-on-plate, respectively, if the pin has a hemispherical tip.8
also been used for rods of metallic glass being rubbed against a steel plate. (d) is another
technique used for cylinders of metallic glass where they can be worn against a rotating ring.
The wide variability in testing procedures has made it hard to do direct comparisons from one
study to another.
It has been well established that wear rate is related to loading conditions. Numerous
studies have found a direct proportionality of wear rate to the applied load. It has been seen in
Fe, Ni, and Co-based amorphous ribbons,9 as cast, crystallized, and annealed Vitreloy 1,10 as
well as in Cu-based bulk metallic glasses.11 Palar et al12 have performed extensive studies on the
relationship between load and sliding speed on both wear and coefficient of friction (µ). They
found an inverse relationship between µ and the normal force. It was also found that as sliding
speed was increased, µ stayed roughly constant except for the slowest speeds, where it slightly
increased. Finally, they found as the normal load was increased the wear rate decreased.
Conflicting reports on velocity by others have also been published. Tao et al13 state there is a

75 decrease in mass loss per rotation with increased velocity, but an increase coefficient of friction.
On the other hand, Li et al10 state that by increasing the sliding velocity there is an increase in
wear rate for as cast, crystallized, and annealed Vitreloy 1. Wear rate has also been shown to
directly relate to the sliding distance for Cu-based BMGs.11
Most tests tend to be performed on the lower end of the force and sliding velocity
spectrum. A reason for this is, as a wear test is performed, heat is generated. If the sliding
velocity was high enough, the material wouldn’t have enough time to diffuse heat away from
the wear track, and temperatures could rise to the glass transition range (or higher). Likewise,
for higher pressures, more work is being done at the point of contact, so more heat should be
generated. Therefore, at high pressures and sliding speeds, the most heat will be generated, and
a breakdown to the linear nature of sliding velocity and load can be expected. At this point,
crystallization or displacement of material through flow instead of plasticity can be expected. In
order to probe this region, a few experiments have been performed. Huang et al found a
decrease in wear resistance along with hardness as temperature increased in a Fe-based BMG.14
Liu et al performed wear tests near the glass transition temperature in Vitreloy 1. They found
near Tg both µ and wear was reduced. As temperatures went higher, friction was reduced more
as well. Yet another study found conflicting results, with the µ increasing at higher
temperatures.12
Yet another possibility for influencing wear in metallic glasses is through various heat
treatments. When a metallic glass is quenched, its properties are strongly dependent upon its
enthalpy. A rapidly quenched glass will have different properties than one cooled just barely fast
enough to form a glass. By annealing at a given temperature, a well-defined position in the
potential energy landscape can be reached; so many groups have tested both annealed and
76 crystallized states. Segu et al crystallized a Fe-based BMG and found the crystalline form had
much worse wear than the amorphous.15 Tam and Shek partially crystallized 3 mm pins of
Cu60Zr30Ti10 and found 30% crystallinity improved wear resistance over as cast samples, and both
outperformed a sample which was 50% crystalline.16 Maddala and Hebert annealed
Cu50Hf41.5Al8.5 for a variety of times at a temperature high enough to slow grow nanocrystals.
They found that as annealing time increased, toughness decreased while hardness increased.
Associated with the increase in hardness was a decrease in the wear rate, up until full
crystallization, at which point the hardness still increased, but the wear rate increased
dramatically.17 Another study found that for Vitreloy 1, a relaxed glass performed the best,
followed by the as cast, and then crystallized.10 Similarly, another study of a different Zr-based
glass found a minimum in wear rate at 40% crystallinity, and claimed to have seen crystallization
occurring in the wear track.18 Chen et al had the creative idea of using a laser to melt a thin
surface layer and create a gradient from fully crystalline to fully amorphous, and then
performing wear testing on each of the interfaces. It was found that the layer which consisted of
an amorphous matrix with crystalline dendrites performed the best (as opposed to the layer
with an amorphous matrix and nanocrystallites which performed poorly).19 Finally, Liu et al
tested thermally sprayed Fe62Ni3Cr4Mo2W2Si6B17C3. They found that once crystallized its wear
performance was the best, followed by the as sprayed condition, and it was the worst when
partially crystallized.20 In the Ni59Ti16Zr20Si2Sn3 system, however, when kinetically sprayed it
outperformed both the partially crystalline and fully crystalline forms when fully amorphous.21
Metallic glasses have also been tested under a variety of different environmental
conditions. In a comparison between wear in dry conditions, deionized water, and hydrogen
peroxide, Vitreloy 1 was found to resist wear best in dry conditions, followed by 60%-90% H2O2,

77 then DI H2O, then 30% H2O2.22 At least three studies have been performed on zirconium based
glasses in inert atmospheres. The first found wear was significantly worse under oxygen than
argon.23 The second found the same conclusions as the first, and also performed testing under
an argon atmosphere, where it performed similar to under vacuum. It was also found that the
surface likely formed a zirconium oxide, which readily flaked off and resulted in high wear
rates.24 A follow-up study included an oxygen environment where wear was accelerated even
further than air.23
A few other studies have been published which are also pertinent for the current
chapter. Microgears (2.4 mm in diameter) have been fabricated out of a Ni-based alloy, and
outperformed the currently used steel in a rolling wear test.25 Another group made composites
by including small Fe BMG particles into a crystalline Ni matrix. They noticed that as more BMG
was added, µ decreased, but it led to a more brittle wear path.26
There are also a number of hypotheses in the literature about various material
properties which should be discussed. The CRC Handbook of Lubrication & Technology makes
the assertion that toughness is the main determinant of wear resistance.27 This view is
tempered in Introduction to Tribology; which qualifies the above idea by stating that fracture
toughness generally only affects the wear rate in extremely hard and brittle materials. It also
states that wear rate can decrease with an increase in the modulus of elasticity for materials
with primarily elastic contacts.28 Opinions are split as to whether the wear performance of
metallic glasses is proportional to hardness14,23,26,29 while others do not15,18. An inverse
relationship between wear resistance and hardness is predicted by the well-known Archard’s
wear equation. A final proposed correlation is the ratio of the hardness to elastic modulus.
Oberle predicted that materials with a low elastic modulus will be able to accommodate the

78 passage of an abrasive through elastic deformation and avoid permanent damage.30 This
supposition has seen renewed popularity in the applications of nanoindentation.31
Experimental While the studies on wear resistance in metallic glasses are vast, this chapter will focus
on a very specific set of requirements, with a particular end use in mind. Recently, prior to the
launch of the Mars Science Laboratory (MSL), the steel alloy selected for the gearboxes on the
Curiosity rover was found to wear at unacceptable rates in a cold environment. At the time, only
ceramic gears had been shown to provide wear behavior at acceptable levels; however, they
were expensive and unqualified. So, due to time and budget constraints, a quick engineering fix
had to be used. Instead of finding a new material to replace the current Vascomax steel gears, a
lubricant was added. Unfortunately, the lubricant’s viscosity was too high at low temperatures,
and therefore the entire gear box required heating. This necessitated adding heater cartridges
and temperature sensing instrumentation to each of the gear boxes on MSL. In addition, wiring
routes had to be designed and implemented. Now that MSL has landed, the heat cartridges
require power, and actually use approximately 30% of the energy produced by the radioisotope
thermoelectric generators. If the gears could instead be used at ambient temperatures, all of
that excess power could be used toward scientific instruments.
For this reason, a few basic requirements were set for BMG alloys under consideration.
The gears would need to have a minimum critical casting thickness of 3 mm in a 25.4 mm
diameter circle via suction casting into copper molds. The desired BMG should have a high
enough toughness to survive casting, and some minor post-casting processes, such as machining
or wire-cut electrical discharge machining (EDM). The goal was to create an alloy with the wear
characteristics of a ceramic, but the toughness of steel. It is also desirable to have fully
79 amorphous (or controllably composite) gears allow for consistent properties from the as-cast
state. Metastablely processed composites, those which form dendrites that are not in
thermodynamic equilibrium in the semi-solid regime, are not acceptable, as their properties are
highly dependent upon both sample geometry and cooling rates. Likewise, nanocrystalline alloys
will not be considered in this chapter, as their grain size (and thus properties) can be heavily
reliant upon their processing history, in addition to their typically low toughness.
This initial screening stage narrows the available BMG families down to zirconium,
titanium, and copper based alloys. Iron, magnesium, lanthanum, nickel, and all other families
are either too brittle or will not form glasses in the geometry being tested.
Cylinder-on-Disk Testing
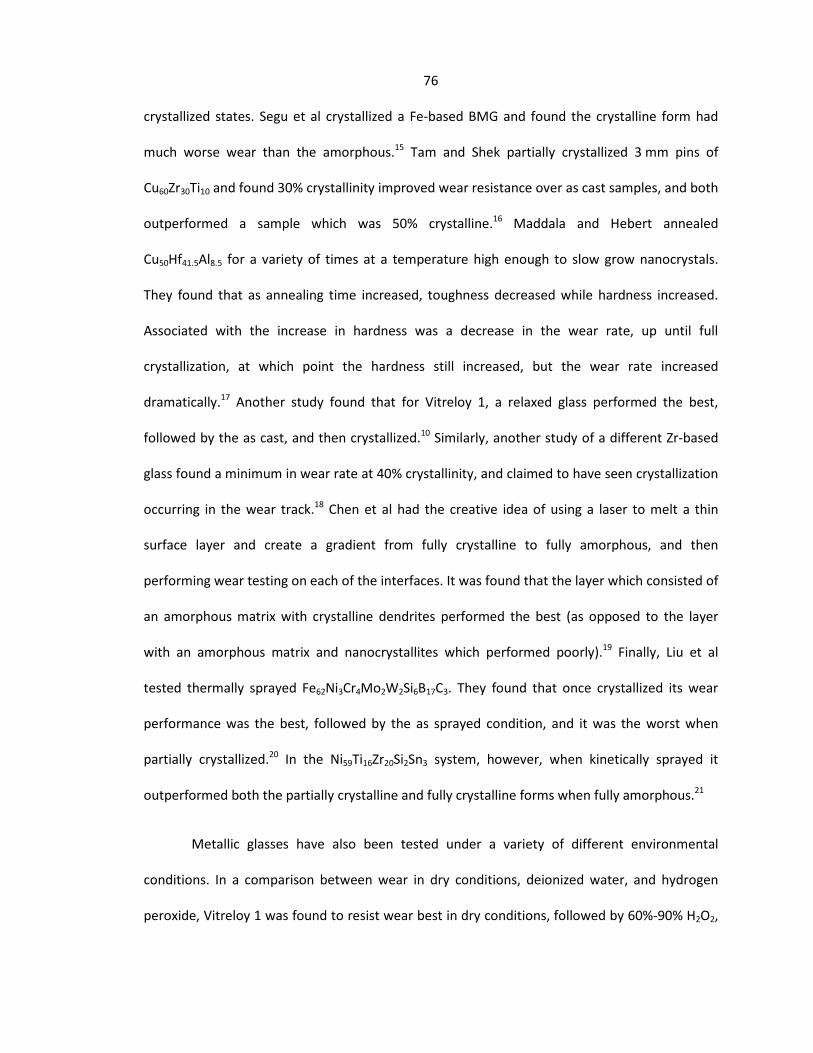
Figure 5-2: a) A schematic for a cylinder-on-disk test. b) Highlighting the mounting system for the cylinder and demonstrating the line contact. c) A cylinder-on-disk test in progress.
Initial testing was done with a cylinder-on-disk test. A schematic of the test is shown in
Figure 5-2. In this test, a steel cylinder is pushed onto a disk of the material to be tested. The
disk is then rotated with frequency ω for a given distance. The constant force is applied by
weight hanging through a pulley system. This test was initially used as a quick screening method
F
ω Amorphous Disk
Steel Cylinder
cylinder
weight
wear track

80 for a variety of metallic glass alloys. Table 5-1 summarizes the cylinder-on-disk findings. Mass
loss is defined as the change in mass of the test sample as measured before and after the wear
test. Nitronic 60 is a fully austenitic steel designed with the intention of being used in high wear
conditions. SS 15-5 PH is a precipitation hardened stainless steel commonly used in gears. Ti-
6Al-4V STA is a low density titanium alloy which has been solution-treated and aged. It is a
common aerospace material. Vascomax C300 is a maraging steel with high hardness and
strength. Two amorphous alloys supplied by a commercial source were tested, and compared
against ingots created in the laboratory. Then, a number of glass forming alloys were also
fabricated via arc melting and suction casting into a copper mold.
Table 5-1: Summary of Pin-on-Disk Results Wear Loss in
cylinder-on-disk(mg)
Nitronic 60 Crystall ine 6.9SS 15-5 PH Crystall ine 5.7
Ti-6Al-4V STA Crystall ine 5.2Vascomax C300 Crystall ine 0.5
Zr36.6Ti31.4Nb7Cu5.9Be19.1 (Commercial) Amorphous 19.1Zr41.2Ti13.8Cu12.5Ni10Be22.5 (Commercial) Amorphous 16.3
Zr35Ti30Cu8.25Be26.75 Amorphous 10Zr36.6Ti31.4Nb7Cu5.9Be19.1 Composite 7.3
Zr41.2Ti13.8Cu12.5Ni10Be22.5 Amorphous 6.4Ti48Zr20V10Cu5Be15 Composite 5.5
Zr57Nb5Cu15.4Ni12.6Al10 Amorphous 4.1Cu47.5Zr48Al4Co0.5 Composite 3.5
Cu47Zr46Al5Y2 Amorphous 2.8Cu43Zr43Al7Be7 Amorphous 2.3Cu43Zr43Al7Ag7 Amorphous 2
Cu41Zr40Al7Be7Co5 Amorphous 0.9Ni40Zr28.5Ti16.5Al10Cu5 Amorphous 0.2
Alloy Name State
A large range of mass loss can be seen in both crystalline and amorphous systems.
Vascomax, the current material used in gears on the MSL, outperforms its closest conventional
competitor by an order of magnitude (0.5 mg material lost compared to 5.2 for Ti-6Al-4V).
Zr41.2Ti13.8Cu12.5Ni10Be22.5 (Vitreloy 1) performed extremely poorly when taken from commercially

81 cast plates, with a wear loss of 16.3 mg to the 6.4 mg of a laboratory prepared sample.
Zr36.6Ti31.4Nb7Cu5.9Be19.1, a BMGMC, also performed considerably worse using commercial stock
material, with 19.1 mg to 7.3 mg from a laboratory prepared ingot. This is likely due to the
known problem with commercial materials having a higher amount of impurities (excess oxygen,
carbon, etc) due to poor processing conditions. Alloys with these impurities are known to have
inferior mechanical properties to those produced via more clean methods. The rest of the MG
alloys can be seen to span a range of wear behaviors, from Zr35Ti30Cu8.25Be26.75 being marginally
worse than the crystalline alloys, to Ni40Zr28.5Ti16.5Al10Cu5 only losing 0.2 mg, a 60% improvement
on Vascomax.
Figure 5-3: Profilometry data for three samples. The Ti-based composite and Zr-based AM were both polished to a 0.02 um finish, while the Nitronic 60 sample was finished on a lathe. Inset are images of each sample post-wear.
82
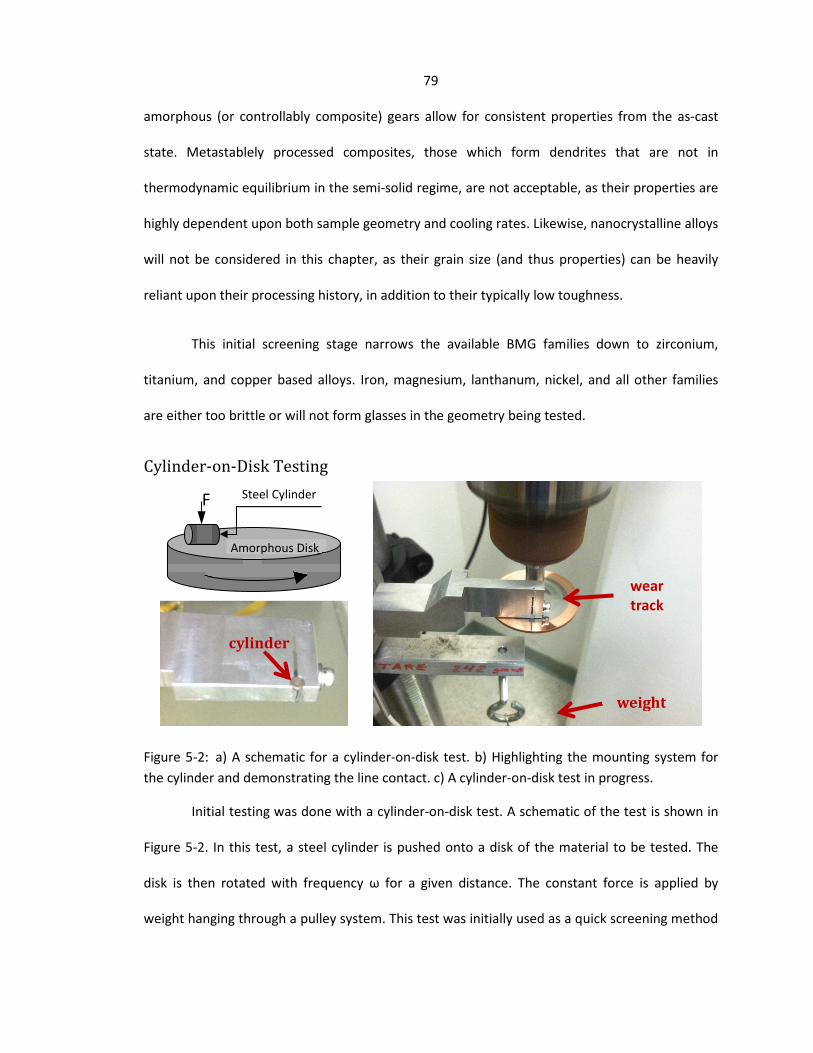
As another measure of wear resistance, profilometry measurements were performed on
some of the specimens. Figure 5-3 contains a plot of wear depth versus position from a
titanium-based composite, Vitreloy 1, and Nitronic 60, an austenitic steel alloy (shown inset).
For each sample, an average wear depth (Rm) was calculated. The Ti-based composite fared the
worst, with an average wear depth of 8.4 µm. Both Vitreloy 1 and Nitronic 60 had similar wear
depths, with 4.7 µm and 5.1 µm, respectively. While Vitreloy 1 had a smaller average depth, the
profile was less consistent, with much heavier wear on one side of the track than the other. This
likely arose due to an issue with the metal cylinder not being perfectly flat on the sample during
the wear test.
Pin-on-Disk Testing Issues such as the one above with a misaligned cylinder prompted further refinement of
our experimental technique. In order to decreases sensitivity to instrumental error and come
into compliance with ASTM standards, a pin-on-disk (POD) tester was built and used instead of a
cylinder-on-disk tester. Figure 5-4a is a schematic of how a POD tester operates. Similar to a
cylinder-on-disk test, the sample is rotated at a frequency ω with a pin placed at some radius, R,
away and a normal force, F, applied to it. In this case, however, a point force is applied by a
stainless ball bearing instead of a cylinder, which creates a line force. Figure 5-4b and 5-4c show
a specimen being tested. The testing conditions were kept consistent for all samples. R was
9.75 mm, the ball bearing was 4.76 mm in diameter, the rotational frequency was Y Hz, and a
normal force of 1 N was applied. The samples were run for a total distance of 1.2 km. The
frictional force was also measured via a Wheatstone bridge. Samples were individually weighed
and alloyed in an arc melter. They were then suction cast into a copper mold 25 mm in diameter
and 2.75 mm thick (shown inset in Figure 5-4d). Each then had the gate sections removed. Faces
were polished to a 16 µm finish prior to testing.

83
Figure 5-4: a) A schematic diagram of the ASTM standard pin-on-disk test. b) An overhead view of a POD test in progress. Wear debris can be seen on the edges of the sample holder. c) An overview of the POD tester. The pin is located at the end of a long arm to allow for precise application of a normal force. d) An as-cast sample prior to removal of gate material.
For each sample, a number of measurements were performed. The Vickers hardness
was measured on a Leco LM247 hardness testing machine. A 2 kg weight was used with a dwell
time of ten seconds. At least three hardness measurements were made around the sample to
account for local variability. The density was determined via the Archimedes method. By
measuring the speed of shear and longitudinal sound waves being propagated through the
sample, all of the elastic moduli can be determined through the relations for isotropic
materials:32
ρGK
cl34+
= ρGcs = (1)
wear track
Pin
a
b
c
d

84
GKKGE+
=39
(2)
KEv
621
−= (3)
Where cl and cs are the longitudinal and shear wave speeds, respectively, ρ is the density, K is
the bulk modulus, G is the shear modulus, E is the elastic modulus, and ν is Poisson’s ratio. From
the frictional force data, both a run-in time (the amount of time for a steady-state force to be
reached) and an average frictional force were measured. In order to measure mass loss
accurately, each sample was weighed on the same analytical balance with precision to 0.1 mg
multiple times, both before and after the test was performed. Each alloy had at least two wear
tests performed to try and detect anomalous results. A Mitutoyo Surftest SJ-210 surface
roughness tester was used to measure the surface profile across the wear track.
The most important value measured in testing is the mass loss. One has to be careful
when interpreting this value, though, since it can be heavily influenced by the density of the
material being worn. Suppose identical gears were made out of tungsten (density of 19.3 g/cm³)
and beryllium (1.85 g/cm³). During a wear test it could be possible that the beryllium gear loses
half as much mass as the tungsten gear. One could be tempted to quickly assume the Be gear
performed significantly better, since it lost hardly any weight. However, volume-wise it lost
almost 21x more material. So, by converting to volume loss, the differences in density between
varying alloy systems can be compensated for.
In addition to compensating for the variability in densities between materials, it is
desirable to use a quantity which is as independent of testing conditions as possible. In following
Greer’s derivation,33 we start with Archard’s wear equation34

85
HSNKVW = (4)
Where VW is the total volume of material removed by wear, S is the sliding distance, N is the
normal load, H is the hardness, and K is the dimensionless wear coefficient. In order to be able
to compare across multiple experimental conditions (differing loads, wear distances, etc.) the
dimensional wear coefficient, k is used instead.
SNV
NKk W== (5)
k has units of Pa-1, but can also be defined as mm³/(N-m). This then allows us to take a measured
wear loss and convert it into a measurement of the volume of material lost per distance per
normal load.
ρSNmk ∆
= (6)
From this we now have a measurement which will allow not only comparing across different
alloy systems, but across different experimental setups, and allow comparisons in the future for
measuring the effect of distance and load on the rate of material removal.
Unfortunately, there has not been a comprehensive study of BMG alloys in wear
resistance, and the studies which have been done have generally been done through very
different experimental methodologies. For this reason, it was determined the first thing to be
performed would be a survey of a number of different systems. Samples would need to be able
to be suction cast from an arc melter into a copper mold and remain amorphous in a 25.4 mm
diameter by 3 mm thick geometry. Unfortunately, these requirements take out a number of
systems containing elements with high vapor pressures. During the arc melting process the
constituent elements are heated up in excess of 1750 K, and elements with high vapor pressures
86 can rapidly evolve into vapor, making it difficult to reliably create stoichiometrically accurate
alloys. This eliminates, for the most part, all Ni and Fe based alloys. Appendix A gives all of the
compositions fabricated, as well as the following quantities measured: state (amorphous,
composite, or crystalline), density, Vickers hardness, elastic modulus, bulk modulus, shear
modulus, Poisson’s ratio, measured wear loss, volume of material lost, average wear track
depth, average wear track width, and k, the dimensional wear coefficient. Compositions are
grouped by alloy family (CuZr, Ni, Ti, and Zr/ZrTi).
One of the attributes typically given to BMGs is their “high wear resistance,” but
Figure 5-5’s representative plots of a few alloys’ wear tracks demonstrates how BMGs’
performance can span the space of wear loss from being on par with state-of-the-art materials
to well over an order of magnitude worse. Vascomax’s wear track was barely measurable, as
was crystalline Ni56Zr17Ti13Si2Sn3Be9. Cu43Al43Al7Be7 had marginally worse performance, though it
was nowhere near as bad as the Zr-based GHDT, which had roughly an average wear track over
thirty times deeper than that of crystalline Ni56Zr17Ti13Si2Sn3Be9. Unfortunately, even though the
Ni based alloy had phenomenal wear performance, it was very brittle. This makes it somewhat
limited in usefulness, it was unable to survive being machined in any form, which is a necessity
to cut gear teeth or to machine mounting holes. Going back and inspecting Appendix A, it can be
seen all of the Ni alloys are either fully crystalline or composites. All of the composites also
appear to be the “accidental” type, which makes them fairly uncontrollable in an engineering
sense and therefore not suitable to our purpose.
As there were two methods used to measure the amount of wear loss, it is worthwhile
inspecting the differences between the two. The first was a direct method, done by measuring
the mass of material lost from the wear testing. Each sample was weighed at least six times

87 immediately prior to testing, tested, cleaned of any wear debris with ethanol after completion
of the test, dried, and then reweighed at least another six times. This procedure generally left
certainty in the measurement of mass at each point to approximately 0.1 mg. The mass lost was
then converted to volume loss through the density formula,
ρmV ∆
=∆ (7)
This allows for direct calculation of volume loss. Another method is by using a profilometer to
find the wear profile across the wear track in numerous places (examples are given in
Figure 5-5). An average wear depth can then be measured for each profile, and an average
overall depth can be found. This introduces some uncertainty due to the need for setting a
baseline, variability in the wear track, and precision of the profilometer. However, at small mass
losses it does seem to be fairly sensitive, and, as such, could be a useful tool in distinguishing
between performance of low wear alloys. The volume of wear loss was determined by using the
formula for an extruded annulus:
( )22iom rrRV −= π (8)
Where Rm is the average wear depth, ro is the outer wear radius, and ri is the inner wear radius.
We also know the following relations:
22W
iW
oRRrRRr −=+= (9)
Where R is the initial radius of wear and RW is the total width of the worn track. By substituting
in we get:

88
Figure 5-5: A comparison of line profiles between different alloys after a pin-on-disk test. A large difference can be seen between the current gear material, Vascomax, and one of the worst performing BMG alloys tested.
−−
+=
22
22WW
mRRRRRV π
mW RRRV π=
(10)
So, by simply measuring an average wear depth, an average width, and knowing our initial wear
radius, the volume of material lost can be calculated. Figure 5-6 is a comparison of the two
methods for finding volume loss for all alloys tested. Points which fall above the solid line have a
Vascomax 300 Rm = 0.588 µm
Crystalline: Ni56Zr17Ti13Si2Sn3Be9 Rm = 0.432 µm
BMG: Cu43Zr43Al7Be7 Rm = 1.128 µm
BMG: Zr35Ti30Cu8.25Be26.75 Rm = 15.65 µm
Width = 1060 µm
Width = 1040 µm
Width = 470 µm
Width = 170 µm
Position
Dept
h
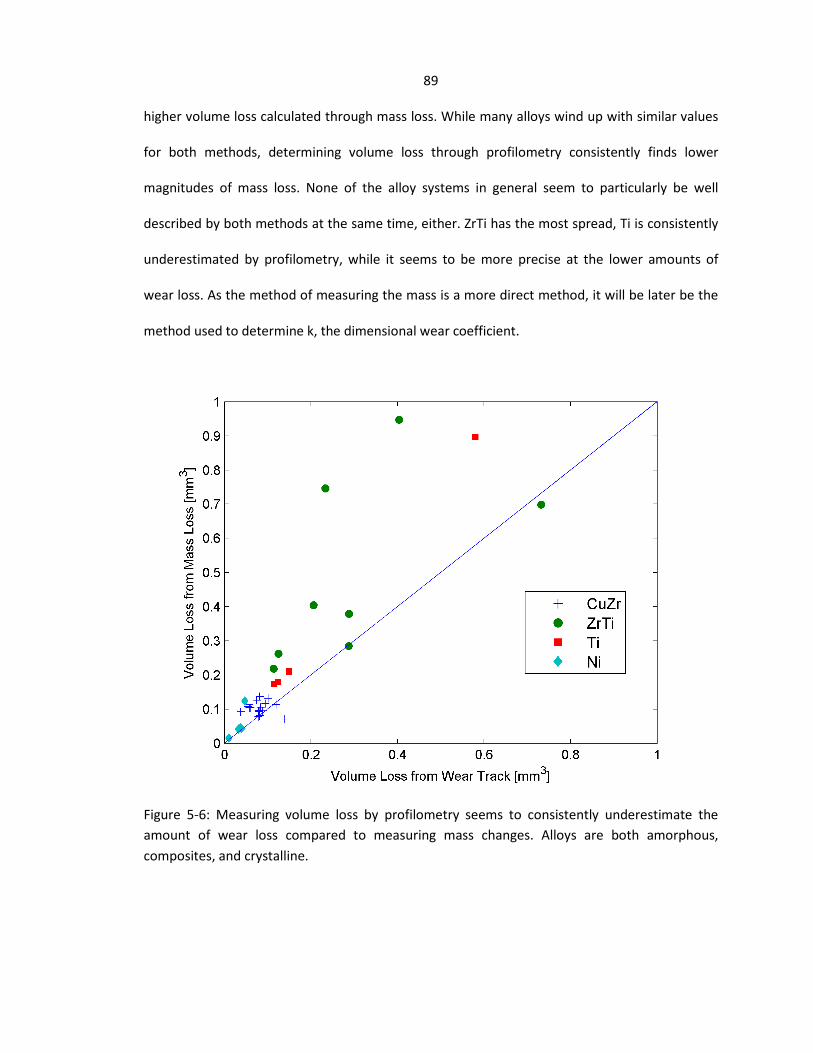
89 higher volume loss calculated through mass loss. While many alloys wind up with similar values
for both methods, determining volume loss through profilometry consistently finds lower
magnitudes of mass loss. None of the alloy systems in general seem to particularly be well
described by both methods at the same time, either. ZrTi has the most spread, Ti is consistently
underestimated by profilometry, while it seems to be more precise at the lower amounts of
wear loss. As the method of measuring the mass is a more direct method, it will be later be the
method used to determine k, the dimensional wear coefficient.
Figure 5-6: Measuring volume loss by profilometry seems to consistently underestimate the amount of wear loss compared to measuring mass changes. Alloys are both amorphous, composites, and crystalline.

90
Figure 5-7: a) k versus hardness. These are typically considered directly proportional, however for our alloys there seems to be no trend. b) k versus E/H. The quotient of elastic modulus to hardness can be seen as a ratio of elasticity versus resistance to plastic deformation. c) As expected, E is fairly proportional to HV. All alloys are amorphous.
The most commonly cited criteria for predicting wear resistance is its hardness, due to
its presence in the Archard wear equation (4). Figure 5-7a contains plots comparing the Vickers
hardness to wear resistance. A couple of trends emerge. First, there seems to be little
correspondence between hardness and wear resistance. The softest CuZr alloys wear less than
the hardest, and the compositions with moderate hardness have similar wear performance. The
Ti-based system has moderate wear performance, although one composition has the worst of
any amorphous alloy tested. In general, ZrTi is poor in wear, and has the opposite performance
of what is expected: as hardness increases, wear resistance decreases. Figure 5-7b compares k
to the ratio of the elastic modulus, E, versus hardness. This quantity (E/H) is a ratio of elasticity
a b
c

91 in a material to resistance to plastic deformation. If one thinks of wear, it can be seen as a series
of asperities on each surface impinging on the others. The elasticity measures how much energy
it takes to elastically deform them, and the hardness gives an estimate of how much energy it
takes to then permanently deform the asperity to a different shape. For this reason, it wouldn’t
be surprising if the two are related to wear behavior. Again, though, we see most of the
clustering occurring due to alloy system, with no apparent global or systemic relationships.
Figure 5-7c directly compares E to hardness, and there does at least appear to be a
relationship between these two. As hardness increases so does the elastic modulus. This does
make a bit of intuitive sense, especially in metallic glasses. Elasticity is a macroscopic measure of
the stiffness of bonds between neighboring atoms. As these become stiffer, it becomes more
difficult to separate them enough to initiate a shear band, the method by which metallic glasses
plastically deform. This is why an increased E should lead to an increased hardness.
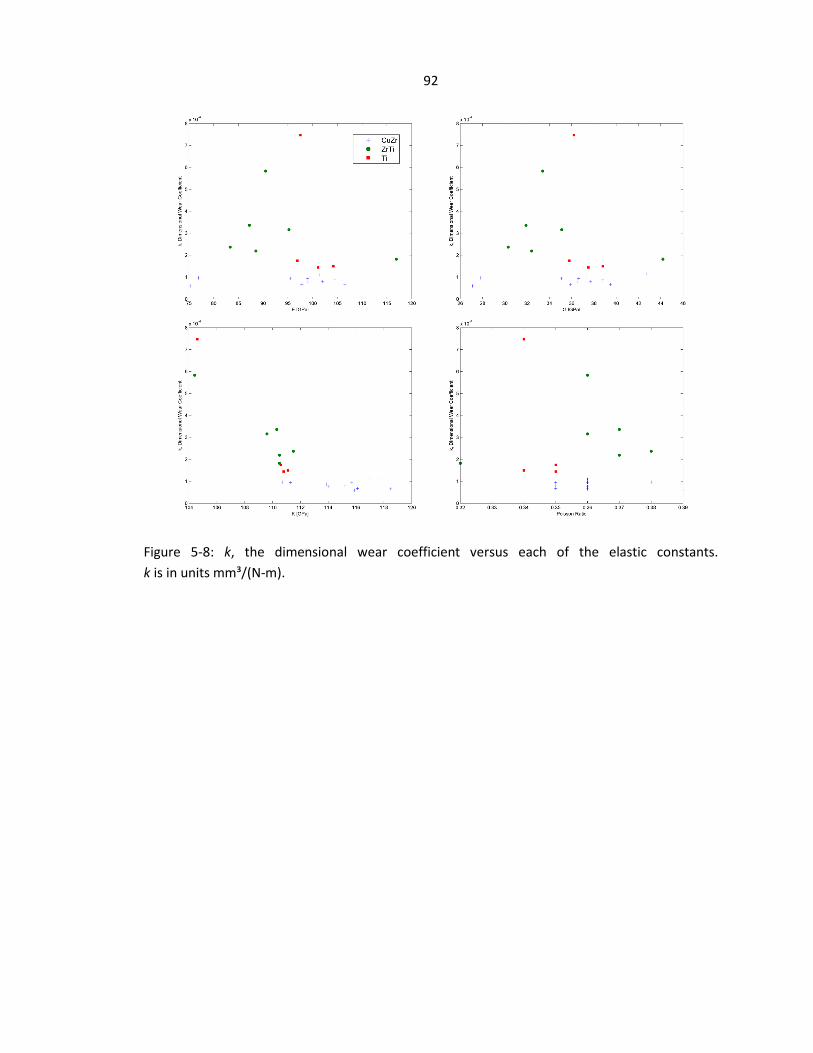
Another set of properties suspected to have a relationship to wear performance is the
elastic constants. Figure 5-8 contains plots of the elastic modulus (E), shear modulus (G), bulk
modulus (K), and Poisson’s ratio versus k. For E, G, and Poisson’s ratio there is no obvious
correlation. Groupings again only appear by alloy system, without any particular trends within
systems apparent either. There does appear to be a trend between the K and k. As the bulk
modulus increases, the wear resistance increases. This is surprising, as in the wear process
asperities would be more likely to undergo a shear stress, and thereby be influenced strongly by
G instead of K.
92
Figure 5-8: k, the dimensional wear coefficient versus each of the elastic constants. k is in units mm³/(N-m).
93
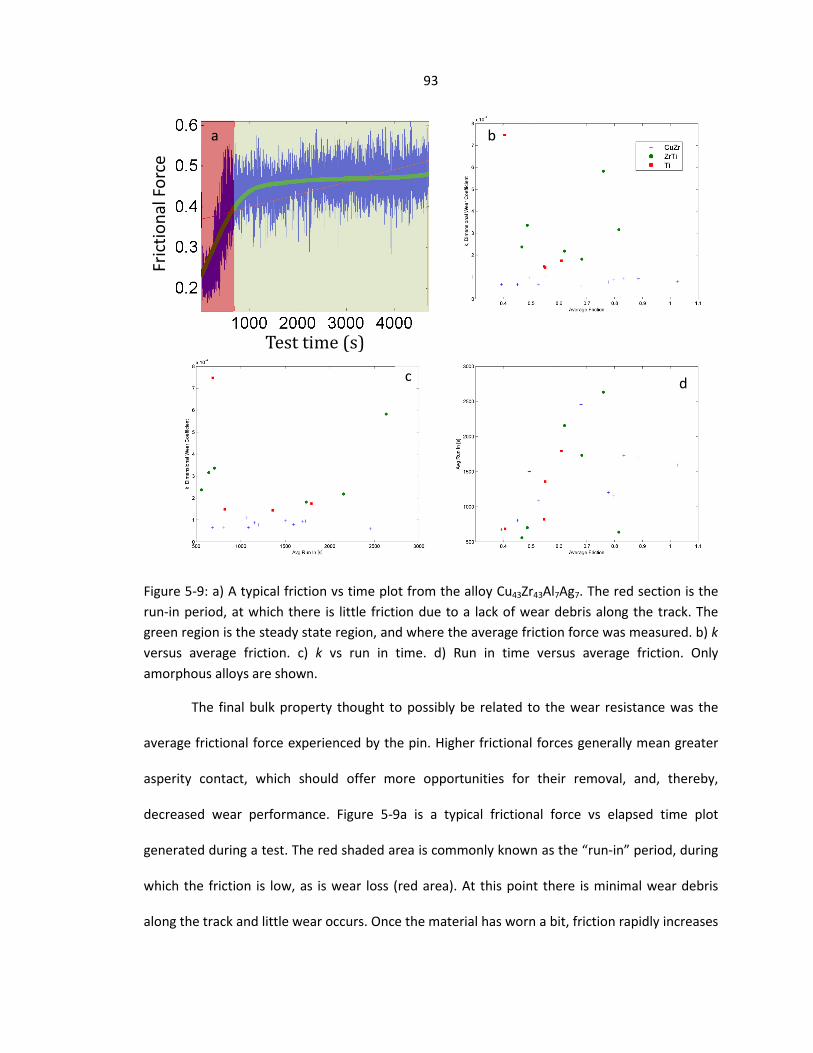
Figure 5-9: a) A typical friction vs time plot from the alloy Cu43Zr43Al7Ag7. The red section is the run-in period, at which there is little friction due to a lack of wear debris along the track. The green region is the steady state region, and where the average friction force was measured. b) k versus average friction. c) k vs run in time. d) Run in time versus average friction. Only amorphous alloys are shown.
The final bulk property thought to possibly be related to the wear resistance was the
average frictional force experienced by the pin. Higher frictional forces generally mean greater
asperity contact, which should offer more opportunities for their removal, and, thereby,
decreased wear performance. Figure 5-9a is a typical frictional force vs elapsed time plot
generated during a test. The red shaded area is commonly known as the “run-in” period, during
which the friction is low, as is wear loss (red area). At this point there is minimal wear debris
along the track and little wear occurs. Once the material has worn a bit, friction rapidly increases
Test time (s)
Fric
tiona
l For
ce
a b
c d

94 and typically reaches a roughly equilibrium value (green area). This is the number used for the
“average frictional force.” Figure 5-9b shows wear resistance does not correlate with the
amount of friction between the wearing surfaces. Interestingly, each alloy system also has a
spread of coefficients of friction. Run-in times varied considerably from sample to sample, and
they did not correlate with wear resistance (Figure 5-9c). This signifies the test went sufficiently
long after run-in finished such that the majority of the testing time was done under abrasive
wear conditions. Figure 5-9d demonstrates the lack of relationship even between the frictional
force and run-in time. Unlike most other properties measured, this did not even appear to
depend upon the alloy system. To reiterate, all samples were prepared with the same initial
surface finish, each with a new pin, and all had the same force applied at the same radius.
Wear Under Differing Conditions In order to help determine the extent to which the wear characteristics are a function of
the state of the quenched liquid, two annealing studies were performed. The first was on
Zr35Ti30Be27.5Cu7.5. This alloy was chosen both since it has previously had studies on the change in
its mechanical properties after annealing35 and because it was poor in wear. An alloy which
readily wears will give a much larger result for a smaller percentage change in properties. To
minimize the effects of oxidation during annealing, all samples were annealed under vacuum
and surrounded with titanium turnings to serve as getters for oxygen leaking into the system.
Samples were repolished after being annealed to remove any surface oxides. The annealing
temperature of 553 K (~25 K below Tg) was chosen by analysis of the work done by Garret, et. al.
Two samples were annealed, one for 120 minutes and the other for 240 minutes. A third sample
was fully crystallized by annealing at 773 K for two hours (Tx is ~738 K). The two amorphous
samples remained fully amorphous upon XRD and the crystallized sample did not have a visible
amorphous hump.

95
Figure 5-10: Wear loss and hardness data after annealing of Zr35Ti30Be27.5Cu7.5
While the dimensional wear coefficient compensates for the normal force applied and
the distance worn, it does not account for the velocity of the pin relative to the sample. At this
point in our experiments, a new apparatus had been constructed to replace the first, and it ran
at a different speed than the first. As such, k values did not precisely match those of the alloy
survey above. In order to compare between the differing setups, each alloy to be tested under
specialized conditions was rerun. Figure 5-10 gives the results from both annealing and
crystallizing Zr35Ti30Be27.5Cu7.5. Wear loss performance improves by 20% upon the initial two
hours of annealing. Changing the annealing time to four hours affects the alloy minimally, with
both the wear resistance and hardness staying roughly constant. After crystallization, however,
wear performance is increased another 20%, while hardness changes from approximately
460 HV to 500 HV (an 8% change). The total difference in k is 1.25e-3 mm³/(N-m) for the as-cast
sample to 7.78e-3 mm³/(N-m) after crystallization.
As can be seen in Appendix A, Cu43Zr43Al7Be7 was one of the highest performing fully
amorphous alloys. In order to try and maximize its wear resistance, it was also given two
400
425
450
475
500
525
550
575
600
0.0E+00
2.0E-04
4.0E-04
6.0E-04
8.0E-04
1.0E-03
1.2E-03
1.4E-03
1.6E-03
As cast 553 K2 hours
553 K4 hours
773 KCrystallized
Vick
ers H
ardn
ess
Dim
ensi
onal
Wea
r Coe
ffic
ient
Wear Coefficient
Hardness

96 annealing treatments as well as crystallized. The glass transition of the alloy was measured to be
718 K, with a crystallization temperature of 798 K. The first heat treatment was set at 693 K,
about 45 K below Tg, for 5 hours. The second treatment was at 713 K for 0.5 hours. The final
sample was crystallized at 863 K for 0.5 hours. XRD was performed on each sample to verify its
state. The first stayed fully amorphous, the second displayed a very small amount of
crystallization, and the third was fully crystalline.
Figure 5-11: Wear loss and hardness data after annealing of Cu43Zr43Al7Be7
Like Zr35Ti30Be27.5Cu7.5,, the Cu43Zr43Al7Be7 alloy experienced significant changes upon
annealing. Figure 5-11 shows k was initially 1.7e-4 mm³/(N-m). After annealing at 593 K for
5 hours, k decreased to 1.5e-4 mm³/(N-m). By heat treating 20 K hotter for half an hour, k was
reduced yet again to 1.4e-4 mm³/(N-m). Compared to the as-cast state, this is an approximate
20% decrease in wear. Meanwhile, hardness increases marginally from 553 HV to 568 HV for
both of the annealed samples. The crystallized sample greatly increased its hardness, up to 670
HV, but actually experienced a net increase in mass.
400
450
500
550
600
650
700
-5.00E-05
0.00E+00
5.00E-05
1.00E-04
1.50E-04
2.00E-04
2.50E-04
As cast 693 K5 hours
713 K0.5 hours
863 KCrystallized
Vick
ers H
ardn
ess
k, D
imen
sion
al W
ear C
oeff
icie
nt Wear Coefficient
Hardness
97
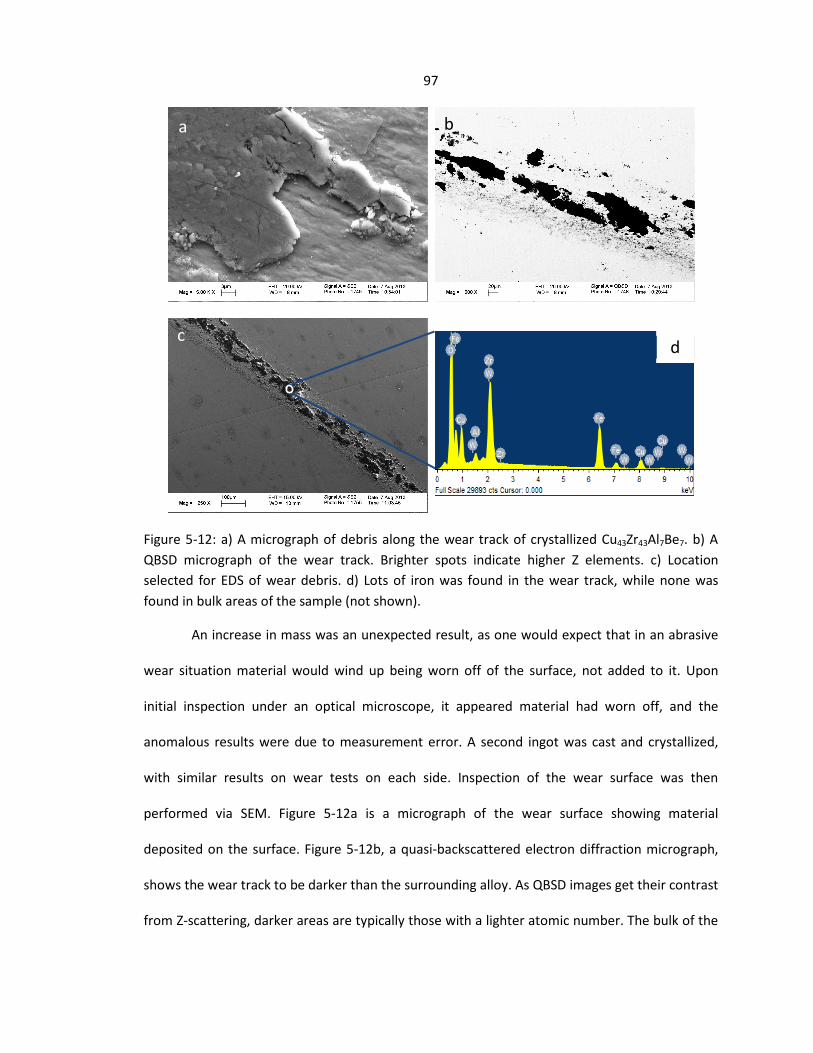
Figure 5-12: a) A micrograph of debris along the wear track of crystallized Cu43Zr43Al7Be7. b) A QBSD micrograph of the wear track. Brighter spots indicate higher Z elements. c) Location selected for EDS of wear debris. d) Lots of iron was found in the wear track, while none was found in bulk areas of the sample (not shown).
An increase in mass was an unexpected result, as one would expect that in an abrasive
wear situation material would wind up being worn off of the surface, not added to it. Upon
initial inspection under an optical microscope, it appeared material had worn off, and the
anomalous results were due to measurement error. A second ingot was cast and crystallized,
with similar results on wear tests on each side. Inspection of the wear surface was then
performed via SEM. Figure 5-12a is a micrograph of the wear surface showing material
deposited on the surface. Figure 5-12b, a quasi-backscattered electron diffraction micrograph,
shows the wear track to be darker than the surrounding alloy. As QBSD images get their contrast
from Z-scattering, darker areas are typically those with a lighter atomic number. The bulk of the
a b
c d

98 alloy is comprised of Zr and Cu (Z of 40 and 29, respectively). The pin used in testing is a stainless
steel variant, so the dominant elements should be Fe, Ni, and Cr (Z of 26, 28, and 24,
respectively). As such, we should expect the brightness of any material originating from the pin
to be much lighter than the alloy. Finally, EDS was performed along the wear track (Figure
5-12d) and off the track (not shown). Along the wear track Fe, Zr, Cu, and Al are all detected. Off
of the wear track only Zr, Cu, and Al are detected (Be content cannot be detected due to the x-
ray window being made out of Be). For this reason, it can be determined that the sample was
minimally worn, but had a significant amount of material transferred to it from the pin.
The problem of material transfer from the pin is one which had been discussed early
during testing, but it was decided to adhere to the ASTM standard. Great accuracy of
measurements could have been achieved by more careful considerations of testing
requirements. One solution would be to replace the relatively soft stainless steel ball bearings
with a harder material, such as tungsten carbide. This exact change has been enacted by ASTM
for the indenter used in Rockwell B hardness tests due to issues with the ball bearing indenter
deforming after repeated loading.36 A harder pin may also ensure a more consistent normal
force applied to the sample during testing. As the pin gets worn down, the surface area in
contact with the same increases, thereby decreasing the actual contact stress. If the pin wears
at different rates against different materials, then each material will have differing contact
stresses as the test evolves.
While many of the crystalline samples were exemplary and outperformed most of the
amorphous alloys, they remained extremely brittle. In being so brittle, they would be able to be
machined into gears without fracturing. However, it could be possible to take advantage of the
high wear resistance of the crystalline phase by first machining out a gear, and then performing

99 a heat treatment to either relax the glass or crystallize it. There is still the possibility of the
toughness of individual gear teeth being too low to function, though. In this case, it may be
possible to do a surface treatment along the lines of induction hardening, carburization, or
nitriding, which are done to traditional gear materials. In the case of BMGs a technique along
the lines of induction hardening of the gear teeth, or perhaps a pulsed laser technique to induce
rapid heating only at the surface would be appropriate. As most wear tracks are only a few
microns deep, only a thin surface layer would be needed to crystallize, while the rest could
retain the tougher amorphous structure. It could be difficult, though, since crystallization is an
exothermic process and the initial crystallization of a surface layer may initiate crystallization
further into the bulk. In this idea for surface treatments, though, BMGs could be seen as a route
to access the beneficial mechanical properties of brittle intermetallics while retaining the
processing and toughness benefits of metallic glasses.
100
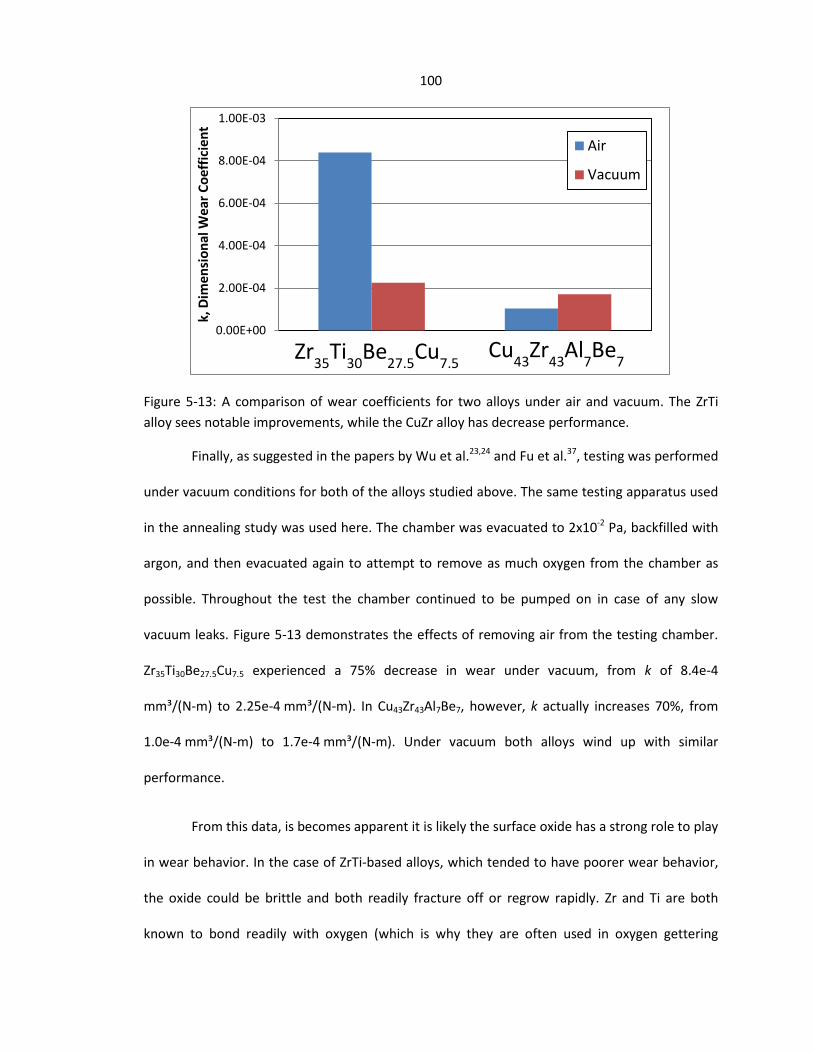
Figure 5-13: A comparison of wear coefficients for two alloys under air and vacuum. The ZrTi alloy sees notable improvements, while the CuZr alloy has decrease performance.
Finally, as suggested in the papers by Wu et al.23,24 and Fu et al.37, testing was performed
under vacuum conditions for both of the alloys studied above. The same testing apparatus used
in the annealing study was used here. The chamber was evacuated to 2x10⁻² Pa, backfilled with
argon, and then evacuated again to attempt to remove as much oxygen from the chamber as
possible. Throughout the test the chamber continued to be pumped on in case of any slow
vacuum leaks. Figure 5-13 demonstrates the effects of removing air from the testing chamber.
Zr35Ti30Be27.5Cu7.5 experienced a 75% decrease in wear under vacuum, from k of 8.4e-4
mm³/(N-m) to 2.25e-4 mm³/(N-m). In Cu43Zr43Al7Be7, however, k actually increases 70%, from
1.0e-4 mm³/(N-m) to 1.7e-4 mm³/(N-m). Under vacuum both alloys wind up with similar
performance.
From this data, is becomes apparent it is likely the surface oxide has a strong role to play
in wear behavior. In the case of ZrTi-based alloys, which tended to have poorer wear behavior,
the oxide could be brittle and both readily fracture off or regrow rapidly. Zr and Ti are both
known to bond readily with oxygen (which is why they are often used in oxygen gettering
0.00E+00
2.00E-04
4.00E-04
6.00E-04
8.00E-04
1.00E-03
k, D
imen
sion
al W
ear C
oeffi
cien
t
Air
Vacuum
Zr35Ti30Be27.5Cu7.5 Cu43Zr43Al7Be7

101 systems). Meanwhile, the CuZr system may have a mechanically desirable oxide layer, as it
provided superior wear protection in the presence of oxygen. Cross-sectional TEM performed by
Wu et al. found multiple oxides present near the wear surface on samples tested in air and
oxygen environments, and only one oxide phase with testing performed in argon.23
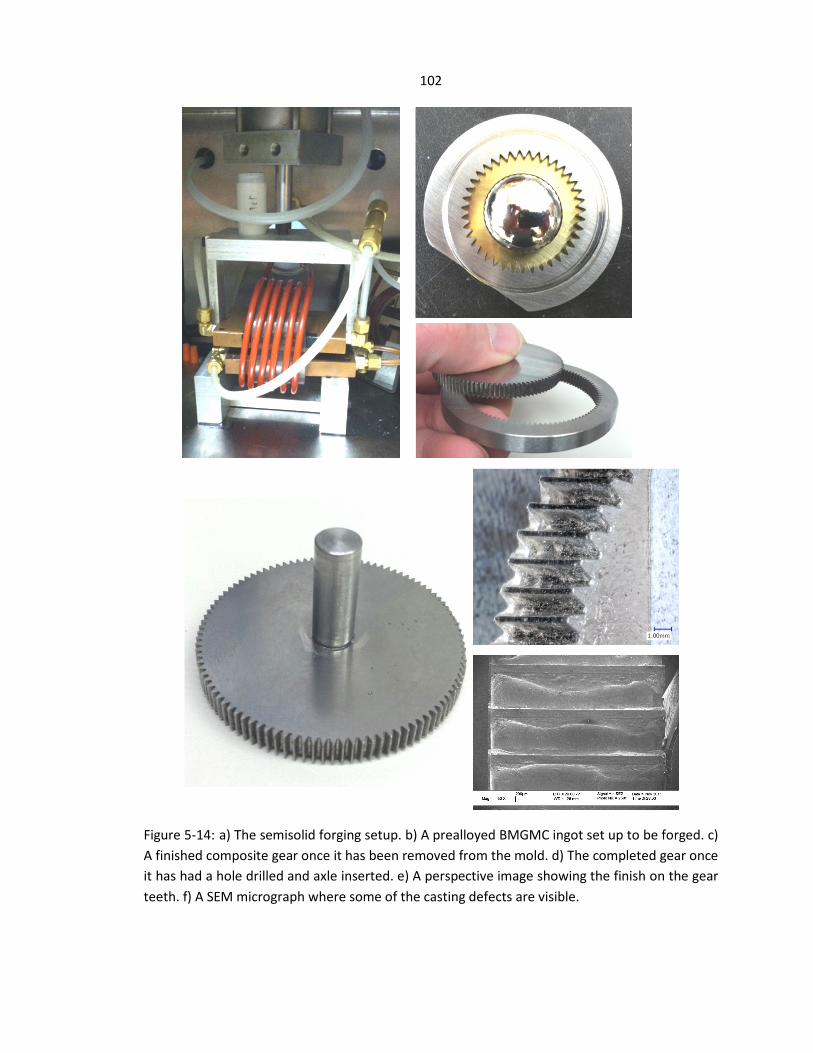
Concurrent to screening alloys, development was also being done on how to fabricate
gears out of both metallic glasses and metallic glass matrix composites. The first technique
attempted was semi-solid forging of BMGMC gears. This technique was chosen as BMGMCs
were known to have high hardness and high toughness, both of which were thought to be
desired for successful gears. The same semi-solid forging technique was used to fabricate these
gears as the egg boxes from previous chapters. In this case, however, the mold was modified
slightly. Two flat water cooled copper face plates were used for the faces, and the gear mold
was just an internal gear purchased from a hobby shop. Ingots of DH1 (Zr36.6Ti31.4Nb7Cu5.9Be19.1)
were heated up to the semi-solid regime and then forged by pneumatic. The gear can then be
removed from the mold with a press. Finally, a hole can be drilled into the center for an axel to
pass through. Parts of the procedure and the finished gear are shown in Figure 5-14. SEM
micrographs of the gear teeth are also shown. Fairly good replication of the tooth surface is
achieved; however, it is far from perfect. There are pores present on the teeth, likely from air
trapped by the molten front flowing into the mold. Two gears were also able to rotate smoothly
when placed against each other.
The second technique used to fabricate gears was to take the coupons created for pin-
on-disk testing. Due to the high hardness of metallic glasses, it would be exceedingly difficult to
102
Figure 5-14: a) The semisolid forging setup. b) A prealloyed BMGMC ingot set up to be forged. c) A finished composite gear once it has been removed from the mold. d) The completed gear once it has had a hole drilled and axle inserted. e) A perspective image showing the finish on the gear teeth. f) A SEM micrograph where some of the casting defects are visible.

103
Figure 5-15: a) The gear mold fully assembled without the cap on top. b) An image a cast gear still in the mold. Upper gate material still connects to the pool it was cast from. c) The bottom of the mold. d) Gear once it has been removed from the mold. e) Left, gear with a keyway machined out. Right, a gear with flashing removed and faces ground to a 16 µm finish.
have them traditionally machined into the desired shape. Instead, they were wire EDMed. This
worked well for tougher alloys (such as ZrTi and CuZr based systems), but all of the Ni
composites fractured during the machining process, as expected, so they were unable to be
made into gears.
The third method used to fabricate gears was suction casting. Figure 5-15a shows three
of the four pieces used in the mold. The two brass sides separate, and there is a steel disk with a
gear shape which has been wire EDMed into it. Finally, a copper cap with a gate goes on top
where the ingot is melted. This design allows for casting a concentric shape (as opposed to if the
gear was oriented vertically, in which case it would fill from the bottom teeth to the top) with no
mold parting lines along the gear teeth. The rest of the figure shows the steps of removing the
a b c
d e
104
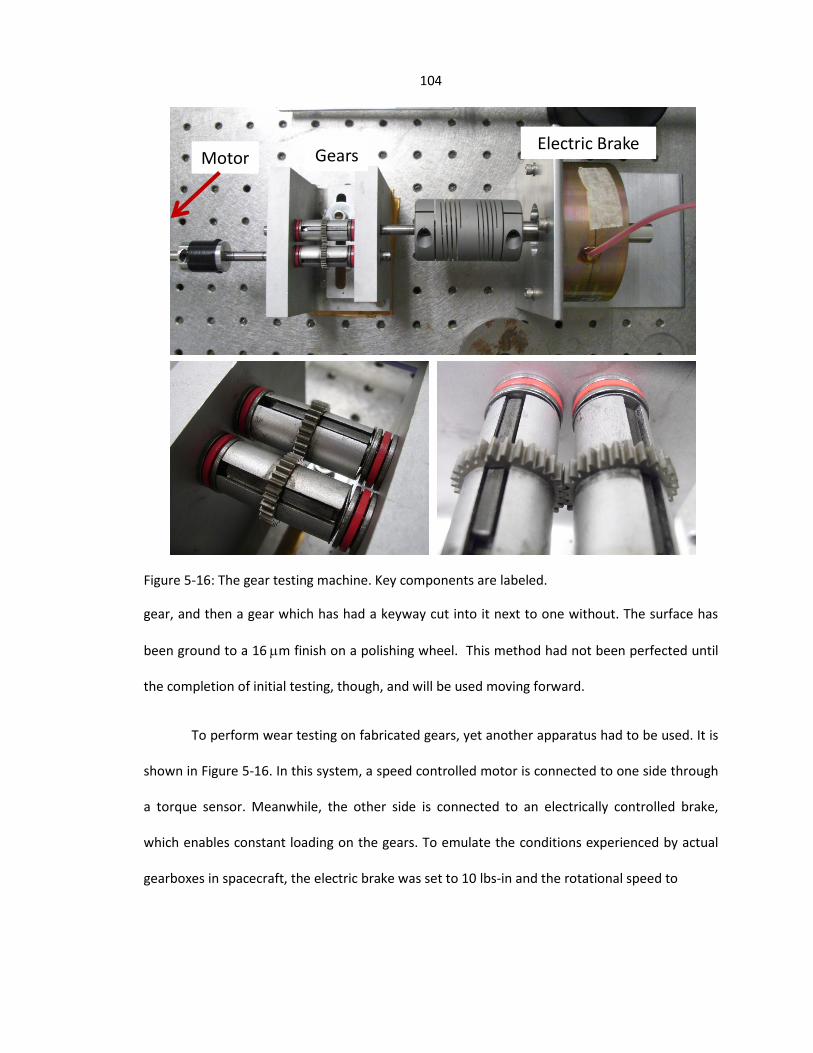
Figure 5-16: The gear testing machine. Key components are labeled.
gear, and then a gear which has had a keyway cut into it next to one without. The surface has
been ground to a 16 µm finish on a polishing wheel. This method had not been perfected until
the completion of initial testing, though, and will be used moving forward.
To perform wear testing on fabricated gears, yet another apparatus had to be used. It is
shown in Figure 5-16. In this system, a speed controlled motor is connected to one side through
a torque sensor. Meanwhile, the other side is connected to an electrically controlled brake,
which enables constant loading on the gears. To emulate the conditions experienced by actual
gearboxes in spacecraft, the electric brake was set to 10 lbs-in and the rotational speed to
Electric Brake Gears Motor

105
Figure 5-17: Wear loss per hour for each of the gear pairs tested.
4100 rpm. Each test began with a brief run-in period to remove any debris from the surface,
and then the gears were run continuously for 3 hours.
Initially, five alloys were machined into gears for testing. The first, Vascomax C300, is
the standard crystalline material currently used. The goal was to improve on its actual wear
behavior. A variant with a Mo-Sr surface coating was also tested. The second, Zr35Ti30Cu8.25Be26.75
(GHDT), is a widely studied glass known for its superior fracture toughness and wide
supercooled liquid region.38 The third, Zr55.3Ti24.9Nb10.8Cu6.2Be2.8 (DH1), is a BMGMC, and was
intended to see how much using a high toughness material would impact the performance of a
gear. Cu47Zr46Al5Y2 was the first of two CuZr alloys tested. It had the least mass loss of any fully
amorphous material during POD testing. Finally, Cu43Zr43Al7Be7 was run, since it had become the
benchmark CuZr alloy.
0
2
4
6
8
10
12
14
Wea
r Los
s [m
m³/
hr]
Driven
Drive

106 In a method similar to the pin-on-disk tests above, each gear was weighed multiple
times both before and after testing. Each gear was tracked separately to see if any trends were
present on wear behavior between the gear attached to the motor (drive) versus the one
attached to the brake (driven). The mass loss was then divided by each alloy’s density to
determine total volume lost. To compensate for the DH1 test having to be stopped only halfway
through due to excessive wear, data is given in wear loss per hour. Figure 5-17 shows the final
results of testing. Wear loss per hour is given for the driven gear in blue (on the left) while the
drive gear is in red (on the right). Average wear loss between the two gears is shown as a solid
black -.
DH1, the BMGMC and toughest glassy alloy tested, performed very poorly. It lost, on
average, 8.6 mm³/hr. It is quite possible this poor performance is due to the dual microstructure
of the composite. It contains a soft, crystalline bcc dendrite which may be preferentially worn.
This hypothesis was unable to be confirmed via SEM due to the smearing of material along the
wear track. GHDT was the next poorest performer, losing 4.7 mm³/hr. GHDT actually has a very
similar composition to DH1’s matrix, so it is not too surprising its performance is similar. The
main difference is that GHDT has a higher hardness at the expense of a lower toughness, and it
instead retains an entirely amorphous microstructure. The two Vascomax alloys both performed
well, but surprisingly the one with a coating had higher wear loss than the one without. The
sample coated with MoSr lost 2.6 mm³/hr versus 1.0 mm³/hr for the uncoated. The coating
seems to have quickly worn off, and then served as abrasive particles to increased abrasive wear
on the gears. For this reason, care needs to be taken to any surface treatment given to a gear. If
the treatment winds up being detrimental to the wear performance, it can greatly accelerate
wear rates even after that layer has been removed. Both of the CuZr alloys performed the best.

107
Figure 5-18: Top, appearance of gears prior to testing. Bottom, effects of wearing on each of the alloys. The arrows on the Vascomax image highlight their wear.
Cu47Zr46Al5Y2 lost 0.63 mm³/hr and Cu43Zr43Al7Be7 lost only 0.44 mm³/hr. This is less than half of
the wear loss of the uncoated Vascomax gears. There does not seem to be a trend between
whether the driven or driving gear wears more extensively.
The difference in wear between alloys is quite drastic when viewed directly. Figure 5-18
shows the difference between a new gear and ones which have undergone a complete wear
test. The unworn gear is Vascomax 300, but all gears had a similar look (as they had all been
DH1
GHDT
Vascomax
Cu47Zr47Al7Be7
Before
108
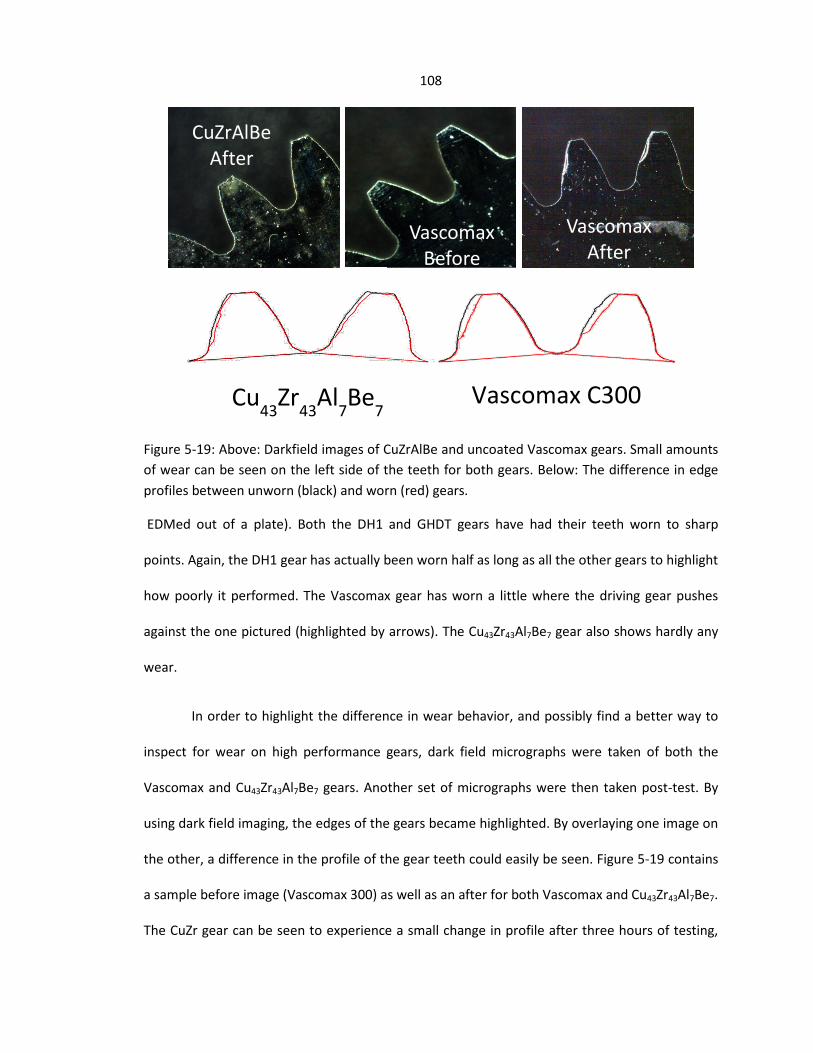
Figure 5-19: Above: Darkfield images of CuZrAlBe and uncoated Vascomax gears. Small amounts of wear can be seen on the left side of the teeth for both gears. Below: The difference in edge profiles between unworn (black) and worn (red) gears.
EDMed out of a plate). Both the DH1 and GHDT gears have had their teeth worn to sharp
points. Again, the DH1 gear has actually been worn half as long as all the other gears to highlight
how poorly it performed. The Vascomax gear has worn a little where the driving gear pushes
against the one pictured (highlighted by arrows). The Cu43Zr43Al7Be7 gear also shows hardly any
wear.
In order to highlight the difference in wear behavior, and possibly find a better way to
inspect for wear on high performance gears, dark field micrographs were taken of both the
Vascomax and Cu43Zr43Al7Be7 gears. Another set of micrographs were then taken post-test. By
using dark field imaging, the edges of the gears became highlighted. By overlaying one image on
the other, a difference in the profile of the gear teeth could easily be seen. Figure 5-19 contains
a sample before image (Vascomax 300) as well as an after for both Vascomax and Cu43Zr43Al7Be7.
The CuZr gear can be seen to experience a small change in profile after three hours of testing,
Vascomax After
CuZrAlBe After
Vascomax Before
Vascomax C300 Cu43Zr43Al7Be7

109 while the Vascomax gear has lost a significant amount on one side of each tooth. By comparison
both GHDT and DH1 experienced wear loss on both sides of every tooth, practically sharpening
them to a point.
This study has encompassed a large variety of tasks. It began with initially attempting to
screen out specific alloy systems which could be cast into fully amorphous 25.4 cm wide by
3 mm tall cylinders via arc melting. After many systems were attempted, success was found in
the CuZr, Ni, and ZrTi systems. A variety of alloys within these systems were then cast and
prepared for pin-on-disk testing. Even though metallic glasses are widely attributed with the
property of “good in wear resistance,” it was found many are anything but. Wear tests created
from commercially available, low quality, material in particular had lower than expected
performance. However, many alloys were able to outperform the current state of the art in
unlubricated, low load, sliding, abrasive wear test.
Little correlation was seen between any single sets of measured physical properties and
wear resistance. Hardness, elastic modulus, bulk modulus, shear modulus, Poisson’s ratio, and
toughness all seemed to be fairly independent of wear behavior. It was possible to modify wear
performance in two alloy systems (CuZr and ZrTi) by both annealing and crystallization. Allowing
the supercooled liquid to relax at different temperatures led to higher amounts of wear
resistance without simultaneously introducing significant hardness changes. Crystallization
dramatically increased the wear resistance of the ZrTi alloy. In the case of the CuZr alloy, it
actually leads to adhesive wear, where material was only removed from the pin and the sample
was left mostly unscathed. Pin-on-disk testing was also performed under vacuum to try and
determine the effect of oxygen on wear behavior. The ZrTi alloy saw a 75% improvement in

110 wear resistance, while the CuZr alloy performed about 75% worse. In terms of absolutes,
though, the CuZr alloy was still superior.
To continue development, gears were fabricated by multiple methods. First, composite
gears were semisolidly forged. Then, gears were EDMed out of suction cast plates. Finally, gears
were able to be directly suction cast with only the wire EDM required for cutting the internal
hole. Pairs of gears were then able to be run against each other for multiple hours, and
measurements were made of total wear loss on gears. Cu43Zr43Al7Be7 had the best performance,
having less than half the volume of material lost compared to Vascomax 300, the current
material used.
The performance increases obtained by BMGs are expected to increase once tests are
performed at cryogenic temperatures. Vascomax is known to become brittle and exhibits large
amounts of wear, but as shown in previous chapters, fully amorphous glasses can retain much of
their room temperature toughness. Other future work can include new processing techniques,
such as linear injection casting, to reduce porosity and flow lines upon casting compared to
suction casting. It would also be advantageous to be able to directly cast gears with keyways in
them, eliminating the requirement to EDM them out, as that may open up the possibility of
using glasses with lower toughness.
The author would like to thank Laura Andersen and Niccolo Valigi for their invaluable
contributions in performing measurements during their internships at the Jet Propulsion
Laboratory.

111 Conclusions While many publications in the literature have claimed numerous relationships between
the wear resistance of metallic glasses and their mechanical properties, it is only through a
thorough study of many alloys under the same testing conditions a claim such as this can be
made. Unfortunately, there is not a universal property which makes metallic glasses perform
better in wear. The only consistently measured value is CuZr’s ability to resist wear across all
sets of mechanical properties. CuZr has shown to exhibit a different oxide structure on the
surface, as samples left out in air for several months begin to tarnish, while no other Zr, ZrTi, Ni,
or Fe-based glasses do. Future studies should focus on identifying what is present on this
surface. Possible methods for doing this are cross-sectional SEM, cross-sectional TEM, XPS
identification of the elemental composition as a function of depth from the surface, XRD
analysis of the wear debris under atmosphere, vacuum, and an oxygen-rich environment.
Further studies must also be performed on the effects of lubrication, as well as cryogenic
temperatures. One substantial mechanical property, to this point, has also been mostly ignored.
Fracture toughness has also been cited as a measure of wear behavior. All of the above factors
will need to be taken into account, as any compounds present on the surface of a wearing gear
will also have their own unique set of mechanical properties.
112 References
(1) Hofmann, D. C.; Suh, J.-Y.; Wiest, A.; Lind, M.-L.; Demetriou, M. D.; Johnson, W. L. Development of tough, low-density titanium-based bulk metallic glass matrix composites with tensile ductility. Proc. Natl. Acad. Sci. U. S. A. 2008, 105, 20136–40.
(2) Demetriou, M. D.; Launey, M. E.; Garrett, G.; Schramm, J. P.; Hofmann, D. C.; Johnson, W. L.; Ritchie, R. O. A damage-tolerant glass. Nat. Mater. 2011, 10, 123–8.
(3) Naka, M.; Hashimoto, K.; Masumoto, T. High Corrosion-Resistance of Chromium-Bearing Amorphous Iron-Alloys in Neutral and Acidic Solutions Containing Chloride. Corrosion 1976, 32, 146–152.
(4) Naka, M.; Hashimoto, K.; Inoue, A.; Masumoto, T. Corrosion-Resistant Amorphous Fe-C Alloys Containing Chromium and/or Molybdenum. J. Non. Cryst. Solids 1979, 31, 347–354.
(5) Schroers, J. Processing of bulk metallic glass. Adv. Mater. 2010, 22, 1566–97.
(6) Boswell, P. Wear-Resistance of a Liquid Quenched Metallic Glass. J. Mater. Sci. 1979, 14, 1505–1507.
(7) Standard Test Method for Wear Testing with a Pin-on-Disk Apparatus 2010.
(8) Galloway, J.; Bhatt; S Evaluating polymer wear and particulation for semiconductors and data storage http://www.gslb.cleanrooms.com/index/display/article-display/0723054128/articles/solid-state-technology/semiconductors/subsystems/2010/11/evaluating-polymer-wear-and-particulation-for-semiconductors-and.html (accessed Nov 10, 2013).
(9) Prakash, B.; Hiratsuka, K. Sliding wear behiavor of some Fe-, Co-, and Ni-based metallic glasses during rubbing against bearing steel. Tribol. Lett. 2000, 8, 153–160.
(10) Li, G.; Wang, Y. Q.; Wang, L. M.; Gao, Y. P.; Zhang, R. J.; Zhan, Z. J.; Sun, L. L.; Zhang, J.; Wang, W. K. Wear behavior of bulk Zr 41 Ti 14 Cu 12.5 Ni 10 Be 22.5 metallic glasses. J. Mater. Res. 2002, 17, 1877–1880.
(11) Tam, R. C. Y.; Shek, C. H. Abrasion resistance of Cu based bulk metallic glasses. J. Non. Cryst. Solids 2004, 347, 268–272.
(12) Parlar, Z.; Bakkal, M.; Shih, A. J. Sliding tribological characteristics of Zr-based bulk metallic glass. Intermetallics 2008, 16, 34–41.
(13) Tao, P. J.; Yang, Y. Z.; Ru, Q. Effect of rotational sliding velocity on surface friction and wear behavior in Zr-based bulk metallic glass. J. Alloys Compd. 2010, 492, L36–L39.
113 (14) Huang, D.; Li, R.; Huang, L.; Ji, V.; Zhang, T. Fretting wear behavior of bulk amorphous
steel. Intermetallics 2011, 19, 1385–1389.
(15) Segu, D. Z.; Choi, J. H.; Yi, S.; Kim, S. S. Dry Sliding Tribological Properties of Fe-Based Bulk Metallic Glass. Tribol. Lett. 2012, 47, 131–138.
(16) Tam, C. Y.; Shek, C. H. Abrasive wear of Cu60Zr30Ti10 bulk metallic glass. Mater. Sci. Eng. A 2004, 384, 138–142.
(17) Maddala, D.; Hebert, R. J. Effect of notch toughness and hardness on sliding wear of Cu50Hf41.5Al8.5 bulk metallic glass. Scr. Mater. 2011, 65, 630–633.
(18) Liu, Y.; Yitian, Z.; Xuekun, L.; Liu, Z. Wear behavior of a Zr-based bulk metallic glass and its composites. J. Alloys Compd. 2010, 503, 138–144.
(19) Chen, B.; Li, Y.; Li, R.; Pang, S.; Cai, Y.; Wang, H.; Zhang, T. Influence of laser surface melting on glass formation and tribological behaviors of Zr55Al10Ni5Cu30 alloy. J. Mater. Res. 2011, 26, 2642–2652.
(20) Liu, G.; An, Y.; Chen, J.; Hou, G.; Chen, J. Influence of Heat Treatment on Microstructure and Sliding Wear of Thermally Sprayed Fe-Based Metallic Glass Coatings. Tribol. Lett. 2012, 46, 131–138.
(21) Choi, H.; Jo, H.; An, K.; Yoon, S.; Lee, C. Tribological behavior of the kinetic sprayed Ni59Ti16Zr20Si2Sn3 bulk metallic glass. J. Alloys Compd. 2007, 434-435, 64–67.
(22) Duan, H.; Wu, Y.; Meng, H.; Wang, J.; Tu, J.; Kou, H.; Li, Y.; Zhang, T.; Li, J. Tribological properties of Zr41.25Ti13.75Ni10Cu12.5Be22.5 bulk metallic glasses under different conditions. J. Alloys Compd. 2012, 528, 74–78.
(23) Wu, H.; Baker, I.; Liu, Y.; Wu, X.; Munroe, P. R. Effects of environment on the sliding tribological behaviors of Zr-based bulk metallic glass. Intermetallics 2012, 25, 115–125.
(24) Wu, H.; Baker, I.; Liu, Y.; Wu, X. Dry sliding tribological behavior of Zr-based bulk metallic glass. Trans. Nonferrous Met. Soc. China 2012, 22, 585–589.
(25) Ishida, M.; Takeda, H.; Nishiyama, N.; Kita, K.; Shimizu, Y.; Saotome, Y.; Inoue, A. Wear resistivity of super-precision microgear made of Ni-based metallic glass. Mater. Sci. Eng. A 2007, 449-451, 149–154.
(26) Kwon, D. H.; Park, E. S.; Huh, M. Y.; Kim, H. J.; Bae, J. C. Wear behavior of Fe-based bulk metallic glass composites. J. Alloys Compd. 2011, 509, S105–S108.
(27) CRC Handbook of Lubrication and Technology, Volume III: Monitoring, Materials, Synthetic Lubricants, and Applications; Booser, E. R., Ed.; 3rd ed.; Taylor & Francis, 1993.
(28) Bhushan, B. Introduction to Tribology; 1st ed.; Wiley, 2002.
114 (29) Zhang, G. Q.; Li, X. J.; Shao, M.; Wang, L. N.; Yang, J. L.; Gao, L. P.; Chen, L. Y.; Liu, C. X.
Wear behavior of a series of Zr-based bulk metallic glasses. Mater. Sci. Eng. A 2008, 475, 124–127.
(30) Oberle, T. L. Properties Influencing Wear of Metals. J. Met. 1951, 3, 438–446.
(31) Leyland, A.; Matthews, A. On the significance of the H/E ratio in wear control: a nanocomposite coating approach to optimised tribological behaviour. Wear 2000, 246, 1–11.
(32) Lind, M.; Duan, G.; Johnson, W. Isoconfigurational Elastic Constants and Liquid Fragility of a Bulk Metallic Glass Forming Alloy. Phys. Rev. Lett. 2006, 97, 015501.
(33) Greer, a. L.; Rutherford, K. L.; Hutchings, I. M. Wear resistance of amorphous alloys and related materials. Int. Mater. Rev. 2002, 47, 87–112.
(34) Archard, J. F.; Hirst, W. The Wear of Metals under Unlubricated Conditions. Proc. R. Soc. A Math. Phys. Eng. Sci. 1956, 236, 397–410.
(35) Garrett, G. Study of the origins of toughness in amorphous metals, California Institute of Technology, 2013, pp. 35–57.
(36) ASTM Standard E18 - 2012, “Standard Test Methods for Rockwell Hardness of Metallic Materials” 2012.
(37) Fu, X.; Kasai, T.; Falk, M. L.; Rigney, D. A. Sliding behavior of metallic glass Part I . Experimental investigations. Wear 2001, 250, 409–419.
(38) Duan, G.; Wiest, A.; Lind, M. L.; Li, J.; Rhim, W.-K.; Johnson, W. L. Bulk Metallic Glass with Benchmark Thermoplastic Processability. Adv. Mater. 2007, 19, 4272–4275.


![Examination on the wear process of polyformaldehyde gears ......standard DIN 3962 [21]. The wear accumulation of gears was measured with an electronic balance with an accuracy of 0.1](https://static.fdocuments.us/doc/165x107/60e2329d1e51ce674c60ab1b/examination-on-the-wear-process-of-polyformaldehyde-gears-standard-din-3962.jpg)