Chapter -5 Role of Research and Development in Indian...
55
105 Chapter -5 Role of Research and Development in Indian Industry An essential component of competitive strategy or behaviour is recognizing the role that Research and Development (R&D) which plays a crucial role in the success of a firm, and acting to ensure that technology decisions and policies contribute to the firm's competitive advantage. This unit provides a framework, which can be used to analyze and understand the linkages between R&D and competitive strategy and / or competitive advantage of a firm. Generally, R&D is of two types viz; product innovation and process innovation. R&D plays a crucial role in the Indian industry. R&D has two roles viz; performance promoting and cost reducing. Performance can be measured by profit and sales of the firm. Theoretically, the objective of the firm is to either maximize profit or sales. In this study, profit margin and sales has been considered as a proxy of performance. R&D can increase sales or profit of the firm in the long run. R&D can decrease also the cost of production of the firm, so that firm can compete with his rivals. This chapter highlights whether firm’s R&D is used as performance promoting expenditure or cost reducing expenditure. Role of R&D in the case of automobile and drugs and pharmaceuticals industry are discussed in the following two sections. 5.1: Role of R&D in Indian Automobile Industry In the automobile industry, innovation of a firm is one of the most important factors to maintain its strong competitive position in the industry. Innovation is also a key to resolving most of the global challenges that the industry faces. Without innovations, the entire concept of individual mobility is put at risk. Innovation may be done in the form of fuel efficiency, emissions, safety and security, seamless connectivity and infotainment,
Transcript of Chapter -5 Role of Research and Development in Indian...

105
Chapter -5
Role of Research and Development in Indian Industry
An essential component of competitive strategy or behaviour is recognizing the
role that Research and Development (R&D) which plays a crucial role in the success of a
firm, and acting to ensure that technology decisions and policies contribute to the firm's
competitive advantage. This unit provides a framework, which can be used to analyze and
understand the linkages between R&D and competitive strategy and / or competitive
advantage of a firm. Generally, R&D is of two types viz; product innovation and process
innovation. R&D plays a crucial role in the Indian industry. R&D has two roles viz;
performance promoting and cost reducing. Performance can be measured by profit and
sales of the firm. Theoretically, the objective of the firm is to either maximize profit or
sales. In this study, profit margin and sales has been considered as a proxy of performance.
R&D can increase sales or profit of the firm in the long run. R&D can decrease also the
cost of production of the firm, so that firm can compete with his rivals. This chapter
highlights whether firm’s R&D is used as performance promoting expenditure or cost
reducing expenditure. Role of R&D in the case of automobile and drugs and
pharmaceuticals industry are discussed in the following two sections.
5.1: Role of R&D in Indian Automobile Industry
In the automobile industry, innovation of a firm is one of the most important
factors to maintain its strong competitive position in the industry. Innovation is also a key
to resolving most of the global challenges that the industry faces. Without innovations, the
entire concept of individual mobility is put at risk. Innovation may be done in the form of
fuel efficiency, emissions, safety and security, seamless connectivity and infotainment,

106
hassle free performance, comfort, flexibility and space within the vehicles – and with more
value for the money. The total cost of ownership will remain the most important buying
factor – a fact that limits the number of successful innovations in the automobile industry.
The continuous cost pressure in the automobile industry created by legislation,
competition, increasing risk and stagnating customer demands has a strong impact on
innovation management. The automobile suppliers will have to significantly improve
efficiency in all R&D processes to keep costs under control and keep the performance to
improve. Furthermore, the effectiveness of each innovation must be investigated. This will
be accompanied by structural changes in the industry’s R&D departments. The
concentration process in the supplier industry will improve innovative strength by the way
of cutting costs while increasing the quality of innovations. After a good year 2009-10
during which economies across the world showed signs of recovery, the economic
conditions globally continued to be strong and positive in 2010-11, resulting in a strong
growth for the automotive sector. The Indian economy continued to do glowing, driven by
a good performance from the agricultural and the industrial sector with a GDP growth of
8.6 per cent. The automobile sector recorded a high growth of over 26 per cent in India on
the back of a robust economy3. As the study is on the firm level, it is important to know
about the R&D expenditure and pattern in case of some of the leading firms as these are
mainly concerned with different types of R&D viz; product innovation, process innovation
or both product and process innovation are discussed in the following.
Ashok Leyland Ltd. Company has developed new Engine (N-Series) platform and
applied on vehicles, existing engine platform (H-series) upgraded to BS IV emission
norms. In the case of vehicles, new vehicle platform (‘U Truck’) launched, with initial
3 Annual report of Tata motors 2010 -11

107
offerings in tippers and tractors. Migration of current vehicle is a platform to BS3 / BS4
norms. Benefits derived as a result of R&D are compliance with emission standards slated
for implementation from April 2010. Potential for extension of the engine is a platform to
cover compressed natural gas (CNG), marine & industrial applications. Introduction of
New Lean Development Process with resultant benefit of reduced time to market. Total
R&D Expenditure as a per cent of total turnover is 2.97 per cent.4
During 2009, Eicher Motors Ltd. has emphasized on product innovation. Apart
from these four wheeler vehicles, Eicher Motors Ltd. launched “Classic bike” in the two
categories of 350 cc and 500 cc. The “Classic bikes” are powered by a single cylinder 500
cc Unit Construction Engine (UCE) supported by Electronic Fuel Injection (EFI). The
UCE has an integrated assembly for the engine, gear box, clutch and this reduces the
friction between movable parts, resulting in lower transmission losses. The company have
taken a policy to change the engine from the year 2010. UCE engine will replace the
present “Cast Iron” engines in Electra and standard bikes as well to meet the Indian
emission norms of BS-II (Euro III) effective from the month April 2010. The company
have focussed on R&D activities with the development of new products and variants
thereof apart from improving the existing products and value engineering projects. An
amount of Rs. 6.4 million was occurred on capital account and Rs. 77.7 million on
revenue account in R&D.5
In the case of Force Motors Ltd., the expenditure on research and development for
new products, including the expenditure on Projects and Tool Engineering was 2.92 per
4 Annual Report of Ashok Leyland 2010 -11.
5 Annual Report of Eicher Motors 2010 -11.

108
cent of the operational turnover of the company. The company has put more emphasis on
research and development and tool engineering activities.6
In the case of Hero Cycles Ltd., increasing competition in the market has brought
into sharp focus importance of differentiation. Their Research & Development Centre
recognised by Govt. of India as an in house R&D Centre is instrumental in providing
company a competitive edge by bringing out new products / models and improved
components to meet consumers' aspirations and thus helping the company to achieve its
targeted growth. The state of art R&D Software like three dimensional modelling and
software are extensively used. During the year 2006, company has launched 16 new
models and set of new product for export market. This brought the concept of high quality
with low cost bicycles through internal R&D. The market for fancy cycles has shown a
significant growth since last few years. Total R&D expenditure as a percentage of sales
was 0.03 per cent in 2006. The company is upgrading technology absorption and
innovation to enhance its market share both in domestic and export. The company has not
imported any technology in the last five years. However, it has entered into a technical
assistance agreement with National Bicycle Industrial Co. Ltd. of Osaka, Japan in 2002 for
upgrading its technology7.
Hero Honda Motors Ltd. (HHML), established in 1984, is a joint venture between
Hero Group, the world’s largest bicycle manufacturers and the Honda Motor Company of
Japan. It is the world’s largest two-wheeler manufacturer. During the year 2004, HHML
renewed its technical collaboration with Honda Motor Corporation of Japan for another
ten years up to year 2014. This will give HHML access to Honda’s technology for another
6 Annual Report of Force Motors 2009-10.
7 Annual Report of Hero Cycles Ltd. 2009-10

109
ten years for developing new products. HHML plans to launch two motorcycles in FY05
and a scooter with the technology provided by Honda. Increasing competition, price
undercutting, rising steel prices and other input costs continue to pose a threat. Reduction
in import duties for imports could also pose a threat for the higher end bikes. The company
is planning to further increase its capacity to meet the growing demand for motorcycles. It
is considering setting up a third plant for its products8. Though unfortunately in 2011,
these two companies are separated and produced their product separately.
Mahindra & Mahindra Ltd. has a market share of 10.01 per cent for Commercial
Vehicles, 6.5 per cent for Passenger Vehicles and 1.31 per cent three wheelers. Mahindra
& Mahindra is mainly engaged with the production of Multi Utility Vehicle and Three
Wheeler segments directly. The company competes in the Light Commercial Vehicle
(LCV) segment through its joint venture subsidiary Mahindra Navistar Automotives
Limited and in the passenger car segment through another joint venture subsidiary
Mahindra Renault. In the year 2009, on the domestic sales front, the company along with
its subsidiaries sold a total of 2,20,213 vehicles (including 44,533 three wheelers, 8,603
Light Commercial Vehicles through Mahindra Navistar Automotives and 13,423 cars
through Mahindra Renault), recording a growth of 0.6 per cent over the previous year. The
company’s domestic Multi Utility Vehicle sales volumes increased by 3.3 per cent, as
against a decline of 7.4 per cent for industry Multi Utility Vehicle sales. Hence, Mahindra
& Mahindra has further strengthened its domination of the domestic Multi Utility Vehicle
sub-segment during the year, increasing its market share to 57.2 per cent over the previous
year’s market share of 51.3 per cent. Mahindra & Mahindra has expanded its business in
the overseas market also. In 2009, another model Xylo was launched in South Africa. The
8 Annual Report Hero Honda Motors Ltd. 2004.

110
company formed a new joint venture with Mahindra Automotive Australia Pvt. Ltd., to
meet the demand in the Australian Market9.
Maruti Suzuki will be coming up with the country’s first dual-fuel engine,
running on petrol and CNG, which will make the fuel cost very less drastically. Maruti
Suzuki are developing an engine that will use multi-point fuel injection (MPFI)
technology in CNG model – just as it does in petrol mode by which it will be eliminating
loss of power and efficiency associated with current retro-fitted CNG engines. With this
new engine Maruti Suzuki will bring a marked change in the way CNG-fuelled cars run on
MPFI technology that revolutionised petrol car driving at the beginning of this century.
For the customers, it provides very less burden on their wallet for fuel. And with this
technology taking shape, may be even other car manufacturers also following the same
route10.
In the case of TVS Motor Co. Ltd., the company's strong R&D team is supported
by modern computer aided laboratory, capable of developing new and innovative
products. It has state-of-art facilities for engine testing, noise, vibration and harshness
(NVH) measurements and life testing. At present, more than six hundred engineers are
working for the development of new products and in other advanced areas of technology.
The company works with leading technological research laboratories and institutions. The
company is also working on fuel-efficient technologies and carbon-di-oxide (CO2)
reduction technologies to remain ahead of needs of consumers and environment
regulations. R&D has developed and launched a new 110cc 4 stroke non-geared scooter
9 Annual Report of Mahindra and Mahindrra 2010.
10 By Mridula Maity, Product Development Manager, Rugel 10 01 2009

111
with disc brake system for export market. R&D has developed and launched a new 150cc
4 stroke liquid cooled engine for Indonesian Market. R&D has also developed and
launched another 180cc 4 stroke motorcycle with Anti-Lock Brake System (ABS)
technology. R&D team has so far published 72 technical papers in national and
international conferences11 .
In the case of Tata Motors Ltd., the company strives to be at the forefront of
innovation and works to launch so many new products aimed at the emerging needs of its
customers. It continues to develop and build on its in-house capabilities and works with
the right partners to ensure that it has competitive product offerings. Some of the
company’s key products and initiatives for the year include: showcased the Tata Pixel - a
concept for a future city car at the Geneva Motor Show; launched the Aria - a premium
crossover with high-end features such as 4x4, Torque on Demand, ESP, six air bags;
launched the BS-IV compliant variants of the Indica, Indigo CS, Indica eV2 and Indigo
eCS with segment leading fuel efficiencies. These vehicles are powered by the company’s
1.4L CRAIL engine; launched Elan - a high end variant of the Indigo Manza sedan. Ace
Zip and Magic Iris were test marketed in various parts of the country and are expected to
be formally launched across the country in May this year. This completes the Ace family
offerings now spanning from the Ace Zip and Magic Iris at the lower end and the Super
Ace and Venture on the higher end and launched the Venture - a Multi Purpose Vehicle
(MPV) on the Ace platform. The Prima range launched in the previous year was
expanded with the introduction of the Prima Cons truck range of tippers in the market.
Some Prima trucks launched in Korea and some of the tippers are soon expected to be
launched in the international markets. Jaguar Land Rover launched the all new Jaguar XJ, 11
Annual report 2010-11 of TVS motors ltd.

112
the new 4.4 V8 diesel Range Rover and the new 2.2 diesel Land Rover –Freelander.
Jaguar's Advanced Design Team and the Jaguar Land Rover Technical Innovation Team
created a concept car for the Paris Motor Show to celebrate 75 years of Jaguar Design and
Innovation. The resultant - a stunning Jaguar C-X75, is a radical combination of hyper-
car, eco-friendliness and 21st century’s technology, which won 'Car of the Show'
capturing the imagination of millions. Jaguar Land Rover recently announced their
partnership with Williams F1 to bring a version of this concept to the market in 2013. Tata
Hispano Motors Caracara, South Africa, Spain introduced 4 new brand models of its
buses, viz. Area - an urban bus, 2 hybrid urban buses and Naya - a new deluxe coach.
This along with the Xerus and Intea models launched last year would expand its product
range in high end buses / coaches. As a responsible automotive manufacturer, the Tata
Motors Group continues to develop vehicles and technologies to reduce its carbon
footprint. Some of the significant initiatives / achievements are: Showcased its CNG
parallel Hybrid low-floor city buses in the Commonwealth Games in Delhi. Tata Indica
Vista EVX developed by engineers at our European subsidiary - Tata Motors European
Technical Centre, Plc, bagged ‘the Most Economic Small Passenger EV’ and ‘the Most
Economical and Environment Friendly Small Passenger EV’ under the Small Passenger
EV category at the inaugural Royal Automobile Club, Brighton to London Future Car
Challenge. Tata motor migrated for meeting the BS-IV emission norms by developing BS-
IV compliant range of vehicles, in particular, Indica eV2 and Indigo eCS with 1.4L
CRAIL engines with segment leading fuel efficiencies. Jaguar and Land Rover continue to
invest heavily in environmental innovation to support delivery of the 2012 European
Union requirement for reduction in CO2. In 2010-11 Tata Motors launches new model
including the all new Jaguar XJ, the new 4.4 V8 Diesel Range Rover and the new 2.2
113
Diesel Land Rover - Freelander realised improvements in CO2 performance in excess of
ten per cent. The Jaguar XF and Range Rover Evoque has been launched in the second
quarter of 2011. The Jaguar XF 2.2 Diesel 817 speed automatic transmission variant with
Stop / Start technology reduces the entry model while the Evoque features a number of
lightweight, vehicle efficiency and Power train technologies that make this the most fuel
efficient Range Rover ever. Jaguar Land Rover is working on introducing a new Premium
Light weight Architecture for its products. This has seen a host of environment friendly
technologies including new aluminium alloys, down-sized power trains, Eco HMI,
sustainable materials, best-CO2 navigation routes, electronic power steering, aerodynamic
features and many more technologies. These technologies enable the delivery of class
leading 'Luxury' and 'Performance' combined with low CO2 and lay the foundation for
efficient hybridization of the platform. Jaguar Land Rover's initial Full-Hybrid programme
is also in advanced stages. In 2010-11, some of the Plug-In Hybrid projects of Jaguar Land
Rover were completed and have provided the technical foundation for a production
development programme for Parallel Plug-in Hybrids. In addition, Jaguar Land Rover has
made significant progress on a number of ongoing collaborative research and development
programmes investigating a wide range of CO2 reduction technologies. These include
radical combustion engine downsizing/pressure charging, alternative power sources for
Series Hybrids, Flywheel KERS and waste energy recovery systems. Tata Hispano Motors
Carrocera SA, Spain, won a prestigious order for supplying ten CNG Series Hybrid low-
floor city buses, to be built on the company’s chassis, to EMT Madrid, a Madrid city
public transportation company12.
12
Annual report of Tata Motors 2010-11
114
Therefore it is observed that both product and process innovation continues in the
automobile industry. The role of R&D is whether cost reducing or performance promoting
in the case of automobile industry can be discussed according to the scale wise in the
following sections. Role of R&D in case of cost margin and in the case of performance
promoting role is discussed sequentially in the case of large scale, medium scale and small
scale firms respectively in the following sub-sections 5.1.1, 5.1.2 and 5.1.3.
5.1.1: Role of R&D of Large Scale firms in the Indian Automobile Industry
As the large scale firms are the leading firms, so it is important to know the role of
R&D in case of cost margin as well as profit margin. These two roles of research and
development of the large scale automobile firms are analysed in the following.
Cost reducing role of R&D of large scale firms in Automobile Industry
To analyse the cost reducing role a specification of cost margin (CM) have been
considered which is already mentioned for all types and all scale of firms in equation (4)
under the methodology section of Chapter 3. The result for this specification is given in
the following Table 5.1. Table 5.1 consists with a set of five sub tables (Table 5.1a, Table
5.1b, Table 5.1c, Table 5.1d and Table 5.1e).

115
Table 5.1: Role of R&D on Cost Margin for Large Scale Automobile Firms
Table 5.1a: Test Statistic of Hausman and Lagrange Multiplier test of the Regression on
Cost Margin for Large Scale Automobile Firms
Random Effects Model: v(it) = e(it) + u(i)
Estimates: Var[e] = .379568D-02
Var[u] = .396648D-02 Corr[v(it),v(is)] = .511002
Lagrange Multiplier Test vs. Model (3) = 325.21 ( 1 df, prob value = .000000) (High values of LM favor FEM/REM over CR model.)
Fixed vs. Random Effects (Hausman) = 5.00 ( 2 df, prob value = .081979) (High (low) values of H favor FEM (REM).)
Reestimated using GLS coefficients:
Estimates: Var[e] = .380027D-02
Var[u] = .611608D-02 Sum of Squares .152344D+01
Source: Calculated from the CMIE data sources for the period 1991 – 2008.
Table 5.1a reveals that high value (325.21) of Lagrange Multiplier (LM) indicates
the model specification satisfies either fixed effect model or random effect model. The
decision of fixed effect model or random effect model depends on the value of Hausman
test statistic. It is observed that Hausman statistic is significant at eight percent level of
significance which implies finally the model specification supports the fixed effect model
with group dummy variable (LSDV). The measurement of goodness of fit ie; R-squared is
high (.65) and Adjusted R-squared is (.63) and from the F test it is observed that the entire
regression is meaningful (Table 5.1b).

116
Table 5.1b: ANOVA of the Regression on Cost Margin for Large Scale Automobile Firms
Least Squares with Group Dummy Variables
Ordinary least squares regression Weighting variable = none
Dep. var. = CMit Mean= .8056556931 , S.D.= .1019085690
Model size: Observations = 187, Parameters = 13, Deg.Fr.= 174
Residuals: Sum of squares= .6604483363 , Std.Dev.= .06161
Fit: R-squared= .658096, Adjusted R-squared = .63452
Model test: F[ 12, 174] = 27.91, Prob value = .00000
Diagnostic: Log-L = 262.5543, Restricted(b=0) Log-L = 162.2079
LogAmemiyaPrCrt.= -5.507, Akaike Info. Crt.= -2.669
Estd. Autocorrelation of e(i,t) .332858
Source: Calculated from the CMIE data sources for the period 1991 – 2008.
Table 5.1c: Estimated coefficients of the Regression on Cost Margin for Large Scale
Automobile Firms
Variable Coefficient Standard Error t-ratio P[|T|>t]
RDSi t-1 2.923073763 .35566762 8.219 .0000
GFASit-1 .7329248893E-01 .40468457E-01 1.811 .0717
Source: Calculated from the CMIE data sources for the period 1991 – 2008.
117
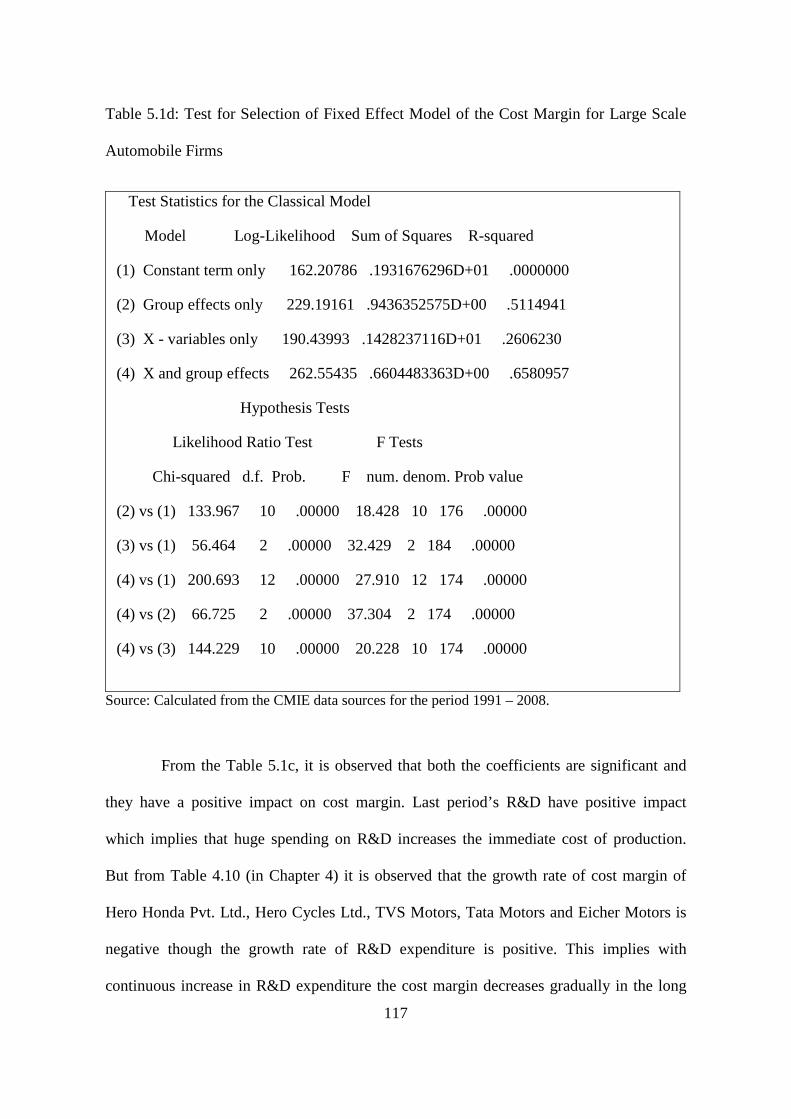
Table 5.1d: Test for Selection of Fixed Effect Model of the Cost Margin for Large Scale
Automobile Firms
Test Statistics for the Classical Model
Model Log-Likelihood Sum of Squares R-squared
(1) Constant term only 162.20786 .1931676296D+01 .0000000
(2) Group effects only 229.19161 .9436352575D+00 .5114941
(3) X - variables only 190.43993 .1428237116D+01 .2606230
(4) X and group effects 262.55435 .6604483363D+00 .6580957
Hypothesis Tests
Likelihood Ratio Test F Tests
Chi-squared d.f. Prob. F num. denom. Prob value
(2) vs (1) 133.967 10 .00000 18.428 10 176 .00000
(3) vs (1) 56.464 2 .00000 32.429 2 184 .00000
(4) vs (1) 200.693 12 .00000 27.910 12 174 .00000
(4) vs (2) 66.725 2 .00000 37.304 2 174 .00000
(4) vs (3) 144.229 10 .00000 20.228 10 174 .00000
Source: Calculated from the CMIE data sources for the period 1991 – 2008.
From the Table 5.1c, it is observed that both the coefficients are significant and
they have a positive impact on cost margin. Last period’s R&D have positive impact
which implies that huge spending on R&D increases the immediate cost of production.
But from Table 4.10 (in Chapter 4) it is observed that the growth rate of cost margin of
Hero Honda Pvt. Ltd., Hero Cycles Ltd., TVS Motors, Tata Motors and Eicher Motors is
negative though the growth rate of R&D expenditure is positive. This implies with
continuous increase in R&D expenditure the cost margin decreases gradually in the long

118
run that indicates R&D has a cost reducing role in the industry. From the Table 5.1d, it is
observed that the fixed effect model satisfies either group effects or both explanatory
variables with group effects (as the R-square and F test is very high). These fixed effects
are given below in following Table 5.1e.
Table 5.1e: Estimated Fixed Effects of cost margin of large scale automobile firms
Company name Coefficient Standard Error t-ratio
Ashok Leyland Ltd. .73438 .02613 28.10044
Eicher Motors Ltd. .79451 .01826 43.50074
Force Motors Ltd. .65438 .03013 21.71790
Hero Cycles Ltd. .84337 .01831 46.05878
Hero Honda Motors Ltd. .82276 .01786 46.05929
Hindustan Aeronautics Ltd. .81233 .03469 23.41494
Hindustan Motors Ltd. .65688 .02890 22.72724
Mahindra & Mahindra Ltd. .70277 .02188 32.11972
Maruti Suzuki India Ltd. .65664 .02033 32.29308
TVS Motor Co. Ltd. .80091 .02066 38.76782
Tata Motors Ltd. .71237 .02573 27.68788
Source: Calculated from the CMIE data sources for the period 1991 – 2008.
From the fixed effect results of large scale firms only Force Motors, Maruti
Suzuki and Hindustan Motors are showing lower cost margin compared to other
automobile firms. Fixed effect of all large scale firms are positive and highly significant
(Table 5.1e).

119
Performance promoting role of R&D of Large scale firms in Automobile Industry
To analyse the performance promoting role a specification of profit margin (PM)
have been considered which is already mentioned for all types and all scale of firms in
equation (5) under the methodology section of Chapter 3. Profit margin (PM) is
considered as a performance indicator. The result for this specification is given in the
following Table 5.2. Table 5.2 consists with a set of two sub tables (Table 5.2a and Table
5.2b).
Table 5.2: Role of R&D on Profit Margin for Large Scale Automobile Firms
Table 5.2a: Test Statistic of Hausman and Lagrange Multiplier test of the Regression on
Profit Margin for Large Scale Automobile Firms
Random Effects Model: v(it) = e(it) + u(i)
Estimates: Var[e] = .760162D-03
Var[u] = .732226D-03
Corr[v(it),v(is)] = .490641
Lagrange Multiplier Test vs. Model (3) = 305.74 (1 df, prob value = .000000) (High values of LM favor FEM/REM over CR model.)
Fixed vs. Random Effects (Hausman) = 3.73 (2 df, prob value = .154660) (High (low) values of H favor FEM (REM).)
Reestimated using GLS coefficients:
Estimates: Var[e] = .761350D-03
Var[u] = .113435D-02 Sum of Squares .292837D+00
Source: Calculated from the CMIE data sources for the period 1991 – 2008.

120
Table 5.2a reveals that high value (305.74) of Lagrange Multiplier (LM) indicates
the model specification satisfies either fixed effect model or random effect model. The
decision of fixed effect model or random effect model depends on the value of Hausman
test statistic. It is observed that Hausman statistic is not significant which implies the
model satisfies random effect model.
Table 5.2b: Estimated coefficients of the Regression on profit Margin for Large Scale
Automobile Firms
Variable Coefficient Standard Error b/St.Er. P[|Z|>z]
RDSit-1 .7743865555 .15802541 4.900 .0000
GFASTit-1 -.1095354775 .17093333E-01 -6.408 .0000
Constant .8289858E-01 .11318783E-01 7.324 .0000
Source: Calculated from the CMIE data sources for the period 1991 – 2008.
From the Table 5.2b it is observed that all coefficients are significant at less than
one percent level of significance. Last period’s R&D has a positive impact on current
period’s profit margin that is R&D has a positive role on firm’s performance whereas
GFAS has a negative impact on profit margin. From the growth rate of gross fixed asset, it
is observed that all the large scale firms are maintaining very high growth rate (Table 4.10
in Chapter 4). Theoretically, large scale firms are interested to maintain long run
performance and for that they are going not only for purchasing machinery but also
increasing plant size or purchasing land or buildings. So immediate impact of gross fixed
asset on profit are negative for large scale firms as per their motive of capturing more
market share in the long run. So the impact of GFA on profit is theoretically justified.

121
Both growth rate of R&D and profit are high for large scale firms (Table 4.10 in
Chapter 4). High growth rate of the two variables indicate that R&D increases over time
and side by side firms are maintaining a positive profit margin over time. The rate of
growth of R&D is higher that growth rate of profit margin. From the regression analysis it
is also observed that if R&D of the last period increases by Rs.100 then profit margin
increases by Rs. 77.
5.1.2: Role of R&D of the Medium Scale Indian Automobile Industry
In the case of medium scale automobile firms, the cost reducing role of R&D and
performance promoting role of R&D is discussed sequentially in the following.
Cost reducing role of Medium scale firms in the Automobile Industry
To examine cost reducing role, same specification of cost margin (CM) have been
considered like large scale firms and analysed on the basis of findings in the given Table
5.3. Table 5.3 consists with a set of three sub tables (Table 5.3a, Table 5.3b, and Table
5.3c).

122
Table 5.3: Role of R&D on Cost Margin for Medium Scale Automobile Firms
Table 5.3a: Test Statistic of Hausman and Lagrange Multiplier test of the Regression on
Cost Margin for Medium Scale Automobile Firms
Random Effects Model: v(it) = e(it) + u(i)
Estimates: Var[e] = .303745D-01
Var[u] = .243631D-02
Corr[v(it),v(is)] = .074253
Lagrange Multiplier Test vs. Model (3) = 1.77 ( 1 df, prob value = .183360) (High values of LM favor FEM/REM over CR model.)
Fixed vs. Random Effects (Hausman) = 4.07 ( 2 df, prob value = .130606) (High (low) values of H favor FEM (REM).)
Reestimated using GLS coefficients:
Estimates: Var[e] = .306157D-01
Var[u] = .508130D-02 Sum of Squares .380012D+01
Source: Calculated from the CMIE data sources for the period 1991 – 2008.
From the above Table 5.3a, it is found statistically (as LM test is insignificant)
that this model specification supports the pooling regression analysis.

123
Table 5.3b: ANOVA of the Regression on Cost Margin for Medium Scale Automobile Firms
OLS Without Group Dummy Variables
Ordinary least squares regression Weighting variable = none
Dep. var. = CMit Mean= .8910113703 , S.D.= .1800842537
Model size: Observations = 118, Parameters = 3, Deg.Fr.= 115
Residuals: Sum of squares= 3.773240314 , Std.Dev.= .18114
Fit: R-squared= .005563, Adjusted R-squared = .01173
Model test: F[ 2, 115] = .32, Prob value = .72558
Diagnostic: Log-L = 35.6875, Restricted(b=0) Log-L = 35.3584
LogAmemiyaPrCrt. = -3.392, Akaike Info. Crt.= -.554
Panel Data Analysis of CM [ONE way]
Unconditional ANOVA (No regressors)
Source Variation Deg. Free. Mean Square
Between .332229 6. .553715E-01
Residual 3.46212 111. .311903E-01
Total 3.79435 117. .324303E-01
Source: Calculated from the CMIE data sources for the period 1991 – 2008.
Table 5.3c: Estimated coefficients of the Regression on Cost Margin for Medium Scale
Automobile Firms
Variable Coefficient Standard Error t-ratio P[|T|>t]
RDSi t-1 .7378536222 1.7429993 .423 .6728
GFASit-1 .2381885228E-01 .35488130E-01 .671 .5035
Constant .8737292716 .27552333E-01 31.712 .0000
Source: Calculated from the CMIE data sources for the period 1991 – 2008.
124
The above results suggests the model is fixed effect without group dummy i.e.
OLS. For the medium scale firms the entire regression equation is meaningless. The
coefficients are all insignificant except the significant constant term. In the case of cost
reducing role of R&D, for the medium scale firms, the result is found to be insignificant as
the growth rate of R&D is very low and insignificant. In the medium scale firms, only the
growth of R&D is high in three firms say, Kinetic Motors (0.30) Swaraj Mazda (0.27) and
Scooters India Ltd (0.12) whereas the growth of cost margin for these three industries is
very low (Table 4.12). For Swaraj Mazda and Scooters India, the growth rate of cost
margin is negative whereas for Kinetic Motors, the growth rate of cost margin is very low
(0.02) but positive. Therefore, only these three firms out of the total medium scale are
getting cost benefit.
Performance promoting role of R&D of Medium scale firms in Automobile Industry
The same equation has been considered for examining the performance promoting
role of R&D as large scale firms. The results are given in the following Table 5.4 which is
set of three Sub-tables (Table 5.4a, Table 5.4b and Table 5.4c).
Table 5.4a shows that LM test is statistical insignificant so the model specification
satisfies pooling regression without group dummy variables. From the Table 5.4b and
5.4c, it is observed that the regression equation is meaningful though R&D has an
insignificant relationship with profit margin. The coefficient of GFAS of the last period
has a significant impact on profit margin. From the growth rate of gross fixed asset (Table
4.12), for the medium scale firms the result is negatively significant in the case of
performance. This is because if the GFA of the last period increases and if they increase
plant size, then they have to bear the extra cost of production which ultimately makes loss.

125
As a result their performance decreases which is also empirically supported by the past
literature. Strickland and Weiss (1976) have observed the negative impact.
Table 5.4: Role of R&D on Profit Margin for Medium Scale Automobile Firms
Table 5.4a: Test Statistic of Hausman and Lagrange Multiplier test of the Regression on
Profit Margin for Medium Scale Automobile Firms
Random Effects Model: v(it) = e(it) + u(i)
Estimates: Var[e] = .435777D+00
Var[u] = .220178D-01 Corr [v(it),v(is)] = .048095
Lagrange Multiplier Test vs. Model (3) = .03 (1 df, prob value = .863941) (High values of LM favor FEM/REM over CR model.)
Fixed vs. Random Effects (Hausman) = 4.93 (2 df, prob value = .084958) (High (low) values of H favor FEM (REM).)
Reestimated using GLS coefficients:
Estimates: Var[e] = .445046D+00
Var[u] = .390018D-01 Sum of Squares .529149D+02
Source: Calculated from the CMIE data sources for the period 1991 – 2008.

126
Table 5.4b: ANOVA of the Regression of Profit Margin for Medium Scale Automobile Firms
OLS Without Group Dummy Variables
Ordinary least squares regression Weighting variable = none
Dep. var. = PM it Mean= -.8112575389E-01, S.D.= .6922310975
Model size: Observations = 118, Parameters = 3, Deg.Fr.= 115
Residuals: Sum of squares= 52.64637328 , Std.Dev.= .67661, R-squared= .060968, Adjusted R-squared = .04464 Model test: F[ 2, 115] = 3.73, Prob value = .02686
Diagnostic: Log-L = -119.8166, Restricted(b=0) Log-L = -123.5280
LogAmemiyaPrCrt.= -.756, Akaike Info. Crt.= 2.082
Panel Data Analysis of PM [ONE way]
Unconditional ANOVA (No regressors)
Source Variation Deg. Free. Mean Square
Between 2.58507 6. .430845
Residual 53.4794 111. .481797
Total 56.0645 117. .479184
Source: Calculated from the CMIE data sources for the period 1991 – 2008.
Table 5.4c: Estimated coefficients of the Regression on Profit Margin for Medium Scale
Automobile Firms
Variable Coefficient Standard Error t-ratio P[|T|>t]
RDSi t-1 -1.830701248 6.5106477 -.281 .7791
GFASit-1 -.3593216693 .13255927 -2.711 .0077
Constant .1349466672 .10291659 1.311 .1924
Source: Calculated from the CMIE data sources for the period 1991 – 2008.
5.1.3: Role of R&D of the Small Scale Indian Automobile Industry
In the case of small scale automobile firms, the cost reducing role of R&D and
performance promoting role of R&D is discussed sequentially in the following.

127
Cost reducing role of Small scale firms in the Automobile Industry
To examine the cost reducing role, a same type of specification of cost margin
(CM) have been considered like large scale and medium scale firms and analysed on the
basis of findings in the given Table 5.5. Table 5.5 consists with a set of three sub tables
(Table 5.5a, Table 5.5b, and Table 5.5c).
Table 5.5a shows that LM test is statistical insignificant so the model specification
satisfies pooling regression without group dummy variables.
Table 5.5: Role of R&D on Cost Margin for Small Scale Automobile Firms
Table 5.5a: Test Statistic of Hausman and Lagrange Multiplier test of the Regression on
Cost Margin for Small Scale Automobile Firms
Random Effects Model: v(it) = e(it) + u(i)
Estimates: Var[e] = .311421D+00
Var[u] = .204399D-01 Corr[v(it),v(is)] = .061592
Lagrange Multiplier Test vs. Model (3) = 1.29 ( 1 df, prob value = .255960) (High values of LM favor FEM/REM over CR model.)
( Fixed vs. Random Effects (Hausman) = 3.77 ( 2 df, prob value = .152070) (High (low) values of H favor FEM (REM).)
Reestimated using GLS coefficients:
Estimates: Var[e] = .349806D+00
Var[u] = -.277434D-01 Sum of Squares .397513D+02
Source: Calculated from the CMIE data sources for the period 1991 – 2008.
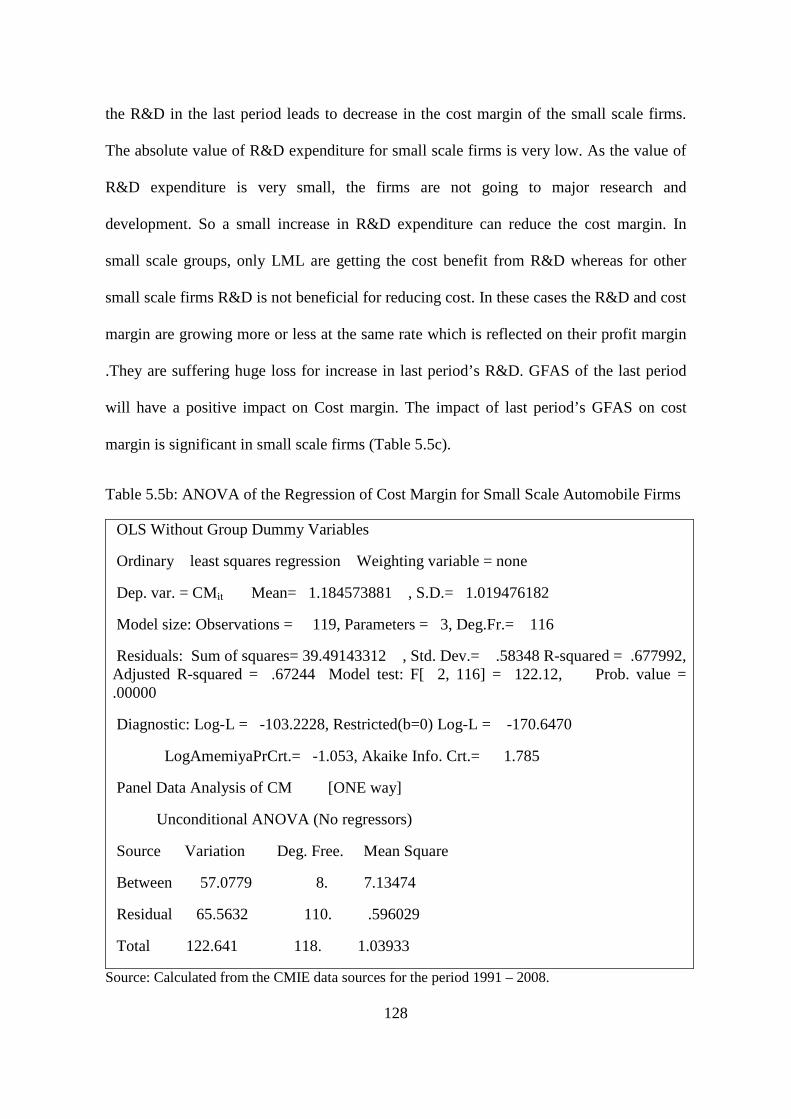
It is observed from the Table 5.5b that the regression specification is meaningful as
the high value of F statistic and high degree of measurement of goodness of fit. Table 5.5c
explores the findings. In case of cost reducing role of R&D, it is found that an increase in
128
the R&D in the last period leads to decrease in the cost margin of the small scale firms.
The absolute value of R&D expenditure for small scale firms is very low. As the value of
R&D expenditure is very small, the firms are not going to major research and
development. So a small increase in R&D expenditure can reduce the cost margin. In
small scale groups, only LML are getting the cost benefit from R&D whereas for other
small scale firms R&D is not beneficial for reducing cost. In these cases the R&D and cost
margin are growing more or less at the same rate which is reflected on their profit margin
.They are suffering huge loss for increase in last period’s R&D. GFAS of the last period
will have a positive impact on Cost margin. The impact of last period’s GFAS on cost
margin is significant in small scale firms (Table 5.5c).
Table 5.5b: ANOVA of the Regression of Cost Margin for Small Scale Automobile Firms
OLS Without Group Dummy Variables
Ordinary least squares regression Weighting variable = none
Dep. var. = CMit Mean= 1.184573881 , S.D.= 1.019476182
Model size: Observations = 119, Parameters = 3, Deg.Fr.= 116
Residuals: Sum of squares= 39.49143312 , Std. Dev.= .58348 R-squared = .677992, Adjusted R-squared = .67244 Model test: F[ 2, 116] = 122.12, Prob. value = .00000
Diagnostic: Log-L = -103.2228, Restricted(b=0) Log-L = -170.6470
LogAmemiyaPrCrt.= -1.053, Akaike Info. Crt.= 1.785
Panel Data Analysis of CM [ONE way]
Unconditional ANOVA (No regressors)
Source Variation Deg. Free. Mean Square
Between 57.0779 8. 7.13474
Residual 65.5632 110. .596029
Total 122.641 118. 1.03933
Source: Calculated from the CMIE data sources for the period 1991 – 2008.

129
Table 5.5c: Estimated coefficients of the Regression on Cost Margin for Small Scale
Automobile Firms
Variable Coefficient Standard Error t-ratio P[|T|>t] |
RDSit-1 -34.59117992 4.5874701 -7.540 .0000
GFASit-1 .2377323827 .30264229E-01 7.855 .0000
Constant .9909995787 .57176970E-01 17.332 .0000
Source: Calculated from the CMIE data sources for the period 1991 – 2008.
Performance promoting role of R&D of Small Scale firms in Automobile Industry
To analyse the performance promoting role same specification of profit margin
(PM) have been considered which is already mentioned for large and medium scale of
firms. The result for this specification is given in the following Table 5.6. Table 5.6
consists with a set of three sub tables (Table 5.6a, Table 5.6b and Table 5.6c).
Table 5.6a shows that LM test is statistical insignificant (as the value of LM
statistic is low) so the model specification satisfies pooling regression without group
dummy variables.
130
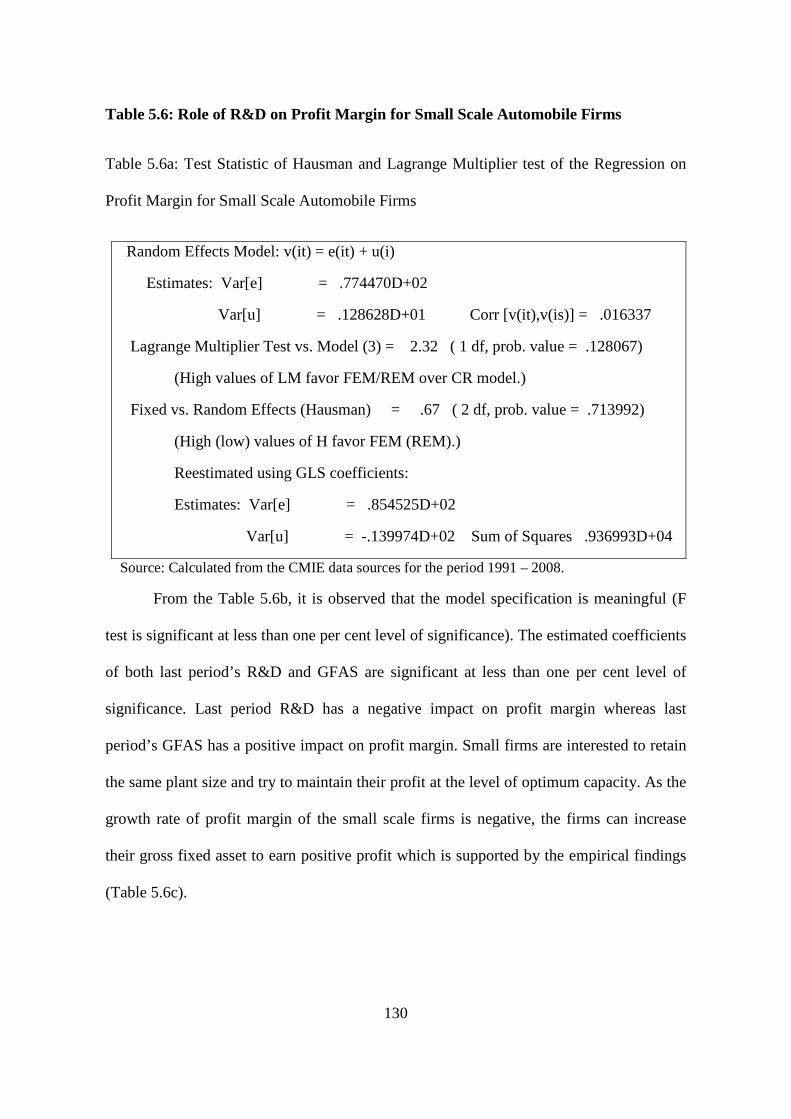
Table 5.6: Role of R&D on Profit Margin for Small Scale Automobile Firms
Table 5.6a: Test Statistic of Hausman and Lagrange Multiplier test of the Regression on
Profit Margin for Small Scale Automobile Firms
Random Effects Model: v(it) = e(it) + u(i)
Estimates: Var[e] = .774470D+02
Var[u] = .128628D+01 Corr [v(it),v(is)] = .016337
Lagrange Multiplier Test vs. Model (3) = 2.32 ( 1 df, prob. value = .128067)
(High values of LM favor FEM/REM over CR model.)
Fixed vs. Random Effects (Hausman) = .67 ( 2 df, prob. value = .713992)
(High (low) values of H favor FEM (REM).)
Reestimated using GLS coefficients:
Estimates: Var[e] = .854525D+02
Var[u] = -.139974D+02 Sum of Squares .936993D+04
Source: Calculated from the CMIE data sources for the period 1991 – 2008.
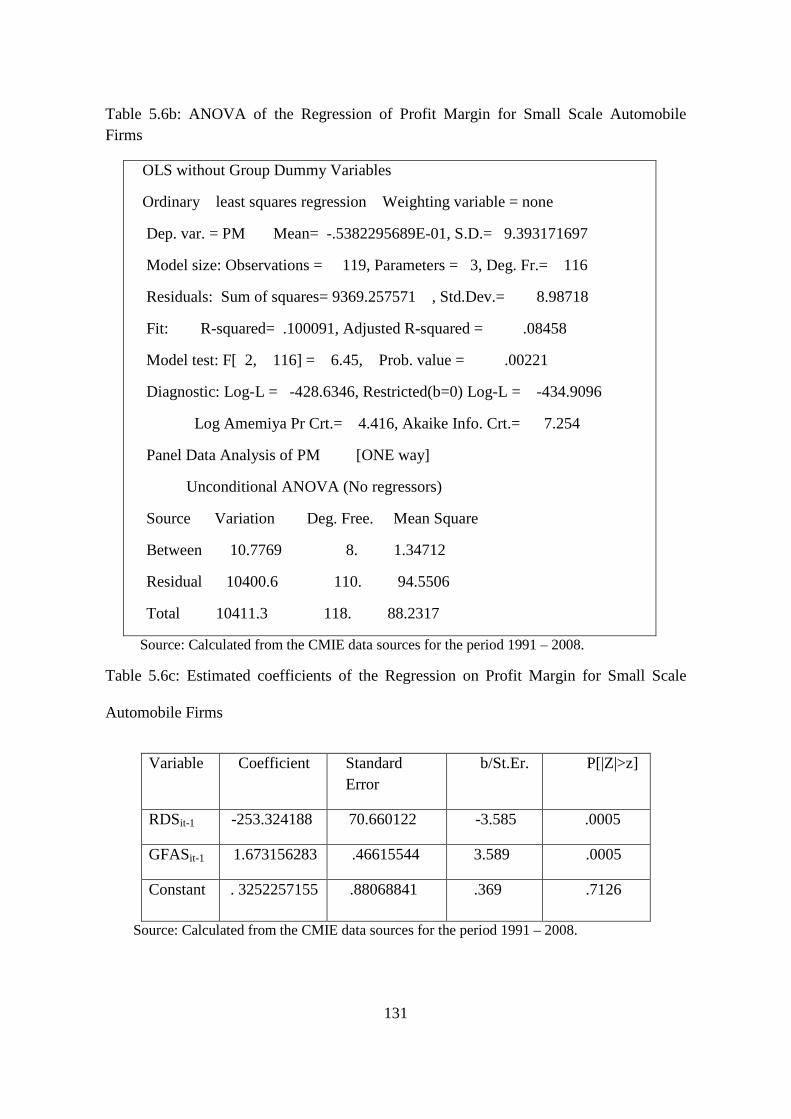
From the Table 5.6b, it is observed that the model specification is meaningful (F
test is significant at less than one per cent level of significance). The estimated coefficients
of both last period’s R&D and GFAS are significant at less than one per cent level of
significance. Last period R&D has a negative impact on profit margin whereas last
period’s GFAS has a positive impact on profit margin. Small firms are interested to retain
the same plant size and try to maintain their profit at the level of optimum capacity. As the
growth rate of profit margin of the small scale firms is negative, the firms can increase
their gross fixed asset to earn positive profit which is supported by the empirical findings
(Table 5.6c).
131
Table 5.6b: ANOVA of the Regression of Profit Margin for Small Scale Automobile Firms
OLS without Group Dummy Variables
Ordinary least squares regression Weighting variable = none
Dep. var. = PM Mean= -.5382295689E-01, S.D.= 9.393171697
Model size: Observations = 119, Parameters = 3, Deg. Fr.= 116
Residuals: Sum of squares= 9369.257571 , Std.Dev.= 8.98718
Fit: R-squared= .100091, Adjusted R-squared = .08458
Model test: F[ 2, 116] = 6.45, Prob. value = .00221
Diagnostic: Log-L = -428.6346, Restricted(b=0) Log-L = -434.9096
Log Amemiya Pr Crt.= 4.416, Akaike Info. Crt.= 7.254
Panel Data Analysis of PM [ONE way]
Unconditional ANOVA (No regressors)
Source Variation Deg. Free. Mean Square
Between 10.7769 8. 1.34712
Residual 10400.6 110. 94.5506
Total 10411.3 118. 88.2317
Source: Calculated from the CMIE data sources for the period 1991 – 2008.
Table 5.6c: Estimated coefficients of the Regression on Profit Margin for Small Scale
Automobile Firms
Variable Coefficient Standard Error
b/St.Er. P[|Z|>z]
RDSit-1 -253.324188 70.660122 -3.585 .0005
GFASit-1 1.673156283 .46615544 3.589 .0005
Constant . 3252257155 .88068841 .369 .7126
Source: Calculated from the CMIE data sources for the period 1991 – 2008.

132
An Aggregative and Comparative Analysis of the Role of R&D on different scale of
firms in Automobile Industry
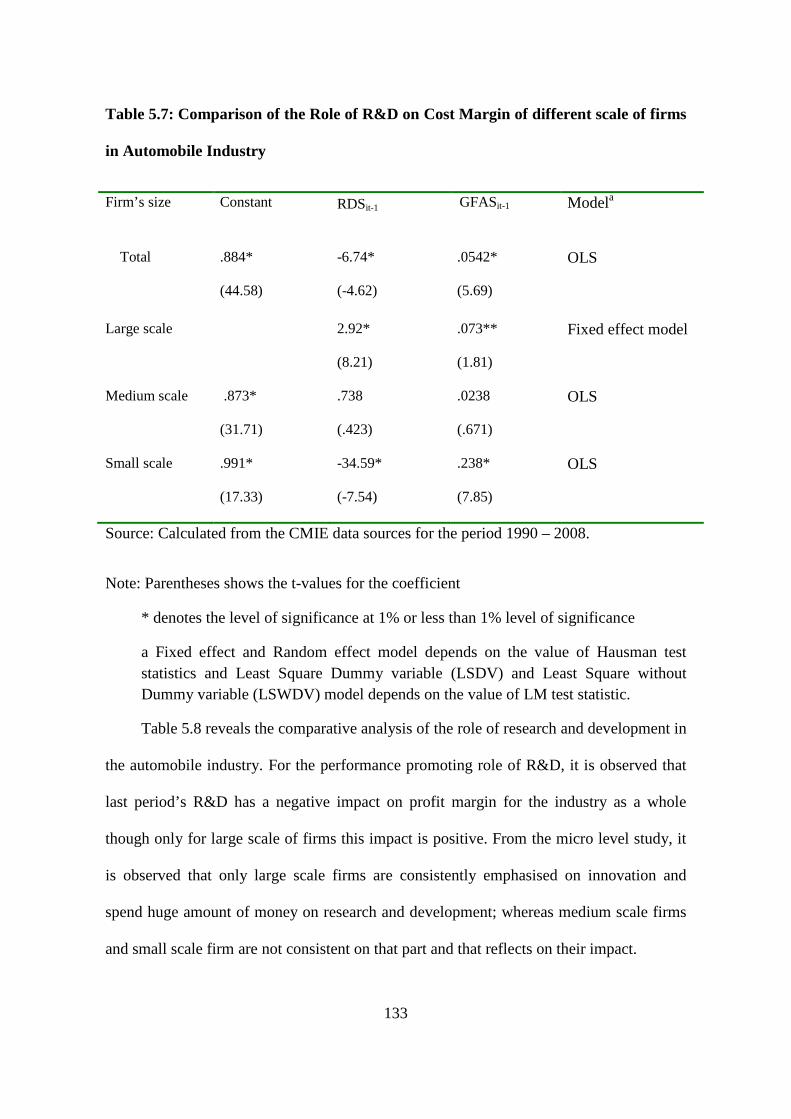
From the comparison Tables 5.7, it is found that R&D of the last period in the
industry as a whole has a significant negative impact on cost margin of the current period.
It implies that increase in R&D of the last period will decrease the cost for the entire
industry. But, for large scale firms the impact is positive because, firms’ behaviours are
different in the industry and that may due to heterogeneous nature and different size. Large
scale firms are going for major innovation and medium and small scale firms are going for
minor innovation ie; the pattern of R&D are different due to different financial strength.
GFAS of the last period will have a positive impact on Cost margin. Increase in GFA
implies that the company will go for purchasing more intangible assets, land, building,
plant and machinery which will ultimately increase the cost structure which is
theoretically justified. The impact of last period’s GFAS on cost margin is significant and
higher in large scale firms (Table 5.7).
133
Table 5.7: Comparison of the Role of R&D on Cost Margin of different scale of firms
in Automobile Industry
Firm’s size Constant RDSit-1 GFASit-1 Modela
Total .884*
(44.58)
-6.74*
(-4.62)
.0542*
(5.69)
OLS
Large scale 2.92*
(8.21)
.073**
(1.81)
Fixed effect model
Medium scale
.873*
(31.71)
.738
(.423)
.0238
(.671)
OLS
Small scale .991*
(17.33)
-34.59*
(-7.54)
.238*
(7.85)
OLS
Source: Calculated from the CMIE data sources for the period 1990 – 2008.
Note: Parentheses shows the t-values for the coefficient
* denotes the level of significance at 1% or less than 1% level of significance
a Fixed effect and Random effect model depends on the value of Hausman test statistics and Least Square Dummy variable (LSDV) and Least Square without Dummy variable (LSWDV) model depends on the value of LM test statistic.
Table 5.8 reveals the comparative analysis of the role of research and development in
the automobile industry. For the performance promoting role of R&D, it is observed that
last period’s R&D has a negative impact on profit margin for the industry as a whole
though only for large scale of firms this impact is positive. From the micro level study, it
is observed that only large scale firms are consistently emphasised on innovation and
spend huge amount of money on research and development; whereas medium scale firms
and small scale firm are not consistent on that part and that reflects on their impact.

134
Table 5.8: Comparison of the Role of R&D on Performance of the different scale of
firms in Automobile Industry
Firm’s size Constant RDSit-1 GFASit-1 Modela
Total -79.15*
(-3.57)
.528*
(3.61)
Fixed effect model
Large scale .828*
(7.32)
.774*
(4.90)
-.109*
(-6.40)
Random effect model
Medium scale
.134
(1.31)
-1.83
(-.281)
-.359*
(-2.71)
OLS
Small scale .325
(.369)
-253.32*
(-3.58)
1.67*
(3.58.)
OLS
Source: Calculated from the CMIE data sources for the period 1990 – 2008.
Note: Parentheses shows the t-values for the coefficient
*denotes the level of significance at 1% or less than 1% level of significance
**denotes the level of significance at 5% or less than 5% level of significance
The impact of last period’s GFAS on profit margin for the industry as a whole is
positive and significant though it is negatively significant for large and medium scale
firms. Domowitz et al. (1986) have observed also the positive impact for all industries by
considering cross-section and time series data. The patterns of investment on their gross
fixed assets are different for different scale of firms. So, immediate impact of gross fixed
assets on profit is negative for some firms as per their motive of capturing more market
share in the long run. Strickland and Weiss (1976) have observed the negative relation. So,
both the positive and negative impact of GFAS on profit margin is theoretically justified.

135
5.2: Role of R&D in Indian Drugs and Pharmaceuticals Industry
The pharmaceutical industry is one of the most R&D intensive sectors and the
R&D activities involve scientific research in emerging or unexplored fields. Earlier, the
Indian pharmaceutical industry spent very little on R&D. In the early 1990s, its R&D
expenditures amounted to only about 1.5 per cent of sales (Grace 2004, p. 37). Even larger
companies such as Ranbaxy and Dr. Reddy’s Laboratories spent only 2-3 per cent of their
sales on R&D in 1992-93. Since then, however, and particularly since the early 2000s,
there has been a substantial increase in spending on research in a segment of the industry.
Ranbaxy is the largest R&D spender in the Indian pharmaceutical industry. In 1994-95,
when TRIPS came into effect, it spent Rs. 365.8 million on R&D (4.61 per cent of its
sales). Dr. Reddy’s, the second largest R&D spender, expenditure increased steadily and
sharply from Rs 39.8 million (2.01 per cent of sales) in 1994-95 to Rs 2977.9 (17. 12 per
cent) in 2004-05. The larger Indian pharmaceutical companies are among the largest
investors in R&D among all industries combined in India. Each of the top five R&D
spenders in corporate India are pharmaceutical companies - Ranbaxy, Dr. Reddy’s
Laboratories, and Cipla Ltd. (Choudhuri 2007). It comes along with a lot of risk as the
research may or may not ultimately lead to a commercial product. The pharmaceutical
industry is mainly driven by the growing expectations of the consumer and the rising cost
of developing new products. All pharmaceutical companies want to reduce their R&D
costs and are under extreme pressure to develop new drugs. To economize R&D and to
reduce the lead-time for development of new drug, many companies have sought alliance
partners with breading-edge technologies and expertise in particular fields as a way to
outsource R&D activities. The R&D function among the Indian pharmaceuticals
companies is at a very promising stage. Even well established companies spend as low as

136
2.5 per cent of their total turnover towards R&D expenses. Signing of the recent WTO
agreement by India facilitates the recognition of product patents. To counter this regime,
domestic players have initiated investment on research. But, it is important to know the
research which is the most important part of drugs and pharmaceuticals industry that
whether it is cost reducing or performance promoting. To have a brief idea about the role
of R&D in the drugs and pharmaceuticals industry, it is important know about the role of
R&D expenditure in the case of some pharmaceuticals companies.
When the first Cipla products were ready for the market in September 1937, The
Sunday Standard predicted that “with intelligent direction and skilful production, (Cipla)
bids fair to establish a great reputation in the East”. Indeed, the company’s reputation has
gone beyond the East. From a quiet beginning, today Cipla Ltd. is well known
internationally by doctors and patients alike, in most countries across the globe. Cipla Ltd.
has achieved an overall growth of about eight per cent in turnover during the year 2009-
10. Domestic growth was steady at ten per cent. According to ORG-IMS Statistics of
drugs, Cipla remained the leader in the domestic market, as on 31st March 2010 with a
market share of 5.38 per cent. However, growth in formulation exports was affected due to
various factors including non-availability of important raw materials, lower tender
business in anti-retroviral and unfavourable movements in foreign exchange rate. The
Company introduced many new drugs and formulations during that year. The Company
will continue its R&D efforts in the various areas indicated in above. The major thrust
would be on developing new products and drug delivery systems. The total R&D
expenditure as a percentage of total turnover is around five per cent13.
13
Annual Report 2009-10 of Cipla Ltd.
137
Dr. Reddy's Laboratories Ltd. founded in 1984 with $160,000. Dr. Reddy’s was
the first Asia-Pacific pharmaceutical outside of Japan and the sixth Indian company to be
listed on the New York Stock Exchange. It earned $446 million in fiscal year 2005,
deriving 66 per cent of this income from the foreign market. In order to strengthen its
global position Dr. Reddy acquired UK-based BMS Laboratories and subsidiary Meridian
Healthcare. Although 58 per cent of Dr. Reddy’s revenues come from generic drugs, the
company was committed to WTO-compliance long before the 2005 bill took effect, and
most of these products were already off patent. Dr. Reddy has long been a research-
oriented firm, preceding many of its peers in setting up a New Drug Development
Research (NDDR) in 1993 and out-licensing its first compound just four years later. Dr.
Reddy’s has since out licensed two more molecules and currently has three others in
clinical trials.
Glaxo Smith Kline continues to be committed to research and development of
medicines that will improve the quality of life of people around the world and that truly
make a difference to patients. The Clinical Operations group in India, which conducts
clinical studies across a number of disease areas ranging from cancer, iron deficiency
anaemia, coronary heart disease, osteoporosis, malaria, supports this global and local
effort. The company maintained its leadership position in the pharmaceuticals market with
Net Sales (net of Excise Duty), registering a growth of 12.9 per cent. Sales performance in
all of the company’s diversified business units ie; in the mass market and mass specialty
segments, dermatological, oncology, critical care and vaccines helped to support sales
growth. The company is engaged in conducting 22 clinical trials of which seven were
initiated in 2010. A total of 216 patients participated in these studies. Most of the clinical
studies initiated in 2010 were in oncology. The company has trained more than 165

138
investigators at 73 clinical trial sites across India. Quality continues to be the key priority,
and is evidenced by a number of successful internal compliance audits. In order to support
the launch of new drugs that would benefit and improve the quality of life of the patients
suffering from various diseases, the company submitted seven NDAs (New Drug
Applications) for various products including vaccines and two IND (Investigational New
Drug) applications to the CDSCO (Central Drugs Standard Control Organization) under
the Ministry of Health and Family Welfare, Government of India. The company has
received approval for six NDAs and one IND from CDSCO, which paves the way for
speedy introduction of new drugs. Additionally, to support the R&D efforts of Glaxo
Smith Kline, the company submitted six global Clinical Trial applications to the CDSCO
and have been granted approval to conduct three studies on the Indian population through
the Clinical Operations group in India. Some of the novel innovative products for oral use,
approved by the regulatory agency in India during the year under review, include
pazopanib (Votrient) an oncology product for the treatment of advanced renal cell
carcinoma, eltrombopag (Revolade) for the treatment of immune thrombocytopenia (ITP),
and ambrisentan (Volibris) for the treatment of pulmonary arterial hypertension. In
addition, a new indication approved for the existing oncology product lapatinib (Tykerb)
in combination with letrozole will be beneficial for Indian patients with metastatic breast
cancer. Efforts towards ensuring a speedy review and approval by regulatory authorities
for these products will help achieve early access to new and innovative therapeutic options
to patients in the country14.
Piramal Healthcare continues to conduct Research and Development related to
pre-formulation and formulation development and clinical manufacturing of NCE’s for
14 Annual Report of Glaxo Smith Kline Ltd. 2010.

139
external clients; Process optimization, research and scale up, for the early phase projects
from clients. Total R&D expenditure during the year was Rs. 413.2 million.15 Due to this
R&D, there is cost effective development of formulations for global pharmaceutical
companies, thus bringing in more molecules into the global pipeline. Support of the new
“network” paradigm of the global innovator in pharmaceutical industry is thereby putting
India in the crux of this industrial culture change. Total R&D expenditure as a percentage
to sales is 2.60 per cent.16
Ranbaxy Laboratories Ltd is the leader in the Indian pharmaceutical market, taking
in $1.174 billion in revenues for a net profit of $160 million in 2004. It was the first Indian
pharmaceutical to have a proprietary drug (extended-release Ciprofloxacin, marketed by
Bayer) approved by the U.S. FDA (Food and Drug Administration), and the U.S. market
accounts for 36 per cent of its sales. 78 per cent of Ranbaxy’s sales are from overseas
markets; its offices in 44 countries manage manufacturing in seven countries and
distribution in over 100. IMS Health estimated that Ranbaxy is among the top 100
pharmaceuticals in the world and that it is the 15th fastest growing company. By 2012,
Ranbaxy hopes to be one of the top five generics producers in the world, and it
consolidated its position with the purchase of French firm RGP Aventis in 2003. Ranbaxy
also has higher aspirations, however, “to build a proprietary prescription business in the
advanced markets.” To this end, it keeps a dedicated research facility in Gurgaon staffed
with over 1100 scientists. They currently have two molecules in Phase II trials and 3-5 in
pre-clinical testing. It spent $75 million in R&D in 2004, a 43 per cent increase over its
15 Annual Report of Piramal Health Care Ltd. 2010-11.
16 Annual report 2010-11 of Piramal Healthcare Ltd.
140
2003 expenditure. Ranbaxy has achieved a growth of 75 per cent of its turnover (Sales +
Services Rendered), reaching a value of € 3.190.826 (in Rs. 192,2184,434)17.
The role of R&D is whether cost reducing or performance promoting in the case of
drugs and pharmaceuticals industry is discussed scale wise sequentially in the following.
5.2.1: Role of R&D of Large Scale firms in the Indian Drugs and Pharmaceutical
Industry
As the large scale firms are the leader firms of the drugs and pharmaceuticals
industry, so it is important to know the role of R&D in case of cost margin as well as
profit margin. These two roles of research and development of the large scale drugs and
pharmaceutical firms are analysed in the following.
Cost reducing role of R&D of Large scale firms in Drugs and Pharmaceutical
Industry
To analyse the cost reducing role a specification of cost margin (CM) have been
considered which is already mentioned for all types and all scale of firms in equation (4)
under the methodology section of Chapter 3. The result for this specification is given in
the following Table 5.9. Table 5.9 consists with a set of five sub tables (Table 5.9a and
Table 5.9b).
From the Table 5.9a, it is observed that the model specification follows the random
effect model. The value of LM test is significant at less than five per cent level of
significance but the value of Hausman test is insignificant. Table 5.9b reveals that Last
period’s R&D has a positive and significant impact on current period’s cost margin. Large
17
Annual report 2010 of Ranbaxy Ltd.

141
scale firms are the leading firms and they are more interested in future performance, they
continue to invest on R&D which leads to immediate increase in cost margin of the firms.
In the group of large scale firms, some firms are getting cost margin benefit due to higher
R&D. The growth of R&D is very high whereas the growth of cost margin is negative for
the firms say Cipla Ltd, Glaxo Smith Kline Ltd. (Table 4.17). Whereas for other firms like
Dr. Reddy’s Laboratories Ltd, Piramal Healthcare Ltd. and Ranbaxy Laboratories Ltd., the
growth rate of cost margin is positive though the value is very much lower than growth of
R&D. So, R&D has some positive impact for reducing cost margin in the long run (Table
4.17).
Table 5.9: Role of R&D on Cost Margin for Large Scale Drugs and Pharmaceuticals
Firms
Table 5.9a: Test Statistic of Hausman and Lagrange Multiplier test of the Regression of
Cost Margin for Large Scale Drugs and Pharmaceutical Firms
Random Effects Model: v(it) = e(it) + u(i)
Estimates: Var[e] = .570868D-02
Var[u] = .648047D-03 Corr [v(it),v(is)] = .101947
Lagrange Multiplier Test vs. Model (3) = 4.01 ( 1 df, prob. value = .045220)
(High values of LM favor FEM/REM over CR model.)
Fixed vs. Random Effects (Hausman) = 1.99 ( 2 df, prob. value = .369065)
(High (low) values of H favor FEM (REM).)
Reestimated using GLS coefficients:
Estimates: Var[e] = .573895D-02
Var[u] = .196233D-02 Sum of Squares .558455D+00
Source: Calculated from the CMIE data sources for the period 1990 – 2008.

142
Table 5.9b: Estimated coefficients of the Regression of Cost Margin for Large Scale
Drugs and Pharmaceutical Firms
Variable Coefficient Standard Error b/St.Er. P[|Z|>z]
RDSit-1 1.033619441 .23065725 4.481 .0000
GFASit-1 -.5324820E-01 .50100461E-01 -1.063 .2879
Constant .7561726269 .26049481E-01 29.028 .0000
Source: Calculated from the CMIE data sources for the period 1990 – 2008.
Performance promoting role of R&D of Large scale firms in Drugs and
Pharmaceutical
Industry
To analyse the performance promoting role a specification of profit margin (PM) have
been considered which is already mentioned for all types and all scale of firms in equation
(5) under the methodology section of Chapter 3. The results of this specification for large
scale firms are given in the following Table 5.10 which consist three sub-tables (Table
5.10a, Table 5.10b and Table 5.10c).

143
Table 5.10: Role of R&D on Cost Margin for Large Scale Drugs and
Pharmaceuticals Firms
Table 5.10a: Test Statistic of Hausman and Lagrange Multiplier test of the Regression of
Profit Margin for Large Scale Drugs and Pharmaceutical Firms
Random Effects Model: v(it) = e(it) + u(i)
Estimates: Var[e] = .404990D-02
Var[u] = .161384D-03 Corr [v(it),v(is)] = .038322
Lagrange Multiplier Test vs. Model (3) = .30 ( 1 df, prob. value = .585762)
(High values of LM favor FEM/REM over CR model.)
Fixed vs. Random Effects (Hausman) = .18 ( 2 df, prob. value = .912085)
(High (low) values of H favor FEM (REM).)
Reestimated using GLS coefficients:
Estimates: Var[e] = .439454D-02
Var[u] = .154371D-03 Sum of Squares .379094D+00
Source: Calculated from the CMIE data sources for the period 1990 – 2008.
Table 5.10a shows that LM test is statistical insignificant (as the value of LM
statistic is very low) so the model specification satisfies pooling regression without group
dummy variables. Table 5.10b shows the pooling regression specification is meaningful as
the F test is significance at eight per cent level of significance though the value of R-
squared is very low.

144
Table 5.10b: ANOVA of the Regression of Profit Margin for Large Scale Drugs and
Pharmaceutical Firms
OLS Without Group Dummy Variables
Ordinary least squares regression Weighting variable = none
Dep. var. = PM Mean= .1278401956 , S.D.= .6716104829E-01
Model size: Observations = 90, Parameters = 3, Deg.Fr.= 87
Residuals: Sum of squares= .3790156724 , Std.Dev.= .06600
Fit: R-squared= .055869, Adjusted R-squared = .03416
Model test: F[ 2, 87] = 2.57, Prob. value = .08202
Diagnostic: Log-L = 118.4450, Restricted(b=0) Log-L = 115.8579
Log Amemiya Pr Crt.= -5.403, Akaike Info. Crt.= -2.565
Panel Data Analysis of PM [ONE way]
Unconditional ANOVA (No regressors)
Source Variation Deg. Free. Mean Square
Between .224983E-01 4. .562457E-02
Residual .378946 85. .445818E-02
Total .401444 89. .451061E-02
Source: Calculated from the CMIE data sources for the period 1990 – 2008.
Table 5.10c: Estimated coefficients of the Regression of Profit Margin for Large Scale
Drugs and Pharmaceutical Firms
Variable Coefficient Standard Error b/St.Er. P[|Z|>z]
RDSit-1 .3371842731 .18433319 1.829 .0708
GFASit-1 -.6052695E-01 .356215E-01 -1.699 .0929
Constant .1443555617 .17224129E-01 8.381 .0000
Source: Calculated from the CMIE data sources for the period 1990 – 2008.

145
This is reflected in their profit margin. Profit margin increases if they invest more
money on previous year’s R&D (Table 5.10c). GFAS of the last period will have a
negative impact on profit margin. The impact of last period’s GFAS on profit margin is
significant.
From the growth rate of gross fixed asset, it is observed that all the large scale
firms are maintaining very high growth rate (Table 4.17 in Chapter 4). Theoretically, large
scale firms are interested to maintain long run performance and for that they are going not
only for purchasing machinery but also increasing plant size or purchasing land or
buildings. So immediate impact of gross fixed asset on profit are negative for large scale
firms as per their motive of capturing more market share in the long run. So the impact of
GFA on profit is theoretically justified.
Both growth rate of R&D and profit are high for large scale firms (Table 4.17 in
Chapter 4). High growth rate of the two variables indicate that R&D increases over time
and side by side firms are maintaining a positive profit margin over time. The rate of
growth of R&D is higher that growth rate of profit margin. From the regression analysis it
is also observed that if R&D of the last period increases by Rs.100 then profit margin
increases by Rs. 33.
5.2.2: Role of R&D in the Medium scale Indian Drugs and Pharmaceuticals Industry
In the case of medium scale firms, the cost reducing role of R&D and performance
promoting role of R&D is discussed in the following.

146
Cost reducing role of R&D of Medium scale firms in Drugs and Pharmaceutical
Industry
To examine cost reducing role, same specification of cost margin (CM) have been
considered like large scale firms and analysed on the basis of findings in the given Table
5.11. Table 5.11 consists with a set of two sub tables (Table 5.11a, and Table 5.11b).
Table 5.11: Role of R&D on Cost Margin for Medium Scale Drugs and
Pharmaceutical Firms
Table 5.11a: Test Statistic of Hausman and Lagrange Multiplier test of the Regression on
Cost Margin for Medium Scale Drugs and Pharmaceutical Firms
Random Effects Model: v(it) = e(it) + u(i)
Estimates: Var[e] = .451648D-02
Var[u] = .708305D-03 Corr[v(it),v(is)] = .135566
Lagrange Multiplier Test vs. Model (3) = 31.52 ( 1 df, prob. value = .000000)
(High values of LM favor FEM/REM over CR model.)
Fixed vs. Random Effects (Hausman) = 1.31 ( 2 df, prob. value = .519792)
(High (low) values of H favor FEM (REM).)
Reestimated using GLS coefficients:
Estimates: Var[e] = .452287D-02
Var[u] = .979082D-03 Sum of Squares .121197D+01
Source: Calculated from the CMIE data sources for the period 1990 – 2008.
From the Table 5.11a, it is observed that the model specification follows the
random effect model. The value of LM test is significant at less than five per cent level of
significance but the value of Hausman test is insignificant.

147
Table 5.11b: Estimated coefficients of the Regression of Cost Margin for Medium Scale
Drugs and Pharmaceutical Firms
Variable Coefficient Standard Error b/St.Er. P[|Z|>z]
RDSit-1 -.599296266 .35290176 -1.698 .0895
GFASit-1 .2008713E-01 .42060063E-01 .478 .6329
Constant .7632484830 .16198391E-01 47.119 .0000
Source: Calculated from the CMIE data sources for the period 1990 – 2008.
It is found that an increase in the R&D in the last period leads to increase in the
cost margin of the medium scale firms (Table 5.11b). So, the immediate impact of R&D
increases next period’s cost margin. But, the growth rate of cost margin is negative in most
of the medium scale firms. Though the rate of growth of R&D is very much lower but
negative growth of cost margin implies that R&D has some positive impact for reducing
cost margin (Table 4.19).
Performance promoting role of R&D of Medium scale firms in Drugs and
Pharmaceutical Industry
To examine performance promoting role, same specification of profit margin (PM)
have been considered like large scale firms and analysed on the basis of findings in the
given Table 5.12. Table 5.12 consists with a set of two sub tables (Table 5.12a, and Table
5.12b).

148
Table 5.12: Role of R&D on Profit Margin for Medium Scale Drugs and
Pharmaceutical Firms
Table 5.12a: Test Statistic of Hausman and Lagrange Multiplier test of the Regression on
Profit Margin for Medium Scale Drugs and Pharmaceutical Firms
Random Effects Model: v(it) = e(it) + u(i)
Estimates: Var[e] = .372287D+03
Var[u] = .694712D+01 Corr [v(it),v(is)] = .018319
Lagrange Multiplier Test vs. Model (3) = .07 ( 1 df, prob. value = .793901)
(High values of LM favor FEM/REM over CR model.)
Fixed vs. Random Effects (Hausman) = 3.39 ( 2 df, prob. value = .183877)
(High (low) values of H favor FEM (REM).)
Reestimated using GLS coefficients:
Estimates: Var[e] = .374739D+03
Var[u] = .100907D+02 Sum of Squares .876316D+05
Source: Calculated from the CMIE data sources for the period 1990 – 2008.
From the Table 5.12a, it is revealed that the value of Lagrange Multiplier (LM) is
insignificant which indicates the results supports pooling regression without dummy
variable. The pooling regression equation is meaningful as the value of F statistic is
significant at one per cent level of significant (Table 5.12b). Table 5.12c reveals that past
period’s R&D has no significant impact on the firms’ performance though past period’s
GFAS has a negative impact on profit margin for the medium scale drugs and
pharmaceutical firms. Medium scale firms are interested not only for purchasing
machinery but also increasing plant size or purchasing land or buildings. So, immediate
impact of gross fixed asset on profit margin is negative but significant. Strickland and

149
Weiss (1976) have observed the negative relation. So the impact of GFA on profit is
theoretically justified.
Table 5.12b: ANOVA of the Regression of Profit Margin for Medium Scale Drugs and
Pharmaceutical Firms
OLS Without Group Dummy Variables
Ordinary least squares regression Weighting variable = none
Dep. var. = PMit Mean= -1.200266195 , S.D.= 19.76152521
Model size: Observations = 234, Parameters = 3, Deg.Fr.= 231
Residuals: Sum of squares= 87603.08249 , Std. Dev.= 19.47393
Fit: R-squared = .037230, Adjusted R-squared = .02889
Model test: F[ 2, 231] = 4.47, Prob. value = .01250
Diagnostic: Log-L = -1025.2859, Restricted(b=0) Log-L = -1029.7250
Log Amemiya Prrt.= 5.951, Akaike Info. Crt.= 8.789
Panel Data Analysis of PM [ONE way]
Unconditional ANOVA (No regressors)
Source Variation Deg. Free. Mean Square
Between 4722.45 12. 393.538
Residual 86268.2 221. 390.354
Total 90990.7 233. 390.518
Source: Calculated from the CMIE data sources for the period 1990 – 2008.

150
Table 5.12c: Estimated coefficients of the Regression of Profit Margin for Medium Scale
Drugs and Pharmaceutical Firms
Variable Coefficient Standard
Error
t-ratio P[|T|>t]
RDSit-1 6.814797584 87.323653 .078 .9379
GFASit-1 -26.00554912 9.4704184 -2.746 .0065
Constant 8.388960467 3.4582100 2.426 .0160
Source: Calculated from the CMIE data sources for the period 1990 – 2008.
5.2.3: Role of R&D in the Small scale Indian Drugs and Pharmaceuticals Industry
Both cost reducing role and performance promoting role of R&D for small scale
drugs and pharmaceutical firms is discussed sequentially in this sub-sections.
Cost reducing role of R&D of Small scale firms in Drugs and Pharmaceutical
Industry
To examine cost reducing role, same specification of cost margin (CM) have been
considered like large scale firms and medium scale firms. The findings are given in Table
5.13. Table 5.13 consists with a set of five sub tables (Table 5.13a, Table 5.13b, Table
5.13c, Table 5.13d and Table 5.13e).
151
Table 5.13: Role of R&D on Cost Margin for Small Scale Drugs and Pharmaceutical
Firms
Table 5.13a: Test Statistic of Hausman and Lagrange Multiplier test of the Regression on
Cost Margin for Small Scale Drugs and Pharmaceutical Firms
Random Effects Model: v(it) = e(it) + u(i)
Estimates: Var[e] = .218277D+00
Var[u] = .269532D-01 Corr [v(it),v(is)] = .109910
Lagrange Multiplier Test vs. Model (3) = 37.40 (1 df, prob. value = .000000) (High values of LM favor FEM/REM over CR model.)
Fixed vs. Random Effects (Hausman) = 8.97 (2 df, prob. value = .011257) (High (low) values of H favor FEM (REM).)
Reestimated using GLS coefficients:
Estimates: Var[e] = .218565D+00
Var[u] = .324378D-01 Sum of Squares .110107D+03
Source: Calculated from the result CMIE data sources for the period 1990 – 2008
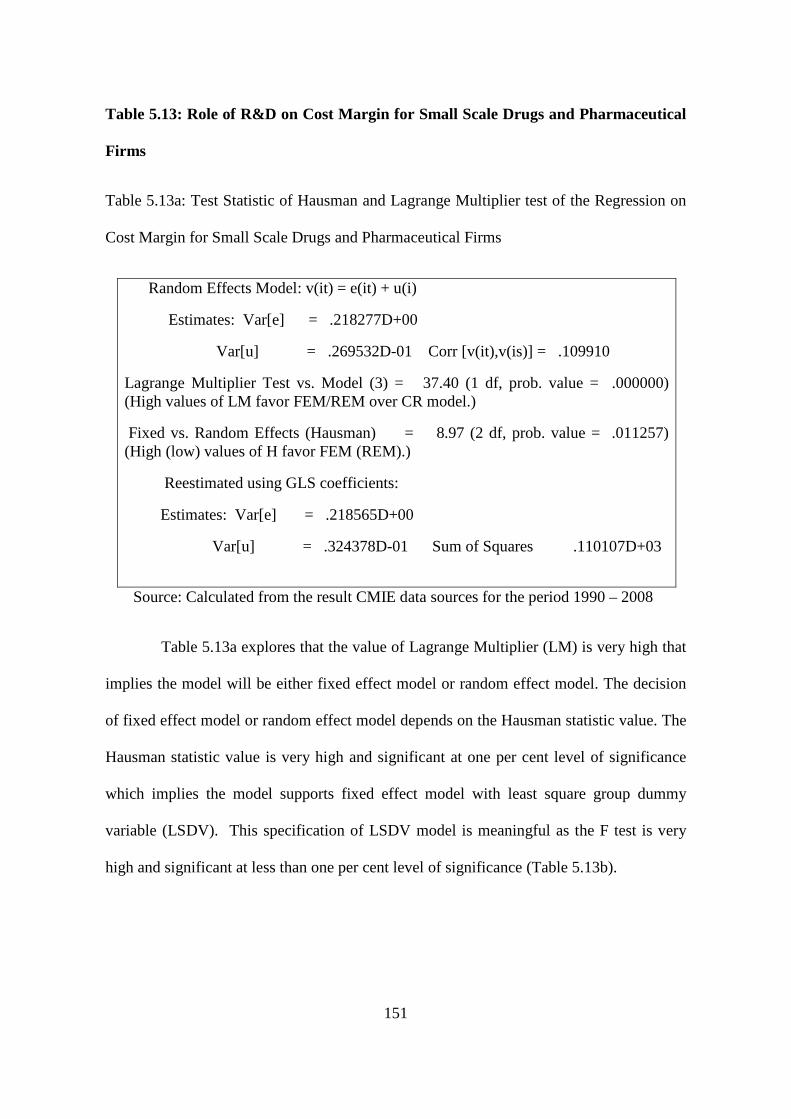
Table 5.13a explores that the value of Lagrange Multiplier (LM) is very high that
implies the model will be either fixed effect model or random effect model. The decision
of fixed effect model or random effect model depends on the Hausman statistic value. The
Hausman statistic value is very high and significant at one per cent level of significance
which implies the model supports fixed effect model with least square group dummy
variable (LSDV). This specification of LSDV model is meaningful as the F test is very
high and significant at less than one per cent level of significance (Table 5.13b).

152
Table 5.13b: ANOVA of the Regression of Cost Margin for Small Scale Drugs and
Pharmaceutical Firms
Least Squares with Group Dummy Variables
Ordinary least squares regression Weighting variable = none
Dep. var. = CMit Mean= .9094580965 , S.D.= .5351138786
Model size: Observations = 450, Parameters = 27, Deg.Fr.= 423
Residuals: Sum of squares= 92.33122649 , Std. Dev.= .46720
Fit: R-squared= .281859, Adjusted R-squared = .23772
Model test: F[ 26, 423] = 6.39, Prob. value = .00000
Diagnostic: Log-L = -282.1527, Restricted(b=0) Log-L = -356.6477
LogAmemiyaPrCrt.= -1.464, Akaike Info. Crt.= 1.374
Estd. Autocorrelation of e(i,t) .315516
Source: Calculated from the result CMIE data sources for the period 1990 – 2008
Table 5.13c: Estimated coefficients of the Regression of Cost Margin for Small Scale
Drugs and Pharmaceutical Firms
Variable Coefficient Standard Error t-ratio P[|T|>t]
RDSit-1 2.292675659 1.9465428 1.178 .2395
GFASit-1 .86301518E-02 .13180932E-02 6.547 .0000
Source: Calculated from the result CMIE data sources for the period 1990 – 2008
Table 5.13c reveals that past period’s R&D has no significant impact on the firms’
performance though past period’s GFAS has a positive impact on profit margin for the
small scale drugs and pharmaceutical firms. This is also justified as already the positive
impact of GFAS has found in the study of Collins and Preston (1969).
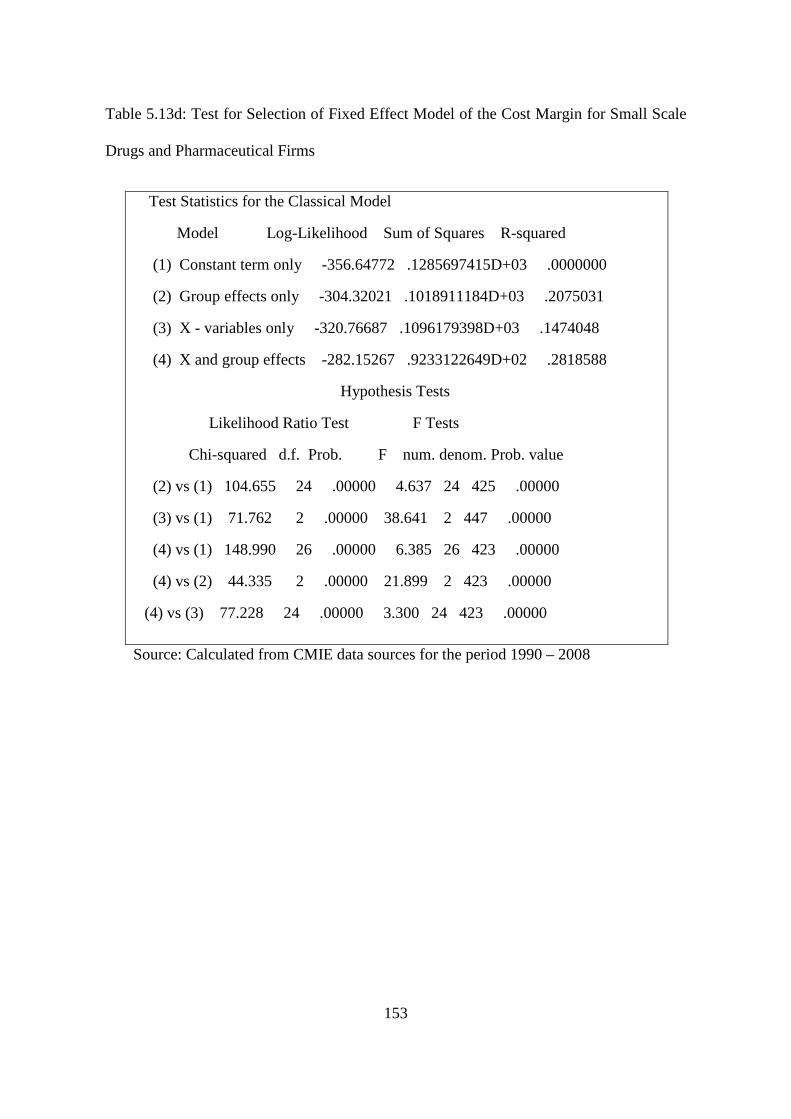
153
Table 5.13d: Test for Selection of Fixed Effect Model of the Cost Margin for Small Scale
Drugs and Pharmaceutical Firms
Test Statistics for the Classical Model
Model Log-Likelihood Sum of Squares R-squared
(1) Constant term only -356.64772 .1285697415D+03 .0000000
(2) Group effects only -304.32021 .1018911184D+03 .2075031
(3) X - variables only -320.76687 .1096179398D+03 .1474048
(4) X and group effects -282.15267 .9233122649D+02 .2818588
Hypothesis Tests
Likelihood Ratio Test F Tests
Chi-squared d.f. Prob. F num. denom. Prob. value
(2) vs (1) 104.655 24 .00000 4.637 24 425 .00000
(3) vs (1) 71.762 2 .00000 38.641 2 447 .00000
(4) vs (1) 148.990 26 .00000 6.385 26 423 .00000
(4) vs (2) 44.335 2 .00000 21.899 2 423 .00000
(4) vs (3) 77.228 24 .00000 3.300 24 423 .00000
Source: Calculated from CMIE data sources for the period 1990 – 2008

154
5.13e: Estimated Fixed Effects of cost margin of Small scale drugs and pharmaceuticals firms
Company name Coefficient Standard Error t-ratio
Albert David Ltd. .80246 .11013 7.28663
Ambalal Sarabhai Enterprises Ltd .96818 .11039 8.77061
Amrutanjan Health Care Ltd .66850 .11535 5.79535
Apte Amalgamations Ltd 1.51428 .11870 12.75753
Core Healthcare Ltd. .92759 .11304 8.20619
D I L Ltd 1.14354 .12090 9.45877
Dey'S Medical Stores Mfg. Ltd .76995 .11305 6.81044
East India Pharmaceutical Works Ltd. .73075 .11324 6.45323
Fulford (India) Ltd. .79635 .11012 7.23167
Gufic Biosciences Ltd 1.31810 .11027 11.95378
Gujarat Themis Biosyn Ltd 1.03019 .11053 9.32042
Kopran Ltd .83070 .11087 7.49251
Kothari Phytochemicals & Inds. Ltd. .86344 .11013 7.84049
Lyka Labs Ltd .90753 .11044 8.21718
Makers Laboratories Ltd .80650 .11016 7.32125
Medi-Caps Ltd. .60431 .11014 5.48696
Morepen Laboratories Ltd .79965 .11117 7.19335
Organon (India) Ltd .80160 .11016 7.27688
Resonance Specialties Ltd .60130 .11524 5.21800
Siris Ltd .72697 .11094 6.55262
T T K Healthcare Ltd .89134 .11017 8.09071
Themis Medicare Ltd .83081 .11074 7.50209
Twilight Litaka Pharma Ltd .84559 .11020 7.67354
Wyeth Ltd .72702 .11033 6.58968
Zandu Pharmaceutical Works Ltd .75176 .11205 6.70894
Source: Calculated from the CMIE data sources for the period 1990 – 2008
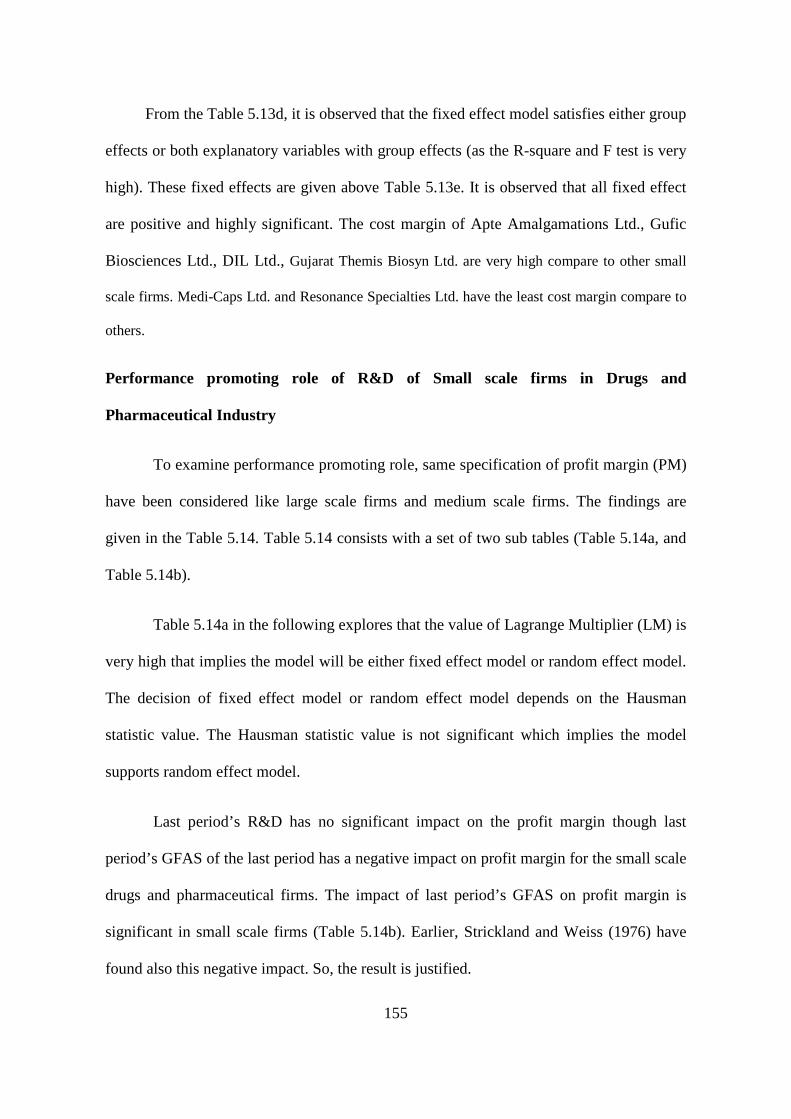
155
From the Table 5.13d, it is observed that the fixed effect model satisfies either group
effects or both explanatory variables with group effects (as the R-square and F test is very
high). These fixed effects are given above Table 5.13e. It is observed that all fixed effect
are positive and highly significant. The cost margin of Apte Amalgamations Ltd., Gufic
Biosciences Ltd., DIL Ltd., Gujarat Themis Biosyn Ltd. are very high compare to other small
scale firms. Medi-Caps Ltd. and Resonance Specialties Ltd. have the least cost margin compare to
others.
Performance promoting role of R&D of Small scale firms in Drugs and
Pharmaceutical Industry
To examine performance promoting role, same specification of profit margin (PM)
have been considered like large scale firms and medium scale firms. The findings are
given in the Table 5.14. Table 5.14 consists with a set of two sub tables (Table 5.14a, and
Table 5.14b).
Table 5.14a in the following explores that the value of Lagrange Multiplier (LM) is
very high that implies the model will be either fixed effect model or random effect model.
The decision of fixed effect model or random effect model depends on the Hausman
statistic value. The Hausman statistic value is not significant which implies the model
supports random effect model.
Last period’s R&D has no significant impact on the profit margin though last
period’s GFAS of the last period has a negative impact on profit margin for the small scale
drugs and pharmaceutical firms. The impact of last period’s GFAS on profit margin is
significant in small scale firms (Table 5.14b). Earlier, Strickland and Weiss (1976) have
found also this negative impact. So, the result is justified.
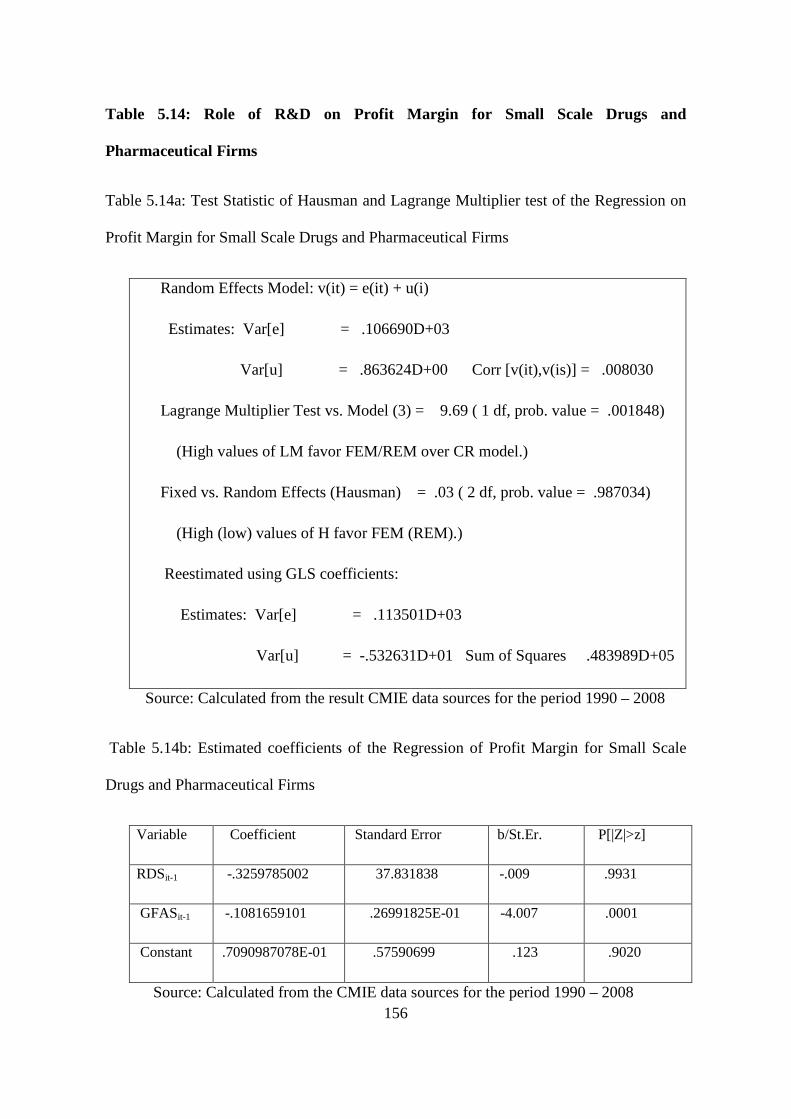
156
Table 5.14: Role of R&D on Profit Margin for Small Scale Drugs and
Pharmaceutical Firms
Table 5.14a: Test Statistic of Hausman and Lagrange Multiplier test of the Regression on
Profit Margin for Small Scale Drugs and Pharmaceutical Firms
Random Effects Model: v(it) = e(it) + u(i)
Estimates: Var[e] = .106690D+03
Var[u] = .863624D+00 Corr [v(it),v(is)] = .008030
Lagrange Multiplier Test vs. Model (3) = 9.69 ( 1 df, prob. value = .001848)
(High values of LM favor FEM/REM over CR model.)
Fixed vs. Random Effects (Hausman) = .03 ( 2 df, prob. value = .987034)
(High (low) values of H favor FEM (REM).)
Reestimated using GLS coefficients:
Estimates: Var[e] = .113501D+03
Var[u] = -.532631D+01 Sum of Squares .483989D+05
Source: Calculated from the result CMIE data sources for the period 1990 – 2008
Table 5.14b: Estimated coefficients of the Regression of Profit Margin for Small Scale
Drugs and Pharmaceutical Firms
Variable Coefficient Standard Error b/St.Er. P[|Z|>z]
RDSit-1 -.3259785002 37.831838 -.009 .9931
GFASit-1 -.1081659101 .26991825E-01 -4.007 .0001
Constant .7090987078E-01 .57590699 .123 .9020
Source: Calculated from the CMIE data sources for the period 1990 – 2008

157
An Aggregative and Comparative Analysis of the Role of R&D on different scale of
firms in Drugs and Pharmaceutical Industry
From the comparison Tables 5.15, it is found that R&D of the last period has a
significant positive impact on cost margin of the current period for large scale and
negative impact for medium scale firms. The pattern of R&D is different and that may due
to heterogeneous nature and different size and due to different financial strength. Large
scale firms are going for major innovation and medium and small scale firms are going for
minor innovation. For the industry as a whole, the impact of R&D is insignificant as most
of small scale and medium scale firms do not spend consistently on research and
development.
Table 5.15: Comparison of Role of R&D on Cost margin of different firms in Indian
Drugs and Pharmaceutical Industry
Firm’s size Constant RDSit-1 GFASit-1 Modela
Total .992
(1.25)
.008*
(8.49)
Fixed effect model
Large scale .756*
(25.02)
1.03*
(4.48)
-.053
(-1.06)
Random effect model
Medium scale
.763*
(47.11)
-.59***
(-1.69)
.020
(.478)
Random effect model
Small scale 2.29
(1.17)
.008*
(6.54)
Fixed effect model
Source: Calculated from the CMIE data sources for the period 1990 – 2008.
Note: Parentheses shows the t-values for the coefficient
* denotes the level of significance at 1% or less than 1% level of significance

158
a Fixed effect and Random effect model depends on the value of Hausman test statistics and Least Square Dummy variable (LSDV) and Least Square without Dummy variable (LSWDV) model depends on the value of LM test statistic.
GFAS of the last period will have a positive impact on Cost margin. Increase in
GFA implies that the company will go for purchasing more intangible assets, land,
building, plant and machinery which will ultimately increase the cost structure which is
theoretically justified (Table 5.15).
Table 5.16: Comparison of Role of R&D on Profit margin of different firms in Indian
Drugs and Pharmaceutical Industry
Firm’s size Constant RDSit-1 GFASit-1 Modela
Total -22.31
(-.88)
-.110*
(-3.08)
Random effect model
Large scale .146*
(7.62)
.322***
(1.71)
-.636***
(-1.64)
Random effect model
Medium scale
8.38*
(2.44)
6.81
(.078)
-26.01*
(-2.74)
OLS
Small scale .071
(.123)
-.325
(-.009)
-.11*
(-4.01)
Random effect model
Source: Calculated from the CMIE data sources for the period 1990 – 2008.
Note: Parentheses shows the t-values for the coefficient
*denotes the level of significance at 1% or less than 1% level of significance
**denotes the level of significance at 5% or less than 5% level of significance
Table 5.16 reveals the comparative analysis of the role of research and
development in the automobile industry. For the performance promoting role of R&D, it is
159
observed that last period’s R&D has a significant positive impact on profit margin only for
large scale firms in the industry. For other scale firms there is no significant impact of last
period’s R&D as the medium and small scale firms do not spend consistently due to lesser
financial strength. From the micro level study, it is observed that only large scale firms are
consistently emphasised on innovation and spend huge amount of money on research and
development; whereas medium scale firms and small scale firm are not consistent on that
part and that reflects on their impact.
As firms’ behaviours are different in the industry and that may due to different
nature and different size. The patterns of investment on their gross fixed assets are
different for different scale of firms. So, the immediate impacts of gross fixed asset on
profit are negative for some firms as per their motive of capturing more market share in
the long run. So, the impact of GFA on profit is justified which is also supported by the
past literature in Strickland and Weiss (1976).