CHAPTER 5 RESEARCH METHODOLOGY -...
39
CHAPTER 5 RESEARCH METHODOLOGY The sample for the study, research instruments, data collection and analysis, are discussed in detail in this chapter. The researcher accessed the internet and searched for these terms: Accounting Standards, International Accounting Standards, International Financial Reporting Standards and Generally Accepted Accounting Principles. Based upon the hits each relevant item was read and reviewed for its contribution to the research subject. 5.1. Research Design Research design indicates a plan of action to be carried out in connection with a proposed research work. The process of research design includes the selection of the research problem, the presentation of the problem, the formulation of hypothesis, conceptual clarity, methodology, and data collection, testing of the hypothesis, interpretation, presentation and the like. The study carried out with four different segregate based on the objectives of study and for each segregate different hypothesis has been designed and on that bases data was collected and analysed. 57
Transcript of CHAPTER 5 RESEARCH METHODOLOGY -...

CHAPTER 5
RESEARCH METHODOLOGY
The sample for the study, research instruments, data collection and analysis, are
discussed in detail in this chapter.
The researcher accessed the internet and searched for these terms: Accounting
Standards, International Accounting Standards, International Financial Reporting
Standards and Generally Accepted Accounting Principles. Based upon the hits each
relevant item was read and reviewed for its contribution to the research subject.
5.1. Research Design
Research design indicates a plan of action to be carried out in connection with a
proposed research work. The process of research design includes the selection of the
research problem, the presentation of the problem, the formulation of hypothesis,
conceptual clarity, methodology, and data collection, testing of the hypothesis,
interpretation, presentation and the like.
The study carried out with four different segregate based on the objectives of study
and for each segregate different hypothesis has been designed and on that bases data
was collected and analysed.
57
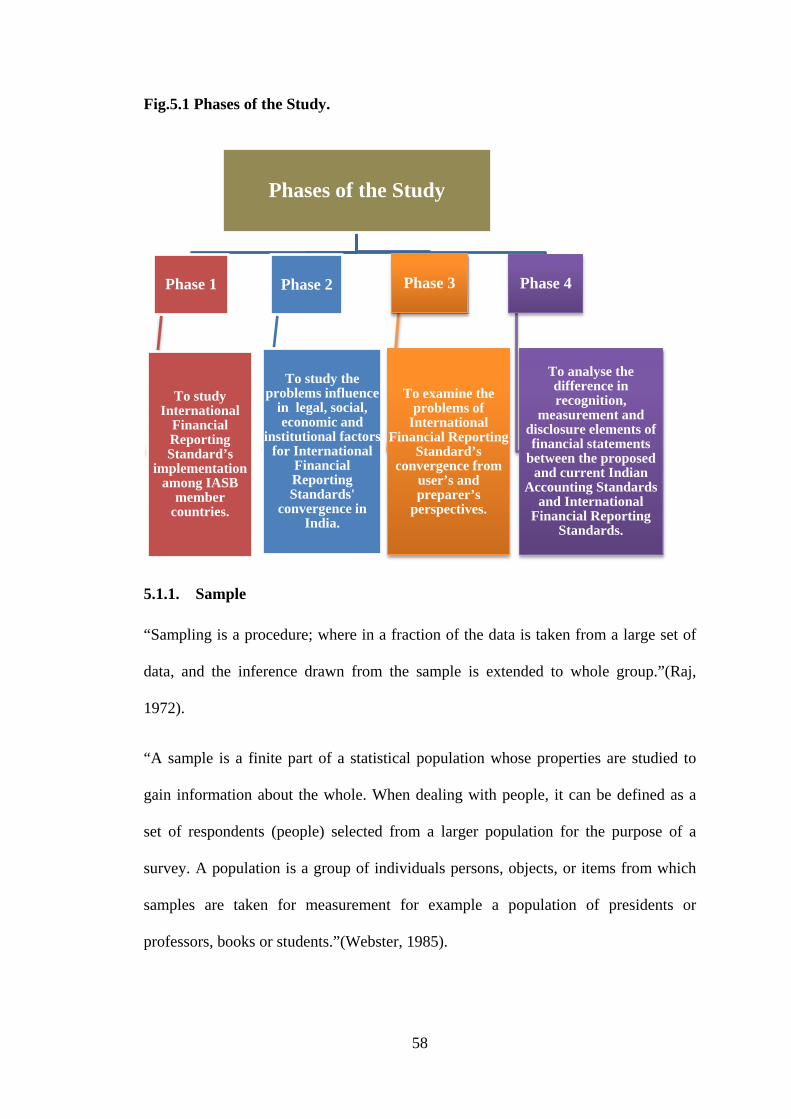
Fig.5.1 Phases of the Study.
5.1.1. Sample
“Sampling is a procedure; where in a fraction of the data is taken from a large set of
data, and the inference drawn from the sample is extended to whole group.”(Raj,
1972).
“A sample is a finite part of a statistical population whose properties are studied to
gain information about the whole. When dealing with people, it can be defined as a
set of respondents (people) selected from a larger population for the purpose of a
survey. A population is a group of individuals persons, objects, or items from which
samples are taken for measurement for example a population of presidents or
professors, books or students.”(Webster, 1985).
Phases of the Study
Phase 1
To study International
Financial Reporting Standard’s
implementation among IASB
member countries.
Phase 2
To study the problems influence
in legal, social, economic and
institutional factors for International
Financial Reporting Standards'
convergence in India.
Phase 3
To examine the problems of
International Financial Reporting
Standard’s convergence from
user’s and preparer’s
perspectives.
Phase 4
To analyse the difference in recognition,
measurement and disclosure elements of financial statements
between the proposed and current Indian
Accounting Standards and International
Financial Reporting Standards.
58

“A sample design is a definite plan for obtaining a sample from a given population. It
refers to the technique or the procedure the researcher would adopt in selecting items
for the sample. Sample design may as well lay down the number of items to be
included in the sample i.e., the size of the sample. Sample design is determined before
data are collected.”(Kothari, 2004).
The sample for this study was segregated into four phases according to previous
figure (Fig.5.1), first phase was IASB member countries, second phase deals with
problems influence in legal, social, economic and institutional factors for International
Financial Reporting Standards’ convergence in India third phase involved with
problems of International Financial Reporting Standards’ convergence from user’s
and preparer’s prospective and finally fourth phase refers to difference in recognition,
measurement and disclosure elements of financial statements between the proposed
and current Indian Accounting Standards and International Financial Reporting
Standards. Both primary and secondary data has been used in this study.
59

Fig.5.2 Phases of the Data Collections.
• Phase 1
5.2. Population of IASB Member Countries:
The Population of 123 IASB member countries are universe and it’s divided this in to
three parts converging countries, adopting countries and non adopting countries .It is a
qualitative data which is given directly in IASB web site and they are defined by
using of the designed questionnaire content of four factors of IFRS implementation.
The first factor was, commitment to global financial reporting standards which
consists of four questions, the second factor is jurisdiction for domestic companies
with debt or equity in public market which consists of six questions the third factor
refers to IFRS endorsement which consists of six questions and fourth factor is
translation of IFRS which consists of five questions. Thus twenty one questions are
formed in four parts.
SAMPLES
Phase 1 IASB Member
Countries N=100
Adpting Countries N=49
Converging Countries
N=41
Not-Adopting Countries
N=10
Phase 2 Respondents
N=384
Stakeholders N=384
Phase 3 Preparers & Users
N=385
Preparers N=200
Users N=185
Phase 4
IFRS/IND AS
IFRS/Indian GAAP
60

5.2.1. Sample of IASB Member Countries:
The frame consists of three categories; countries are in convergence process and
countries in adoption process and non-adopted countries. The sample 100 countries
has been selected for the study in three categories, sample of 49 countries in adoption
sample of 41 countries in convergence process and sample of 10 non-adopted
countries was select according to Morgan Sampling table based on judgment
sampling method.
Fig 5.3 Classification of IASB Member Countries:
IASB Member Countries
Adopting Countries
Converging Countries
Non-Adopting Countries
61

Table 5.1 The Sample of IASB Member Countries.
Countries
Sl.No Adopting Converging Non-Adopting
1. Chile Albania Bhutan
2. Costa-Rica Austria Brunei
Darussalam
3. Croatia China Cayman
4. Cyprus Colombia Egypt
5. Czech Republic Denmark Guinea
6. Dominican-Republic Ecuador Indonesia
7. El-Salvador Fiji Macao
8. Estonia Hungary Madagascar
9. Finland Iceland Thailand
10. France India Niger
11. Georgia Israel
12. Germany Japan
13. Ghana Liechtenstein
14. Greece Lithuania
15. Grenada Malaysia
16. Guatemala Malta
17. Honduras Mauritius
18. Hong Kong Mexico
19. Iraq Moldova
20. Ireland Mongolia
21. Italy Montserrat
22. Jamaica Myanmar
23. Kenya Netherlands
24. Korea New Zealand
25. Kosovo Norway
26. Latvia Pakistan
27. Lesotho Portugal
62

28. Luxembourg Romania
29. Macedonia Russia
30. Maldives Saudi Arabia
31. Oman Singapore
32. Paraguay Slovakia
33. Poland Switzerland
34. Rwanda Taiwan
35. Serbia Turkey
36. South Africa Uganda
37. Slovenia Ukraine
38. Spain United-Arab-Emirates
39. Sri Lanka United States of
America
40. St-Kitts-and-Nevis Uzbekistan
41. St-Lucia Venezuela
42. St-Vincent & the
Grenadi
43. Swaziland
44. Sweden
45. Tanzania
46. United Kingdom
47. Uruguay
48. Zambia
49. Zimbabwe
N 49 41 10
Total 100
(Source: Survey Data)
63

5.2.2. Adopting Countries:
IFRS began as an attempt to harmonize accounting across the European Union. But
the value of harmonization quickly made the concept attractive around the world,
IFRS adopted countries consist of 49 countries.
5.2.3. Converging Countries:
In general terms, ‘convergence’ means to achieve harmony with IFRSs; in precise
terms convergence can be considered “to design and maintain national accounting
standards in a way that financial statements prepared in accordance with national
accounting standards draw unreserved statement of compliance with IFRSs”. IFRS
converging countries consist of 41 countries.
5.2.4. Non- Adopting Countries:
Non-Adopting countries refers to those countries which are neither in convergence
nor in adoption countries and did not apply for global harmonization of their
accounting standards yet in formal way IFRS adopted countries consist of 10
countries.
Table 5.2 Sample of IASB Member Countries.
IASB member countries N %
Converging Countries 41 41%
Adoption Countries 49 49%
Non Adoption Countries 10 10%
Total 100 100%
(Source: Survey Data)
64

Fig.5.4 Sample of IASB Member Countries.
5.3. Sample of Individual Respondents
The sample of individual respondents was segregated into two phases. First phase is
the sample of individual respondents (stakeholders) and the second phase involved
with problems of International Financial Reporting Standards’ convergence from
user’s and preparer’s prospective.
Fig 5.5 Sample of Individual Respondents.
Converging 41%
Adoption 49%
Non Adoption 10%
Sample of Individual Respondents
Stakeholders N=384
Users & Preparers
Preparers N=200
Users N=185
65
• Phase 2
5.3.1. Sample of Individual Respondents(Stakeholders)
The sample of three hundred and eighty four individual respondents which are
involved with finance and accounting has been taken for the study out of 412
collected questionnaire according to Morgan’s sampling table. The samples of
respondents are consist of Charter Accountant, Finance Managers, Finance Officers,
Tax Managers and other prepares. The sample taken for the study by applying
convenience sampling method is based on Morgan table. Data was collected through a
structured survey using Dillman’s Total Design Method (1978).
Table 5.3, Sample of Stakeholders by Profession
Respondent by Profession N %
17. Accountant 65 16.93
18. Assistant Tax Manager 26 6.77
19. Assistant Accounts Officer 56 14.58
20. Assistant Budget Officer 3 0.78
21. Assistant Budget Programmer 1 0.26
22. Budget Officer 8 2.08
23. Charter Accountant 28 7.29
24. Chief Finance Officer 20 5.21
25. Direct Tax Deputy Manager 2 0.52
26. Finance Manager 18 4.69
27. Finance Officer 87 22.66
28. Finance Supervisor 9 2.34
29. Joint Secretary 1 0.26
30. Superintendent 1 0.26
31. Tax Consultant 31 8.07
32. Tax Manager 28 7.29
33. Total 384 100.00
(Source: Survey Data)
66

As seen in the table 5.6, 16 group of professional respondents, respond to the
questionnaire and they has been selected according to Morgan table based on
convenience sampling method.
Fig 5.6 Sample of Stakeholders by Profession
From the above table 5.6, it has been seen that the sample consisted of 384
respondents from 16 professional financial jobs.
17%
7%
15%
1% 0%
2%
7% 5%
1%
5%
23%
2%
0% 0% 8% 7%
Accountant
Assistant Tax Manager
Assistant Accounts Officer
Assistant Budget Officer
Assistant Budget Programmer
Budget Officer
CA
Chief Finance Officer
Direct Tax Deputy Manager
Finance Manager
Finance Officer
Finance Supervisor
Joint Secretary
Superintendent
Tax Consultant
Tax Manager
67

• Sample of Stakeholders by Region
Sample of 384 Stakeholders has been selected and it covers most of Indians’ region.
Table 5.4 Sample of Respondent by Region.
Respondent by Region N %
1. Ahmedabad 10 2.60 2. Assam 5 1.30 3. Bangalore 17 4.43 4. Baroda 1 0.26 5. Chandigarh 10 2.60 6. Chennai 13 3.39 7. Chhattisgarh 1 0.26 8. Coimbatore 3 0.78 9. Cuttack 6 1.56 10. Delhi 85 22.14 11. Ernakulam 20 5.21 12. Goa 1 0.26 13. Gujarat 2 0.52 14. Gwalior 8 2.08 15. Himachal Pradesh 3 0.78 16. Hyderabad 34 8.85 17. Jaipur 18 4.69 18. Jharkhand 7 1.82 19. Kanpur 22 5.73 20. Kolkata 25 6.51 21. Mumbai 59 15.36 22. Patna 15 3.91 23. Pune 16 4.17 24. Shillong 3 0.78 Total 384 100.00 (Source: Survey Data)
As per table 5.4, 24 regions were selected by researcher for coverage of study. Hence
Morgan sampling table was used to select samples.
68

Fig 5.7 Sample of Stakeholders by Region.
From the above table 5.6 it has been seen that the sample consists of 24 regions from
different parts and states of India. Among all regions, Delhi with 22.14 % was the
highest respondent rank.
• Sample of Individual Respondents (Stakeholders) by Sex
The following table 5.5 gives the classifications of Sample of Respondents by Sex
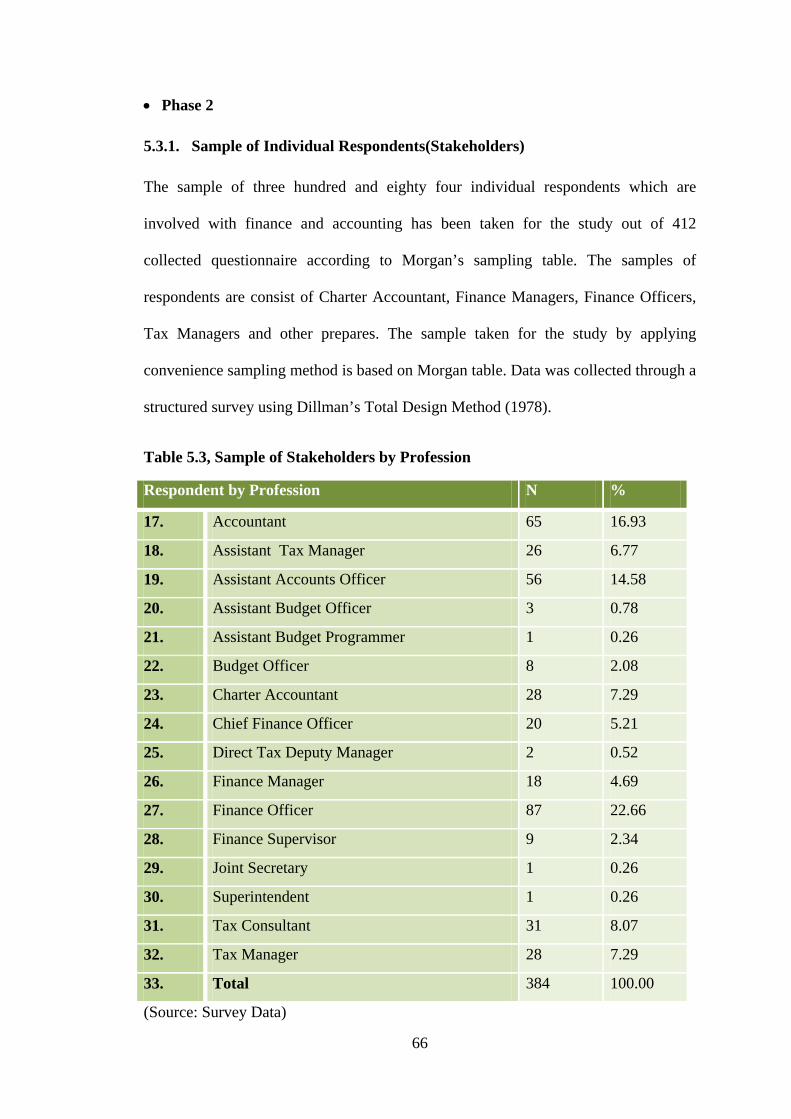
Table 5.5 Sample of Stakeholders by Sex.
Sex N %
Female 41 10.68
Male 343 89.32
TOTAL 384 100
(Source: Survey Data)
3% 1%
4% 0% 3% 3%
0% 1%
2%
22%
5%
0% 1%
2% 1%
9% 5%
2%
6%
7%
15%
4% 4%
1%
Ahmedabad
Assam
Bangalore
Baroda
Chandigarh
Chennai
Chhattisgarh
Coimbatore
Cuttack
Delhi
Ernakulam
Goa
Gujarat
Gwalior
Himachal Pradesh
69
Fig.5.8 Sample of Stakeholder by Sex.
From the above table 5.8 it has been seen that the sample is consist of 384
respondents’; 41 female which are 11% and 343 male which are 89% of the
respondents.
• Phase 3
5.4. Sample of Users and Preparers
The sample was stratified on the bases of users and preparers. Three hundred and
eighty five individual respondents were taken for the study according to Morgan
sampling table. The sample of preparers consists of 200 members and sample of user
consists of 185 members. The sample taken for the study by applying convenience
sampling method based on Morgan table. Data was collected through a structured
survey using Dillman’s Total Design Method (1978).
11%
89%
F
M
70

• Preparers
Table 5.6 Sample of Preparers by Profession.
Sample of Preparers by Profession N %
1. Accountant 21 10.5
2. Assistant Accounts Officer 2 1
3. Assistant Budget Officer 2 1
4. Assistant Tax Manager 23 11.5
5. Accounts Officer 46 23
6. Budget Officer 10 5
7. Charter Accountant 18 9
8. Chief finance officer 1 0.5
9. Direct Tax Deputy Manager 2 1
10. Finance Manager 4 2
11. Finance Officer 22 11
12. Tax Consultant 25 12.5
13. Tax Manager 24 12
Total 200 100
(Source: Survey Data)
As seen in the above table sample of respondent by profession, it could be seen that
the total number of 13 groups of professional respondent. They responded to the
questionnaire and they have been selected according to Morgan table based on
convenience sapling method.
71
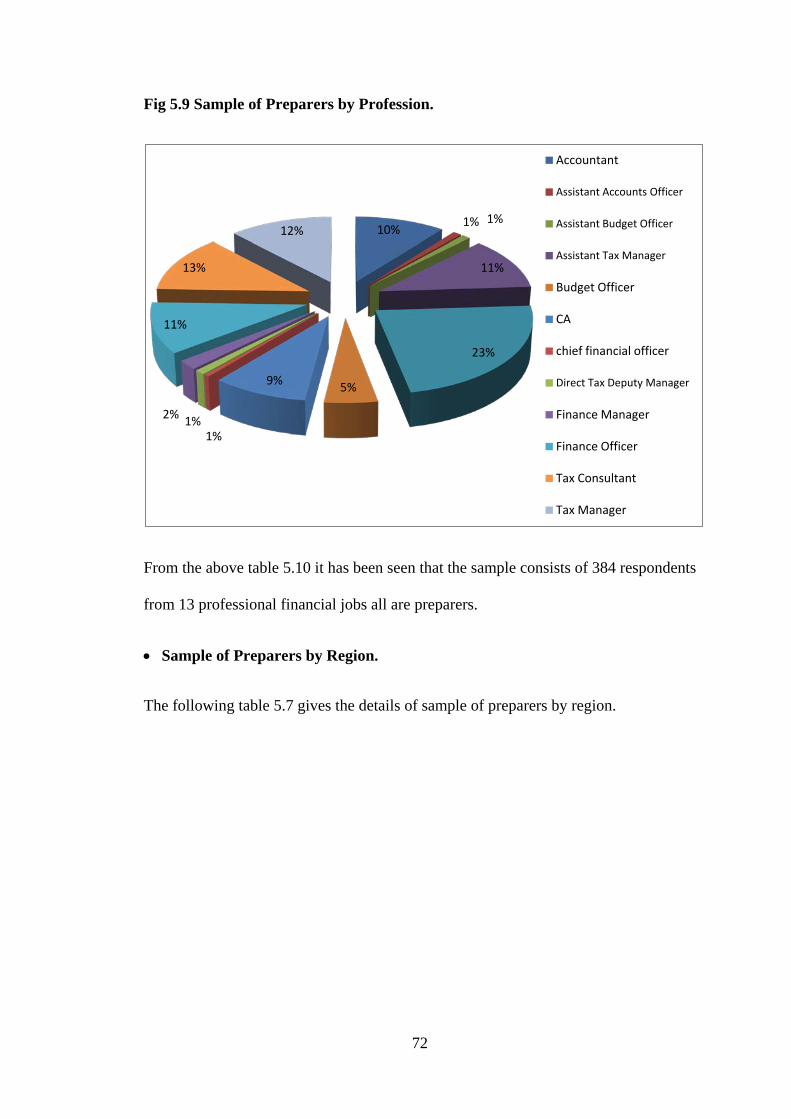
Fig 5.9 Sample of Preparers by Profession.
From the above table 5.10 it has been seen that the sample consists of 384 respondents
from 13 professional financial jobs all are preparers.
• Sample of Preparers by Region.
The following table 5.7 gives the details of sample of preparers by region.
10% 1% 1%
11%
23%
5% 9%
1% 1% 2%
11%
13%
12%
Accountant
Assistant Accounts Officer
Assistant Budget Officer
Assistant Tax Manager
Budget Officer
CA
chief financial officer
Direct Tax Deputy Manager
Finance Manager
Finance Officer
Tax Consultant
Tax Manager
72

Table 5.7 Sample of Preparers by Region.
Respondent by Region N %
1. Andhra Pradesh 19 9.5
2. Assam 4 2
3. Bihar 16 8
4. Chhattisgarh 8 4
5. Delhi 10 5
6. Gujarat 21 10.5
7. Haryana 2 1
8. Jharkhand 6 3
9. Karnataka 10 5
10. Kerala 17 8.5
11. Maharashtra 32 16
12. Mizoram 2 1
13. Nagaland 2 1
14. Odisha 2 1
15. Orissa 1 0.5
16. Puducherry 1 0.5
17. Punjab 9 4.5
18. Rajasthan 4 2
19. Tamil Nadu 7 3.5
20. Tripura 2 1
21. Uttar Pradesh 11 5.5
22. Uttarakhand 2 1
23. West Bengal 12 6
Total 200 100
(Source: Survey Data)
As presented in table 5.7, the samples of respondents are from 23 regions. The regions
cover most part of India. Here also Morgan table was the bases of selection of region
to represent in total sample.
73

Fig. 5.10 Sample of Preparers by Region.
From the above table 5.10, it has been seen that the sample consisted of 23 regions
from different parts and states of India. Among all regions Maharashtra with 16% was
the highest respondent in the list.
• Sample of Preparers by Sex
The following table 5.8 gives the details of Sample of Respondents by sex.
Table 5.8 Sample of Preparers by Sex.
Sex N %
Female 13 6.50
Male 187 93.50
TOTAL 200 100
(Source: Survey Data)
10%
2%
8%
4% 5% 11%
1% 3%
5%
9%
16%
1% 1%
1% 1%
1%
5% 2%
4% 1%
6% 1%
6%
Andhra Pradesh Assam
Bihar
Chhattisgarh
Delhi
Gujarat
Haryana
Jharkhand
Karnataka
Kerala
Maharashtra
Mizoram
Nagaland
Odisha
Orissa
74
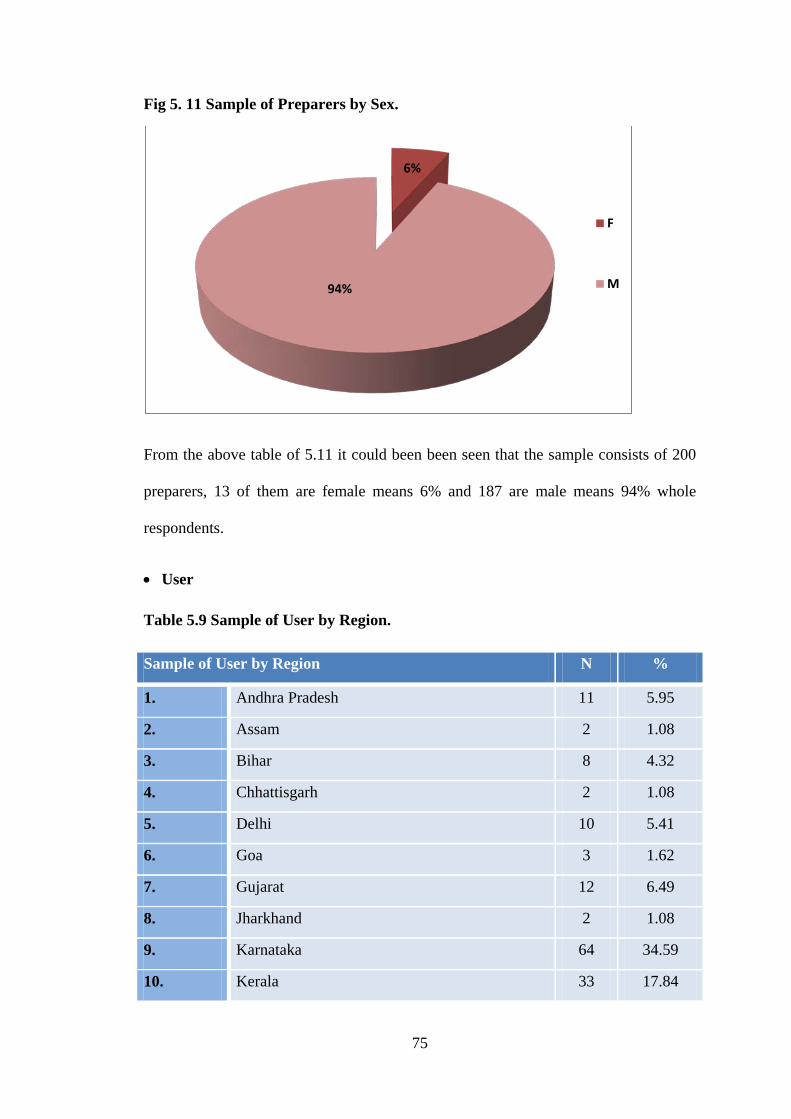
Fig 5. 11 Sample of Preparers by Sex.
From the above table of 5.11 it could been been seen that the sample consists of 200
preparers, 13 of them are female means 6% and 187 are male means 94% whole
respondents.
• User
Table 5.9 Sample of User by Region.
Sample of User by Region N %
1. Andhra Pradesh 11 5.95
2. Assam 2 1.08
3. Bihar 8 4.32
4. Chhattisgarh 2 1.08
5. Delhi 10 5.41
6. Goa 3 1.62
7. Gujarat 12 6.49
8. Jharkhand 2 1.08
9. Karnataka 64 34.59
10. Kerala 33 17.84
6%
94%
F
M
75
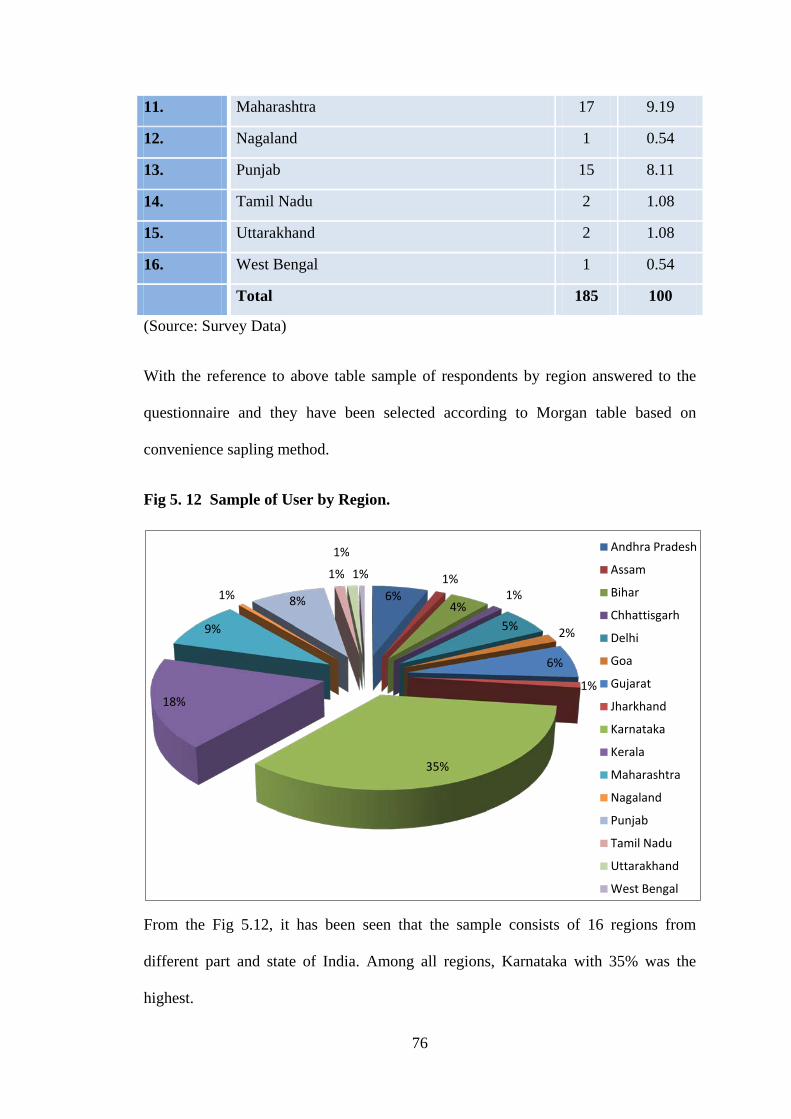
11. Maharashtra 17 9.19
12. Nagaland 1 0.54
13. Punjab 15 8.11
14. Tamil Nadu 2 1.08
15. Uttarakhand 2 1.08
16. West Bengal 1 0.54
Total 185 100
(Source: Survey Data)
With the reference to above table sample of respondents by region answered to the
questionnaire and they have been selected according to Morgan table based on
convenience sapling method.
Fig 5. 12 Sample of User by Region.
From the Fig 5.12, it has been seen that the sample consists of 16 regions from
different part and state of India. Among all regions, Karnataka with 35% was the
highest.
6% 1%
4% 1%
5% 2%
6%
1%
35%
18%
9%
1% 8%
1%
1%
1%
Andhra Pradesh
Assam
Bihar
Chhattisgarh
Delhi
Goa
Gujarat
Jharkhand
Karnataka
Kerala
Maharashtra
Nagaland
Punjab
Tamil Nadu
Uttarakhand
West Bengal
76

Sample of User by Sex
The following table 5.10 gives the details of Sample of Users by Sex.
Table 5.10 Sample of User by Sex.
Sex N %
Female 49 26.49
Male 136 73.51
TOTAL 200 100
(Source: Survey Data)
Fig 5. 13 Sample of User by Sex
From the above table 5.13 it has been seen that the sample consisted of 185 users’, 49
are female, means (26%) and 136 are male means (74%).
26%
74%
F
M
77

• Phase 4
5.5. Difference in recognition, measurement and disclosure elements of financial
statements between the proposed Indian Accounting Standards, current
accounting standards and International Financial Reporting Standards
Today, in India, process of convergence with International Financial Reporting
Standards is going on. Hence new accounting standards proposed with the name of
Ind-AS, which is slightly different from International Financial Reporting Standards
as well as Indian GAAP are currently used as accounting standards which is
according to the study has more differences with International Financial Reporting
Standards in compare to Ind-AS.
To analyse the difference in recognition, measurement and disclosure elements of
financial statements between the proposed and current Indian Accounting Standards
and International Financial Reporting Standards’ secondary data has been used and
accounting standards was directly given in ICAI and IFRS web site.
78

Table 5.11 Differences between Proposed Indian Accounting Standards, Current Accounting Standards and International Financial
Reporting Standards.
IFRS Indian GAAP Ind AS
1.Framework for the Preparation and Presentation of Financial Statements
Framework for the Preparation and Presentation of Financial Statements Disclosure of Accounting Policies
Framework for the Preparation and Presentation of Financial Statements
IAS 1 provides all are requirements for the presentation of financial statements.
Based on Indian GAAP Companies Act requires preparation of: 1. Balance Sheet, 2. Profit and Loss Account, 3. Notes to Accounts.
Similar to IFRS with some exception.
1.1.Presentation of Financial Statements based on historical cost or fair valuation
IFRS worked based on fair valuation
Indian GAAP work based on historical cost.
Similar to IFRS
1.2. Presentation of Financial Statements - formats
Books of account should be prepared only on introduced formats given by IASB.
Based on Indian GAAP but there is chance to use IFRS as well.
Such thing does not exist in Ind-AS 1.
1.3.Presentation of Financial Statements – classification of financial liabilities under refinancing arrangements
Refinance arrangements or reschedule payments on a long-term basis is completed after the end of the reporting period.
Refinance arrangements does not exist in Indian GAAP.
Similar to IFRS.
79

1.4.Presentation of Financial Statements - classification of financial liabilities upon breach of covenants
Non-current if the loaner has united before the tip of the coverage amount to supply a grace amount of minimum 12 months once the coverage amount inside that the breach may be corrected and therefore the loaner cannot demand immediate reimbursement.
Based on Indian GAAP it does not exist.
Similar to IFRS.
1.5.Presentation of Financial Statements - statement of comprehensive income
All income items as well as expense items are included.
Profit and loss is based on Indian GAAP and also equivalent of separate income statement under IFRS.
All companies and industries required to show all items of income and expense in a one set of statement of profit and loss.
1.6.Presentation of Financial Statements - statement of changes in equity
A statement of changes in equity is given showing (a) the overall comprehensive financial gain for the amount (b) effects of retrospective application or statement on every element of equity (c) for every element of equity, a reconciliation between opening and closing balances.
Based on Indian GAAP it does not exist.
Similar to IFRS. .
1.7.Presentation of Financial Statements - reclassification
While comparative figures are Reclassified then, nature, amount and reason of changes should be disclosed.
A revelation is created in monetary statements that comparative amounts are reclassified to adapt to the presentation within the current amount while not extra disclosures for the character, quantity and reason for assortment.
Similar to IFRS.
1.8.Presentation of Financial Statements - critical judgment
While management in applying accounting policies then disclosure of critical judgments made by Requires.
Based on Indian GAAP it does not exist.
Similar to IFRS
80
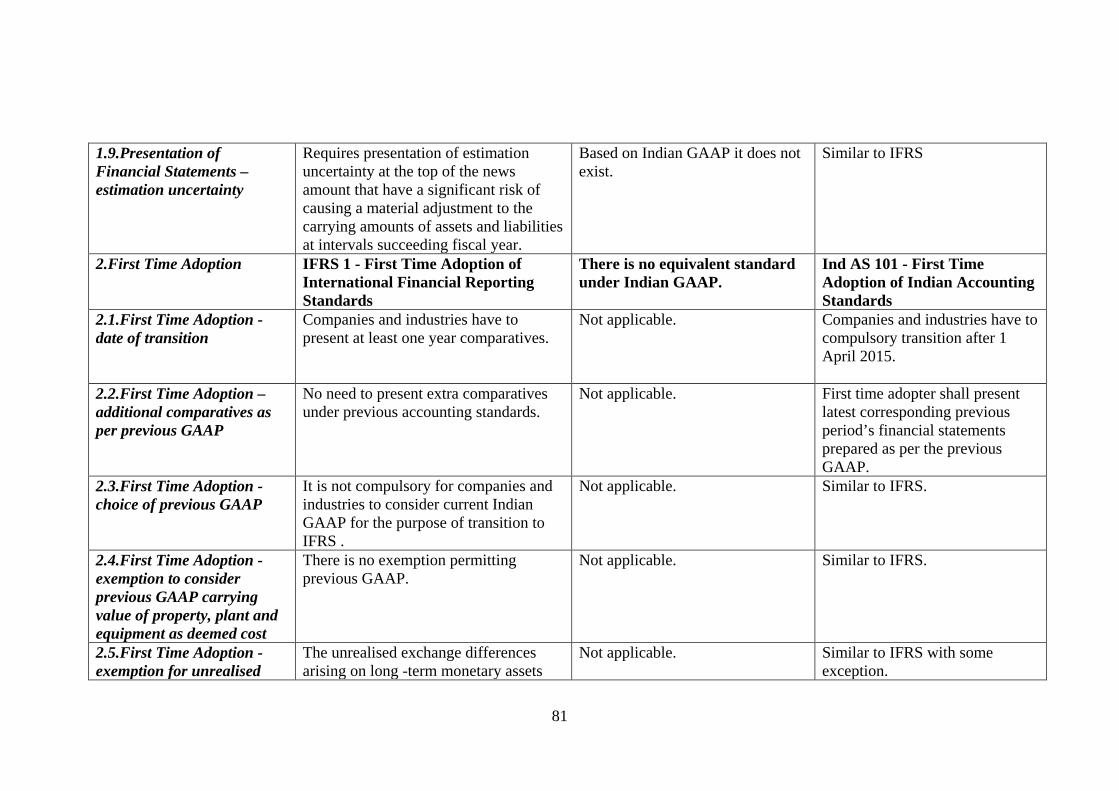
1.9.Presentation of Financial Statements – estimation uncertainty
Requires presentation of estimation uncertainty at the top of the news amount that have a significant risk of causing a material adjustment to the carrying amounts of assets and liabilities at intervals succeeding fiscal year.
Based on Indian GAAP it does not exist.
Similar to IFRS
2.First Time Adoption IFRS 1 - First Time Adoption of International Financial Reporting Standards
There is no equivalent standard under Indian GAAP.
Ind AS 101 - First Time Adoption of Indian Accounting Standards
2.1.First Time Adoption - date of transition
Companies and industries have to present at least one year comparatives.
Not applicable. Companies and industries have to compulsory transition after 1 April 2015.
2.2.First Time Adoption – additional comparatives as per previous GAAP
No need to present extra comparatives under previous accounting standards.
Not applicable. First time adopter shall present latest corresponding previous period’s financial statements prepared as per the previous GAAP.
2.3.First Time Adoption - choice of previous GAAP
It is not compulsory for companies and industries to consider current Indian GAAP for the purpose of transition to IFRS .
Not applicable. Similar to IFRS.
2.4.First Time Adoption - exemption to consider previous GAAP carrying value of property, plant and equipment as deemed cost
There is no exemption permitting previous GAAP.
Not applicable. Similar to IFRS.
2.5.First Time Adoption - exemption for unrealised
The unrealised exchange differences arising on long -term monetary assets
Not applicable. Similar to IFRS with some exception.
81

foreign currency exchange differences on long-term monetary assets and liabilities
and liabilities are recognised immediately in profit or loss.
2.6.First Time Adoption - exemption from retrospective application of effective interest method and impairment requirements
There is no exemption from retrospective application of effective interest technique or the impairment needs for money instruments.
Not applicable. Similar to IFRS with some exception.
2.7.First Time Adoption - non-current assets held for sale and discontinued operations
No exemption in respect of non-current assets held for sale and discontinued operations.
Not applicable. Similar to IFRS with some exception.
2.8.First Time Adoption - reconciliations
IFRS needs reconciliations for gap equity, total comprehensive financial gain, income statement and shutting equity for the comparative amount to clarify the transition to IFRS from previous accumulation
Not applicable. similar to IFRS
3. Share-based Payment
IFRS 2 - Share-based Payment There is no equivalent standard. Ind AS 102 - Share-based Payment
3.1.Share-based Payment - recognition
Recognise as the expense over the vesting amount. Product and services in a very share based mostly payment group action area unit recognised once product area unit received or as services area unit rendered.
Similar to IFRS. Similar to IFRS.
82
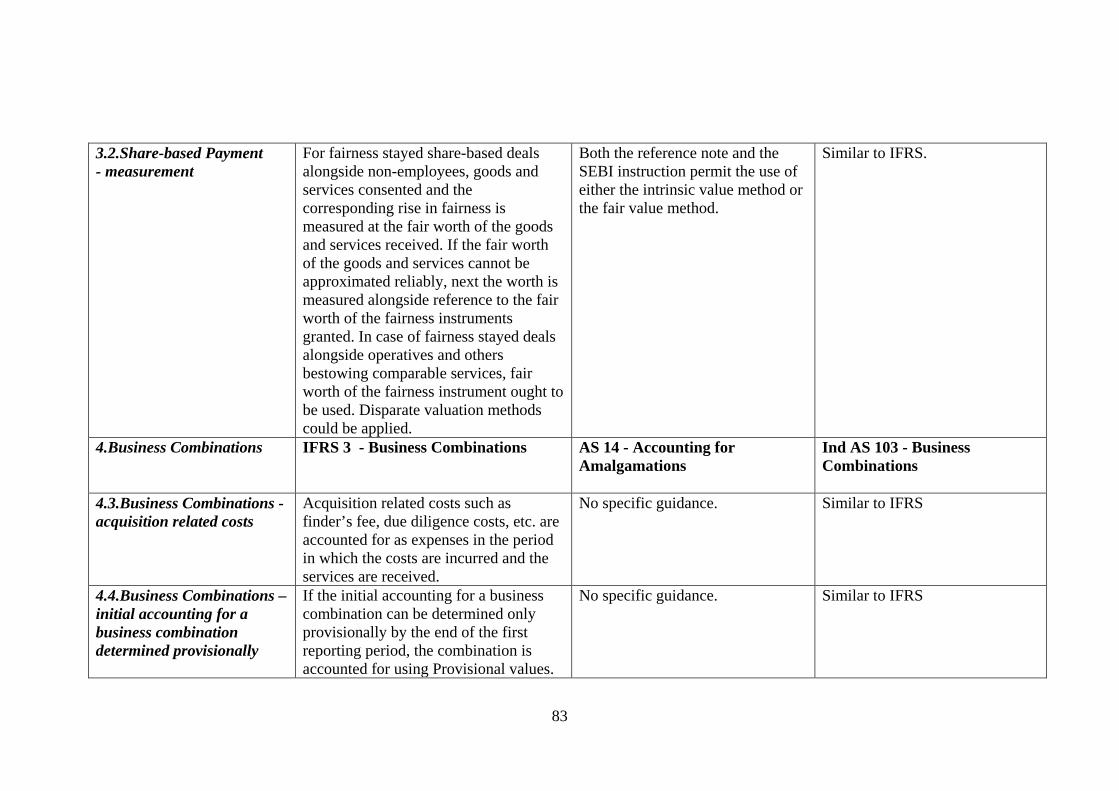
3.2.Share-based Payment - measurement
For fairness stayed share-based deals alongside non-employees, goods and services consented and the corresponding rise in fairness is measured at the fair worth of the goods and services received. If the fair worth of the goods and services cannot be approximated reliably, next the worth is measured alongside reference to the fair worth of the fairness instruments granted. In case of fairness stayed deals alongside operatives and others bestowing comparable services, fair worth of the fairness instrument ought to be used. Disparate valuation methods could be applied.
Both the reference note and the SEBI instruction permit the use of either the intrinsic value method or the fair value method.
Similar to IFRS.
4.Business Combinations
IFRS 3 - Business Combinations AS 14 - Accounting for Amalgamations
Ind AS 103 - Business Combinations
4.3.Business Combinations - acquisition related costs
Acquisition related costs such as finder’s fee, due diligence costs, etc. are accounted for as expenses in the period in which the costs are incurred and the services are received.
No specific guidance. Similar to IFRS
4.4.Business Combinations – initial accounting for a business combination determined provisionally
If the initial accounting for a business combination can be determined only provisionally by the end of the first reporting period, the combination is accounted for using Provisional values.
No specific guidance. Similar to IFRS
83
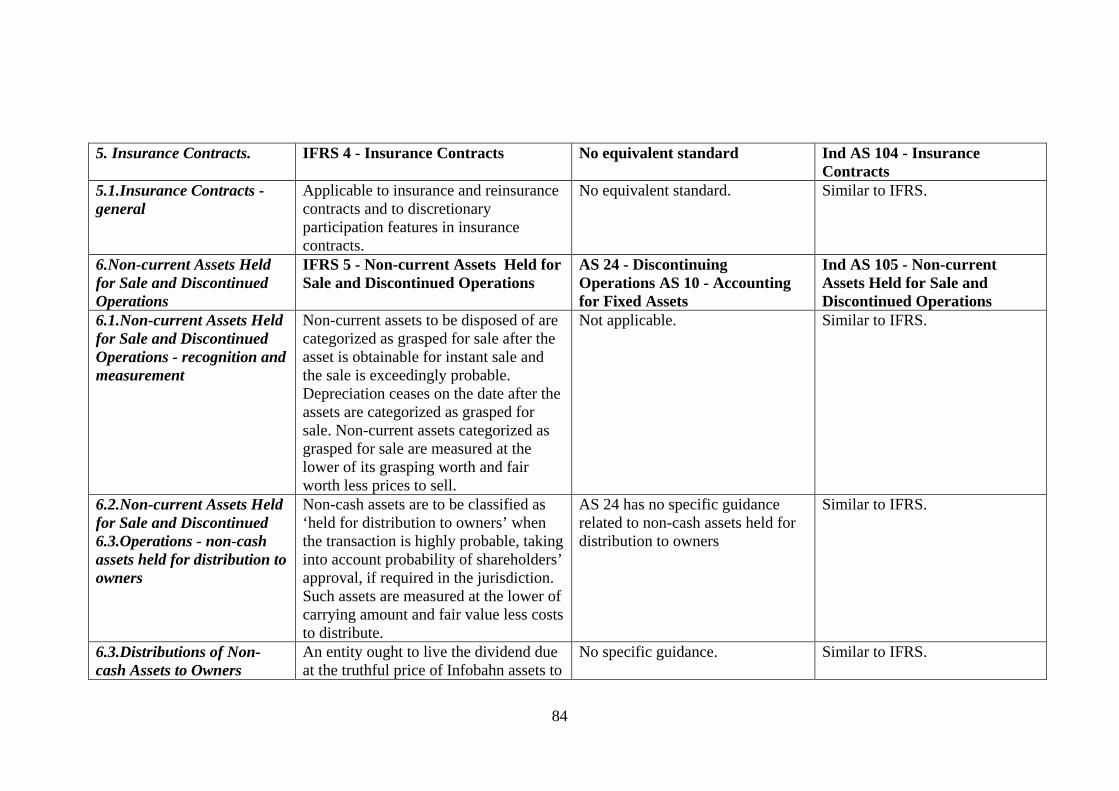
5. Insurance Contracts. IFRS 4 - Insurance Contracts No equivalent standard Ind AS 104 - Insurance Contracts
5.1.Insurance Contracts - general
Applicable to insurance and reinsurance contracts and to discretionary participation features in insurance contracts.
No equivalent standard. Similar to IFRS.
6.Non-current Assets Held for Sale and Discontinued Operations
IFRS 5 - Non-current Assets Held for Sale and Discontinued Operations
AS 24 - Discontinuing Operations AS 10 - Accounting for Fixed Assets
Ind AS 105 - Non-current Assets Held for Sale and Discontinued Operations
6.1.Non-current Assets Held for Sale and Discontinued Operations - recognition and measurement
Non-current assets to be disposed of are categorized as grasped for sale after the asset is obtainable for instant sale and the sale is exceedingly probable. Depreciation ceases on the date after the assets are categorized as grasped for sale. Non-current assets categorized as grasped for sale are measured at the lower of its grasping worth and fair worth less prices to sell.
Not applicable. Similar to IFRS.
6.2.Non-current Assets Held for Sale and Discontinued 6.3.Operations - non-cash assets held for distribution to owners
Non-cash assets are to be classified as ‘held for distribution to owners’ when the transaction is highly probable, taking into account probability of shareholders’ approval, if required in the jurisdiction. Such assets are measured at the lower of carrying amount and fair value less costs to distribute.
AS 24 has no specific guidance related to non-cash assets held for distribution to owners
Similar to IFRS.
6.3.Distributions of Non-cash Assets to Owners
An entity ought to live the dividend due at the truthful price of Infobahn assets to
No specific guidance. Similar to IFRS.
84

be distributed. The liability ought to be remeasured at every news date and at settlement, with changes recognised directly in equity. The distinction between the dividend paid and also the carrying quantity of Infobahn assets distributed ought to be recognised in profit or loss and may be disclosed severally. Further disclosures ought to be created, if Infobahn assets being command for distribution to homeowners meet the definition of a discontinued operation.
7.Exploration for and Evaluation of Mineral Resources
IFRS 6 - Exploration for and Evaluation of Mineral Resources
No equivalent standard. . Ind AS 106 - Exploration for and Evaluation of Mineral Resources
7.1.Exploration for and Evaluation of Mineral Resources - general
Exploration and analysis assets area unit measured at price or review less accumulated amortisation and impairment loss. AN entity determines the policy specifying that expenditure is recognised as exploration and analysis plus.
As per the steerage note, there area unit 2 various strategies for accounting for acquisition, exploration and development prices, viz. the victorious Efforts technique or the complete price technique. The steerage note recommends the victorious Efforts technique.
Similar to IFRS.
8.Financial Instruments: Disclosures
IFRS 7 &9 Financial Instruments: Disclosures
AS 32 - Financial Instruments: Disclosures
Ind AS 107 & 39 - Financial Instruments: Disclosures
85
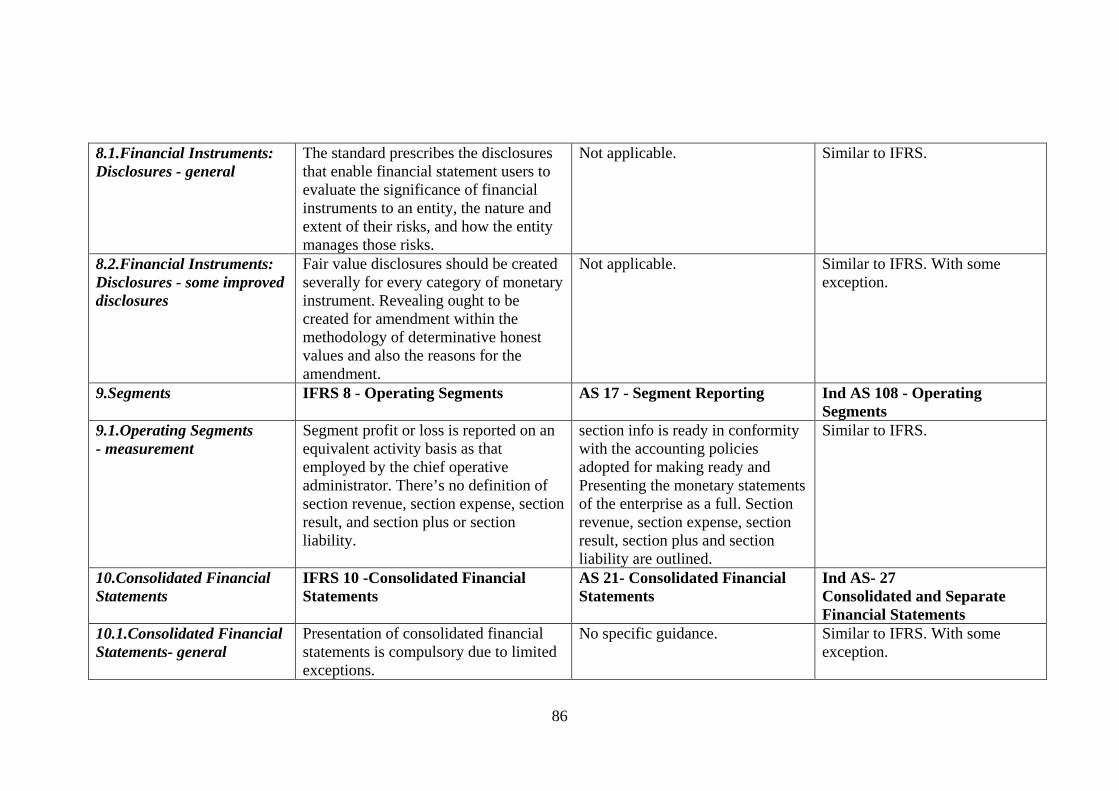
8.1.Financial Instruments: Disclosures - general
The standard prescribes the disclosures that enable financial statement users to evaluate the significance of financial instruments to an entity, the nature and extent of their risks, and how the entity manages those risks.
Not applicable. Similar to IFRS.
8.2.Financial Instruments: Disclosures - some improved disclosures
Fair value disclosures should be created severally for every category of monetary instrument. Revealing ought to be created for amendment within the methodology of determinative honest values and also the reasons for the amendment.
Not applicable. Similar to IFRS. With some exception.
9.Segments
IFRS 8 - Operating Segments AS 17 - Segment Reporting Ind AS 108 - Operating Segments
9.1.Operating Segments - measurement
Segment profit or loss is reported on an equivalent activity basis as that employed by the chief operative administrator. There’s no definition of section revenue, section expense, section result, and section plus or section liability.
section info is ready in conformity with the accounting policies adopted for making ready and Presenting the monetary statements of the enterprise as a full. Section revenue, section expense, section result, section plus and section liability are outlined.
Similar to IFRS.
10.Consolidated Financial Statements
IFRS 10 -Consolidated Financial Statements
AS 21- Consolidated Financial Statements
Ind AS- 27 Consolidated and Separate Financial Statements
10.1.Consolidated Financial Statements- general
Presentation of consolidated financial statements is compulsory due to limited exceptions.
No specific guidance. Similar to IFRS. With some exception.
86

10.2.Consolidation of Special purpose entities (SPE)
Consolidated where the substance of the relationship indicates control.
No specific guidance. Similar to IFRS
10.3.Employee share (stock) trusts
Consolidated where substance of relationship indicates control (SIC-12 Model). Entity’s own shares held by an employee share trust are accounted for as treasury shares.
Employee share trusts are not consolidated
Similar to IFRS
11.Joint Ventures IFRS 11 -Joint Arrangements AS 27- Financial Reporting of Interests in Joint Ventures
Ind AS- 31 Interests in Joint Ventures
11.1.Presentation of jointly controlled entities (joint ventures)
Both proportional consolidation and equity method permitted.
In consolidated financials: proportional consolidation is used. In standalone financials: at cost less impairment
Similar to IFRS
87

5.6. RESEARCH INSTRUMENT AND STATISTICAL TOOLS
In this research both primary and secondary data has been used. Four different
questionnaires, designed for the purpose of collecting primary and secondary data
according to research objectives administrated on respondents.
In this research different statistical technique has been used both descriptive and
inferential statistics applied with different technique like one sample t-test, ANOVA
analysis, Binomial test with coverage of Z-proportion test , karlpearson coefficient of
correlation, mean analysis and variance analysis with the help of SPSS package and
Microsoft excel.
5.6.1 IASB Member Countries Questionnaire
IASB member countries questionnaire was designed to obtain differences in
International Financial Reporting Standards’ implementation among IASB countries.
Collected data are given directly in IASB web site. The designed questionnaire
contains four factors of IFRS implementation. The first factor was commitment to
global financial reporting standards which consists of four questions. The second
factor is jurisdiction for domestic companies with debt or equity in public market. It is
consists of six questions. Third factor refers to IFRS endorsement which consists of
six questions and the fourth factor is translation of IFRS which consists of five
questions. Totally twenty one questions in four part were administrated. Three point
scale method has been used. The scale 2 represents “Yes”, the scale 1 represents “Yes
with Explained exception” and the scale zero represent “NO”.
88
5.6.2 Influence of Legal, Social, Economic and Institutional Factor for IFRS
Convergence in India.
Questionnaire has been prepared to examine the Influence of legal, social, economic
and institutional factors for International Financial Reporting Standards’ convergence
in India. This Questionnaire consists of 26 questions divided into 4 parts. First part
consists of seven questions, second part consists of six questions, third part consists of
six questions and fourth part consists of seven. Data has been collected through a
structured survey, using Dillman’s total design method (1978).
Five point “Likert scale”, method have been used the scale 4 represent “Very
Important”, the scale 3 represent “Important” scale 2 represent “Neutral”, scale 1
represent “Slightly Important” and the scale zero represent “Not Important”.
5.6.3 Problem of International Financial Reporting Standards’ Convergence
from User’s and Preparer’s Prospective.
To examine the problems for International Financial Reporting Standards’
convergence among users and preparers two separate questionnaire has been designed
for each group. Preparer’s questionnaire consists of 33 questions fewer than 17 factors
which concentrated on main differences between Indian accounting standards’ and
IFRS. User’s questionnaire consist of 18 questions under 4 factors which concentrated
on main problems of user due to convergence with IFRS in India like; issues
contributing to relevance in India over the convergence with IFRS, issues contribute
to availability, issues contribute to understandability and issues contribute to
comparability. Data have been collected through a structured survey using Dillman’s
total design method (1978). five point “Likert scale”, method has been used. The scale
4 represent “Very Difficult”, the scale 3 represent “Difficult”, scale 2 represent
“Neutral”, scale 1 represent “Slightly Difficult” and the scale zero represent “Not
Difficult”.
89

5.6.4 Difference in Recognition, Measurement and Disclosure Elements of
Financial Statements between the Proposed Indian Accounting
Standards, Current Accounting Standards and International Financial
Reporting Standards.
To consider difference in recognition, measurement and disclosure, elements of
financial statements between the proposed Indian Accounting Standards, current
Accounting Standards and International Financial Reporting Standards, current
Accounting Standards and Ind-AS has taken from ICAI website and IFRS has taken
from IASB website. Three point scales have been used; the scale 3 represent “Similar
to IFRS”, the scale 2 represent “Similar to IFRS with exception” and the scale 1
represent “Not Similar to IFRS”.
5.7. Data Collection and Analysis
The study was based on both primary and secondary data.
I. Secondary data.
Secondary data consist of two phases:
• A part of secondary data is given directly in International Accounting Standards
board (IASB) website. Totally there are one hundred and twenty three countries
listed in IASB website and based on Morgan’s table minimum of ninety three
samples are required. Total number of hundred countries in adopting, converging
and non-adopting has been selected. The data were collected through questionnaire
method. To measure the level of implementation of IFRS in IASB member
countries questionnaire was filled with three point scale method. Reliability of the
questionnaire was tested by using Cronbach’s Alpha in SPSS. Countries have been
selected according to judgment sampling method.
90

• Second part of secondary data is accounting standards given directly in Institute of
Chartered Accountants of India (ICAI) and International Accounting Standards
board (IASB) website , all IFRSs compared with proposed Indian Accounting
Standards’ and current Accounting Standards’.
Table 5.12, Reliability Analysis for Implantation of IFRS among IASB Member
Countries.
Factors Cronbach's
Alpha
1. Commitment to Global Financial Reporting Standards .858
2. Domestic Companies Securities Trade in a Public Market. .850
3. IFRS Endorsement .857
4. Translation of IFRSS .860
Overall .855
According to above table it could be observed that reliability of the questionnaire is
more than 0.85 in all cases for instance in case of commitment to global financial
reporting standards reliability is 0.858, for domestic companies whose debt or equity
securities trade in a public market in the jurisdiction is 0.850, IFRS endorsement is
0.857, translation of IFRS is 0.860 and in Overall reliability is 0.855.
II. Primary Data
The primary data also consist of two phases:
• First segregate of primary data was collected through questionnaire method to
measure the problems influence in legal, social, economic and institutional factors
over convergence with IFRS in India. Questionnaires were distributed to
stakeholders after doing pilot study and analysing reliability by using Cronbach’s
91
Alpha in SPSS. Questionnaire distributes to respondents according to Dillman’s
method. 412 questionnaires were collected and according to Morgan’s sampling.
Table 384 respondents were selected according to judgment sampling method.
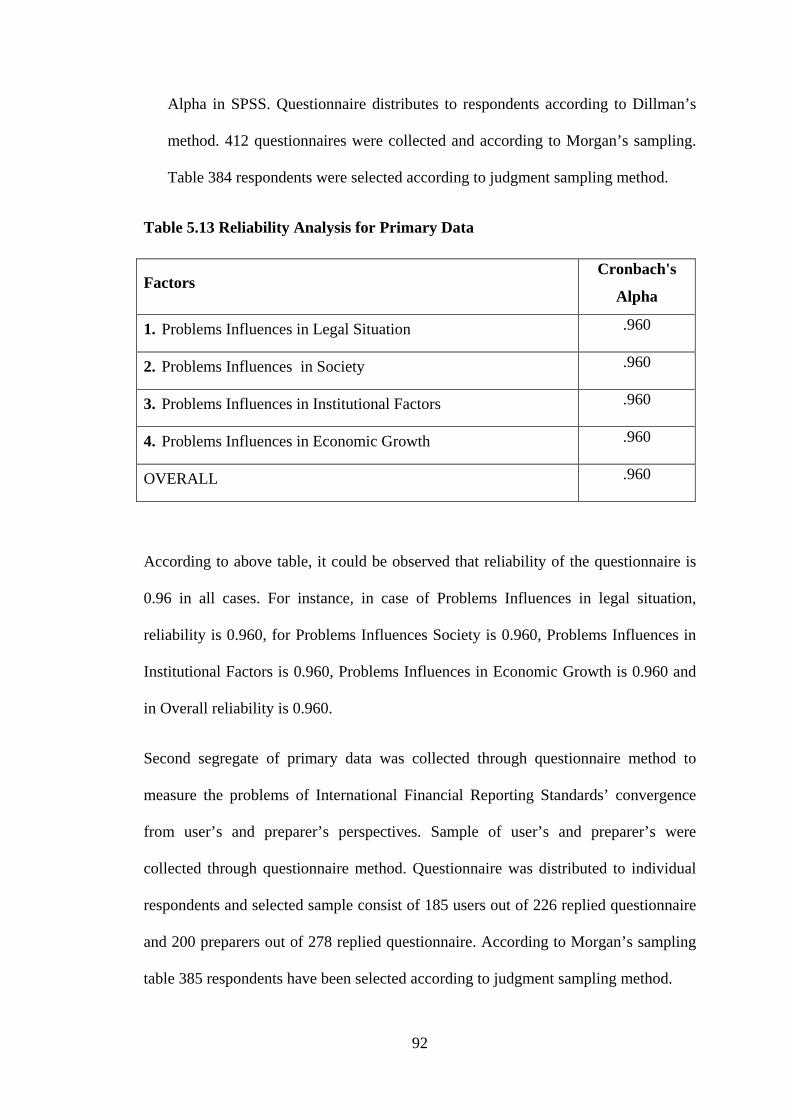
Table 5.13 Reliability Analysis for Primary Data
Factors Cronbach's
Alpha
1. Problems Influences in Legal Situation .960
2. Problems Influences in Society .960
3. Problems Influences in Institutional Factors .960
4. Problems Influences in Economic Growth .960
OVERALL .960
According to above table, it could be observed that reliability of the questionnaire is
0.96 in all cases. For instance, in case of Problems Influences in legal situation,
reliability is 0.960, for Problems Influences Society is 0.960, Problems Influences in
Institutional Factors is 0.960, Problems Influences in Economic Growth is 0.960 and
in Overall reliability is 0.960.
Second segregate of primary data was collected through questionnaire method to
measure the problems of International Financial Reporting Standards’ convergence
from user’s and preparer’s perspectives. Sample of user’s and preparer’s were
collected through questionnaire method. Questionnaire was distributed to individual
respondents and selected sample consist of 185 users out of 226 replied questionnaire
and 200 preparers out of 278 replied questionnaire. According to Morgan’s sampling
table 385 respondents have been selected according to judgment sampling method.
92

Table 5.14 Reliability Analysis for Preparers.
Factors Cronbach's
Alpha
1.Disclosure of Accounting Policies .992
2.Valuation of Inventories .992
3.Cash Flow Statements .992
4. Contingencies and Events Occurring after the Balance Sheet Date .992
5.Segment Reporting .992
6.Accounting for Fixed Assets .993
7.Leases .992
8.Employee Benefits .992
9.Related Party Disclosures .992
10.Consolidated Financial Statements .993
11.Financial Reporting of Interests in Joint Ventures .992
12.Earnings Per Share .992
13.Interim Financial Reporting .993
14. Provisions, Contingent Liabilities and Contingent Assets .992
15.Intangible Assets .992
16.Accounting for Investments .993
17.Accounting for Amalgamations .993
Overall .992
According to above table it could be observed that reliability of the questionnaire is
more than 0.992 in all cases of problems of convergence with International Financial
Reporting Standards in India from preparer’s Perspective.
93

Table 5.15 Reliability Analysis for Users.
Factors Cronbach's
Alpha
1. Issues contribute to Relevance in India over the
Convergence with IFRS. .976
2. Issues contribute to Availability in India over the
Convergence with IFRS. .975
3. Issues contribute to Understand ability in India over the
Convergence with IFRS. .971
4. Issues contribute to Comparability in India over the
Convergence with IFRS. .974
Overall .974
According to above table it could be observed that reliability of the questionnaire is
more than 0.971 in all cases. For instance, in case of Issues contribute to relevance in
India over the convergence with IFRS reliability is 0.975, Issues contribute to
availability in India over the convergence with IFRS reliability is 0.975, Issues
contribute to understandability in India over the convergence with IFRS reliability is
0.971, Issues contribute to comparability in India over the convergence with IFRS
reliability is 0.974 and in overall reliability is 0.974.
Summary
This chapter addressed the research methodology that was employed for the present
research study. The methodology covered the detailed description of the sample of
IASB member countries. It consists of converging countries, adopting countries and
non- adopting countries as well as description of the sample of individual respondent
for IFRS convergence in India. It also describes the research instruments used in this
study, data collection process and analysis methods were discussed.
94
References:
1. Kothari, C. (2004). Research methodology: methods and techniques:
New Age International.
2. Raj, D. (1972). The Design Of Sample Surveys: McGraw-Hill Book
Company.
3. Webster, R. (1985). Quantitative spatial analysis of soil in the field
Advances in soil science (pp. 1-70): Springer.
95